monthly financial report template
TRANSCRIPT

SHIRE OF JERRAMUNGUP
MONTHLY FINANCIAL REPORT(Containing the Statement of Financial Activity)
For the period ending 31 May 2021
LOCAL GOVERNMENT ACT 1995
LOCAL GOVERNMENT (FINANCIAL MANAGEMENT) REGULATIONS 1996
TABLE OF CONTENTS
Statement of Financial Activity by Program 3
Statement of Financial Activity by Nature or Type 5
Basis of Preparation 6
Note 1 Statement of Financial Activity Information 7
Note 2 Cash and Financial Assets 8
Note 3 Receivables 9
Note 4 Other Current Assets 10
Note 5 Payables 11
Note 6 Rate Revenue 12
Note 7 Disposal of Assets 13
Note 8 Capital Acquisitions 14
Note 9 Borrowings 16
Note 10 Lease Liabilities 17
Note 11 Cash Reserves 18
Note 12 Other Current Liabilities 19
Note 13 Operating grants and contributions 20
Note 14 Non operating grants and contributions 22
Note 15 Budget Amendments 23
Note 16 Explanation of Material Variances 24
KEY TERMS AND DESCRIPTIONS
For the period ending 31 May 2021 STATUTORY REPORTING PROGRAMS
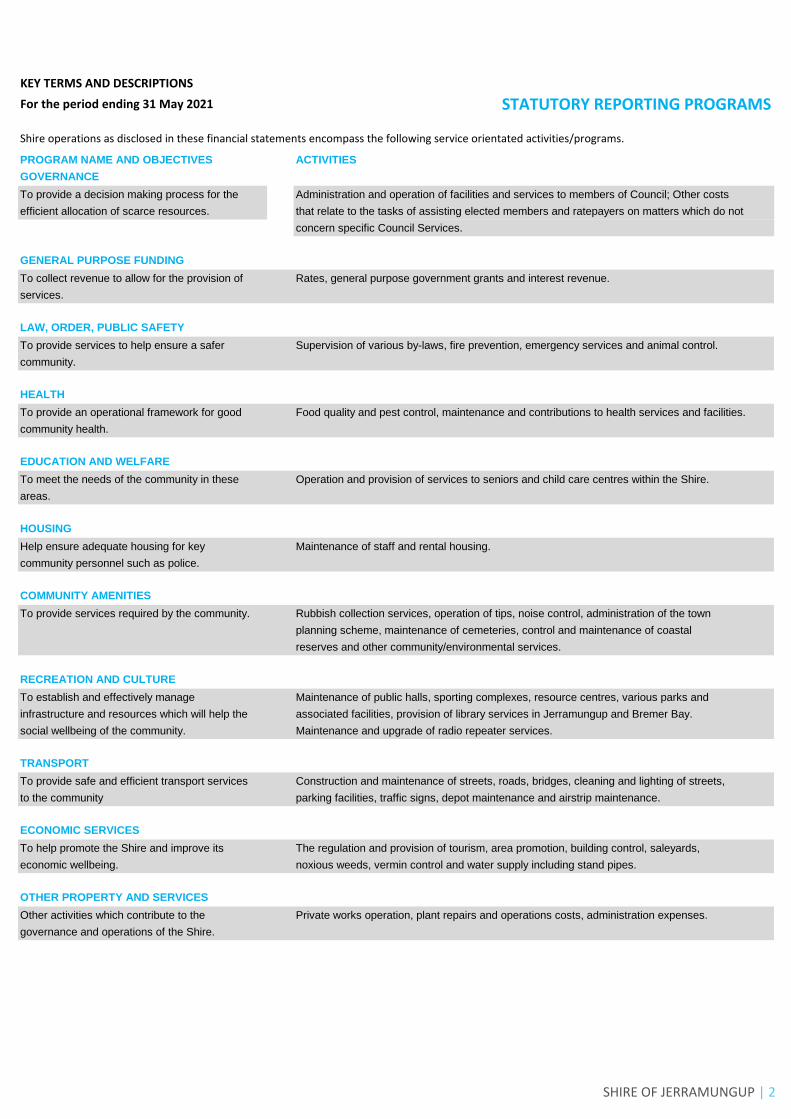
PROGRAM NAME AND OBJECTIVES ACTIVITIES
GOVERNANCE
To provide a decision making process for the Administration and operation of facilities and services to members of Council; Other costs
efficient allocation of scarce resources. that relate to the tasks of assisting elected members and ratepayers on matters which do not
concern specific Council Services.
GENERAL PURPOSE FUNDING
To collect revenue to allow for the provision of Rates, general purpose government grants and interest revenue.
services.
LAW, ORDER, PUBLIC SAFETY
To provide services to help ensure a safer Supervision of various by-laws, fire prevention, emergency services and animal control.
community.
HEALTH
To provide an operational framework for good Food quality and pest control, maintenance and contributions to health services and facilities.
community health.
EDUCATION AND WELFARE
To meet the needs of the community in these Operation and provision of services to seniors and child care centres within the Shire.
areas.
HOUSING
Help ensure adequate housing for key Maintenance of staff and rental housing.
community personnel such as police.
COMMUNITY AMENITIES
To provide services required by the community. Rubbish collection services, operation of tips, noise control, administration of the town
planning scheme, maintenance of cemeteries, control and maintenance of coastal
reserves and other community/environmental services.
RECREATION AND CULTURE
To establish and effectively manage Maintenance of public halls, sporting complexes, resource centres, various parks and
infrastructure and resources which will help the associated facilities, provision of library services in Jerramungup and Bremer Bay.
social wellbeing of the community. Maintenance and upgrade of radio repeater services.
TRANSPORT
To provide safe and efficient transport services Construction and maintenance of streets, roads, bridges, cleaning and lighting of streets,
to the community parking facilities, traffic signs, depot maintenance and airstrip maintenance.
ECONOMIC SERVICES
To help promote the Shire and improve its The regulation and provision of tourism, area promotion, building control, saleyards,
economic wellbeing. noxious weeds, vermin control and water supply including stand pipes.
OTHER PROPERTY AND SERVICES
Other activities which contribute to the Private works operation, plant repairs and operations costs, administration expenses.
governance and operations of the Shire.
Shire operations as disclosed in these financial statements encompass the following service orientated activities/programs.
SHIRE OF JERRAMUNGUP | 2

STATEMENT OF FINANCIAL ACTIVITY
FOR THE PERIOD ENDED 31 MAY 2021 STATUTORY REPORTING PROGRAMS
Ref
Var. $
(b)-(a)
Var. %
(b)-(a)/(a) Var.
Note
$ $ $ $ %
Opening funding surplus / (deficit) 1(c) 1,485,686 1,485,686 1,409,657 (76,029) (5.12%)
Revenue from operating activitiesGovernance 0 0 21,000 21,000 0.00% p
General purpose funding - general rates 6 3,405,452 3,405,602 3,415,559 9,957 0.29%
General purpose funding - other 684,992 680,961 688,064 7,103 1.04%
Law, order and public safety 318,112 299,890 237,952 (61,938) (20.65%) q
Health 17,548 16,906 16,262 (644) (3.81%)
Education and welfare 0 0 366 366 0.00%
Housing 88,885 81,356 86,332 4,976 6.12%
Community amenities 542,803 540,918 580,173 39,255 7.26%
Recreation and culture 76,849 65,333 52,577 (12,756) (19.52%) q
Transport 172,474 172,213 178,309 6,096 3.54%
Economic services 66,139 60,577 36,177 (24,400) (40.28%) q
Other property and services 91,879 85,238 118,514 33,276 39.04% p
5,465,133 5,408,994 5,431,285 22,291
Expenditure from operating activities
Governance (305,948) (293,755) (277,263) 16,492 5.61%
General purpose funding (247,859) (230,313) (204,322) 25,991 11.29% p
Law, order and public safety (881,905) (825,648) (516,453) 309,195 37.45% p
Health (280,059) (256,646) (267,650) (11,004) (4.29%)
Education and welfare (86,241) (79,855) (72,911) 6,944 8.70%
Housing (68,352) (67,136) (95,106) (27,970) (41.66%) q
Community amenities (1,327,318) (1,216,076) (1,021,964) 194,112 15.96% p
Recreation and culture (890,963) (829,198) (878,543) (49,345) (5.95%)
Transport (2,404,913) (2,208,462) (2,063,561) 144,901 6.56%
Economic services (198,892) (184,140) (242,018) (57,878) (31.43%) q
Other property and services (32,604) (24,341) (65,232) (40,891) (167.99%) q
(6,725,054) (6,215,570) (5,705,023) 510,547
Non-cash amounts excluded from operating activities 1(a) 2,118,769 1,943,316 1,998,721 55,405 2.85%
Amount attributable to operating activities 858,848 1,136,740 1,724,983 588,243
Investing ActivitiesProceeds from non-operating grants, subsidies and
contributions 14 6,191,375 1,627,415 1,527,872 (99,543) (6.12%)
Proceeds from disposal of assets 7 222,000 215,000 209,545 (5,455) (2.54%)
Payments for property, plant and equipment and
infrastructure 8 (9,120,598) (8,351,990) (4,428,069) 3,923,921 46.98% p
Amount attributable to investing activities (2,707,223) (6,509,575) (2,690,651) 3,818,924
Financing Activities
Transfer from reserves 11 805,000 805,000 280,000 (525,000) (65.22%) q
Payments for principal portion of lease liabilities 10 (14,485) (13,335) (13,335) 0 0.00%
Repayment of debentures 9 (196,749) (184,127) (184,127) 0 0.00%
Transfer to reserves 11 (233,819) (223,856) (229,152) (5,296) (2.37%)
Amount attributable to financing activities 359,947 383,683 (146,613) (530,296)
Closing funding surplus / (deficit) 1(c) (2,742) (3,503,466) 297,375
KEY INFORMATION
The material variance adopted by Council for the 2020-21 year is $10,000 or 10.00% whichever is the greater.
This statement is to be read in conjunction with the accompanying Financial Statements and notes.
threshold. Refer to Note 16 for an explanation of the reasons for the variance.
Amended
Budget
YTD
Budget
(a)
YTD
Actual
(b)
pq Indicates a variance between Year to Date (YTD) Actual and YTD Actual data as per the adopted materiality threshold. Refer to
Note 2 for an explanation of the reasons for the variance.
SHIRE OF JERRAMUNGUP | 3

KEY TERMS AND DESCRIPTIONS
FOR THE PERIOD ENDED 31 MAY 2021 NATURE OR TYPE DESCRIPTIONS
REVENUE EXPENSES
RATES EMPLOYEE COSTS
All rates levied under the Local Government Act 1995. Includes All costs associate with the employment of person such as
general, differential, specified area rates, minimum rates, salaries, wages, allowances, benefits such as vehicle and housing,
interim rates, back rates, ex-gratia rates, less discounts and superannuation, employment expenses, removal expenses,
concessions offered. Exclude administration fees, interest on relocation expenses, worker's compensation insurance, training
instalments, interest on arrears, service charges and costs, conferences, safety expenses, medical examinations,
sewerage rates. fringe benefit tax, etc.
OPERATING GRANTS, SUBSIDIES AND CONTRIBUTIONS MATERIALS AND CONTRACTS
Refers to all amounts received as grants, subsidies and All expenditures on materials, supplies and contracts not
contributions that are not non-operating grants. classified under other headings. These include supply of goods
and materials, legal expenses, consultancy, maintenance
NON-OPERATING GRANTS, SUBSIDIES AND CONTRIBUTIONS agreements, communication expenses, advertising expenses,
Amounts received specifically for the acquisition, construction membership, periodicals, publications, hire expenses, rental,
of new or the upgrading of identifiable non financial assets paid to a leases, postage and freight etc. Local governments may wish to
local government, irrespective of whether these amounts are disclose more detail such as contract services, consultancy,
received as capital grants, subsidies, contributions or donations. information technology, rental or lease expenditures.
REVENUE FROM CONTRACTS WITH CUSTOMERS UTILITIES (GAS, ELECTRICITY, WATER, ETC.)
Revenue from contracts with customers is recognised when the Expenditures made to the respective agencies for the provision
local government satisfies its performance obligations under the of power, gas or water. Exclude expenditures incurred for the
contract. reinstatement of roadwork on behalf of these agencies.
FEES AND CHARGES INSURANCE
Revenues (other than service charges) from the use of facilities All insurance other than worker's compensation and health
and charges made for local government services, sewerage benefit insurance included as a cost of employment.
rates, rentals, hire charges, fee for service, photocopying
charges, licences, sale of goods or information, fines, penalties LOSS ON ASSET DISPOSAL
and administration fees. Local governments may wish to disclose Shortfall between the value of assets received over the net book
more detail such as rubbish collection fees, rental of property, value for assets on their disposal.
fines and penalties, other fees and charges.
DEPRECIATION ON NON-CURRENT ASSETS
SERVICE CHARGES Depreciation expense raised on all classes of assets.
Service charges imposed under Division 6 of Part 6 of the Local
Government Act 1995. Regulation 54 of the Local Government INTEREST EXPENSES
(Financial Management) Regulations 1996 identifies these as Interest and other costs of finance paid, including costs of
television and radio broadcasting, underground electricity and finance for loan debentures, overdraft accommodation and
neighbourhood surveillance services. Exclude rubbish removal refinancing expenses.
charges. Interest and other items of a similar nature received
from bank and investment accounts, interest on rate instalments, OTHER EXPENDITURE
interest on rate arrears and interest on debtors. Statutory fees, taxes, allowance for impairment of assets, member's
fees or State taxes. Donations and subsidies made to community
INTEREST EARNINGS groups.
Interest and other items of a similar nature received from bank
and investment accounts, interest on rate instalments, interest
on rate arrears and interest on debtors.
OTHER REVENUE / INCOME
Other revenue, which can not be classified under the above
headings, includes dividends, discounts, rebates etc.
PROFIT ON ASSET DISPOSAL
Excess of assets received over the net book value for assets on their
disposal.
SHIRE OF JERRAMUNGUP | 4

STATEMENT OF FINANCIAL ACTIVITY
FOR THE PERIOD ENDED 31 MAY 2021 BY NATURE OR TYPE
RefVar. $
(b)-(a)
Var. %
(b)-(a)/(a) Var.
Note
$ $ $ $ %
Opening funding surplus / (deficit) 1(c) 1,485,686 1,485,686 1,409,657 (76,029) (5.12%)
Revenue from operating activities
Rates 6 3,405,452 3,405,602 3,415,559 9,957 0.29%
Operating grants, subsidies andcontributions 13 1,160,821 1,142,888 1,104,857 (38,031) (3.33%)
Fees and charges 721,420 694,786 735,766 40,980 5.90%
Interest earnings 55,375 52,580 32,695 (19,885) (37.82%) q
Other revenue 114,465 105,538 123,893 18,355 17.39% p
Profit on disposal of assets 7 7,600 7,600 18,515 10,915 143.62% p
5,465,133 5,408,994 5,431,285 22,291
Expenditure from operating activities
Employee costs (2,058,976) (1,886,258) (1,731,184) 155,074 8.22%
Materials and contracts (1,889,473) (1,777,247) (1,426,990) 350,257 19.71% p
Utility charges (198,404) (182,089) (164,530) 17,559 9.64%
Depreciation on non-current assets (2,088,419) (1,913,362) (1,972,935) (59,573) (3.11%)
Interest expenses (29,979) (31,912) (21,746) 10,166 31.86% p
Insurance expenses (280,561) (268,870) (240,255) 28,615 10.64% p
Other expenditure (141,688) (118,278) (126,947) (8,669) (7.33%)
Loss on disposal of assets 7 (37,554) (37,554) (20,436) 17,118 45.58% p
(6,725,054) (6,215,570) (5,705,023) 510,547
Non-cash amounts excluded from operating activities1(a) 2,118,769 1,943,316 1,998,721 55,405 2.85%
Amount attributable to operating activities 858,848 1,136,740 1,724,983 588,243
Investing activitiesProceeds from non-operating grants, subsidies and
contributions 14 6,191,375 1,627,415 1,527,872 (99,543) (6.12%)
Proceeds from disposal of assets 7 222,000 215,000 209,545 (5,455) (2.54%)
Payments for property, plant and equipment and
infrastructure 8 (9,120,598) (8,351,990) (4,428,069) 3,923,921 46.98% p
Amount attributable to investing activities (2,707,223) (6,509,575) (2,690,651) 3,818,924
Financing Activities
Transfer from reserves 11 805,000 805,000 280,000 (525,000) (65.22%) q
Payments for principal portion of lease liabilities (14,485) (13,335) (13,335) 0 0.00%
Repayment of debentures 9 (196,749) (184,127) (184,127) 0 0.00%
Transfer to reserves 11 (233,819) (223,856) (229,152) (5,296) (2.37%)
Amount attributable to financing activities 359,947 383,683 (146,613) (530,296)
Closing funding surplus / (deficit) 1(c) (2,742) (3,503,466) 297,375 3,800,842
KEY INFORMATION
pq Indicates a variance between Year to Date (YTD) Actual and YTD Actual data as per the adopted materiality threshold.
Refer to Note 16 for an explanation of the reasons for the variance.
This statement is to be read in conjunction with the accompanying Financial Statements and Notes.
Amended
Budget
YTD
Budget
(a)
YTD
Actual
(b)
SHIRE OF JERRAMUNGUP | 5
MONTHLY FINANCIAL REPORT
FOR THE PERIOD ENDED 31 MAY 2021 BASIS OF PREPARATION
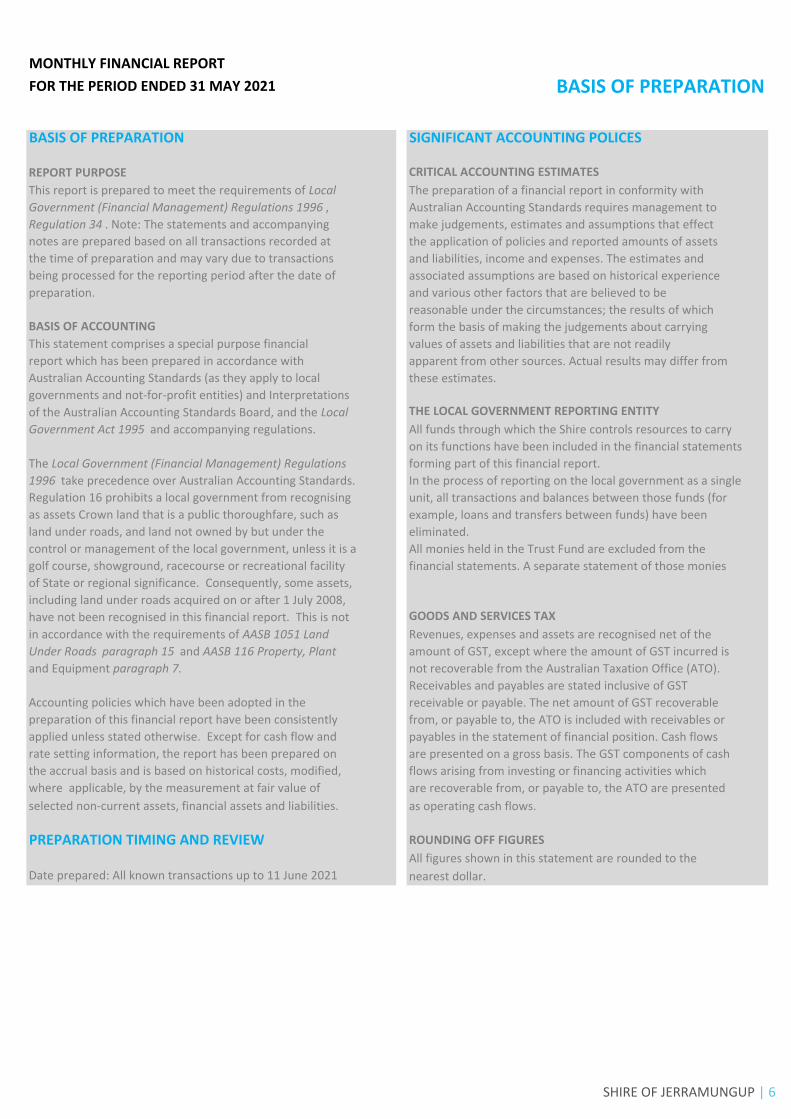
BASIS OF PREPARATION SIGNIFICANT ACCOUNTING POLICES
REPORT PURPOSE CRITICAL ACCOUNTING ESTIMATES
This report is prepared to meet the requirements of Local The preparation of a financial report in conformity with
Government (Financial Management) Regulations 1996 , Australian Accounting Standards requires management to
Regulation 34 . Note: The statements and accompanying make judgements, estimates and assumptions that effect
notes are prepared based on all transactions recorded at the application of policies and reported amounts of assets
the time of preparation and may vary due to transactions and liabilities, income and expenses. The estimates and
being processed for the reporting period after the date of associated assumptions are based on historical experience
preparation. and various other factors that are believed to be
reasonable under the circumstances; the results of which
BASIS OF ACCOUNTING form the basis of making the judgements about carrying
This statement comprises a special purpose financial values of assets and liabilities that are not readily
report which has been prepared in accordance with apparent from other sources. Actual results may differ from
Australian Accounting Standards (as they apply to local these estimates.
governments and not-for-profit entities) and Interpretations
of the Australian Accounting Standards Board, and the Local THE LOCAL GOVERNMENT REPORTING ENTITY
Government Act 1995 and accompanying regulations. All funds through which the Shire controls resources to carry
on its functions have been included in the financial statements
The Local Government (Financial Management) Regulations forming part of this financial report.
1996 take precedence over Australian Accounting Standards. In the process of reporting on the local government as a single
Regulation 16 prohibits a local government from recognising unit, all transactions and balances between those funds (for
as assets Crown land that is a public thoroughfare, such as example, loans and transfers between funds) have been
land under roads, and land not owned by but under the eliminated.
control or management of the local government, unless it is a All monies held in the Trust Fund are excluded from the
golf course, showground, racecourse or recreational facility financial statements. A separate statement of those monies
of State or regional significance. Consequently, some assets,
including land under roads acquired on or after 1 July 2008,
have not been recognised in this financial report. This is not GOODS AND SERVICES TAX
in accordance with the requirements of AASB 1051 Land Revenues, expenses and assets are recognised net of the
Under Roads paragraph 15 and AASB 116 Property, Plant amount of GST, except where the amount of GST incurred is
and Equipment paragraph 7. not recoverable from the Australian Taxation Office (ATO).
Receivables and payables are stated inclusive of GST
Accounting policies which have been adopted in the receivable or payable. The net amount of GST recoverable
preparation of this financial report have been consistently from, or payable to, the ATO is included with receivables or
applied unless stated otherwise. Except for cash flow and payables in the statement of financial position. Cash flows
rate setting information, the report has been prepared on are presented on a gross basis. The GST components of cash
the accrual basis and is based on historical costs, modified, flows arising from investing or financing activities which
where applicable, by the measurement at fair value of are recoverable from, or payable to, the ATO are presented
selected non-current assets, financial assets and liabilities. as operating cash flows.
PREPARATION TIMING AND REVIEW ROUNDING OFF FIGURES
All figures shown in this statement are rounded to the
Date prepared: All known transactions up to 11 June 2021 nearest dollar.
SHIRE OF JERRAMUNGUP | 6

NOTES TO THE STATEMENT OF FINANCIAL ACTIVITY
FOR THE PERIOD ENDED 31 MAY 2021 NOTE 1
STATEMENT OF FINANCIAL ACTIVITY INFORMATION
(a) Non-cash items excluded from operating activities
The following non-cash revenue and expenditure has been excluded from operating activities
within the Statement of Financial Activity in accordance with Financial Management Regulation 32.
Notes Amended Budget
YTD
Budget
(a)
YTD
Actual
(b)
Non-cash items excluded from operating activities
$ $ $
Adjustments to operating activities
Less: Profit on asset disposals 7 (7,600) (7,600) (18,515)
Less: Movement in employee liabilities associated with restricted cash 396 0 108
Movement in liabilities 0 0 23,882
Add: Loss on asset disposals 7 37,554 37,554 20,436
Add: Depreciation on assets 2,088,419 1,913,362 1,972,810
Total non-cash items excluded from operating activities 2,118,769 1,943,316 1,998,721
(b) Adjustments to net current assets in the Statement of Financial Activity
The following current assets and liabilities have been excluded Last This Time Year
from the net current assets used in the Statement of Financial Year Last to
Activity in accordance with Financial Management Regulation Closing Year Date
32 to agree to the surplus/(deficit) after imposition of general rates. 30 June 2020 31 May 2020 31 May 2021
Adjustments to net current assets
Less: Reserves - restricted cash 11 (2,219,259) (1,743,274) (2,168,411)
Add: Borrowings 9 196,748 178,127 12,621
Add: Provisions - employee 12 65,953 65,728 76,062
Add: Lease liabilities 10 14,485 143 1,150
Total adjustments to net current assets (1,942,073) (1,499,276) (2,078,578)
(c) Net current assets used in the Statement of Financial Activity
Current assets
Cash and cash equivalents 2 4,672,540 5,252,408 4,050,139
Rates receivables 3 85,749 103,407 100,826
Receivables 3 982,728 520,753 1,345,519
Other current assets 4 30,458 33,073 37,590
Less: Current liabilities
Payables 5 (236,438) (307,519) (286,994)
Borrowings 9 (196,748) (178,127) (12,621)
Contract liabilities 12 (1,617,297) (2,278,629) (2,526,576)
Lease liabilities 10 (14,485) (143) (1,150)
Provisions 12 (354,777) (304,577) (330,781)
Less: Total adjustments to net current assets 1(b) (1,942,073) (1,499,276) (2,078,578)
Closing funding surplus / (deficit) 1,409,657 1,341,369 297,375
CURRENT AND NON-CURRENT CLASSIFICATION
In the determination of whether an asset or liability is current or non-current, consideration is given to the time when each asset or liability is
expected to be settled. Unless otherwise stated assets or liabilities are classified as current if expected to be settled within the next 12 months,
being the Council's operational cycle.
SHIRE OF JERRAMUNGUP | 7

NOTES TO THE STATEMENT OF FINANCIAL ACTIVITY OPERATING ACTIVITIESFOR THE PERIOD ENDED 31 MAY 2021 NOTE 2
CASH AND FINANCIAL ASSETS
Total Interest Maturity
Description Classification Unrestricted Restricted Cash Trust Institution Rate Date
$ $ $ $
Cash on hand
Municipal bank account Cash and cash equivalents 460,263 0 460,263 Bankwest 0.10%
Pool Grant funds - Telenet account Cash and cash equivalents 0 919,499 919,499 Bankwest 0.05%
Reserves bank account - telenet ac Cash and cash equivalents 2,168,410 2,168,410 Bankwest 0.05%
Waste grant funds - WA treasury Cash and cash equivalents 0 197,849 197,849 WA Treasury 0.05%
Waste grant funds - Telenet account Cash and cash equivalents 0 303,918 303,918 Bankwest 0.05%
Till/Petty cash Cash and cash equivalents 200 0 200 Bankwest
BPAY holding account Cash and cash equivalents 0 1 Bankwest
Total 460,463 3,589,676 4,050,139 0
Comprising
Cash and cash equivalents 460,463 3,589,676 4,050,139 0
460,463 3,589,676 4,050,139 0KEY INFORMATION
Cash and cash equivalents include cash on hand, cash at bank, deposits available on demand with banks and other short term highly liquid investments highly liquid investments
with original maturities of three months or less that are readily convertible to known amounts of cash and which are subject to an insignificant risk of changes in value and bank
overdrafts. Bank overdrafts are reported as short term borrowings in current liabilities in the statement of net current assets.
The local government classifies financial assets at amortised cost if both of the following criteria are met:
- the asset is held within a business model whose objective is to collect the contractual cashflows, and
- the contractual terms give rise to cash flows that are solely payments of principal and interest.
Financial assets at amortised cost held with registered financial institutions are listed in this note other financial assets at amortised cost are provided in Note 4 - Other assets.
Unrestricted , 460,463
Restricted, 3,589,676
Trust, 0
SHIRE OF JERRAMUNGUP | 8

NOTES TO THE STATEMENT OF FINANCIAL ACTIVITY OPERATING ACTIVITIESFOR THE PERIOD ENDED 31 MAY 2021 NOTE 3
RECEIVABLES
Rates receivable 30 June 2020 31 May 2021 Receivables - general Credit Current 30 Days 60 Days 90+ Days Total
$ $ $ $ $ $ $ $
Opening arrears previous years 85,749 55,323 Receivables - general (14,952) 790,803 1,624 5,197 545,559 1,328,231
Levied this year 3,911,451 Percentage (1.1%) 59.5% 0.1% 0.4% 41.1%
Less - collections to date (30,426) (3,865,948) Balance per trial balance
Equals current outstanding 55,323 100,826 Sundry receivable 1,328,231
GST receivable 17,288
Net rates collectable 55,323 100,826 Total receivables general outstanding 1,345,519
% Collected 35.5% 97.5% Amounts shown above include GST (where applicable)
KEY INFORMATION
Trade and other receivables include amounts due from ratepayers for unpaid rates and service charges and other amounts due from third parties for goods sold and services performed in the ordinary course of
business. Receivables expected to be collected within 12 months of the end of the reporting period are classified as current assets. All other receivables are classified as non-current assets. Collectability of trade
and other receivables is reviewed on an ongoing basis. Debts that are known to be uncollectible are written off when identified. An allowance for impairment of receivables is raised when there is objective evidence that
they will not be collectible.
0
1,000,000
2,000,000
3,000,000
4,000,000
5,000,000
Jul Aug Sep Oct Nov Dec Jan Feb Mar Apr May Jun
Am
ou
nt
$('
00
0s)
Rates Receivable
2019-20
2020-21
SHIRE OF JERRAMUNGUP | 9

NOTES TO THE STATEMENT OF FINANCIAL ACTIVITY OPERATING ACTIVITIESFOR THE PERIOD ENDED 31 MAY 2021 NOTE 4
OTHER CURRENT ASSETS
Opening Asset Asset Closing
Balance Increase Reduction Balance
Other current assets 1 July 2020 31 May 2021
$ $ $ $
Inventory
Fuel and Materials 30,457 1,086 31,543
Prepayments
Prepayments 0 6,047 0 6,047
Total other current assets 30,457 7,133 0 37,590
Inventory
Inventories are measured at the lower of cost and net realisable value.
Net realisable value is the estimated selling price in the ordinary course of business less the estimated costs of
completion and the estimated costs necessary to make the sale.
KEY INFORMATION
SHIRE OF JERRAMUNGUP | 10

NOTES TO THE STATEMENT OF FINANCIAL ACTIVITY OPERATING ACTIVITIESFOR THE PERIOD ENDED 31 MAY 2021 NOTE 5
Payables
Payables - general Credit Current 30 Days 60 Days 90+ Days Total
$ $ $ $ $ $
Payables - general 0 97,691 2,373 0 2,200 102,264
Percentage 0% 95.5% 2.3% 0% 2.2%
Balance per trial balance
Sundry creditors (102,264)
ATO liabilities (110,609)
Prepaid rates (17,589)
Bonds (20,248)
Levies collected on behalf of others 1,033
Retention funds owing (37,317)
Total payables general outstanding (286,994)
Amounts shown above include GST (where applicable)
Trade and other payables represent liabilities for goods and services provided to the Shire that are unpaid and arise when the Shire
becomes obliged to make future payments in respect of the purchase of these goods and services. The amounts are unsecured, are
recognised as a current liability and are normally paid within 30 days of recognition.
KEY INFORMATION
SHIRE OF JERRAMUNGUP | 11

NOTES TO THE STATEMENT OF FINANCIAL ACTIVITY OPERATING ACTIVITIESFOR THE PERIOD ENDED 31 MAY 2021 NOTE 6
RATE REVENUE
General rate revenue
Rate in Number of Rateable Rate Interim Back Total Rate Interim Back Total
$ (cents) Properties Value Revenue Rate Rate Revenue Revenue Rates Rates Revenue
RATE TYPE $ $ $ $ $ $ $ $
Gross rental value
GRV Properites 0.09889 545 6,787,896 671,961 0 0 671,961 673,225 796 65 674,086
Unimproved value
UV Properties 0.00975 329 251,213,004 2,449,326 0 0 2,449,326 2,449,326 460 4,312 2,454,098
Sub-Total 874 258,000,900 3,121,287 0 0 3,121,287 3,122,551 1,256 4,377 3,128,184
Minimum payment Minimum $
Gross rental value
GRV Properites 685 306 1,247,956 209,610 0 0 209,610 209,610 1,745 0 211,355
Unimproved value
UV Properties 685 33 939,957 22,605 0 0 22,605 22,605 1,315 0 23,920
Sub-total 339 2,187,913 232,215 0 0 232,215 232,215 3,060 0 235,275
Rates written off (150)
Amount from general rates 3,353,352 3,363,459
Ex-gratia rates 52,100 52,100
Total general rates 3,405,452 3,415,559
KEY INFORMATION
Prepaid rates are, until the taxable event for the rates has occurred, refundable at the request of the ratepayer. Rates received in advance give rise to a financial liability. On 1 July 2020
the prepaid rates were recognised as a financial asset and a related amount was recognised as a financial liability and no income was recognised. When the taxable event occurs
the financial liability is extinguished and income recognised for the prepaid rates that have not been refunded.
Budget YTD Actual
SHIRE OF JERRAMUNGUP | 12

NOTES TO THE STATEMENT OF FINANCIAL ACTIVITY OPERATING ACTIVITIESFOR THE PERIOD ENDED 31 MAY 2021 NOTE 7
DISPOSAL OF ASSETS
Asset Ref. Asset description
Net Book
Value Proceeds Profit (Loss)
Net Book
Value Proceeds Profit (Loss)
$ $ $ $ $ $ $ $
Plant and equipment
Transport
A910 Works Managager vehicle 43,065 40,000 0 (3,065) 41,647 39,545 0 (2,102)
A831 Town Services vehicle 16,600 3,500 0 (13,100) 0 0 0 0
A814 Mitsibishi Triton 12,140 3,500 0 (8,640) 0 0 0 0
A816 Prime Mover 96,000 87,000 0 (9,000) 93,863 79,091 0 (14,772)
Other property and services
A913 CEO Prado 51,749 48,000 0 (3,749) 50,835 47,273 0 (3,562)
A898 DCEO Prado 32,400 40,000 7,600 0 25,121 43,636 18,515 0
251,954 222,000 7,600 (37,554) 211,466 209,545 18,515 (20,436)
Budget YTD Actual
SHIRE OF JERRAMUNGUP | 13

NOTES TO THE STATEMENT OF FINANCIAL ACTIVITY INVESTING ACTIVITIESFOR THE PERIOD ENDED 31 MAY 2021 NOTE 8
CAPITAL ACQUISITIONS
Capital acquisitions Budget YTD Budget YTD Actual
YTD Actual
Variance
$ $ $ $
Buildings 1,042,007 972,005 1,216,163 (244,158)
Furniture and equipment 32,175 32,175 30,995 1,180
Plant and equipment 665,269 665,269 632,625 32,644
Infrastructure - Roads 2,996,673 2,999,467 2,068,211 931,256
Infrastructure - Other 4,384,474 3,683,074 480,075 3,202,999
Payments for Capital Acquisitions 9,120,598 8,351,990 4,428,069 3,923,921
Total Capital Acquisitions 9,120,598 8,351,990 4,428,069 3,923,921
Capital Acquisitions Funded By:
$ $ $ $
Capital grants and contributions 6,191,375 1,627,415 1,527,872 99,543
Other (disposals & C/Fwd) 222,000 215,000 209,545 (5,455)
Cash backed reserves
Reserves cash backed - Leave Reserve 10,000 0 0 0
Reserves cash backed - Plant replacement 10,000 0 0 0
Reserves cash backed - Community Recreation 270,000 0 200,000 (200,000)
Reserves cash backed - General Building 420,000 0 0 0
Reserves cash backed - Bremer Bay Retirement Units 80,000 0 80,000 (80,000)
Reserves cash backed - Effluent 10,000 0 0 0
Reserves cash backed - Bremer Bay Boat Ramp 5,000 0 0 0
Contribution - operations 1,902,223 6,509,575 2,410,651 4,098,924
Capital funding total 9,120,598 8,351,990 4,428,069 3,913,012
SIGNIFICANT ACCOUNTING POLICIES
All assets are initially recognised at cost. Cost is determined as the
fair value of the assets given as consideration plus costs incidental to
the acquisition. For assets acquired at no cost or for nominal
consideration, cost is determined as fair value at the date of
acquisition. The cost of non-current assets constructed by the local
government includes the cost of all materials used in the construction,
direct labour on the project and an appropriate proportion of variable
and fixed overhead. Certain asset classes may be revalued on a regular
basis such that the carrying values are not materially different from
fair value. Assets carried at fair value are to be revalued with
sufficient regularity to ensure the carrying amount does not differ
materially from that determined using fair value at reporting date.
Amended
SHIRE OF JERRAMUNGUP | 14

INVESTING ACTIVITIESNOTE 8
CAPITAL ACQUISITIONS (CONTINUED)
Account Description Budget
YTD
Budget
YTD
Actual
Variance
(Under)/Over
Buildings
A38 Gairdner Hall 58,500 58,500 58,500 0
A479 37 Derrick Street 14,500 14,500 0 (14,500)
A49 Needilup Pavillion 58,500 58,500 58,500 0
A526 Cameron Business Centre 6,591 6,591 5,992 (599)
A727 Lions Park Toilets And Improvements 33,776 33,776 30,706 (3,070)
A897 Lot 3 Yandil Street Bb (Seniors Units) 111,196 111,196 75,180 (36,016)
A906 Unit 1 - Lot 265 Collins Street Jerramungup 167,236 167,236 107,212 (60,024)
A907 Unit 2, Lot 265 Collins Street, Jerramungup 167,236 167,236 107,293 (59,943)
A908 Lot 7 Lancaster Road, Jerramungup(3X2) House 182,236 182,235 302,904 120,668
A909 19 Mcglade Close, Bremer Bay (4X2) House 172,236 172,235 188,446 16,210
A203 Boxwood Club 70,000 0 273,410 203,410
A46 Jerramungup Entertainment Centre 0 0 8,019 8,019
Buildings Total 1,042,007 972,005 1,216,163 174,156
Plant & Equipment
A912 Works Manager Ute 2020 52,000 52,000 51,089 (911)
A919 Swipe Tag System - Bb Standpipes 32,000 32,000 22,352 (9,648)
A921 Mack Superliner Prime Mover 293,800 293,800 293,800 0
A922 2020 Dolly 29,000 29,000 31,110 2,110
A923 CEO Vehicle 63,206 63,206 64,825 1,619
A924 DCEO Vehicle 56,324 56,324 58,095 1,771
A926 Variable Message Display Board 25,000 25,000 27,423 2,423
A927 Town Services Ute 33,719 33,719 0 (33,719)
A928 Boxwood Hill Tank/Pump(Shields Property) 32,000 32,000 51,152 19,152
A929 Boxwood Hill Tank/Pump 39,220 39,220 32,780 (6,440)
A932 BB Rideon lawnmower 9,000 9,000 0 (9,000)
Plant & Equipment Total 665,269 665,269 632,625 (32,644)
Furniture & Equipment
A700 New Server Computer Network 32,175 32,175 30,995 (1,180)
Furniture & Equipment Total 32,175 32,175 30,995 (1,180)
Other Infrastructure
A203I Boxwood Community Dam 134,474 134,474 18,703 (115,771)
A390I Gairdner Dam 50,000 50,000 53,567 3,567
A930 Jerramungup Pool 4,200,000 3,498,600 365,564 (3,834,436)
A262I Jerramungup Tipsite Transfer Station 0 0 14,365 14,365
A856 Bremer Bay Civic Square Construction 0 0 19,816 19,816
A931 Fishery Beach Boat Ramp And Jetty Construction 0 0 8,060 8,060
Other Infrastructure Total 4,384,474 3,683,074 480,075 (3,904,399)
Roads
C12 Brook Road 135,460 135,460 73,933 (61,527)
C16 Cameron Road Construction 86,812 86,812 26,157 (60,655)
C190 Sydney Street 78,914 78,914 76,895 (2,019)
C30 Cowalellup Road 132,904 132,904 86,520 (46,384)
C36 Dillon Bay Road 152,833 152,833 51,129 (101,704)
C48 Jacup North Road 132,860 132,860 88,934 (43,926)
C50 Jerramungup North Road 130,114 130,114 12,219 (117,895)
C57 Little Boat Harbour Road 28,296 28,296 23,208 (5,088)
C62 Marnigarup East Road 139,953 139,953 30,019 (109,934)
C63 Meechi Road 141,831 141,831 229,841 88,010
C68 Monkey Rock Road 129,806 132,022 29,965 (99,841)
C77 Point Henry Road 169,487 169,487 160,336 (9,151)
C78 Rabbit Proof Fence Road 145,549 145,549 50,889 (94,660)
C84 Stock Road 92,834 92,834 14,812 (78,022)
C91 Wellstead Road 70,817 70,817 66,500 (4,317)
C71 Native Dog Road 0 0 15,394 15,394
RG10 Gairdner South Road - Regional Road Group 235,754 235,754 102,746 (133,008)
RG12 Borden Boxwood Road - Mrwa 90,000 90,000 92,350 2,350
RR25 Bremer Bay Road - R2R 215,782 215,782 229,180 13,398
RR26 Swamp Road - R2R 174,589 174,589 139,410 (35,179)
RR27 Frantom Way - R2R 43,630 44,208 31,742 (11,888)
RRG1 Needilup North 180,000 180,000 150,037 (29,963)
RRG7 Devils Creek Road 180,000 180,000 175,796 (4,204)
LRC85 Short Beach Road 34,720 34,720 36,971 2,251
LRC09 Black Rocks Road 23,808 23,808 22,367 (1,441)
LRC194 Wellstead South Road 17,856 17,856 18,497 641
LRC123 Point Gordon Road 960 960 714 (246)
LRC169 Gully Road 960 960 2,573 1,613
LRC45 Horse hill Road 768 768 852 84
LRC180 Osprey Court 5,376 5,376 4,669 (707)
LRC111 Chuditch Close 7,200 7,200 5,900 (1,300)
LRC126 Quoll Court 7,200 7,200 5,214 (1,986)
LRC131 Trevally Place 9,600 9,600 5,897 (3,703)
LRC105 Magpie Rise 0 0 690 690
LRC195 Newby Grove 0 0 5855 5,855
Roads Total 2,996,673 2,999,467 2,068,211 (928,462)
9,120,598 8,351,990 4,428,069 (4,692,529)
Amended
SHIRE OF JERRAMUNGUP | 15

NOTES TO THE STATEMENT OF FINANCIAL ACTIVITY FINANCING ACTIVITIES
FOR THE PERIOD ENDED 31 MAY 2021 NOTE 9
BORROWINGS
Repayments - borrowings
Interest
Information on borrowings Repayments
Particulars Loan No. 1 July 2020 Actual Budget Actual Budget Actual Budget Actual Budget
$ $ $ $ $ $ $ $ $
Housing
Staff Housing and Independent Living Units 264 500,000 0 0 46,384 46,385 453,616 453,615 4,909 8,060
Community amenities
BB Staff Housing 261 158,057 0 0 37,029 37,030 121,028 121,027 4,843 6,403
Transport
Bremer Bay Town Centre 260 171,819 0 0 54,965 54,965 116,854 116,854 4,247 6,487
Grader 262 25,100 0 0 12,479 25,100 12,621 0 272 430
Bremer Bay Town Centre 263 256,193 0 0 33,269 33,269 222,924 222,924 6,670 7,785
Total 1,111,169 0 0 184,127 196,749 927,042 914,420 20,942 29,165
Current borrowings 196,749 12,621
Non-current borrowings 914,420 914,421
1,111,169 927,042
All debenture repayments were financed by general purpose revenue.
Due to end of year accruals journals, the actual year to date interest repayments figure do not agree with the budget.
KEY INFORMATION
included as part of the carrying amount of the loans and borrowings.
Principal Principal
New Loans Repayments Outstanding
All loans and borrowings are initially recognised at the fair value of the consideration received less directly attributable transaction costs. After initial recognition, interest-bearing
loans and borrowings are subsequently measured at amortised cost using the effective interest method. Fees paid on the establishment of loan facilities that are yield related are
SHIRE OF JERRAMUNGUP | 16

NOTES TO THE STATEMENT OF FINANCIAL ACTIVITY FINANCING ACTIVITIES
FOR THE PERIOD ENDED 31 MAY 2021 NOTE 10
LEASE LIABILITIES
Movement in carrying amounts
Interest
Information on leases Repayments
Particulars Lease No. 1 July 2020 Actual Budget Actual Budget Actual Budget Actual Budget
$ $ $ $ $ $ $ $ $
Other property and services
Konica Minolta C656 45,647 0 0 13,335 14,485 32,312 31,162 (688) (813)
Total 45,647 0 0 13,335 14,485 32,312 31,162 (688) (813)
Current lease liabilities 14,485 1,150
Non-current lease liabilities 31,162 31,162
45,647 32,312
All lease repayments were financed by general purpose revenue.
KEY INFORMATION
At inception of a contract, the Shire assesses if the contract contains or is a lease. A contract is, or contains, a lease if the contract conveys the right
to control the use of an identified asset for a period of time in exchange for consideration. At the commencement date, a right of use asset is
recognised at cost and lease liability at the present value of the lease payments that are not paid at that date. The lease payments are discounted using
that date. The lease payments are discounted using the interest rate implicit in the lease, if that rate can be readily determined. If that rate cannot be readily
determined, the Shire uses its incremental borrowing rate.
All contracts classified as short-term leases (i.e. a lease with a remaining term of 12 months or less) and leases of low value
assets are recognised as an operating expense on a straight-line basis over the term of the lease.
Principal Principal
New Leases Repayments Outstanding
SHIRE OF JERRAMUNGUP | 17

NOTES TO THE STATEMENT OF FINANCIAL ACTIVITY OPERATING ACTIVITIES
FOR THE PERIOD ENDED 31 MAY 2021 NOTE 11
CASH RESERVES
Cash backed reserve
Reserve name
Opening
Balance
Budget Interest
Earned
Actual Interest
Earned
Budget Transfers
In
(+)
Actual Transfers
In
(+)
Budget Transfers
Out
(-)
Actual Transfers
Out
(-)
Budget Closing
Balance
Actual YTD
Closing Balance
$ $ $ $ $ $ $ $ $
Reserves cash backed - Leave Reserve 65,954 396 108 10,000 10,000 (10,000) 0 66,350 76,062
Reserves cash backed - Plant replacement 58,334 350 90 0 0 (10,000) 0 48,684 58,424
Reserves cash backed - Community Recreation 213,430 1,281 263 82,000 82,000 (270,000) (200,000) 26,711 95,693
Reserves cash backed - Bremer Bay Youth Camp 54,027 324 84 0 0 0 0 54,351 54,111
Reserves cash backed - General Building 656,840 3,941 1,019 0 0 (420,000) 0 240,781 657,859
Reserves cash backed - Bremer Bay Retirement Units 99,928 599 109 0 0 (80,000) (80,000) 20,527 20,037
Reserves cash backed - Jerramungup Retirement Units 97,348 584 151 0 0 0 0 97,932 97,499
Reserves cash backed - Jerramungup Entertainment Centre 8,809 53 19 10,000 10,000 0 0 18,862 18,828
Reserves cash backed - Effluent 733,617 4,402 1,180 66,774 72,070 (10,000) 0 794,793 806,867
Reserves cash backed - Point Henry Fire Levy 24,745 148 51 21,670 21,670 0 0 46,563 46,466
Reserves cash backed - Bremer Bay Boat Ramp 118,168 709 183 0 0 (5,000) 0 113,877 118,351
Reserves cash backed - Capital Works 9,505 57 21 10,000 10,000 0 0 19,562 19,526
Reserves cash backed - Swimming Pool 8,537 51 13 0 0 0 0 8,588 8,550
Reserves cash backed - Roe Park 62,851 377 103 10,000 10,000 0 0 73,228 72,954
Reserves cash backed - Developer Contributions 7,166 43 11 0 0 0 0 7,209 7,177
Reserves cash backed - Skate Park 0 60 6 10,000 10,000 0 0 10,060 10,006
2,219,259 13,375 3,412 220,444 225,740 (805,000) (280,000) 1,648,078 2,168,411
KEY INFORMATION
SHIRE OF JERRAMUNGUP | 18

NOTES TO THE STATEMENT OF FINANCIAL ACTIVITY OPERATING ACTIVITIESFOR THE PERIOD ENDED 31 MAY 2021 NOTE 12
OTHER CURRENT LIABILITIES
Opening Liability Liability Closing
Balance Increase Reduction Balance
Other current liabilities Note 1 July 2020 31 May 2021
$ $ $ $
Contract liabilities
13 0 0 0 0
14 (1,617,297) (1,305,354) 1,286,984 (1,635,667)
Total unspent grants, contributions and reimbursements (1,617,296) (1,305,354) 1,286,984 (1,635,667)
Provisions
Annual leave (153,082) 0 2,933 (150,149)
Long service leave (201,695) 0 21,063 (180,632)
Total Provisions (354,777) 0 23,996 (330,781)
Total other current assets (1,972,073) (1,305,354) 1,310,980 (1,966,448)
Amounts shown above include GST (where applicable)
A breakdown of contract liabilities and associated movements is provided on the following pages at Note 13 and 14
KEY INFORMATION
Provisions
Provisions are recognised when the Shire has a present legal or constructive obligation, as a result of past events, for which it is
probable that an outflow of economic benefits will result and that outflow can be reliably measured.
Provisions are measured using the best estimate of the amounts required to settle the obligation at the end of the reporting period.
Employee benefits
Short-term employee benefits
Provision is made for the Shire’s obligations for short-term employee benefits. Short-term employee benefits are benefits (other than
termination benefits) that are expected to be settled wholly before 12 months after the end of the annual reporting period in which
the employees render the related service, including wages, salaries and sick leave. Short-term employee benefits are measured at the
(undiscounted) amounts expected to be paid when the obligation is settled.
The Shire’s obligations for short-term employee benefits such as wages, salaries and sick leave are recognised as a part of current trade
and other payables in the calculation of net current assets.
Other long-term employee benefits
The Shire’s obligations for employees’ annual leave and long service leave entitlements are recognised as provisions in the statement
of financial position.
Long-term employee benefits are measured at the present value of the expected future payments to be made to employees. Expected
future payments incorporate anticipated future wage and salary levels, durations of service and employee departures and are
discounted at rates determined by reference to market yields at the end of the reporting period on government bonds that have
maturity dates that approximate the terms of the obligations. Any remeasurements for changes in assumptions of obligations for other
long-term employee benefits are recognised in profit or loss in the periods in which the changes occur. The Shire’s obligations for
long-term employee benefits are presented as non-current provisions in its statement of financial position, except where the Shire does
not have an unconditional right to defer settlement for at least 12 months after the end of the reporting period, in which case the
obligations are presented as current provisions.
Contract liabilities
An entity’s obligation to transfer goods or services to a customer for which the entity has received consideration (or the amount
is due) from the customer. Grants to acquire or construct recognisable non-financial assets to identified specifications be constructed
to be controlled by the Shire are recognised as a liability until such time as the Shire satisfies its obligations under the agreement.
- operating
- non-operating
Unspent grants, contributions and reimbursements
SHIRE OF JERRAMUNGUP | 19

NOTES TO THE STATEMENT OF FINANCIAL ACTIVITY NOTE 13
FOR THE PERIOD ENDED 31 MAY 2021 OPERATING GRANTS AND CONTRIBUTIONS
Increase Liability Current
Provider Liability in Reduction Liability Liability Amended Budget YTD YTD Revenue
1 July 2020 Liability (As revenue) 31 May 2021 31 May 2021 Revenue Budget Actual
$ $ $ $ $ $ $ $
Operating grants and subsidies
General purpose funding
FAGS funding - general purpose 0 0 0 0 0 330,684 330,684 335,235FAGS funding - Roads 0 0 0 0 0 284,333 284,332 310,154National Australia day - Australia day 0 0 0 0 0 0 0 21,000
Law, order, public safety
ESL Operating grant 0 0 0 0 0 64,000 48,000 46,216BRPC Funding 0 0 0 0 0 127,360 127,360 115,188MAF Funding 0 0 0 0 0 100,000 100,000 40,055
Community amenities
Southcoast 0 0 0 0 0 0 0 380Recreation and culture
Drought Communities program 0 0 0 0 0 28,000 28,000 28,000GSCORE - signage on walk trails 0 0 0 0 0 22,593 22,593 0DLGSC Funding - BENS project (beach signs) 0 0 0 0 0 11,589 11,589 11,589
Transport 0 0 0
Main Roads WA - Direct 0 0 0 0 0 151,274 151,274 151,274
0 0 0 0 0 1,119,833 1,103,832 1,059,091
Operating contributions
Law, order, public safety
DFES reimbursements 0 0 0 0 0 1,932 0 1,932FESA/Bushfire - admin contribution 0 0 0 0 0 0 0 4,000DFES - AWARE 0 0 0 0 0 0 0 2,777
Community amenities
Kokoda Op Shop - Lions Park Toilet 0 0 0 0 0 33,776 33,776 33,777Recreation and culture
Kokoda Op Shop - park benches 0 0 0 0 0 0 0 2,984Economic services
Dept of Mines - covid rebate 0 0 0 0 0 0 0 295Other property and services
LGIS - Health and Wellbeing 0 0 0 0 0 5,280 5,280 0
0 0 0 0 0 40,988 39,056 45,766
TOTALS 0 0 0 0 0 1,160,821 1,142,888 1,104,857
Unspent operating grant, subsidies and contributions liability Operating grants, subsidies and contributions revenue
SHIRE OF JERRAMUNGUP | 20

NOTES TO THE STATEMENT OF FINANCIAL ACTIVITY NOTE 14
FOR THE PERIOD ENDED 31 MAY 2021 NON-OPERATING GRANTS AND CONTRIBUTIONS
Increase Liability Current
Liability in Reduction Liability Liability Amended Budget YTD YTD Revenue
Provider 1 July 2020 Liability (As revenue) 31 May 2021 31 May 2021 Revenue Budget Actual
(b)
$ $ $ $ $ $ $ $
Non-operating grants and subsidies
Housing
BBRF Funding 0 0 0 0 0 311,944 339,552 0RAAP Funding 0 0 0 0 0 27,608 0 76,679
Recreation and culture
Dept of Education (909,091) 0 0 (909,091) (909,091) 1,400,000 0 0Drought Communities Program 0 (500,000) 500,000 0 0 700,000 0 305,000BBRF Round 4 Funding - Pool 0 0 0 0 0 2,100,000 0 0Drought Communities Program 0 0 0 0 0 124,000 0 117,000
Transport 0
Roads to Recovery 0 (400,523) 400,523 0 0 400,523 400,523 400,523Local Roads and Community Infrastructure Program 0 0 0 0 0 437,340 437,340 218,670Main Roads - RRG Funding 0 (180,000) 180,000 0 0 450,000 450,000 360,000Local Roads and Community Infrastructure Program 0 (224,830) 0 (224,830) (224,830) 0 0 0
Economic services 0
DWER - Community Water Supply Project 0 0 0 0 0 91,960 0 0Drought Communities Funding 0 0 0 0 0 148,000 0 50,000
Other property and services
Royalties for Regions-Waste management (708,206) 0 206,461 (501,746) (501,746) 0 0 0
(1,617,297) (1,305,353) 1,286,984 (1,635,667) (1,635,667) 6,191,375 1,627,415 1,527,872
Unspent non operating grants, subsidies and contributions liability Non operating grants, subsidies and contributions revenue
SHIRE OF JERRAMUNGUP | 21

NOTES TO THE STATEMENT OF FINANCIAL ACTIVITY NOTE 15
FOR THE PERIOD ENDED 31 MAY 2021 BUDGET AMENDMENTS
Amendments to original budget since budget adoption. Surplus/(Deficit)
GL Code Description Council Resolution Classification
Non Cash
Adjustment
Increase in
Available Cash
Decrease in
Available Cash
Amended
Budget Running
Balance
$ $ $ $
Budget adoption Opening surplus 4,592
070700 Dr receptionist costs OCM200906 Operating Expenses 0 0 (13,334) (8,742)
100601 BB Civic centre design funding - Gairdner Hall & Needilup Pavillion OCM200906 Operating Revenue 0 0 (40,000) (48,742)
110101 BB Civic centre design funding - Gairdner Hall & Needilup Pavillion OCM200906 Operating Expenses 0 40,000 0 (8,742)
100600 BB Civic centre design expense moved to Gairdner Hall & Needilup Pavillion capital costs OCM200906 Operating Expenses 0 40,000 0 31,258
A38 BB Civic centre design expense moved to Gairdner Hall capital costs OCM200906 Capital Expenses 0 0 (20,000) 11,258
A39 BB Civic centre design expense moved to Needilup Pavillion capital costs OCM200906 Capital Expenses 0 0 (20,000) (8,742)
130701 Reallocate funding - Boxwood dam to Gairdner Hall & Needilup Pavillion OCM200906 Operating Revenue 0 0 (7,000) (15,742)
110101 Reallocate funding - Boxwood dam to Gairdner Hall & Needilup Pavillion OCM200906 Operating Revenue 0 7,000 0 (8,742)
100601 Reallocate funding - Adverse Event Plan to Gairdner Hall and Needilup Pavillion OCM200906 Operating Revenue 0 0 (20,000) (28,742)
110101 Reallocate funding - Adverse Event Plan to Gairdner Hall and Needilup Pavillion OCM200906 Operating Revenue 0 20,000 0 (8,742)
Reallocate materials and contractor costs for road construction jobs to other jobs OCM201109 Capital Expenses 0 108,448 (108,448) (8,742)
723000 Boxwood Hills Sports Club - transfer from Reserves OCM201213 Non Cash Item 0 70,000 0 61,258
A203 Boxwood Hills Sports Club - contribution towards sports club upgrade OCM201213 Capital Expenses 0 0 (70,000) (8,742)
A925 Traffic Trailer OCM210405 Capital Expenses 0 15,000 0 6,258
A932 BB Lawnmower OCM210405 Capital Expenses 0 0 (9,000) (2,742)
OCM210405 0 300,448 (307,782)
SHIRE OF JERRAMUNGUP | 22

NOTES TO THE STATEMENT OF FINANCIAL ACTIVITY NOTE 16FOR THE PERIOD ENDED 31 MAY 2021 EXPLANATION OF MATERIAL VARIANCES
The material variance thresholds are adopted annually by Council as an indicator of whether the actual expenditure or
The material variance adopted by Council for the 2020-21 year is $10,000 or 10.00% whichever is the greater.
Reporting Program Var. $ Var. % Timing/ Permanent Explanation of Variance
$ %
Revenue from operating activities
Governance 21,000 0.00% p Permanent Australia day grants not in budget.
Law, order and public safety (61,938) (20.65%) q Timing Timing of MAF grant.
Recreation and culture (12,756) (19.52%) q Timing Timing of GSCORE grant(signage).
Economic services (24,400) (40.28%) q Timing Millers point income down and timing of BB Youth
camp lease payment.
Other property and services 33,276 39.04% p Permanent Profit on sale of vehicle higher than budget $10,915.
Additional private works $11,000 and Workers
compensation reimbursements $13,000.
Expenditure from operating activities
General purpose funding 25,991 11.29% p Permanent $7000 Budgeted YTD Legal fees to recovery
outstanding rates is down due to COVID debt recovery
policy. Bank fees of $3700 allocated to different
program compared to budget. Valuation fees lower
than budget.
Law, order and public safety 309,195 37.45% p Timing Timing of CESM and BRPC expenses and the MAF
project. Fire fighting costs, employee costs(BBPC)and
overhead recovery lower than budget.
Housing (27,970) (41.66%) q Permanent Depreciation and utility costs on BB ILU's not included
in budget.
Community amenities 194,112 15.96% p Timing Timing of waste disposal costs. Drainage studies not
completed $53K. Provision for plumbing and
catchments for sewerage system which havent used.
Wages and overheads lower than budget across the
program.
Economic services (57,878) (31.43%) q Timing Depreciation, employee costs, overheads and building
control expenses all slightly higher than budget.
Other property and services (40,891) (167.99%) q Timing Timing of overhead allocations.
Investing activities
Payments for property, plant and equipment and
infrastructure
3,923,921 46.98% p Timing Timing of pool construction and other capital
purchases/payments. Ute not purchased.
Financing actvities
Transfer from reserves (525,000) (65.22%) q Timing Timing and some reserve transfers not expected to be
required.
revenue varies from the year to date Actual materially.
SHIRE OF JERRAMUNGUP | 23