monthly activity snapshot
TRANSCRIPT
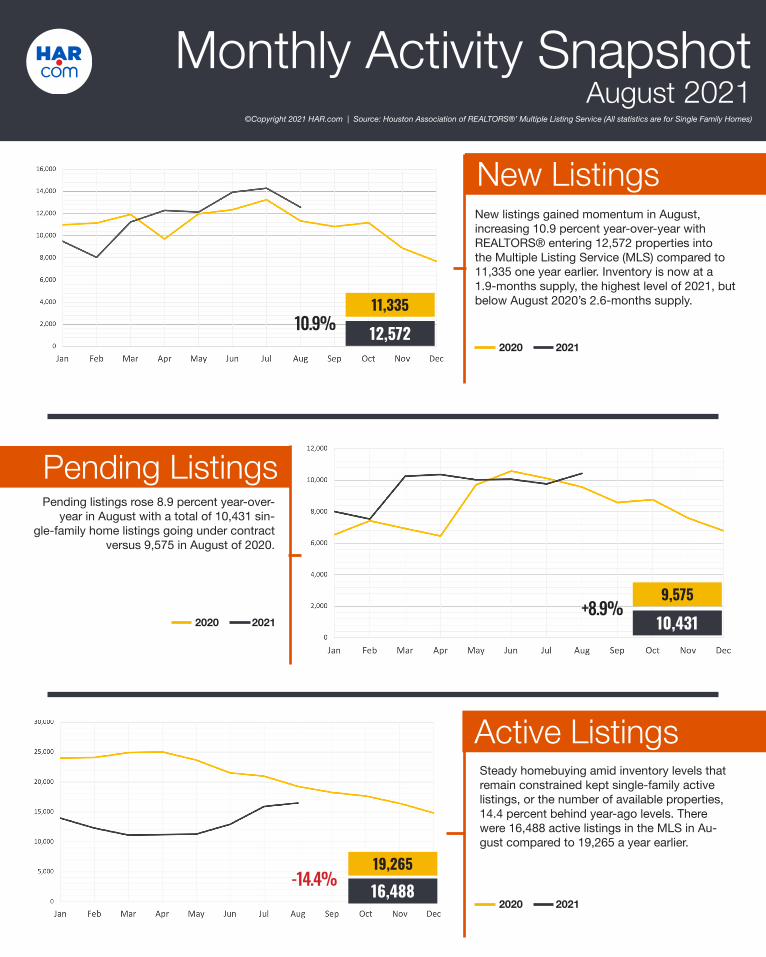
New listings gained momentum in August, increasing 10.9 percent year-over-year with REALTORS® entering 12,572 properties into the Multiple Listing Service (MLS) compared to 11,335 one year earlier. Inventory is now at a 1.9-months supply, the highest level of 2021, but below August 2020’s 2.6-months supply.
Steady homebuying amid inventory levels that remain constrained kept single-family active listings, or the number of available properties, 14.4 percent behind year-ago levels. There were 16,488 active listings in the MLS in Au-gust compared to 19,265 a year earlier.
Pending listings rose 8.9 percent year-over-year in August with a total of 10,431 sin-
gle-family home listings going under contract versus 9,575 in August of 2020.
New Listings
Active Listings
Pending Listings
10.9%
+8.9%
-14.4%
11,335
9,575
19,265
12,572
10,431
16,488
Monthly Activity SnapshotAugust 2021
©Copyright 2021 HAR.com | Source: Houston Association of REALTORS®’ Multiple Listing Service (All statistics are for Single Family Homes)
2020 2021
2020 2021
2020 2021

Property showings fell in August with consumers turning their attention from real estate to back-to-school. A total of 156,960 showings took place in August versus 199,770 one year earlier. That represents a 21.4 percent decline.
Showings
-21.4%199,770156,960
Single-family home sales quickly rebound-ed from July’s decline. During the month
of August, 9,890 units sold versus 9,118 in August 2020. July’s decline was the result of
July 2020’s record-setting surge of sales once COVID-related lockdowns were lifted and post-
poned closings cleared.
Closings
+8.5%9,1189,890
2020 2021
HAR.com Listing Views Open Houses
-24.0%70,282,67753,398,498
19,083 HeldIn-Person & Virtual
Monthly Activity SnapshotAugust 2021
©Copyright 2021 HAR.com | Source: Houston Association of REALTORS®’ Multiple Listing Service (All statistics are for Single Family Homes)
2020 2021
2020 2021