tourism snapshot - destination canada · pdf filetourism snapshot june 2017 | 1 tourism...
TRANSCRIPT
Tourism Snapshot June 2017 | 1
Tourism SnapshotA Monthly Monitor of the Performance of Canada’s Tourism Industry
June 2017Volume 13, Issue 6
www.destinationcanada.com
2 | Tourism Snapshot June 2017
• Arrivals from Destination Canada’s international markets were up 8.0% in June 2017 and 5.8% year-to-date, with all 11 markets up year-over-year over the first half of the 2017. The declines observed in May continued into June 2017 for France (-5.1%), the UK (-4.5%), and Japan (-3.4%), while arrivals from Germany recovered (+10.5%).
• Following a slow month in May, US overnight arrivals recovered well in June 2017 (+7.4%), with positive year-over-year growth in auto (+5.8%), air (+8.7%), and other (+10.9%) arrivals. Year-to-date arrivals from the US over the first half of the year were at their highest level since 2005.
• Destination Canada’s two Latin American markets continued to reach new heights in June 2017 (+48.3%), with outstanding growth from Mexico (+60.4%) as well as very strong performance from Brazil (+23.0%). Both markets reached new record arrivals for both the month of June and the first six months of the year.
• Destination Canada’s Asia-Pacific region also recorded very strong growth in June 2017 (+13.3%), with increased arrivals from four of the five markets – India (+25.3%), South Korea (+17.3%), Australia (+17.3%), and China (+10.4%). The exception was Japan (-3.4%), which observed a drop in arrivals for a second consecutive month. This decline from Japan was most apparent in arrivals via the US, both by land (-23.8%) and by air (-8.9%). However, year-to-date arrivals from all five Destination Canada Asia-Pacific markets were up by double-digits over the first half of the year.
• Year-to-date in 2017, arrivals from all three Destination Canada Europe markets continued to outperform the same period in 2016. However, for June 2017, Europe (-1.5%) is the only one of Destination Canada’s regions to record a drop in arrivals compared to last June, due to a second consecutive month of declines from France (-5.1%) and the UK (-4.5%), which were not quite offset by a strong recovery from Germany (+10.5%). The decline in June arrivals from the UK was primarily from air arrivals, both direct (-6.9%) and via the US (-13.3%), amidst a contraction in direct air capacity to Canada (-4.1%).
KEY HIGHLIGHTS
QUICK LINKS
Tourism Snapshot June 2017 | 3
Industry Performance Dashboard
June 2017 YTD
Overnight Arrivals1
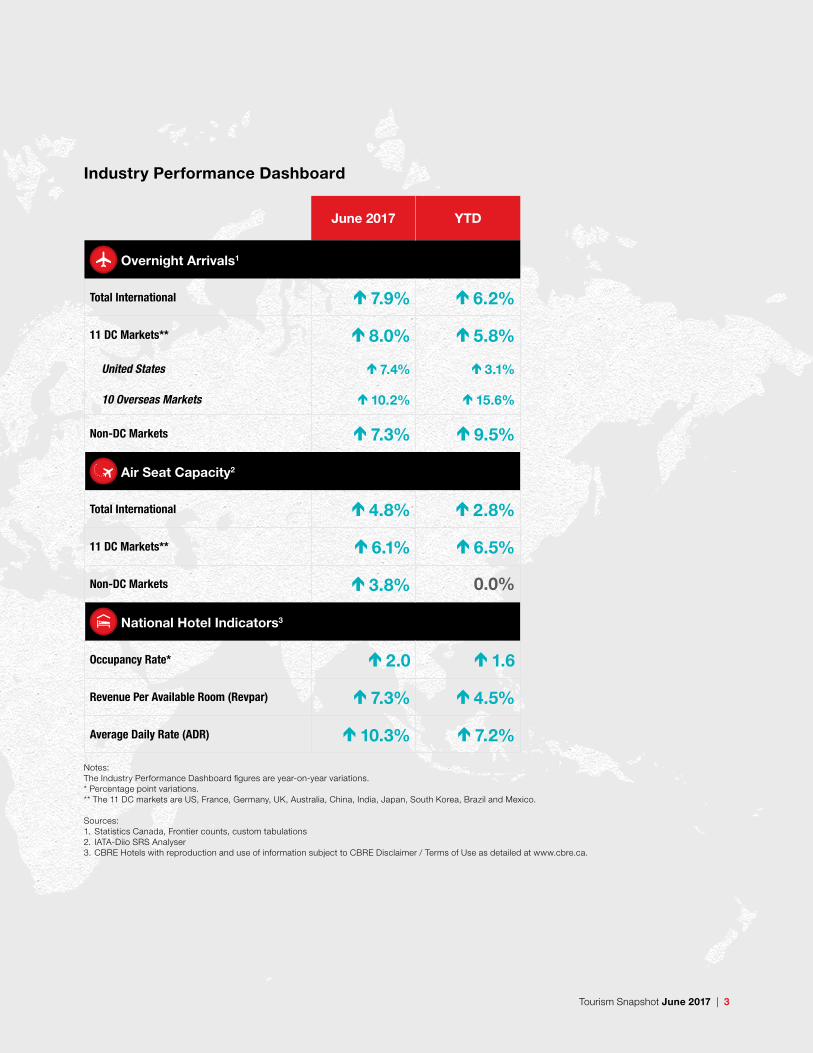
Total International 7.9% 6.2%
11 DC Markets** 8.0% 5.8%
United States 7.4% 3.1%
10 Overseas Markets 10.2% 15.6%
Non-DC Markets 7.3% 9.5%
Air Seat Capacity2
Total International 4.8% 2.8%
11 DC Markets** 6.1% 6.5%
Non-DC Markets 3.8% 0.0%
National Hotel Indicators3
Occupancy Rate* 2.0 1.6
Revenue Per Available Room (Revpar) 7.3% 4.5%
Average Daily Rate (ADR) 10.3% 7.2%
Notes:The Industry Performance Dashboard figures are year-on-year variations. * Percentage point variations.** The 11 DC markets are US, France, Germany, UK, Australia, China, India, Japan, South Korea, Brazil and Mexico.
Sources:1. Statistics Canada, Frontier counts, custom tabulations2. IATA-Diio SRS Analyser3. CBRE Hotels with reproduction and use of information subject to CBRE Disclaimer / Terms of Use as detailed at www.cbre.ca.

4 | Tourism Snapshot June 2017
Overnight Arrivalsi Arrival YOY
Variations (%)Air Seat
capacityii Local currency
vs. CADiii
Market June 2017 YTD 2017 June 2017 YTD 2017 June
2017 YTD 2017 June 2017 Average
YTD Average
United States
United States 1,808,757 5,760,483 7.4% 3.1% 3.8% 2.5% 3.1% -0.6%
DC Europe
France 49,264 202,502 -5.1% 3.4% 5.0% 7.2% 3.2% -3.5%
Germany 43,692 146,049 10.5% 9.4% 12.0% 11.0% 3.2% -3.5%
United Kingdom 91,428 323,969 -4.5% 4.5% -4.1% 6.3% -6.9% -12.6%
DC Asia-Pacific
Australia 49,582 160,946 17.3% 21.8% 24.6% 81.4% 5.4% 2.4%
China 78,329 275,604 10.4% 14.5% 27.9% 36.9% -0.2% -5.4%
India 41,848 128,097 25.3% 25.4% 33.0% 48.4% 7.6% 1.7%
Japan 27,887 124,557 -3.4% 10.8% 9.5% 11.8% -2.1% -1.2%
South Korea 32,955 118,625 17.3% 24.6% 26.4% 39.6% 6.3% 3.0%
DC Latin America
Brazil 16,184 60,322 23.0% 17.0% -20.1% -29.4% 7.1% 15.9%
Mexico 43,889 169,769 60.4% 60.7% 72.6% 49.2% 6.1% -7.4%
Total 11 DC Markets 2,283,815 7,470,923 8.0% 5.8%
Rest of the World 300,008 977,037 7.3% 9.5%
Total International 2,583,823 8,447,960 7.9% 6.2%
Sources:i. Statistics Canada, Frontier counts, custom tabulationsii. IATA-Diio SRS Analyseriii. Bank of Canada
Notes: i. Arrival figures are preliminary estimates and are subject to change.ii. Air seat capacity is the variation in the total number of seats on direct commercial scheduled flights during the current month and YTD relative to the same periods
in the previous year.iii. The exchange rate variation is calculated on the average value of the Canadian dollar during during the current month and YTD relative to the same periods in the
previous year.
MARKET MONITOR SUMMARY

Tourism Snapshot June 2017 | 5
UNITED STATES
0
600
1,200
1,800
2,400
3,000
JAN FEB MAR APR MAY JUN JUL AUG SEP OCT NOV DEC
OVER
NIG
HT A
RRIV
ALS
(000
s)
20172016
PEAK: JUNE 2001
United States: Key Indicators
Air Seat CapacityiJune 2017 3.8%
YTD 2.5%
Exchange RateiiJune 2017 3.1%
YTD -0.6%
Consumer Confidence Index (1985=100)iii
June 2017 117.3
Previous Month 117.6
YTD Arrival Peakiv
Previous Peak Year 2001
Current % of Previous Peak
89.0%
Source:i. IATA-Diio SRS Analyser, Year-on-year % variance.ii. Bank of Canada, Year on year % variance.iii. Consumer Confidence Index, the Conference Board (USA).iv. Statistics Canada, Frontier counts, custom tabulations.
Trend Plot: Total United States Arrivals
Overnight Arrivals
June 2017 YTD 2017
Arrivals % YOY Variance Arrivals % YOY
Variance
Automobile 974,575 5.8 3,150,028 0.5
Air 601,384 8.7 2,079,822 6.7
Other 232,798 10.9 530,633 6.1
US Total 1,808,757 7.4 5,760,483 3.1
Source: Statistics Canada, Frontier counts, custom tabulations.Note: The figures are preliminary estimates and are subject to change.
US Arrivals to Canada
CURRENT MONTH:
+7.4% YOY
YTD:
+3.1% YOY

6 | Tourism Snapshot June 2017
• In June 2017, US overnight arrivals were up +7.4% over June 2016, noting a strong recovery following a marginal downward shift in May. Arrivals increased year-over-year across all modes of entry: auto (+5.8%), air (+8.7%), and other modes of transportation (+10.9%).
• Year-to-date arrivals from the US over the first half of the year were at their highest level since 2005, and up +3.1% over the first half of 2016. Arrivals by air (+6.7%) led this positive trend, followed by other modes of transportation such as bus, train, and cruise (+6.1%). Auto arrivals (+0.5%) were more subdued but still up compared to the same period a year ago, with slight declines in visitors driving across the border in British Columbia, Alberta, and New Brunswick outweighed by increases in other provinces.
• Supporting the persistent growth in air arrivals was the continued expansion of air capacity between Canada and the US (+3.8% in June, +2.5% YTD). Arrivals growth was likely also supported by a slight improvement in the strength of US dollar vs. the Canadian dollar in June (+3.1%) when compared to the same month in 2016, though year-to-date it was still marginally weaker than last year (-0.6%).
1 States of origin information is based on Integrated Primary Inspection Lane data collected from US residents entering Canada in automobiles with license plate registered in the United States.
• Over the first half of 2017, Canada saw the highest proportion of US overnight arrivals by vehicle1 originating from New York (18.5% of January-June US auto arrivals), Washington (17.3%), and Michigan (12.1%), as well as Pennsylvania (4.8%), Ohio (4.7%), and Massachusetts (4.5%). Notable growth in cross-border traffic was also observed from several states further from the Canada-US border – including Colorado, Georgia, Maryland, Texas, California, Oregon, Utah, and Virginia.
• Following two consecutive months of decline, the consumer confidence index published by the US Conference Board slipped again by a marginal 0.3 points to 117.3.
UNITED STATES

Tourism Snapshot June 2017 | 7
EUROPE
JAN FEB MAR APR MAY JUN JUL AUG SEP OCT NOV DEC
OVER
NIG
HT A
RRIV
ALS
(000
s)
20172016
0
50
100
150
200
250
300
PEAK: JUNE 1996
Trend Plot: Total DC Europe Arrivals
DC Europe: Key Indicators
France GermanyUnited
Kingdom
Air Seat Capacityi
June 2017 5.0% 12.0% -4.1%
YTD 7.2% 11.0% 6.3%
Exchange Rateii
June 2017 3.2% 3.2% -6.9%
YTD -3.5% -3.5% -12.6%
YTD Arrival Peakiii
Previous Peak Year
2016 1996 2007
Current % of Previous Peak
103.4% 88.0% 84.7%
Sources:i. IATA-Diio SRS Analyser, Year-on-year % variance.ii. Bank of Canada, Year on year % variance.iii. Statistics Canada, Frontier counts, custom tabulations.
Overnight Arrivals
June 2017 YTD 2017
Arrivals % YOY Variance Arrivals % YOY
Variance
DC Europe 184,384 -1.5 672,520 5.2
United Kingdom 91,428 -4.5 323,969 4.5
France 49,264 -5.1 202,502 3.4
Germany 43,692 10.5 146,049 9.4
Other Europe 127,602 35.0 428,933 34.8
Italy 14,267 2.1 40,577 -3.4
Netherlands 16,619 17.4 55,169 13.3
Spain 11,034 17.3 31,369 19.8
Switzerland 12,965 -3.4 45,226 -3.7
Rest of Europe 72,717 1.5 256,592 8.8
Total Europe 311,986 0.7 1,101,453 6.0
Source: Statistics Canada, Frontier counts, custom tabulations.Note: The figures are preliminary estimates and are subject to change.
UK
FRANCE
GERMANY
DC Markets
ASIA-PACIFIC
DC EUROPEUS
DC LATIN-AMERICA
Other Europe
Europe Arrivals to Canada
CURRENT MONTH:
-1.5% YOY
YTD:
+5.2% YOY
8 | Tourism Snapshot June 2017
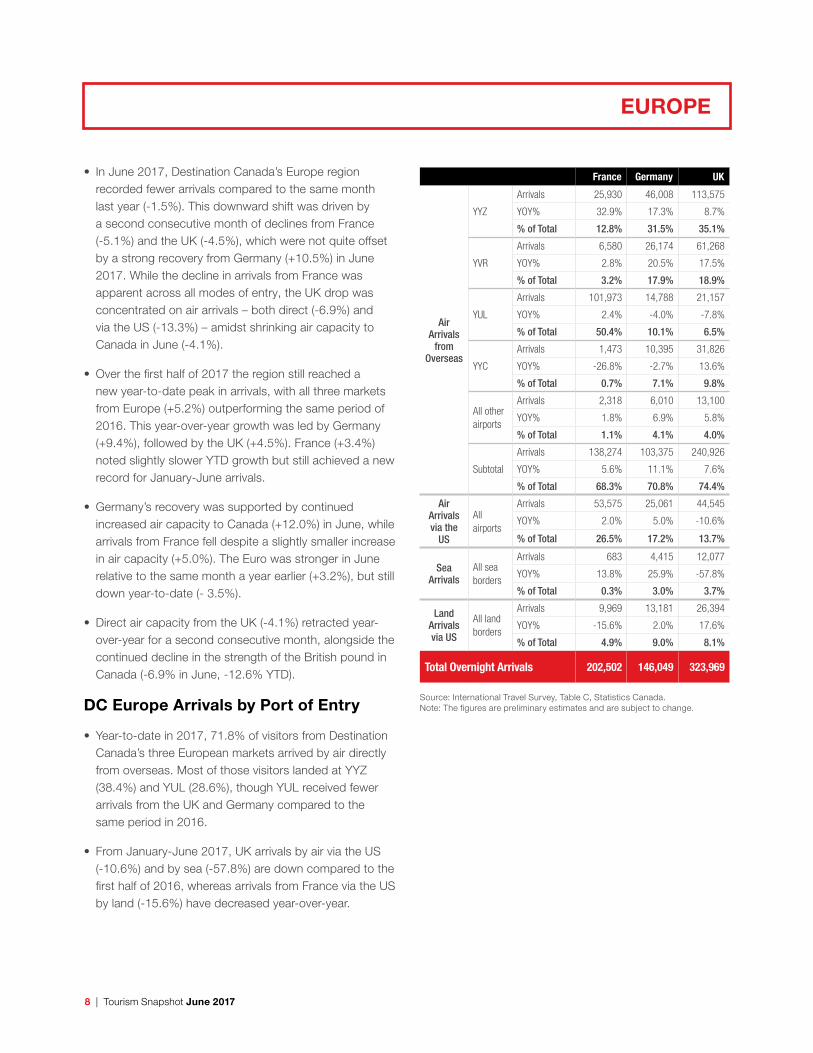
• In June 2017, Destination Canada’s Europe region recorded fewer arrivals compared to the same month last year (-1.5%). This downward shift was driven by a second consecutive month of declines from France (-5.1%) and the UK (-4.5%), which were not quite offset by a strong recovery from Germany (+10.5%) in June 2017. While the decline in arrivals from France was apparent across all modes of entry, the UK drop was concentrated on air arrivals – both direct (-6.9%) and via the US (-13.3%) – amidst shrinking air capacity to Canada in June (-4.1%).
• Over the first half of 2017 the region still reached a new year-to-date peak in arrivals, with all three markets from Europe (+5.2%) outperforming the same period of 2016. This year-over-year growth was led by Germany (+9.4%), followed by the UK (+4.5%). France (+3.4%) noted slightly slower YTD growth but still achieved a new record for January-June arrivals.
• Germany’s recovery was supported by continued increased air capacity to Canada (+12.0%) in June, while arrivals from France fell despite a slightly smaller increase in air capacity (+5.0%). The Euro was stronger in June relative to the same month a year earlier (+3.2%), but still down year-to-date (- 3.5%).
• Direct air capacity from the UK (-4.1%) retracted year-over-year for a second consecutive month, alongside the continued decline in the strength of the British pound in Canada (-6.9% in June, -12.6% YTD).
DC Europe Arrivals by Port of Entry
• Year-to-date in 2017, 71.8% of visitors from Destination Canada’s three European markets arrived by air directly from overseas. Most of those visitors landed at YYZ (38.4%) and YUL (28.6%), though YUL received fewer arrivals from the UK and Germany compared to the same period in 2016.
• From January-June 2017, UK arrivals by air via the US (-10.6%) and by sea (-57.8%) are down compared to the first half of 2016, whereas arrivals from France via the US by land (-15.6%) have decreased year-over-year.
EUROPE
France Germany UK
Air Arrivals
from Overseas
YYZ
Arrivals 25,930 46,008 113,575
YOY% 32.9% 17.3% 8.7%
% of Total 12.8% 31.5% 35.1%
YVR
Arrivals 6,580 26,174 61,268
YOY% 2.8% 20.5% 17.5%
% of Total 3.2% 17.9% 18.9%
YUL
Arrivals 101,973 14,788 21,157
YOY% 2.4% -4.0% -7.8%
% of Total 50.4% 10.1% 6.5%
YYC
Arrivals 1,473 10,395 31,826
YOY% -26.8% -2.7% 13.6%
% of Total 0.7% 7.1% 9.8%
All other airports
Arrivals 2,318 6,010 13,100
YOY% 1.8% 6.9% 5.8%
% of Total 1.1% 4.1% 4.0%
Subtotal
Arrivals 138,274 103,375 240,926
YOY% 5.6% 11.1% 7.6%
% of Total 68.3% 70.8% 74.4%
Air Arrivals via the
US
All airports
Arrivals 53,575 25,061 44,545
YOY% 2.0% 5.0% -10.6%
% of Total 26.5% 17.2% 13.7%
Sea Arrivals
All sea borders
Arrivals 683 4,415 12,077
YOY% 13.8% 25.9% -57.8%
% of Total 0.3% 3.0% 3.7%
Land Arrivals via US
All land borders
Arrivals 9,969 13,181 26,394
YOY% -15.6% 2.0% 17.6%
% of Total 4.9% 9.0% 8.1%
Total Overnight Arrivals 202,502 146,049 323,969
Source: International Travel Survey, Table C, Statistics Canada.Note: The figures are preliminary estimates and are subject to change.

Tourism Snapshot June 2017 | 9
ASIA-PACIFIC
JAN FEB MAR APR MAY JUN JUL AUG SEP OCT NOV DEC
OVER
NIG
HT A
RRIV
ALS
(000
s)
20172016
0
50
100
150
200
250
PEAK: JUNE 2017
Trend Plot: Total DC Asia-Pacific Arrivals
CHINA
INDIA
AUSTRALIA
JAPAN
SOUTHKOREA
Asia-Pacific: Key Indicators
Australia China India JapanSouth Korea
Air Seat Capacityi
June 2017 24.6% 27.9% 33.0% 9.5% 26.4%
YTD 81.4% 36.9% 48.4% 11.8% 39.6%
Exchange Rateii
June 2017 5.4% -0.2% 7.6% -2.1% 6.3%
YTD 2.4% -5.4% 1.7% -1.2% 3.0%
YTD Arrival Peakiii
Previous Peak Year
2016 2016 2016 1996 2016
Current % of Previous Peak
121.8% 114.5% 125.4% 48.7% 124.6%
Sources:i. IATA-Diio SRS Analyser, Year-on-year % variance.ii. Bank of Canada, Year on year % variance.iii. Statistics Canada, Frontier counts, custom tabulations.
Overnight Arrivals
June 2017 YTD 2017
Arrivals % YOY Variance Arrivals % YOY
Variance
DC Asia-Pacific 230,601 13.3 807,829 18.3
Australia 49,582 17.3 160,946 21.8
China 78,329 10.4 275,604 14.5
India 41,848 25.3 128,097 25.4
Japan 27,887 -3.4 124,557 10.8
South Korea 32,955 17.3 118,625 24.6
Other Asia-Pacific 107,086 -1.5 331,231 15.4
Hong Kong 20,045 -2.8 69,717 2.6
Taiwan 12,502 -11.9 40,282 -0.4
Rest of Asia-Pacific 74,539 13.2 221,232 13.2
Total Asia-Pacific 337,687 11.0 1,139,060 15.5
Source: Statistics Canada, Frontier counts, custom tabulations.Note: The figures are preliminary estimates and are subject to change.
DC Markets
ASIA-PACIFIC
DC EUROPEUS
DC LATIN-AMERICA
Other Asia-Pacific
DC Asia-Pacific Arrivals to Canada
CURRENT MONTH:
+13.3% YOY
YTD:
+18.3% YOY

10 | Tourism Snapshot June 2017
• Destination Canada’s Asia-Pacific region recorded a new peak in arrivals in June 2017, growing 13.3% over June 2016. Four of the five markets recorded double-digit growth, led by India (+25.3%), followed by South Korea (+17.3%), Australia (+17.3%), and China (+10.4%) each setting new records for the month of June as well.
• The exception was Japan, which observed a -3.4% drop in arrivals compared to June 2016. This trend was most apparent in arrivals via the US, both by land (-23.8%) and by air (-8.9%).
• Year-to-date, all five Asia-Pacific markets observed double-digit growth compared to the same period last year, with India again leading the region (+25.4%), followed closely by South Korea (+24.6%), Australia (+21.8%), China (+14.5% ) and Japan (+10.8%). With the exception of Japan, these markets also reached record arrivals for the first half of the year.
• Air capacity to Canada from these markets continued to expand at a rapid pace, with the biggest increase in June from India (+33.0%). In line with the subdued arrivals recorded from Japan, air capacity from this market also expanded at a somewhat slower pace compared to the other four Asia-Pacific markets (+9.5%). The strength of the Yen vs. the Canadian dollar also softened compared to 2016 (-2.1% in June, -1.2% YTD).
ASIA-PACIFIC
DC Asia-Pacific Arrivals by Port of Entry
• Year-to-date in 2017, the majority of visitors from Destination Canada’s Asia-Pacific markets travelled to Canada by air directly from overseas. Consistent with past trends, Australia remained the exception with nearly equal proportions arriving by air direct (39.3%) or via the US (37.9%).
• All markets except South Korea continued to observe declines in arrivals via the US by land over the first half of 2017. By sea, arrivals were up over 2016 by approximately 30% from China (+33.7%), South Korea (+32.2%), and Australia (+31.8%), but declined from Japan (-9.9%) and India (-3.2%).
Australia China India Japan South Korea
Air Arrivals
from Overseas
YYZ
Arrivals 7,701 78,490 63,855 32,362 27,244
YOY% 14.2% 11.6% 54.1% 30.8% 84.0%
% of Total 4.8% 28.5% 49.8% 26.0% 23.0%
YVR
Arrivals 53,389 111,657 15,263 50,339 35,518
YOY% 52.9% 20.4% 19.6% 17.4% 11.3%
% of Total 33.2% 40.5% 11.9% 40.4% 29.9%
YUL
Arrivals 1,040 13,445 4,701 621 404
YOY% 16.6% 66.0% 17.9% 55.6% 38.8%
% of Total 0.6% 4.9% 3.7% 0.5% 0.3%
YYC
Arrivals 712 5,669 4,934 5,075 430
YOY% 4.1% 1699.7% 5.0% -19.0% -34.4%
% of Total 0.4% 2.1% 3.9% 4.1% 0.4%
All other airports
Arrivals 411 434 1,833 106 96
YOY% 1.0% 0.3% 2.9% 0.1% 0.2%
% of Total 0.3% 0.2% 1.4% 0.1% 0.1%
Subtotal
Arrivals 63,253 209,695 90,586 88,503 63,692
YOY% 45.1% 21.8% 40.9% 19.0% 33.3%
% of Total 39.3% 76.1% 70.7% 71.1% 53.7%
Air Arrivals via the
US
All airports
Arrivals 61,005 40,295 16,334 27,128 17,041
YOY% 9.5% -2.2% 7.8% 3.6% 10.4%
% of Total 37.9% 14.6% 12.8% 21.8% 14.4%
Sea Arrivals
All sea borders
Arrivals 19,794 6,025 4,475 2,126 2,170
YOY% 31.8% 33.7% -3.2% -9.9% 32.2%
% of Total 12.3% 2.2% 3.5% 1.7% 1.8%
Land Arrivals via US
All land borders
Arrivals 16,892 19,589 16,702 6,800 35,722
YOY% -4.5% -13.4% -7.6% -22.6% 19.6%
% of Total 10.5% 7.1% 13.0% 5.5% 30.1%
Total Overnight Arrivals 160,946 275,604 128,097 124,557 118,625
Source: International Travel Survey, Table C, Statistics Canada.Note: The figures are preliminary estimates and are subject to change.
Tourism Snapshot June 2017 | 11
LATIN AMERICA
JAN FEB MAR APR MAY JUN JUL AUG SEP OCT NOV DEC
OVER
NIG
HT A
RRIV
ALS
(000
s)
20172016
0
10
20
30
40
50
60 PEAK: JUNE 2017
Arrival Trend Plot – Total DC Latin America
BRAZIL
MEXICO
DC Latin America: Key Indicators
Brazil Mexico
Air Seat Capacityi
June 2017 -20.1% 72.6%
YTD -29.4% 49.2%
Exchange RateiiJune 2017 7.1% 6.1%
YTD 15.9% -7.4%
YTD Arrival Peakiii
Previous Peak Year
2016 2008
Current % of Previous Peak
117.0% 146.7%
Sources:i. IATA-Diio SRS Analyser, Year-on-year % variance.ii. Bank of Canada, Year on year % variance.iii. Statistics Canada, Frontier counts, custom tabulations.
Overnight Arrivals
June 2017 YTD 2017
Arrivals % YOY Variance Arrivals % YOY
Variance
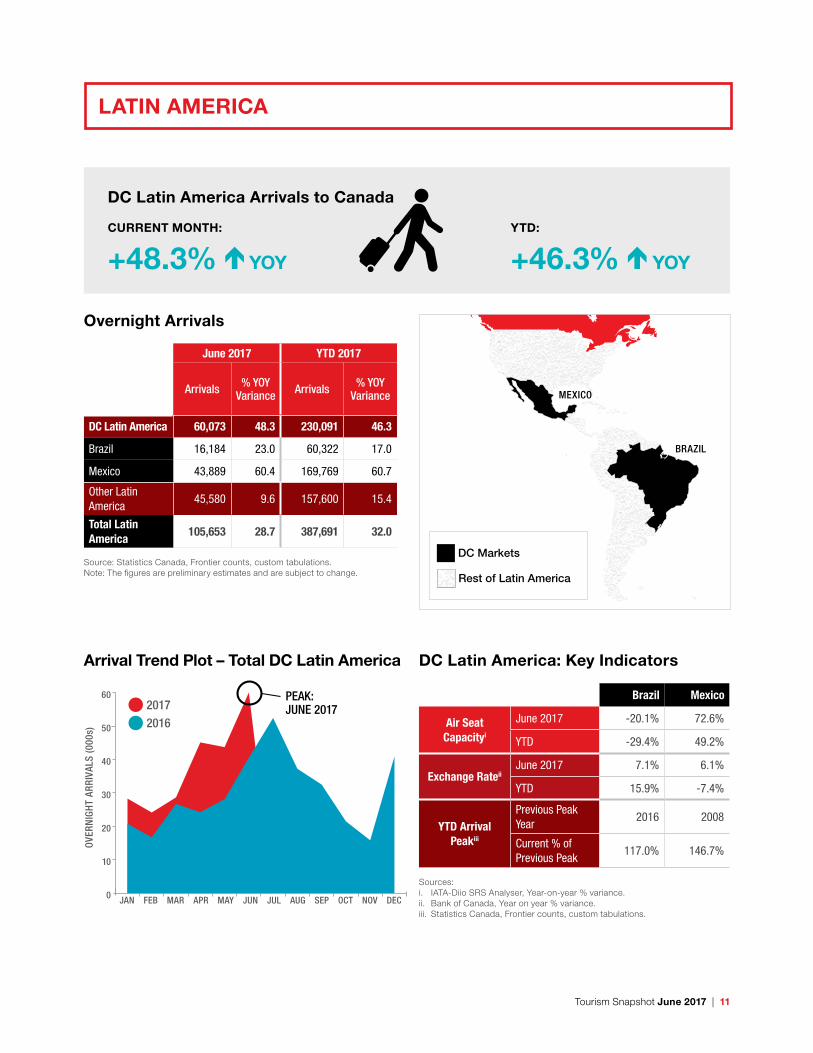
DC Latin America 60,073 48.3 230,091 46.3
Brazil 16,184 23.0 60,322 17.0
Mexico 43,889 60.4 169,769 60.7
Other Latin America
45,580 9.6 157,600 15.4
Total Latin America
105,653 28.7 387,691 32.0
Source: Statistics Canada, Frontier counts, custom tabulations.Note: The figures are preliminary estimates and are subject to change.
DC Markets
ASIA-PACIFIC
DC EUROPEUS
DC LATIN-AMERICA
Rest of Latin America
DC Latin America Arrivals to Canada
CURRENT MONTH:
+48.3% YOY
YTD:
+46.3% YOY

12 | Tourism Snapshot June 2017
• In June 2017 Destination Canada’s Latin America region continued to lead growth in international arrivals to Canada, setting new arrivals records both for the month of June (+48.3%) and the first half of the year (+46.3%).
• In line with the trend observed since the replacement of the visa requirement with the Electronic Travel Authority (eTA) in December 2016, Mexico continued to shine with year-over-year growth of +60.4% in June 2017 and +60.7% year-to-date. Arrivals from Mexico once again reached new monthly and year-to-date peaks. Ongoing air capacity expansion (+72.6% in June, +49.2% YTD) supported this growth, while a generally weaker Peso (-7.4% YTD) showed signs of improvement against the Canadian dollar (+6.1% in June).
• Brazil also continued to perform very well, with arrivals up +23.0% in June 2017 and +17.0% YTD to hit new peaks for both periods. This ongoing positive trend is particularly impressive given the continued contraction of air capacity to Canada (-29.4% YTD), and may be supported by the recent positive trend observed with the strength of the Real vs. the Canadian dollar.
DC Latin America Arrivals by Port of Entry
• Almost two-thirds of visitors from Mexico flew directly to Canada (63.9%), with nearly equal numbers also travelling via the US either by air (18.8%) or by land (16.0%). Most visitors from Brazil arrived direct by air (55.8%) or via the US by air (40.1%). Brazilian arrivals to Canada via the US by land have declined year-over-year, while arrivals by sea from both countries are also down.
• Almost all direct air arrivals from Brazil landed at YYZ (93.6%), while those from Mexico usually arrived at either YYZ (47.2%) or YVR (28.6%). There was a particularly sharp increase in direct arrivals from Mexico at YUL (+134.6%) as well as at YYZ (+95.9%) over the first half of 2017.
Brazil Mexico
Air Arrivals from Overseas
YYZ
Arrivals 31,516 50,955
YOY% 25.0% 95.9%
% of Total 52.2% 30.0%
YVR
Arrivals 1,027 30,830
YOY% 57.5% 47.8%
% of Total 1.7% 18.2%
YUL
Arrivals 1,007 22,702
YOY% 34.1% 134.6%
% of Total 1.7% 13.4%
YYC
Arrivals 49 2,486
YOY% -14.0% 57.2%
% of Total 0.1% 1.5%
All other airports
Arrivals 73 1,009
YOY% 0.3% 1.7%
% of Total 0.1% 0.6%
Subtotal
Arrivals 33,672 107,982
YOY% 25.9% 82.2%
% of Total 55.8% 63.6%
Air Arrivals via the US All airports
Arrivals 24,200 31,891
YOY% 9.5% 60.3%
% of Total 40.1% 18.8%
Sea ArrivalsAll sea borders
Arrivals 757 2,750
YOY% -10.9% -89.7%
% of Total 1.3% 1.6%
Land Arrivals via US
All land borders
Arrivals 1,693 27,146
YOY% -92.3% 36.4%
% of Total 2.8% 16.0%
Total Overnight Arrivals 60,322 169,769
Source: Statistics Canada, Frontier counts, custom tabulations, Table C.Note: The figures are preliminary estimates and are subject to change.
LATIN AMERICA
Tourism Snapshot June 2017 | 13
January to June 2017 Trips To:
Canada Australia
Trips From: YOY Change YOY Change
Total International 8,447,960 6.2% 4,159,900 7.2%
United States 5,760,483 3.1% 386,900 12.1%
Canada … … 85,800 13.8%
Europe
United Kingdom 323,969 4.5% 356,200 2.8%
France 202,502 3.4% 55,500 3.2%
Germany 146,049 9.4% 98,000 7.9%
Asia-Pacific
Australia 160,946 21.8% … …
Japan 124,557 10.8% 189,500 5.9%
South Korea 118,625 24.6% 148,200 5.6%
China 275,604 14.5% 674,100 8.0%
India 128,097 25.4% 148,500 13.1%
Latin AmericaMexico 169,769 60.7% 4,500 15.4%
Brazil 60,322 17.0% 25,400 21.0%
Total DC Key Markets 7,470,923 5.8% 2,172,600 8.0%
Sources: Statistics Canada, Frontier counts, custom tabulations.Australian Bureau of Statistics, Overseas Arrivals and Departures, cat. no. 3401.0.
COMPETITIVE REVIEW
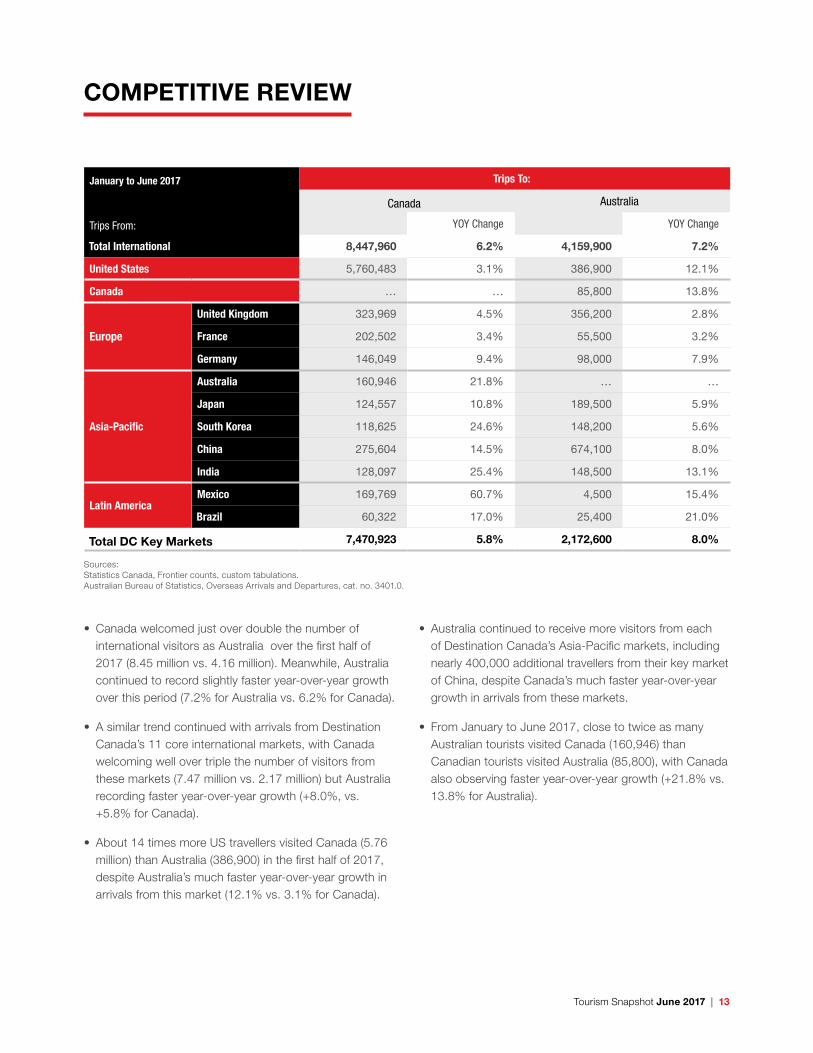
• Canada welcomed just over double the number of international visitors as Australia over the first half of 2017 (8.45 million vs. 4.16 million). Meanwhile, Australia continued to record slightly faster year-over-year growth over this period (7.2% for Australia vs. 6.2% for Canada).
• A similar trend continued with arrivals from Destination Canada’s 11 core international markets, with Canada welcoming well over triple the number of visitors from these markets (7.47 million vs. 2.17 million) but Australia recording faster year-over-year growth (+8.0%, vs. +5.8% for Canada).
• About 14 times more US travellers visited Canada (5.76 million) than Australia (386,900) in the first half of 2017, despite Australia’s much faster year-over-year growth in arrivals from this market (12.1% vs. 3.1% for Canada).
• Australia continued to receive more visitors from each of Destination Canada’s Asia-Pacific markets, including nearly 400,000 additional travellers from their key market of China, despite Canada’s much faster year-over-year growth in arrivals from these markets.
• From January to June 2017, close to twice as many Australian tourists visited Canada (160,946) than Canadian tourists visited Australia (85,800), with Canada also observing faster year-over-year growth (+21.8% vs. 13.8% for Australia).
14 | Tourism Snapshot June 2017
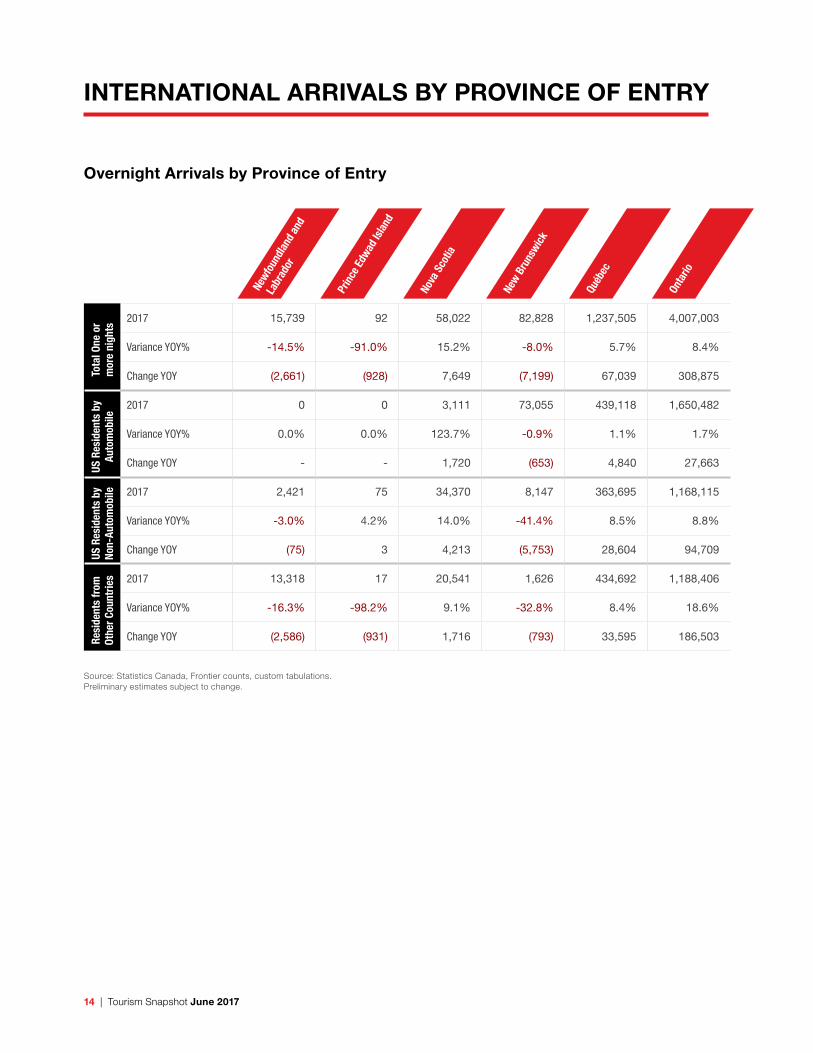
Overnight Arrivals by Province of Entry
Newfo
undl
and
and
Labr
ador
Prin
ce E
dwad
Isla
nd
Nova
Sco
tia
New B
runs
wick
Québ
ec
Onta
rio
Tota
l One
or
mor
e ni
ghts
2017 15,739 92 58,022 82,828 1,237,505 4,007,003
Variance YOY% -14.5% -91.0% 15.2% -8.0% 5.7% 8.4%
Change YOY (2,661) (928) 7,649 (7,199) 67,039 308,875
US R
esid
ents
by
Auto
mob
ile
2017 0 0 3,111 73,055 439,118 1,650,482
Variance YOY% 0.0% 0.0% 123.7% -0.9% 1.1% 1.7%
Change YOY - - 1,720 (653) 4,840 27,663
US R
esid
ents
by
No
n-Au
tom
obile 2017 2,421 75 34,370 8,147 363,695 1,168,115
Variance YOY% -3.0% 4.2% 14.0% -41.4% 8.5% 8.8%
Change YOY (75) 3 4,213 (5,753) 28,604 94,709
Resi
dent
s fr
om
Othe
r Cou
ntrie
s 2017 13,318 17 20,541 1,626 434,692 1,188,406
Variance YOY% -16.3% -98.2% 9.1% -32.8% 8.4% 18.6%
Change YOY (2,586) (931) 1,716 (793) 33,595 186,503
Source: Statistics Canada, Frontier counts, custom tabulations. Preliminary estimates subject to change.
INTERNATIONAL ARRIVALS BY PROVINCE OF ENTRY

Tourism Snapshot June 2017 | 15
Overnight Arrivals by Province of Entry
Man
itoba
Sask
atch
ewan
Albe
rta
Briti
sh C
olum
bia
Yuko
n
CANA
DA
Tota
l One
or
mor
e ni
ghts
2017 94,829 30,590 434,445 2,426,224 60,683 8,447,960
Variance YOY% 1.6% -15.6% 7.1% 4.1% -0.8% 6.2%
Change YOY 1,480 (5,663) 28,661 94,618 (516) 491,355
US R
esid
ents
by
Auto
mob
ile
2017 63,670 22,249 55,804 813,910 28,629 3,150,028
Variance YOY% 8.0% 4.1% -1.0% -3.0% 5.9% 0.5%
Change YOY 4,735 871 (555) (25,436) 1,599 14,784
US R
esid
ents
by
No
n-Au
tom
obile 2017 28,238 7,396 240,766 731,358 25,874 2,610,455
Variance YOY% -8.4% -45.2% 8.3% 4.6% -9.2% 6.6%
Change YOY (2,602) (6,097) 18,407 31,917 (2,618) 160,708
Resi
dent
s fr
om
Othe
r Cou
ntrie
s 2017 2,921 945 137,875 880,956 6,180 2,687,477
Variance YOY% -18.3% -31.6% 8.5% 11.1% 8.9% 13.3%
Change YOY (653) (437) 10,809 88,137 503 315,863
• Ontario remained the most popular provincial entry point for international visitors to Canada over the first half of 2017, with approximately 47% of arrivals (4.01 million visitors) crossing the border there, up 8.4% over the first half of 2016.
• Year-over-year growth in international arrivals was primarily concentrated in Ontario (+308,875 additional visitors), British Columbia (+94,618), Quebec (+67,039) and Alberta (+28,661).
• In Ontario and Quebec this growth was apparent across overseas arrivals, US auto and US non-auto arrivals, whereas British Columbia and Alberta saw an increase in overseas and US non-auto arrivals outpacing slight declines in US auto arrivals.

16 | Tourism Snapshot June 2017
Overnight Trips by Canadians
June 2017 YOY % Variance Jan.- June 2017 YOY % Variance
United States 1,450,202 5.5 9,499,424 4.9
Other Countries 843,613 18.3 6,966,996 6.2
Total Trips from Canada 2,293,815 9.9 16,466,420 5.4
Source: Statistics Canada, International Travel Survey.Note: The figures are preliminary estimates and are subject to change.
• Following a downturn in May, overnight trips by Canadians to international destinations rebounded in June 2017 to reach 2,293,815, up 9.9% over June 2016. This jump was primarily driven by a sharp increase in Canadian trips to international destinations outside of the US in June (+18.3%), though Canadian trips to the US also increased significantly (+5.5%).
• In the first half of 2017, overnight trips by Canadians to international destinations, including the US, were up a strong 5.4%, including +4.9% to the US and +6.2% to overseas destinations.
• In June 2017, the Canadian Consumer Confidence Index (published by the Conference Board of Canada) was stable at an elevated 111.5, indicating that Canadians remain optimistic about spending.
CANADIAN OUTBOUND TRAVEL

Tourism Snapshot June 2017 | 17
Hotel Performance Indicators by Province
Occupancy Rates Average Daily Rate (ADR) Revenue Per Available Room (RevPAR)
June 2017
YOY^ Variance
Jan.- June
YOY^ Variance
June 2017
YOY % Variance
Jan.- June
YOY % Variance
June 2017
YOY % Variance
Jan.- June
YOY % Variance
Alberta1 58.6% 0.9 50.9% 0.2 $132.14 -3.4% $129.25 -1.5% $77.46 -1.9% $65.83 -1.1%
British Columbia 80.0% 2.4 67.2% 2.2 $186.29 7.9% $161.58 5.5% $149.10 11.3% $108.64 9.0%
Saskatchewan 58.8% -0.1 51.4% -1.8 $121.15 -6.3% $121.13 -5.1% $71.28 -6.5% $62.28 -8.3%
Manitoba 78.0% 6.9 67.2% 5.0 $127.20 -1.0% $122.59 1.0% $99.28 8.6% $82.34 9.2%
Ontario 76.2% 2.5 64.7% 1.7 $163.41 12.7% $148.52 7.1% $124.46 16.6% $96.16 9.9%
Quebec 77.9% 2.4 65.9% 2.9 $185.72 7.3% $159.12 5.4% $144.59 10.8% $104.91 10.3%
New Brunswick 68.9% 2.5 53.9% 2.4 $122.10 3.9% $115.41 3.2% $84.16 7.9% $62.18 7.9%
Nova Scotia 76.1% 2.5 60.7% 2.5 $147.85 7.7% $131.51 4.7% $112.44 11.3% $79.77 9.3%
Newfoundland 74.7% -5.2 58.6% 2.1 $158.20 -3.3% $140.58 -1.2% $118.15 -9.6% $82.38 2.4%
Prince Edward Island 74.5% 3.9 47.5% 1.1 $161.35 7.0% $123.62 4.8% $120.28 12.9% $58.76 7.4%
Northwest Territories 64.5% -2.9 67.5% -1.5 $144.53 -2.2% $145.18 -4.9% $93.17 -6.3% $97.95 -7.0%
Yukon 86.7% -4.0 62.9% -1.6 $145.47 9.0% $128.20 6.1% $126.19 4.1% $80.58 3.4%
Canada 73.2% 2.0 61.7% 1.6 $165.61 7.3% $147.93 4.5% $121.15 10.3% $91.22 7.2%
Note: Based on the operating results of 237,545 rooms (unweighted data).^ Percentage points. 1 Excluding Alberta resorts.
Source: CBRE Hotels with reproduction and use of information subject to CBRE Disclaimer / Terms of Use as detailed at www.cbre.ca.Users of this information are advised that CBRE Hotels does not represent the information contained herein to be definitive or all-inclusive. CBRE Hotels believes the information to be reliable, but is not responsible for errors or omissions.
ACCOMMODATION
• The National Occupancy Rate was up slightly year-over-year in June 2017, up 2.0 points at 73.2%, bringing the year-to-date occupancy rate for the first half of 2017 up to 61.7%, up 1.6 points year-over-year.
• Yukon (86.7%) recorded the highest provincial occupancy rate in June 2017, followed by British Columbia (80.0%) and Manitoba (78.0%). Year-to-date, Northwest Territories (67.5%) took the top spot, followed very closely by Manitoba and British Columbia (both at 67.2%). Manitoba also stood out with the strongest provincial year-over-year growth, both for the month of June (+6.9%) and over the first half of 2017 (+5.0%).
• British Columbia also recorded the highest average daily rates (ADR) and revenue per available room (RevPar), both for the month of June and year-to-date. For ADR, Quebec and Ontario were also top performers, with Ontario noting the strongest year-over-year growth. Meanwhile, Quebec and Yukon were among the highest for RevPar in June, with Quebec and Northwest Territories just behind BC year-to-date.
• Several provinces observed declines compared to 2016 performance across the various accommodation measures, including some of the top performers such as Yukon and Northwest Territories.

18 | Tourism Snapshot June 2017
ACCOMMODATION
Hotel Performance Indicators by Property Type
Occupancy Rates Average Daily Rate (ADR)
June 2017 YOY^ Change Jan.- June YOY^ Variance June 2017 YOY Variance Jan.- June YOY Variance
Property Size Under 50 rooms 60.2% 4.3 47.2% 2.5 $116.24 3.8% $107.01 4.0%
50-75 rooms 67.4% 3.0 54.6% 1.8 $121.96 2.5% $110.94 1.6%
76-125 rooms 70.9% 2.9 59.6% 1.9 $136.09 3.8% $125.66 2.2%
126-200 rooms 74.0% 2.0 62.8% 1.6 $149.34 6.7% $136.12 4.9%
201-500 rooms 76.0% 0.7 65.4% 0.9 $199.07 10.4% $174.93 6.0%
Over 500 rooms 83.8% 0.3 70.8% 1.6 $258.99 13.2% $215.36 8.3%
Total 73.2% 2.0 61.7% 1.6 $165.61 7.3% $147.93 4.5%
Property Type Limited Service 67.2% 2.9 56.1% 1.9 $120.95 4.5% $113.73 2.7%
Full Service 76.7% 1.5 64.5% 1.2 $183.65 9.5% $159.68 5.5%
Suite Hotel 80.5% 1.0 71.3% 1.7 $169.51 3.5% $153.17 3.2%
Resort 71.5% 1.4 60.2% 2.4 $252.87 8.0% $225.87 6.9%
Total 73.2% 2.0 61.7% 1.6 $165.61 7.3% $147.93 4.5%
Price Level Budget 66.1% 3.4 54.9% 2.6 $107.20 10.1% $97.30 6.5%
Mid-Price 73.9% 1.5 62.5% 1.0 $156.08 5.7% $140.65 3.6%
Upscale 80.5% 1.2 68.0% 1.9 $279.99 9.5% $239.97 6.0%
Total 73.2% 2.0 61.7% 1.6 $165.61 7.3% $147.93 4.5%
Note: Based on the operating results of 237,545 rooms (unweighted data).^ Percentage points.
• As observed previously in 2017, both occupancy rate and ADR increased with the size of the property, with the largest properties (500+ rooms) reporting the highest occupancy rates (83.8% in June, 70.8% YTD) and average daily rates ($258.99 in June, $215.36 YTD). These largest properties also recorded very strong year-over-year growth in ADR (+13.2% in June, +8.3% YTD), whereas the smallest properties (<50 rooms) recorded the strongest growth in occupancy (+4.3 points in June, +2.5 points YTD).
• Suite hotels continued to record the highest occupancy rates (80.5% in June, 71.3% YTD), while resorts reported the highest ADR ($252.87 in June, $225.87 YTD).
• In terms of price level, upscale properties continued to report the highest occupancy rates (80.5% in June, 68.0% YTD) and ADR ($279.99 in June, $239.97 YTD), though both were outpaced by budget hotels in year-over-year growth.
DC CONSUMER AND MARKET INTELLIGENCE