monterey park introduction to districting
TRANSCRIPT
Monterey Park Introduction to Districting
December 19, 2018

California Voting Rights Act (CVRA)
December 19, 2018
Under the Federal Voting Rights Act (passed in 1965), a jurisdiction must
fail 4 factual tests before it is in violation of the law.
The California VRA makes it significantly easier for plaintiffs to force
jurisdictions into “by-district” election systems by eliminating two of the
US Supreme Court Gingles tests:
1. Can the protected class constitute the majority of a district?
2. Does the protected class vote as a bloc?
3. Do the voters who are not in the protected class vote in a bloc to defeat the
preferred candidates of the protected class?
4. Do the “totality of circumstances” indicate race is a factor in elections?
Liability is now determined only by the presence of racially polarized
voting
2
CVRA Impact
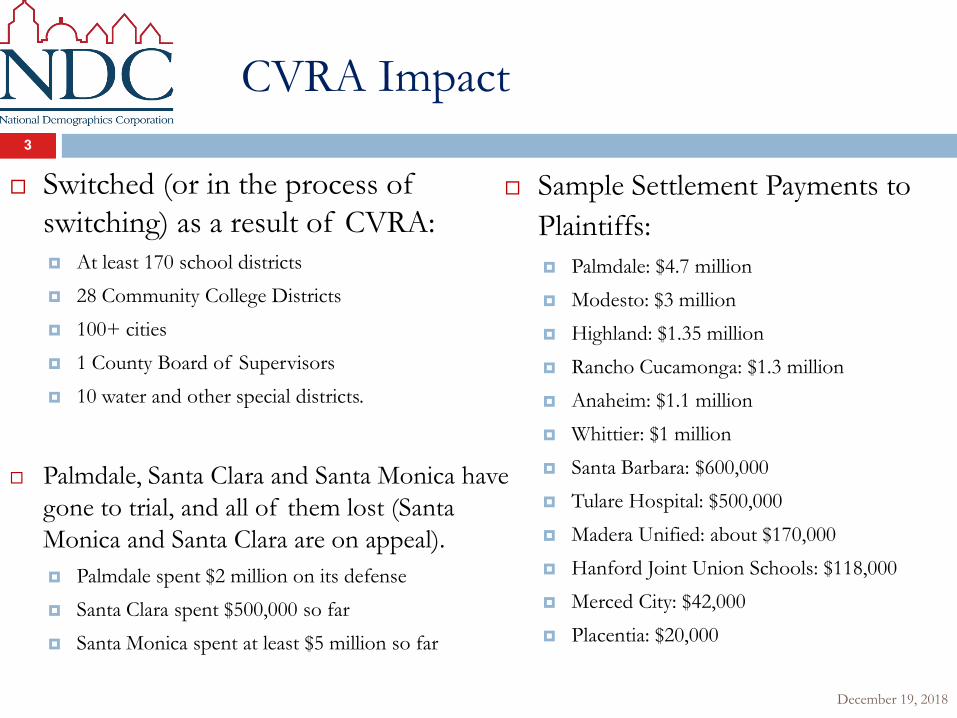
Switched (or in the process of
switching) as a result of CVRA: At least 170 school districts
28 Community College Districts
100+ cities
1 County Board of Supervisors
10 water and other special districts.
Palmdale, Santa Clara and Santa Monica have
gone to trial, and all of them lost (Santa
Monica and Santa Clara are on appeal).
Palmdale spent $2 million on its defense
Santa Clara spent $500,000 so far
Santa Monica spent at least $5 million so far
Sample Settlement Payments to
Plaintiffs:
Palmdale: $4.7 million
Modesto: $3 million
Highland: $1.35 million
Rancho Cucamonga: $1.3 million
Anaheim: $1.1 million
Whittier: $1 million
Santa Barbara: $600,000
Tulare Hospital: $500,000
Madera Unified: about $170,000
Hanford Joint Union Schools: $118,000
Merced City: $42,000
Placentia: $20,000
December 19, 2018
3
Districting Process
4
December 19, 2018
Step Description
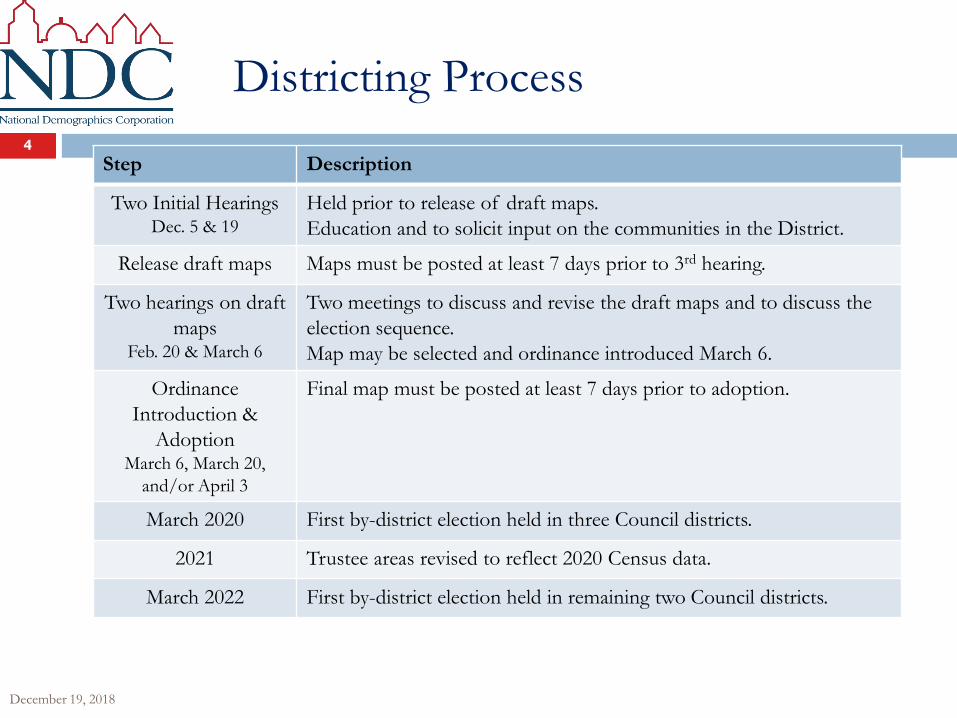
Two Initial Hearings Dec. 5 & 19
Held prior to release of draft maps.
Education and to solicit input on the communities in the District.
Release draft maps Maps must be posted at least 7 days prior to 3rd hearing.
Two hearings on draft
maps Feb. 20 & March 6
Two meetings to discuss and revise the draft maps and to discuss the
election sequence.
Map may be selected and ordinance introduced March 6.
Ordinance
Introduction &
Adoption March 6, March 20,
and/or April 3
Final map must be posted at least 7 days prior to adoption.
March 2020 First by-district election held in three Council districts.
2021 Trustee areas revised to reflect 2020 Census data.
March 2022 First by-district election held in remaining two Council districts.

Districting Rules
Equal Population
Federal Voting Rights Act
No Racial Gerrymandering
Communities of interest
Compact
Contiguous
Visible (Natural & man-made)
boundaries
Respect voters’ choices /
continuity in office
Planned future growth
Federal Laws Traditional Redistricting Principles
5
December 19, 2018

December 19, 2018
Demographic
Summary
6
Latinos are 27% of the 2010
Census total population and
29% of the eligible voters
(measured by 2012-2016 Citizen
Voting Age Population data).
Asian-Americans are 67% of
total population and 65% of
eligible voters.
African-Americans are 0% of
total population and 1% of
eligible voters.
If there are 4 districts, each
must have about 15,067
residents. If 5 districts, each
needs about 12,054 residents.
Category Field Count Pct Category Field Count Pct
Total Pop 60,269 ACS Pop. Est. Total 61,303
Hisp 16,218 27% age0-19 11,629 19%
NH White 2,998 5% age20-60 33,729 55%
NH Black 220 0% age60plus 15,945 26%
Asian-American 40,350 67% immigrants 32,879 54%
Total 39,305 naturalized 21,038 64%
Hisp 11,267 29% english 14,153 24%
NH White 2,154 5% spanish 11,782 20%
NH Black 222 1% asian-lang 32,138 55%
Asian/Pac.Isl. 25,394 65% other lang 487 1%
Total 27,960 Language FluencySpeaks Eng. "Less
than Very Well"24,430 42%
Latino est. 9,163 33% hs-grad 22,103 48%
Spanish-Surnamed 8,231 29% bachelor 9,671 21%
Asian-Surnamed 13,383 48% graduatedegree 4,288 9%
Filipino-Surnamed 321 1% Child in Household child-under18 5,142 26%
NH White est. 4,355 16%Pct of Pop. Age
16+employed 27,568 53%
NH Black 261 1% income 0-25k 5,017 26%
Total 17,342 income 25-50k 4,305 22%
Latino est. 6,480 37% income 50-75k 2,998 15%
Spanish-Surnamed 5,821 34% income 75-200k 6,028 31%
Asian-Surnamed 7,477 43% income 200k-plus 1,296 7%
Filipino-Surnamed 190 1% single family 14,101 67%
NH White est. 2,741 16% multi-family 6,958 33%
NH Black 163 1% rented 9,545 49%
Total 7,269 owned 10,100 51%
Latino est. 2,396 33%
Spanish-Surnamed 2,155 30%
Asian-Surnamed 3,210 44%
Filipino-Surnamed 84 1%
NH White est. 1,439 20%
NH Black est. 51 1%
Housing Stats
Household Income
Education (among
those age 25+)
Total Pop
Immigration
Citizen Voting Age
Pop
Age
Voter Registration
(Nov 2016)
Voter Turnout
(Nov 2016)
Voter Turnout
(Nov 2014)
Language spoken at
home

December 19, 2018
7
Latino Population Concentrations
Latino eligible voters are concentrated on the south side of the City.
December 19, 2018
8
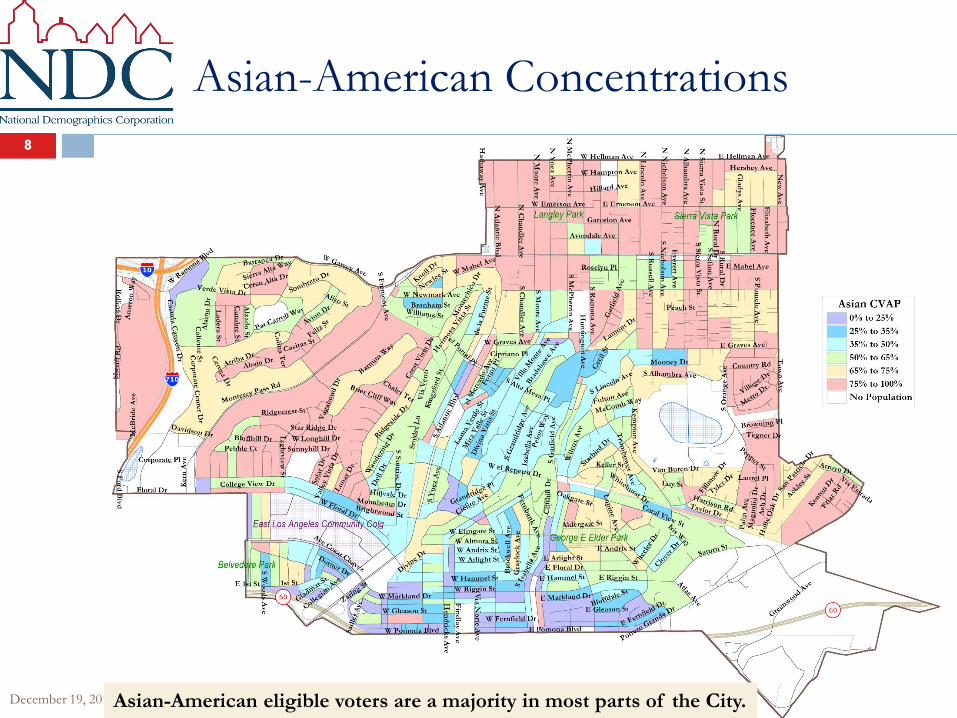
Asian-American Concentrations
Asian-American eligible voters are a majority in most parts of the City.
Defining Communities of Interest
December 19, 2018
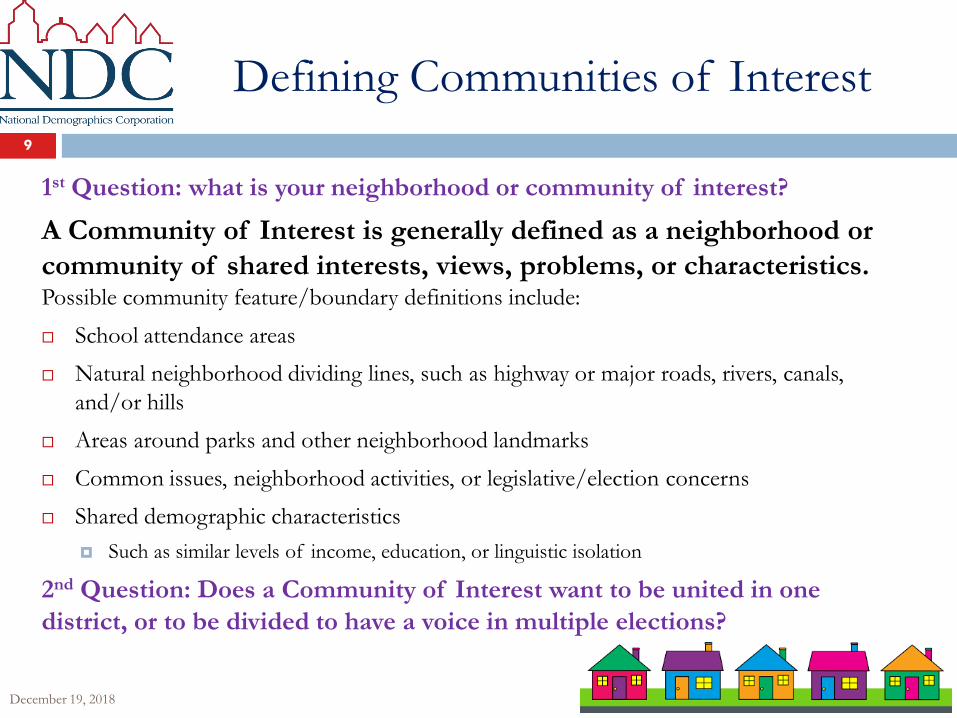
1st Question: what is your neighborhood or community of interest?
A Community of Interest is generally defined as a neighborhood or
community of shared interests, views, problems, or characteristics. Possible community feature/boundary definitions include:
School attendance areas
Natural neighborhood dividing lines, such as highway or major roads, rivers, canals,
and/or hills
Areas around parks and other neighborhood landmarks
Common issues, neighborhood activities, or legislative/election concerns
Shared demographic characteristics
Such as similar levels of income, education, or linguistic isolation
2nd Question: Does a Community of Interest want to be united in one
district, or to be divided to have a voice in multiple elections?
9
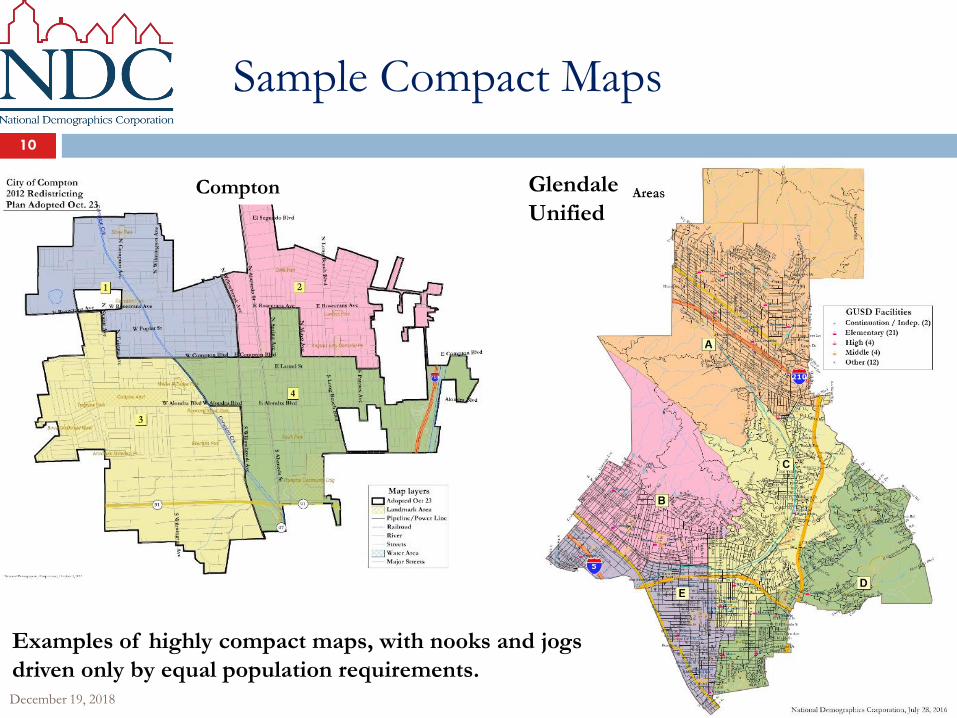
Sample Compact Maps
December 19, 2018
10
Glendale
Unified Compton
Examples of highly compact maps, with nooks and jogs
driven only by equal population requirements.

Sample Multiple-Representative Maps
December 19, 2018
11
Central Unified
Pasadena
Colorado Blvd.
Examples of maps where a desire
to have all members touch
downtown (Pasadena) or rural
areas (Central), or as many
neighborhoods as possible
(South Pas), led to
policy-driven but
non-compact maps.
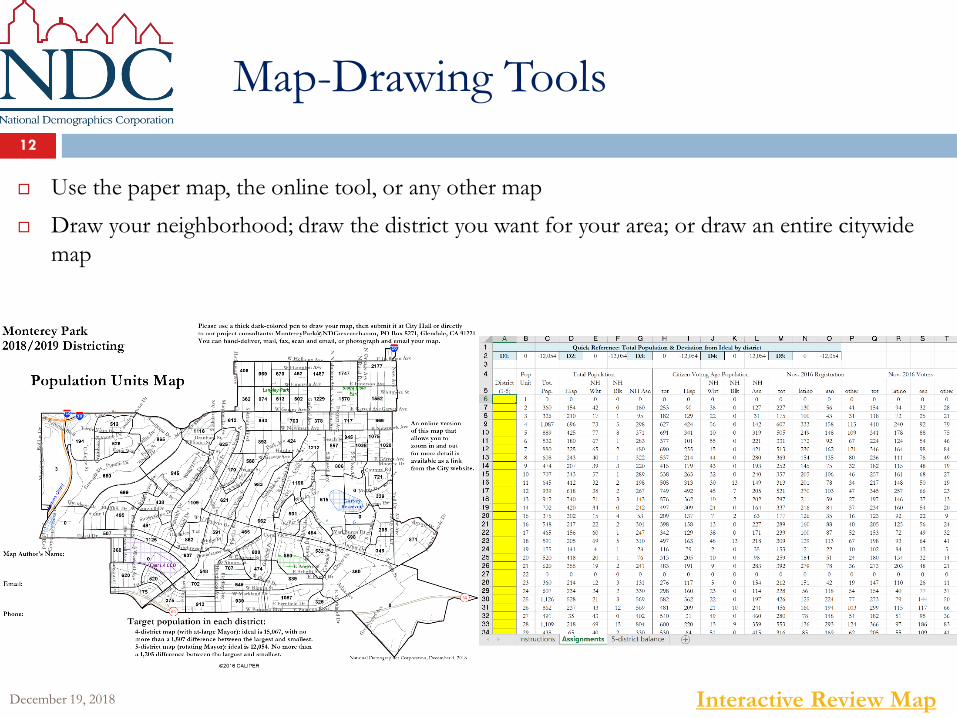
Map-Drawing Tools
December 19, 2018
Use the paper map, the online tool, or any other map
Draw your neighborhood; draw the district you want for your area; or draw an entire citywide
map
12
Interactive Review Map
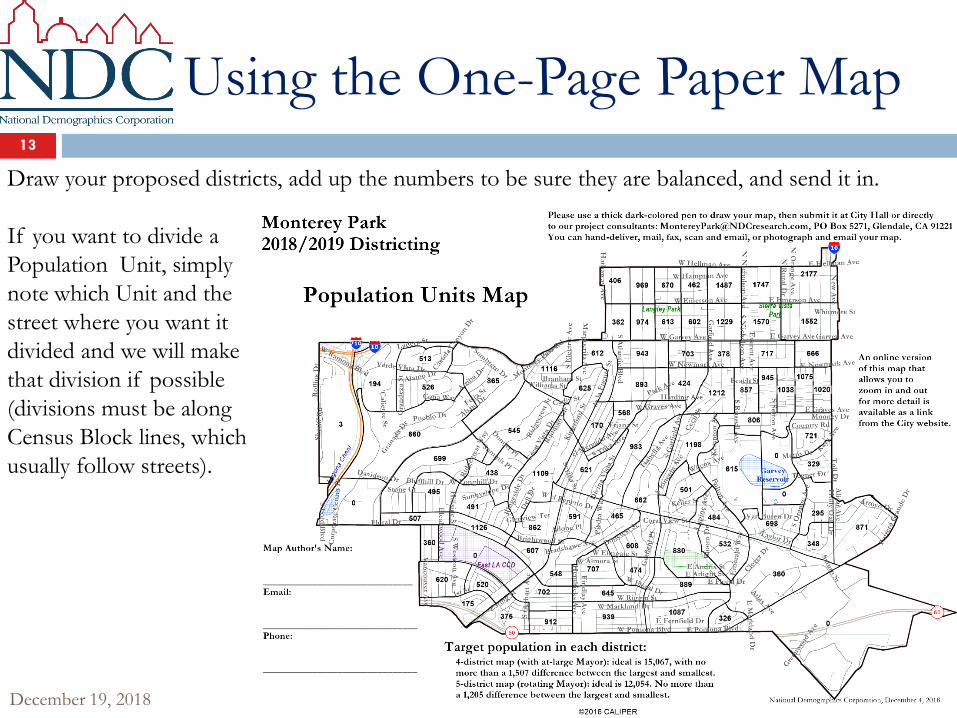
Using the One-Page Paper Map
December 19, 2018
13
Draw your proposed districts, add up the numbers to be sure they are balanced, and send it in.
If you want to divide a
Population Unit, simply
note which Unit and the
street where you want it
divided and we will make
that division if possible
(divisions must be along
Census Block lines, which
usually follow streets).
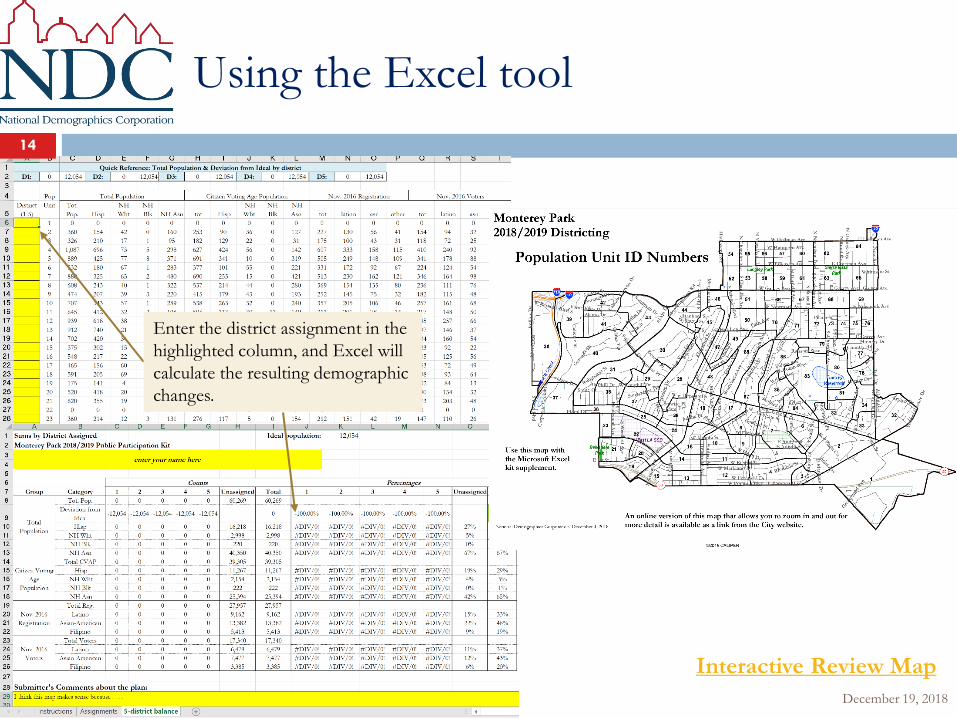
Using the Excel tool
14
Enter the district assignment in the
highlighted column, and Excel will
calculate the resulting demographic
changes.
December 19, 2018
Interactive Review Map

Public Hearing & Discussion
December 19, 2018
15
1. What is your neighborhood or “community of interest”?
2. Do you prefer your neighborhood be kept together in one
trustee area or to have multiple representatives?
3. What are other communities of interest in the District that
should be considered when drafting maps?