monitoring heritage buildings with wireless sensor ...disi.unitn.it/~picco/papers/tower.pdf ·...
TRANSCRIPT

Monitoring Heritage Buildings withWireless Sensor Networks: The Torre Aquila Deployment
Matteo Ceriotti1,2, Luca Mottola1,2, Gian Pietro Picco1, Amy L. Murphy2, Stefan Guna1,Michele Corrà3, Matteo Pozzi4, Daniele Zonta4, Paolo Zanon4
1Dip. di Ingegneria e Scienza dell’Informazione, University of Trento, Italy2Bruno Kessler Foundation—IRST, Trento, Italy 3TRETEC S.r.l., Trento, Italy
4Dip. di Ingegneria Meccanica e Strutturale, University of Trento, Italy
ABSTRACTWireless sensor networks are untethered infrastructures thatare easy to deploy and have limited visual impact—a key as-set in monitoring heritage buildings of artistic interest. Thispaper describes one such system deployed in Torre Aquila,a medieval tower in Trento (Italy). Our contributions rangefrom the hardware to the graphical front-end. Customizedhardware deals efficiently with high-volume vibration data,and specially-designed sensors acquire the building’s defor-mation. Dedicated software services provide: i) data collec-tion, to efficiently reconcile the diverse data rates and relia-bility needs of heterogeneous sensors; ii) data dissemination,to spread configuration changes and enable remote tasking;iii) time synchronization, with low memory demands. Un-like most deployments, built directly on the operating sys-tem, our entire software layer sits atop our TeenyLIME mid-dleware. Based on 4 months of operation, we show that oursystem is an effective tool for assessing the tower’s stability,as it delivers data reliably (with loss ratios <0.01%) and hasan estimated lifetime beyond one year.
Categories and Subject DescriptorsC.2.2 [Computer-Communication Networks]: Network Pro-tocols—Routing protocols; D.1.0 [Programming Techniques]:Concurrent Programming—Distributed programming
General TermsDesign, Experimentation, Measurement
KeywordsWireless sensor networks, Heritage buildings, Middleware
Permission to make digital or hard copies of all or part of this work forpersonal or classroom use is granted without fee provided that copies arenot made or distributed for profit or commercial advantage and that copiesbear this notice and the full citation on the first page. To copy otherwise, torepublish, to post on servers or to redistribute to lists, requires prior specificpermission and/or a fee.IPSN’09, April 15–18, 2009, San Francisco, California, USA.Copyright 2009 ACM 978-1-60558-371-6/09/04 ...$5.00.
(a) External view.
!
!
!"#$%&'#()*+%,-#*.(/+#*+#*0&%"(1*2*3451-()*+#*6",%,"%*0%5"1-1,#%*+#'(/#(%*8%&*#-*91"#(1&4,,#1*'(&/((/&4-%*+#*%+#:#5#*'(1#*
*
!
*;<*
-=4'8%((1>*./55%''#$#*+%(%&49%"(#*'#*%77%&1*'18&4((/((1*?/4"+1*+/&4"(%*-=@((15%"(1*%*#-*8[*A1$%5%"(1*#-*B4'(%--1*$%""%*/(#-#CC4(1*519%*54'%&94>*
*
** **
** *!! !
"#$%!&%'(!)#*+,!-.#!/.0#1!234.5.!605!.!7,4-1!89.05!.!:;-!<((=!
*A%-*A1$%5%"(1*(/((4$#4*-%*8#((/&%*$%""%&1*'1((181'(%*4*+/%*&%'(4/&#D*#-*8[*:/*4((/4(1*(&4*,-#*
4""#*E%"(#*%*0&%"(4*'1((1*-4*+#&%C#1"%*+#*F#/'%88%*F%&1-4G*#-*'%51"+1G*8&191''1*%*:#"4"C#4(1*+4-2-4*31"+4C#1"%*H&51-%*E4&C#G*:/*%::%((/4(1*"%-*;IJK*+4*L%1"%((1*0#"(1&#>*
M>N>O! >?5.49.?5#!-#!4.053;4,!*P4-*'%51-1*'51&'1*4#*,#1&"#*"1'(&#*+#$%&'#*'1"1*,-#*#"(%&$%"(#*+#*$4*"4(/&4*5Q%*Q4""1*#"(%&%''4(1*-4*'(&/((/&4*#"*%'49%G*%*+#*%''#*'#*8/R*(&1$4&%*/"=498#4*+15/9%"(4C#1"%*8&%''1*-=4&5Q#$#1*'(13*+%--4*.18&#"(%"+%"C4*8%&*#*7%"#*4&5Q#(%((1"#5#*SMTGSOTGSNTGSUTGS<T>*
!
*!
"#$%!&%'@!A#3?,!-#!#?5.49.?5,!-.+!'B'(1!.054355,!4.+3C#,?.!/%!:3?-,?D!<(=!
!
!
!"#$%&'#()*+%,-#*.(/+#*+#*0&%"(1*2*3451-()*+#*6",%,"%*0%5"1-1,#%*+#'(/#(%*8%&*#-*91"#(1&4,,#1*'(&/((/&4-%*+#*%+#:#5#*'(1#*
*
!
*;<*
-=4'8%((1>*./55%''#$#*+%(%&49%"(#*'#*%77%&1*'18&4((/((1*?/4"+1*+/&4"(%*-=@((15%"(1*%*#-*8[*A1$%5%"(1*#-*B4'(%--1*$%""%*/(#-#CC4(1*519%*54'%&94>*
*
** **
** *!! !
"#$%!&%'(!)#*+,!-.#!/.0#1!234.5.!605!.!7,4-1!89.05!.!:;-!<((=!
*A%-*A1$%5%"(1*(/((4$#4*-%*8#((/&%*$%""%&1*'1((181'(%*4*+/%*&%'(4/&#D*#-*8[*:/*4((/4(1*(&4*,-#*
4""#*E%"(#*%*0&%"(4*'1((1*-4*+#&%C#1"%*+#*F#/'%88%*F%&1-4G*#-*'%51"+1G*8&191''1*%*:#"4"C#4(1*+4-2-4*31"+4C#1"%*H&51-%*E4&C#G*:/*%::%((/4(1*"%-*;IJK*+4*L%1"%((1*0#"(1&#>*
M>N>O! >?5.49.?5#!-#!4.053;4,!*P4-*'%51-1*'51&'1*4#*,#1&"#*"1'(&#*+#$%&'#*'1"1*,-#*#"(%&$%"(#*+#*$4*"4(/&4*5Q%*Q4""1*#"(%&%''4(1*-4*'(&/((/&4*#"*%'49%G*%*+#*%''#*'#*8/R*(&1$4&%*/"=498#4*+15/9%"(4C#1"%*8&%''1*-=4&5Q#$#1*'(13*+%--4*.18&#"(%"+%"C4*8%&*#*7%"#*4&5Q#(%((1"#5#*SMTGSOTGSNTGSUTGS<T>*
!
*!
"#$%!&%'@!A#3?,!-#!#?5.49.?5,!-.+!'B'(1!.054355,!4.+3C#,?.!/%!:3?-,?D!<(=!
(b) Inside views.Figure 1: Torre Aquila.
1. INTRODUCTIONHeritage buildings are a fundamental constituent of a coun-
try’s historical memory. Their preservation is thus a majorconcern. Planning the maintenance of such structures re-quires a careful assessment of their structural integrity, alongwith a precise and quantitative understanding of the factorsthat may affect them. The latter is traditionally achievedthrough sensors and data loggers monitoring quantities suchas vibrations, temperature, and humidity. However, these de-vices are typically cumbersome to deploy, as they requirea nearby power outlet or extensive wiring. Therefore, theirnumber is limited, and so is the monitoring: this is especiallytrue in buildings containing works of art, due to the visualimpact and physical encumbrance of the instrumentation.
In this context, wireless sensor networks (WSNs) enableradically different solutions overcoming the above limita-tions. Small, self-powered nodes relying on radio commu-nication reduce the invasiveness of the system, allow the de-ployment of more devices, and enable experimenting withdifferent configurations of the sensing infrastructure.
Torre Aquila. The above requirements were evident in TorreAquila, where we conducted the study reported in this pa-

per. Located in the city of Trento (Italy) close to the Buon-consiglio Castle, it is a 31 meter-tall medieval tower whose2nd floor contains “Il ciclo dei mesi” (“The Cycle of theMonths”), a series of internationally-renowned frescoes thatrepresent a unique example of non-religious medieval paint-ing in Europe, attracting thousands of visitors every year.The tower and some of the frescoes are shown in Figure 1.
The preservation of the frescoes is the main source of con-cern for the local conservation board. In ancient times TorreAquila represented the main entrance to the city from theEast: with the expansion of the city in the second half ofthe 19th century, most of the eastern city wall was demol-ished and the entrance to the city was moved a few hundredmeters south of the original gate. Today this solution is in-adequate for the increasing vehicular traffic. The solution tothis problem, pursued by the Municipality of Trento, is to by-pass the obstacle of the Castle compound with a road tunnel.The construction of the tunnel has been long delayed dueto concern by the conservation board that construction workmight cause unwanted settlement of the tower foundations.The timely estimation of the potential risk to the frescoes re-quires real-time monitoring and appropriate response modelsto reproduce the structural behavior of the tower.
Peculiarity of the WSN deployment. The use of WSN formonitoring the integrity of civil structures is not new, as wediscuss in Section 2. Nonetheless, Torre Aquila poses pecu-liar challenges that are not usually found in the deploymentsreported in the literature:
• Heterogeneity. The system contains many kinds of sen-sors, whose operation is quite different. Deformationand environmental parameters can be sampled at a lowrate, but vibration must be monitored at a high rate,which consequently demands efficient reporting of theresulting high volume of data. Both modalities mustgracefully co-exist in the same sensing infrastructure.
• Temporal span. The time constants of the phenomenaof interest require monitoring to span months or evenyears. In contrast, the systems found in the literaturetypically operate for at most a few weeks.
• Online tasking. The ability to change the behavior ofthe sensing infrastructure based on external input canbe very useful. For instance, it is interesting to monitorvibrations when a visit by a large group of people isexpected, or when strong winds are forecast.
Contribution. In this paper, we present the hardware/soft-ware solution we developed to efficiently address the aboverequirements for monitoring Torre Aquila.
The hardware core is based on TMote-like devices, cus-tomized as illustrated in Section 3. Deformation measure-ments are acquired by fiber optic sensors stretching the lengthof the tower. These sensors, developed especially for our de-ployment, required custom integration with the motes used to
report the measurements. Moreover, high-rate sampling andreporting of vibration data demanded buffering into a short-term storage. The flash memory usually found in motes is ill-suited for this task, due to its high latency, energy consump-tion, and limited number of writes. Hence, we integratedon the mote a 32 Kbyte FRAM (Ferromagnetic RAM) chip,overcoming all of these problems. To the best of our knowl-edge, we are the first to use FRAMs in a WSN deployment.
Unlike the hardware, our software layer is not based onwhat can be considered a “standard” core. Instead of devel-oping directly on top of the operating system, we chose toempower our developers with the higher level of abstractionprovided by a WSN middleware, TeenyLIME [5]. We are un-aware of studies reporting the use of a WSN middleware inthe context of a real-world, long-running deployment. More-over, as illustrated in Section 4, our use of middleware is notlimited to the application logic: the lower-level services nec-essary to the system operation (i.e., data collection, data dis-semination, and time synchronization) are all implementeddirectly on top of TeenyLIME.
Deployment details such as the placement of nodes andsensors are reported in Section 5. In the same section, weshow and interpret data gathered during 4 months of oper-ation, as an example of the insights gained about the towerstatus. After looking at our implementation from the end-user’s perspective, Section 6 analyzes it from a system one.We evaluate the system performance w.r.t. data delivery andlifetime—often considered key metrics in WSN deployments—showing that our implementation achieves a data deliveryclose to 100% while working at very low power. Moreover,we discuss the benefits brought to development by the use ofour middleware, in terms of reduction of programming effortand code reuse.
Section 7 contains brief concluding remarks along withour plans for future work.
2. RELATED WORKIn [10], the authors note that WSN deployments to date
can be divided in two categories: environmental monitoringapplications (e.g., [15]), designed with low-power operationallowing them to run for long periods, and high-rate, high-fidelity ones running only for a relatively short time. Thedeployment in Torre Aquila inherits challenges from bothclasses, as we must deal with high-rate data and yet the sys-tem is required to operate for long periods.
In general, although WSNs have been used for monitoringcivil structures [10,3,13,7,22,4], the combination of require-ments we must address is unique. For instance, only a hand-ful of the systems surveyed in [13] can be tasked remotely,and in these cases (e.g., [4]) the implementation lacks sup-port for low-power operations, hampering their use in long-running deployments. Similarly, most deployments deal onlywith monitoring vibrations [13], without the increased com-plexity due to heterogeneous sensors, as in Torre Aquila.

In some cases, the hardware is designed bottom-up for agiven deployment. For instance, the work in [10] uses di-rectional antennas, motivated by the peculiar shape of thetarget area. We cannot afford the luxury of fixing the net-work topology, as structural engineers are likely to relocatethe nodes over time. Moreover, the nodes used by [10] cost!$600 each, which in our case would make the WSN solu-tion not cost-effective compared to a traditional one. Instead,one of our customized nodes costs !$120.
On the software side, real-world deployments mostly fea-ture ad-hoc implementations [10, 13, 22], which make verydifficult extending or adapting their functionality to differentscenarios. Moreover, where higher-level approaches havebeen proposed [7,4] the deployments targeted short-term use.Our middleware-based one sustains good performance overa long time span, and yet fosters component reuse in otherscenarios, as we discuss in Section 6.
In summary, our goals set us apart from the state-of-the-art. We are neither confirming with a proof-of-concept “theeventual ability to cover a large civil structure with low-costwireless sensors” [3] nor we are validating already knownmodels using WSNs instead of conventional systems [10].Our requirements, set by the structural engineers on our team,are instead to design, implement, and deploy an operationalsystem that, by delivering good performance over a long pe-riod, helps them to assess the status of Torre Aquila. The restof the paper describes how we achieve this goal.
3. HARDWAREOur requirements demand customized hardware. We se-
lected as the core platform 3MATE! nodes, developed byTRETEC (www.3tec.it), an easily extensible WSN nodesimilar to TMotes [18], shown in Figure 2(a). The base3MATE! is equipped with a TI MSP430 CPU, a ChipCon2420 radio, and an inverted-F microstrip antenna. Differ-ently from TMotes, the USB interface can be detached if notneeded, reducing power consumption once deployed, and theboard layout is designed to easily accommodate customizedextension boards. Co-location with the manufacturer helpedus to accommodate rapidly the needs of our deployment. Thenodes have been customized differently according to theirsensing goals, as described next.
Environmental nodes. We developed a 3MATE! extensionboard for environmental monitoring, equipped with simpleanalog temperature, relative humidity, and light sensors. Inthe deployment reported in Section 5, however, temperaturewas the only measure required by the end user. Sensitivity totemperature ranges from "40!C to 125!C with a typical ac-curacy of 0.5!C. This is sufficient to study phenomena suchas temperature gradients across different floors.
Deformation nodes. To study the tower deformation, werequired a minimally-invasive solution with very high pre-cision. We developed a dedicated Fiber Optic Sensor (FOS)
FRAM
chip
(a) 3MATE! node.
Gumstix
WiFi
antenna
3MATE!
(b) Gumstix device as sink.
Optic
cable
Sensor3MATE!
(c) Fiber optic sensor.
3MATE!
Sensor
(d) Acceleration node and calibration.
Figure 2: Custom WSN hardware for Torre Aquila.
and the corresponding 3MATE! extension board, both shownin Figure 2(c). The sensor and its microcontroller-based con-trol electronics, developed by TRETEC and University ofTrento, work by differentially measuring the time taken fora laser pulse to travel through a pair of fiber optic cableswrapped around the monitored object. As the latter deforms,the cable stretches, modifying the travel time of the pulse.This solution is immune to electromagnetic noise and canbe used to measure deformation on different physical scales,e.g., from individual walls to entire buildings.
The FOS is composed of a read-out unit with a synchronouslaser pulser and a high-resolution optical receiver, and theoptical path formed by fiber optic cables and splitters. Dif-ferently from all other sensors in Torre Aquila, the charac-teristics of FOS electronics require external power to ensure

a stable measurement. The expansion board contains also atemperature sensor similar to the ones above, useful to cor-relate deformation with temperature in the same location.
Acceleration nodes. To measure vibration we used an ana-log, ultra-compact, tri-axial acceleration MEMS sensor (STLIS3L02AL), integrated on a custom 3MATE! board con-nected through an extension cable that allows the sensor to beplaced outside the node package, as illustrated in Figure 2(d).The sensor features a full range of ±2 g and is capable ofmeasuring accelerations over a bandwidth of 1.5 KHz, witha resolution of 1 mg over 100 Hz bandwidth. We computedcalibration coefficients for each sensor with induced vibra-tions at different frequencies and amplitudes using a shaketable and piezoelectric accelerometers for seismic vibrations,shown on the right of Figure 2(d).
High-volume data such as vibration pose severe demandson buffering space. Some deployments [10] use the flashchip on the mote as a temporary buffer. However, this is aviable option only if the system operates for a limited timespan, as the bound on the number of write operations even-tually results in corrupted data. Instead, we equipped the3MATE! with a FRAM chip, shown in Figure 2(a). Com-pared to flash memory, FRAM features lower power con-sumption, virtually unlimited write-erase cycles, and fasterwrite speed, enabling higher sampling rates. In our exper-iments, the flash could sustain at most 500 Hz sampling,whereas the FRAM allowed up to 1 KHz. Nonetheless, thestorage area provided by FRAM is generally smaller thanflash. In our case this is not an issue, as we use our 32 KbyteFRAM as a temporary buffer, freed progressively as data isreported to the sink, described next.
Sink node. In Torre Aquila, the sensed data converge fromall nodes to a sink where they are collected and stored, re-quiring a computing device with enough storage space andprocessing power. Moreover, this device must double as agateway to interconnect with the front-end, allowing remoteusers to interact with the system. Finally, the requirement toreduce invasiveness holds also for the sink.
To address these needs, we chose a Gumstix [8] device,shown in Figure 2(b). Gumstixs are easily customizable em-bedded PCs with a very small form factor. We equippedours with a board to use Secure Digital (SD) storage cards,a WiFi card to reach the external network, and a USB boardfor connecting a 3MATE! to access the WSN. As shown inFigure 2(b), the space required for this configuration is verysmall: it uses the same packaging of the WSN nodes.
4. SOFTWARE DESIGNThe design of WSN software is often characterized by ad-
hoc solutions built directly on top of the operating system.The consequence is that systems become difficult to maintainand reuse is hampered [19, 1]. In our deployment we took adifferent stand, and addressed since the beginning the chal-
TeenyLIME
Data Collection
Data Dissemination
TupleSpace TupleSpace
Sampling & Tasking
TupleSpace
Time Synchronization
TupleSpace
TinyOS
Figure 3: Software architecture.lenge of designing the software layer through higher-levelabstractions that simplify development and foster code reuse.
Architecture. Figure 3 shows the high-level architecture ofour software layer. The various macro-components inter-act exclusively through a shared memory space where datais read or written as tuples, sequences of typed fields. Thetuple space abstraction is provided by a middleware calledTeenyLIME [5], concisely described next. Its constructs areused to implement both application-level functionality (e.g.,sensor sampling) and system-level mechanisms (e.g., routingand time synchronization), providing a unifying high level ofabstraction throughout the software stack.
The reliance on this shared tuple space yields a highlydecoupled software configuration, boosting code reuse bothwithin and across deployments. For instance, the softwaredeployed on acceleration nodes differs from that of envi-ronmental nodes solely in the sampling functionality, whichinevitably depends on the quantity to sense. Moreover, itmakes it easier to design alternative deployments by remov-ing or replacing components, without affecting the others.
TeenyLime in a nutshell. As shown in Figure 4, in Teeny-LIME each node hosts a tuple space shared among 1-hopneighbors: a node perceives its tuple space as containingthe tuples stored locally plus those residing on its neigh-bors. Software components atop TeenyLIME interact locallyor across nodes by reading/writing tuples from/to the sharedtuple space. If needed, however, the read/write operationscan be scoped to access directly the local tuple space ofa neighbor. Read operations occur by requesting a matchagainst a pattern: its fields express a constraint on the fieldtype or value in the tuples being considered for matching.For instance, a pattern #"foo", ?integer$ matches the tuple#"foo", 20$ but not #"foo", "boo"$. Moreover, TeenyLIMEprovides a form of data listener called a reaction, a code
Local Tuple Space
Local TupleSpace
Communication Link BA C
Physical Node
Local Tuple Space
Shared Tuple Space at node B
Tuple Space
Local TupleSpace
BA C
Shared Tuple Space at node A
Local Tuple Space
Local TupleSpace
Figure 4: Tuple space sharing in TeenyLIME.
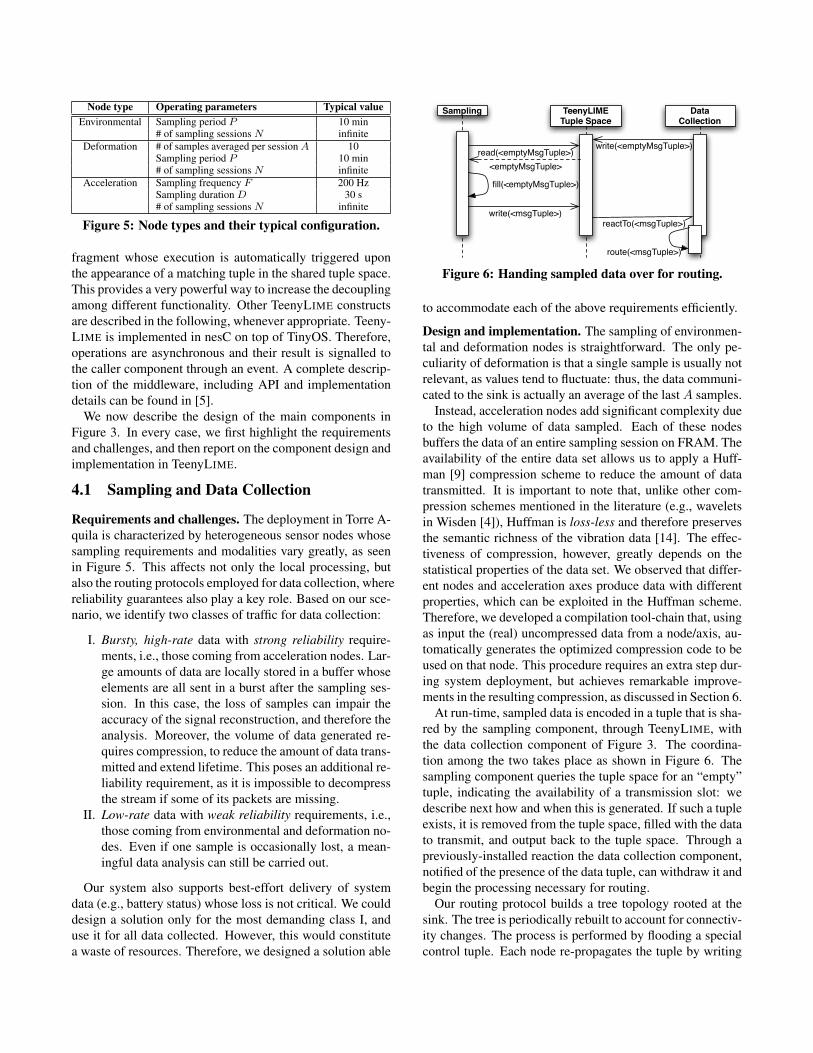
Node type Operating parameters Typical valueEnvironmental Sampling period P 10 min
# of sampling sessions N infiniteDeformation # of samples averaged per session A 10
Sampling period P 10 min# of sampling sessions N infinite
Acceleration Sampling frequency F 200 HzSampling duration D 30 s# of sampling sessions N infinite
Figure 5: Node types and their typical configuration.
fragment whose execution is automatically triggered uponthe appearance of a matching tuple in the shared tuple space.This provides a very powerful way to increase the decouplingamong different functionality. Other TeenyLIME constructsare described in the following, whenever appropriate. Teeny-LIME is implemented in nesC on top of TinyOS. Therefore,operations are asynchronous and their result is signalled tothe caller component through an event. A complete descrip-tion of the middleware, including API and implementationdetails can be found in [5].
We now describe the design of the main components inFigure 3. In every case, we first highlight the requirementsand challenges, and then report on the component design andimplementation in TeenyLIME.
4.1 Sampling and Data Collection
Requirements and challenges. The deployment in Torre A-quila is characterized by heterogeneous sensor nodes whosesampling requirements and modalities vary greatly, as seenin Figure 5. This affects not only the local processing, butalso the routing protocols employed for data collection, wherereliability guarantees also play a key role. Based on our sce-nario, we identify two classes of traffic for data collection:
I. Bursty, high-rate data with strong reliability require-ments, i.e., those coming from acceleration nodes. Lar-ge amounts of data are locally stored in a buffer whoseelements are all sent in a burst after the sampling ses-sion. In this case, the loss of samples can impair theaccuracy of the signal reconstruction, and therefore theanalysis. Moreover, the volume of data generated re-quires compression, to reduce the amount of data trans-mitted and extend lifetime. This poses an additional re-liability requirement, as it is impossible to decompressthe stream if some of its packets are missing.
II. Low-rate data with weak reliability requirements, i.e.,those coming from environmental and deformation no-des. Even if one sample is occasionally lost, a mean-ingful data analysis can still be carried out.
Our system also supports best-effort delivery of systemdata (e.g., battery status) whose loss is not critical. We coulddesign a solution only for the most demanding class I, anduse it for all data collected. However, this would constitutea waste of resources. Therefore, we designed a solution able
Sampling
read(<emptyMsgTuple>)
TeenyLIME Tuple Space
write(<msgTuple>)
Data Collection
write(<emptyMsgTuple>)
fill(<emptyMsgTuple>)
reactTo(<msgTuple>)
route(<msgTuple>)
<emptyMsgTuple>
Figure 6: Handing sampled data over for routing.
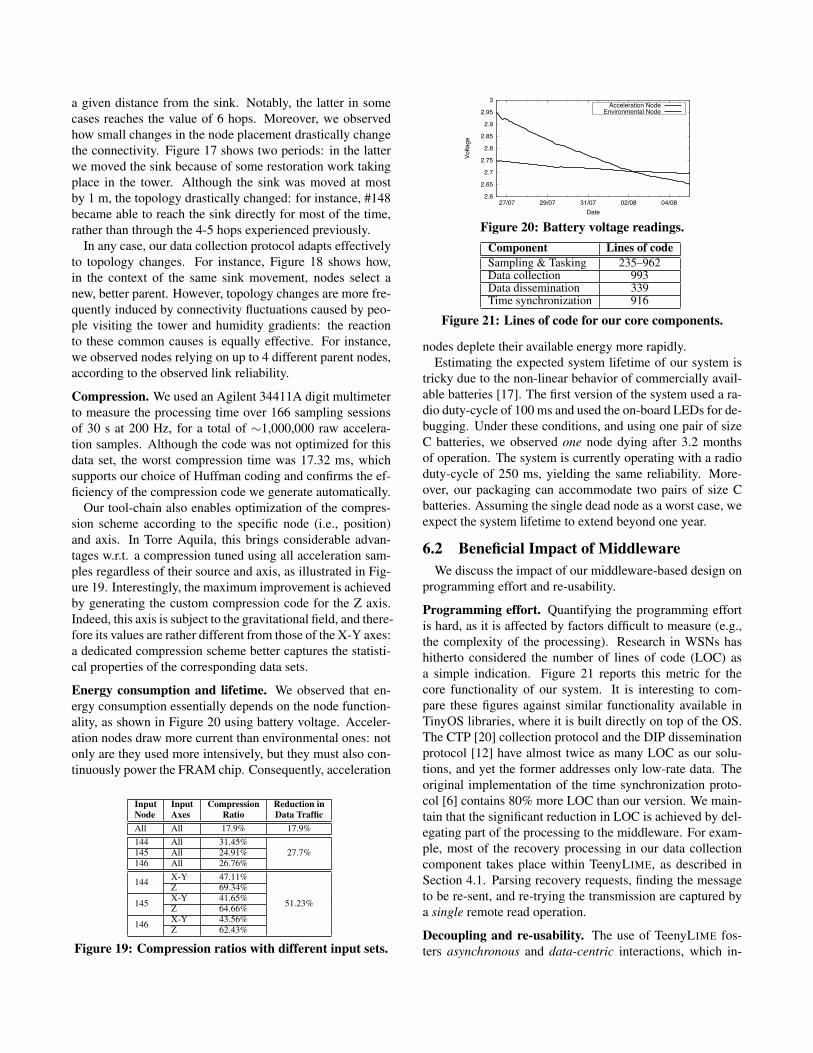
to accommodate each of the above requirements efficiently.
Design and implementation. The sampling of environmen-tal and deformation nodes is straightforward. The only pe-culiarity of deformation is that a single sample is usually notrelevant, as values tend to fluctuate: thus, the data communi-cated to the sink is actually an average of the last A samples.
Instead, acceleration nodes add significant complexity dueto the high volume of data sampled. Each of these nodesbuffers the data of an entire sampling session on FRAM. Theavailability of the entire data set allows us to apply a Huff-man [9] compression scheme to reduce the amount of datatransmitted. It is important to note that, unlike other com-pression schemes mentioned in the literature (e.g., waveletsin Wisden [4]), Huffman is loss-less and therefore preservesthe semantic richness of the vibration data [14]. The effec-tiveness of compression, however, greatly depends on thestatistical properties of the data set. We observed that differ-ent nodes and acceleration axes produce data with differentproperties, which can be exploited in the Huffman scheme.Therefore, we developed a compilation tool-chain that, usingas input the (real) uncompressed data from a node/axis, au-tomatically generates the optimized compression code to beused on that node. This procedure requires an extra step dur-ing system deployment, but achieves remarkable improve-ments in the resulting compression, as discussed in Section 6.
At run-time, sampled data is encoded in a tuple that is sha-red by the sampling component, through TeenyLIME, withthe data collection component of Figure 3. The coordina-tion among the two takes place as shown in Figure 6. Thesampling component queries the tuple space for an “empty”tuple, indicating the availability of a transmission slot: wedescribe next how and when this is generated. If such a tupleexists, it is removed from the tuple space, filled with the datato transmit, and output back to the tuple space. Through apreviously-installed reaction the data collection component,notified of the presence of the data tuple, can withdraw it andbegin the processing necessary for routing.
Our routing protocol builds a tree topology rooted at thesink. The tree is periodically rebuilt to account for connectiv-ity changes. The process is performed by flooding a specialcontrol tuple. Each node re-propagates the tuple by writing

Child
send(tuple 6)
Parent
retrieve(tuple 7)
4 5 6
cache
send(tuple 7)
send(tuple 8)
5 6 7
cache
6 7 8
cache
send(tuple 9)7 8 9
cache
Figure 7: Hop-by-hop recovery example.
a copy of it in the tuple space of every node within commu-nication range. There, the appearance of the tuple triggersa previously-installed reaction, which updates the tuple con-tent with path cost information and repeats the process, even-tually flooding the entire system. This flooding mechanismis reused also by other components, as mentioned later.
The reliability metric we use in optimizing the shape ofthe tree is a variant of [21], based on the Link Quality In-dicator (LQI) provided by the radio chip. Interestingly, theLQI value is also accessed through TeenyLIME, using spe-cial tuples whose field values are materialized by the run-time, as described in Section 4.4. Finally, data forwardingoccurs through the tuple space, by writing tuples to the tuplespace of the current parent in the tree.
The reliability requirements of the aforementioned class Iand II are dealt with through a hop-by-hop recovery scheme,intuitively described in Figure 7. Sent tuples are kept in thelocal tuple space, which effectively serves as a local cache,managed as a circular buffer. The receiving parent in the treekeeps track of the last tuple received from each child, thanksto a sequence number included in it. Upon recognizing ahole in the sequence, the parent pulls the missing tuple fromthe child’s cache, using a read operation. The child nodeis totally oblivious of recovery: no dedicated processing isrequired, as the necessary operations are performed directlyby the parent through TeenyLIME.
Since it is localized, fully distributed, and does not requiresystem-wide flooding of recovery information, our reliableprotocol enjoys lower latencies and far less network over-head than end-to-end, centralized solutions such as [10]. Onthe other hand, it might fail if a tuple is lost right before anode changes its parent. Consider a node C switching itsparent from Pold to Pnew. In this situation, Pnew has noinformation about tuples previously sent by C, and cannotdetect a tuple lost during the switch. These cases do occurin practice: Figure 8 shows a lab experiment where the treeis rebuilt every 2.5 minutes, and the occasional tuple lossesoccur only in coincidence with such tree reconfigurations.
Situations like the above must be avoided for class I traffic,which requires 100% delivery. They are taken care of in ourprotocol with a simple, yet effective, mechanism. Wheneverthe sink recognizes the beginning of a burst of class I traffic,
0
1
2
12:30:00 12:45:00 13:00:00 13:15:00 13:30:00
Me
ssa
ge
s lo
st
/ 1
0 s
ec
Time
Loss Rate Tree Refresh
Tree Refresh
Figure 8: Lost tuples and tree refresh operations.
the time scheduled for the next tree rebuild is temporarilyset to infinite. This effectively prevents the tree from chang-ing while class I traffic is routed towards the sink, and thusremoves the source of the problem.
Our implementation also considers transmission schedules.Traffic of class II is scheduled opportunistically. In the caseof class I traffic, however, a network congestion may de-velop due to the high volume of data transmitted. To allevi-ate the problem, we employ a form of slow-start schedulingfor class I traffic, varying the inter-message period at whichthe empty tuple representing an available transmission slotbecomes available. When a transmission failure is detected,the inter-message is set to the highest value then slowly de-creased, up to a configured minimum, as data are success-fully forwarded to the sink. With a minimum inter-messageinterval of 1 s, the reporting of a 30-second compressed sam-pling session at 200 Hz takes around 8 minutes.
4.2 Time Synchronization
Requirements and challenges. To investigate the dynam-ics of Torre Aquila, the readings taken by different nodesmust be correlated w.r.t. time. This is especially true forvibrations, e.g., to study how forces applied at the base ofthe tower propagate to the top floor. The samples must bealigned in time, with a worst-case time drift up to 1 ms [13].
Design and implementation. Several time synchronizationprotocols for WSN exist. To meet the requirement above, oursolution is a modified version of [6]. The protocol works bycreating a hierarchy among the network nodes, whose clocksare then synchronized with the root’s clock. As depicted inFigure 9, synchronization is based on a round-trip tuple ex-change between nodes at level i and i " 1 in the hierarchy.The nodes at level i record the time T1, at which a synchro-nization request is issued, and T4, at which the reply from anode at i"1 is received. This reply contains the times T2 andT3 at which the node at i"1 received the request and repliedto it, respectively. These four values enable the nodes at thelower level i to evaluate clock drifts and propagation delays,and adjust consequently their local time w.r.t. nodes closerto (and therefore with a smaller drift from) the root at level0. Since this process is performed at each hierarchy level, iteventually synchronizes all nodes to the root.
As with the other services, we implemented time synchro-nization using TeenyLIME. The hierarchy is built trivially byrelying on the same flooding mechanism described for data

Node at
level i
read(<times>)
Node at
level i-1
<T2,T3>
reifyCapabilityTuple
write(<T2, T3>)
T1
T2
T4
T3
request issued
reply received
Figure 9: Time synchronization using capability tuples.
collection in Section 4.1. However, the information flooded(and therefore the resulting tree) is different, since data col-lection optimizes the tree shape w.r.t. link quality, while timesynchronization minimizes the hop-count from the sink toreduce the impact of the link latency on the time estimate.
Instead, pairwise synchronization among nodes relies onone of TeenyLIME’s unique constructs: capability tuples [5].A capability tuple is essentially a placeholder for the actualdata, which is generated on demand. As illustrated in Fig-ure 9, when a read operation whose pattern matches a capa-bility tuple is received, TeenyLIME does not simply return,as usual, the latter as result. Instead, it delegates its com-putation to the component that originally output the capabil-ity tuple, using a reifyCapabilityTuple event. Thisis handled by computing and outputting the actual contentof the tuple, which is then finally delivered to the query is-suer by TeenyLIME. This mechanism essentially enables anode to “advertise” the availability of data without the needto keep it up-to-date by periodically regenerating it—a wasteof energy when not used by any query.
In our time synchronization component we use a capabil-ity tuple to produce on demand the values of T2 and T3, asillustrated in Figure 9. It is worth noting that most of thedistributed processing is dealt with by TeenyLIME, greatlysimplifying the implementation.
Of course, threats to accuracy may come from the unpre-dictability of processing and message transmission delays.Solving this issue actually led to extensions to the originalTeenyLIME API. To alleviate the first problem, we enabledcomponents to be notified when a given operation (e.g., amessage send) is completed. This information is used bythe synchronization component to periodically re-evaluateprocessing delays. Message transmission delays, instead,are kept under control by temporarily switching off the ra-dio duty-cycling during a synchronization round. This isachieved by using a newly-designed tuning interface, whichenables cross-layer interactions by giving developers directcontrol over the node hardware.
Evaluating precisely the accuracy of our protocol is dif-ficult in the deployment environment. Therefore, we per-formed a number of lab experiments, using 12 nodes in achain topology. We used a Tektronix TDS 220 two-channeloscilloscope to measure the time drifts between any two nodesin the network. As expected, the worst-case time drift hap-
pens between the root of the tree and the node at the oppo-site end of the chain. In this case, the time difference was732 µs, still sufficient to perform meaningful analysis of vi-bration data [13]. Moreover, Section 6 reports that in thedeployment we observed at most 6 hops between an accel-eration node and the sink. It is therefore unlikely that timedrift in Torre Aquila is higher than in our lab experiments.
4.3 Tasking and Data Dissemination
Requirements and challenges. The ideal configuration ofthe monitoring system deployed in Torre Aquila, in terms ofacquisition rates and intervals, is not known a priori, as of-ten happens when WSNs are employed to study a physicalphenomenon for the first time. Moreover, in many cases anexternal event may suggest a different configuration. For in-stance, it could be of interest to monitor more frequently vi-bration and deformation when roadwork is being conductednearby, people are present in the tower, or strong winds arepresent. The ability to remotely task the system must besupported by a mechanism that disseminates the new con-figuration reliably, and guarantees that the received data iseventually consistent across the system.
Design and implementation. The set of sampling parame-ters that can be modified remotely are those shown in Fig-ure 5. There, we included the values suggested by the struc-tural engineers on our team: each parameter, however, canbe changed independently. In particular, the number of sam-pling sessions N can be a finite number, enabling monitoringof a given quantity only during a given time interval.
A parameter configuration is packed in a task tuple with anappropriate format. These tuples are generated on the sinkupon a user request, issued through our graphical front-end,and disseminated using the protocol we describe next. Onevery node, the sampling and tasking component (Figure 3)registers a reaction matching task tuples and, upon receipt ofa new one, updates the sampling parameters accordingly.
The task tuples must be disseminated reliably through-out the system, a widely studied problem in WSNs [11, 12].We take inspiration from the state-of-the-art by adapting theTrickle [11] protocol. This achieves eventual consistency ofthe disseminated data by using monotonically increasing se-quence numbers, used to determined if a node is up to date.
This dissemination scheme lends itself to a straightforwardimplementation on top of TeenyLIME. Task tuples are ini-tially flooded by using the mechanism described for data col-lection in Section 4.1. Moreover, the management of missedtuples comes almost for free by using one of TeenyLIME’sconstructs: node tuples [5]. A node tuple represents the cur-rent state of a device, and is made available inside its 1-hopneighborhood. The format of the tuple and the rules for pop-ulating its field values are provided by the programmer, butthe periodic update of these values and the tuple propagationto neighbors is carried out automatically by the TeenyLIME

run-time. Therefore, checking whether a recovery is neededin our dissemination protocol is as simple as including thesequence number as a field in a node tuple; installing a re-action that fires whenever a neighbor’s sequence number isnewer than the local one; and recovering the missing tuplewith a read operation on such neighbor.
4.4 TeenyLime:Deployment-driven Enhancements
The requirements of the Torre Aquila deployment broughtthe development of TeenyLIME one step ahead. We alreadymentioned some of the extensions we designed, e.g., the tun-ing interface in Section 4.2. Below is a summary of otherenhancements to TeenyLIME motivated by our deployment.
Typed tuples and dynamic memory. In the presence ofhigh-rate data such as vibrations, it is imperative to manageefficiently the available memory. To further optimize thisaspect in TeenyLIME, we introduced a notion of typed tuple.Mimicking the generic data types in modern programminglanguages, developers instantiate tuples as:tuple<uint8_t, uint16_t, float> temperature =
newTuple(actualField(TEMPERATURE_TYPE),actualField(NODE_ID),actualField(temperatureReading));
where actualField indicates a field with actual data, asopposed to constraints on the field type or value. A pre-processor we developed inspects all TeenyLIME-based ap-plication components to gather a complete view of all tuplesused. Based on this, it generates optimized data structuresfor storing and searching the data.
Typed tuples are managed at run-time by a component pro-viding a form of dynamic memory based on slabs [2]. In ourcase, a slab is a chunk of memory meant to store tuples ofthe same size. Using slabs does not require de-fragmentingmemory, which is difficult to implement on resource-scarcedevices. In the application described here, the combinationof the techniques above freed 80% of the memory allocatedby our previous release of TeenyLIME.
Automatic field types. Our data collection component re-lies on LQI as a measure of link reliability. To relieve theprogrammer from the burden to explicitly query the oper-ating system for similar low-level information, we make itavailable in the form of tuples by defining a number of spe-cial field types whose value is automatically materialized byTeenyLIME as part of the node tuples. For instance, in:
NodeTuple<uint16_t, lqi> myNodeTuple;
the value of the second field of the node tuple reflects theLQI value towards a particular neighbor. This way, low-leveldata becomes straightforwardly available to the application,greatly simplifying the development of routing protocols.
Reliable, low-power operations. In TeenyLIME, program-mers can explicitly choose whether the execution of a remote
operation is reliable or not. In our deployment, this feature issupport by a dedicated reliable communication layer exploit-ing mixed software/hardware link-layer acknowledgements.This solution occupies only 252 bytes of program memory.
To provide low-power operations, we integrated in our run-time the Low Power Listening [20] layer available in theTinyOS distribution. TeenyLIME’s operating parameters (e.g.,the timeout for remote queries) are exposed to make themadjustable based on the expected message delays.
5. DEPLOYMENTThe tower contains four floors, the ground one isolated
from the others and used as a public walkway. The plan isC-shaped 7.8 m % 4.5 m, and the height is 25.6 m. The 14th
century enlargement closed the tower to the West and raisedthe gate by an additional storey. The two parts of the ma-sonry body have completely different properties. The lowerlevel walls consist of two 40 cm thick stone blocks, with anincoherent filling. At the upper levels, the older portion ofthe masonry is built of 80 cm thick stone blocks, while themost recent one is brick and blocks of varying sizes. Visitorsenter the tower from the nearby Buonconsiglio Castle, arriv-ing through a long corridor directly on the 2nd floor wherethe frescoes are.
Node placement. As shown in Figure 10, we deployed 16nodes plus the sink #0. This is placed at the top floor, theonly spot guaranteeing access to the external WiFi network.
The sensor position is chosen to detect early symptoms ofdeterioration of the structure. The joint between the ancientparts of the tower and the more recent ones is today perfectlyvisible (bottom of Figure 10), but the degree of structural
!
!
!"#$%&'#()*+%,-#*.(/+#*+#*0&%"(1*2*3451-()*+#*6",%,"%*0%5"1-1,#%*+#'(/#(%*8%&*#-*91"#(1&4,,#1*'(&/((/&4-%*+#*%+#:#5#*'(1#*
*
!
*;<=*
*!
"#$%!&%'(!)*+,!-./$!-*/$01!231#456!7*/8.+9!5/4.+5$$#.!#/:*+#.+*!*
*!
"#$%!&%';!)*+,!-./$!-*/$01!231#456!7*/8.+9!:#<+5!=#!>#8?+5!1*85!6?/$.!6.!83#$.6.!*81*+/.!
!
!
!"#$%&'#()*+%,-#*.(/+#*+#*0&%"(1*2*3451-()*+#*6",%,"%*0%5"1-1,#%*+#'(/#(%*8%&*#-*91"#(1&4,,#1*'(&/((/&4-%*+#*%+#:#5#*'(1#*
*
!
*;<=*
*!
"#$%!&%'(&!)*+#,-.!/0#.!1234056!
*527#4*04#8#032!72..2!,033244#03#!32..9-**04#+0!#3:0.;,50!*
*!
"#$%!&%'(<!)*+#,-.!/0#.!123405!#34+-..-+0!
FIRST FLOOR
SECOND FLOOR
THIRD FLOOR
0
141
144
145
148
149
150
151152
153
154
160
161
162
142
143
144
149
151
152
161
162
143
142
0 160
145
146
146
150
141
153
148 154
Accelerometer Fiber Optic Sensor
joint
Figure 10: Deployment map.

Figure 11: Graphical user interface.
connection of this joint is still a major point of uncertainty.The deformation across the connection is measured on the 1st
floor by FOS #154. This is a 0.6 m gauge wrapped as an opti-cal coil to magnify the sensor precision, and anchored to twoexpansion bolts at the sides of the joint, as shown in Figure10. Another FOS is used to detect vertical elongation at theS-W corner of the tower, from level +5.7 m to +25.6 m. Inthis case the measuring path is a protected optical fiber looppre-tensioned between two metal anchorings. An extensioncable connects the sensor to node #153 at the 3rd floor.
The vibrations induced by traffic and, to a minor extent,by wind are recorded by acceleration nodes #144, #145, and#146, the first at the base and the others at the top of thetower. The analysis of acceleration readings allows to under-stand the dynamical behavior of Torre Aquila. Indeed, the vi-bration response of a building is not completely random, butconcentrates mainly around some specific frequencies, knowas natural frequencies. Daily and seasonal thermal excur-sions also affect the structural response of the tower, and theknowledge of these variations is needed to process and com-pensate the strain and acceleration signals recorded by FOSand accelerometers. This motivates the presence of a numberof environmental nodes distributed all over the tower.
Data visualization and access. Effective access to the in-formation gathered by the system is crucial in supporting thestructural engineers in their analysis. To this end, we pro-vide a custom graphical user interface, shown in Figure 11,implemented through a major re-factoring of Octopus [16].The GUI shows the current network topology and serves asa control center from which the user can remotely task theWSN. Moreover, it displays the data collected, which arealso persistently stored in a database.
! Figure 12: The acceleration signal from #145.
!
!
!"#$%&'#()*+%,-#*.(/+#*+#*0&%"(1*2*3451-()*+#*6",%,"%*0%5"1-1,#%*+#'(/#(%*8%&*#-*91"#(1&4,,#1*'(&/((/&4-%*+#*%+#:#5#*'(1#*
*
!
*;;<*
=1"'#+%&4"+1*519%*/"#(4*/">455%-%&4?#1"%*!"#$##%&'()*'#*1((#%"%*/"*51&&#'81"+%"(%*'81'(429%"(1*94''#91*/"#(4*84&#*4@*
&&* A
94B CD<EF;G !"#
**H* I/%'(1* 8/"(1* J* 81''#7#-%* 51"* 7/1"4* 488&1''#94?#1"%* 51"1'5%&%* -1* '(4(1* +#* +%:1&94?#12"%K'1--%5#(4?#1"%*+%--4*'(&/((/&4*#"*&%-4?#1"%*4-*$4-1&%*+%-->455%-%&4?#1"%*9#'/&4(4*"%--%*81'#?#1"#*+%-*(%&?1*8#4"1*L+1$%*'1"1*8&%'%"(#*,-#*455%-%&19%(&#MN*O%&* :4&%*I/%'(1* '#* J* 488-#54(1*4--4* '(&/((/&4*91+%--4(4*/"4*+%:1&94?#1"%* #981'(4*84&#* 4*I/%--4*+%--4*8^* :1&94*91+4-%F*%* #"*%"(#()* (4-%*+4*$%&#:#54&%F* #"*51&&#'81"+%"?4*+%--4*81'#?#1"%*+%-*P1(%* EF* * -1* '81'(49%"(1* /"#(4* *&!*"#$##)+,&&* L5#1J* 519%* '#* J* +%((1* 51&&#'81"+%"(%*4-->455%-%&4?#1"%*!"#$##%&'(
)MN* H* I/%'(1* 8/"(1F* $#'(4* -4* -#"%4&#()* +%-* 91+%--1F* '4&)* 81''#7#-%*
'(47#-#&%*/"4*51&&#'81"+%"?4*(&4*'(4(1*+#*+%:1&94?#1"%*%+*455%-%&4?#1"%K'81'(49%"(1N**
******************************* *-
./01-+1%2-34567&!8/694-/&:6(;!$-<677/(:69=49;4-!>-:7/&6-&6=6-=/-?/@7!74-=4>>!-(;7A;;A7!-
*=#Q* &#'/-(4* *84&(#51-4&9%"(%* #981&(4"(%*8%&* -1*'5181*+%-*'#'(%94*+#*91"#(1&4,,#1@* ->/(%"(%*J*
51'R*#"*,&4+1*+4*&%91(1F*'%98-#5%9%"(%*%55%+%"+1*4--4*84,#"4*S%7F*+#*51"1'5%&%*#":1&94?#1"#*'/--1*'(4(1*+#*&#'5T#1*%*+#*+4""%,,#49%"(1*+%--4*'(&/((/&4*L4+*%'%98#1*'#*8/Q*51"1'5%&%*4*8&#*I/%-*$4-1&%*+#*455%-%&4?#1"%*5T%F*'%*-%((4F*51&&#'81"+%*4+*/"4*51&&#'81"+%"(%*48%&(/&4*+#*:%''/&%*"%,-#*4::&%'5T#MN*6"*I/%'(>1((#54*'#*'1"1*"/1$49%"(%*6$4(#*#*$4-1&#*+#*'81'(49%"(#*%*+%:1&94?#1"#*L"%--%*81'#2
?#1"#25T#4$%*+%'5&#((%*8&%5%+%"(%9%"(%M*51"*&#:%	%"(1*4*I/4((&1*84&(#51-4&#*$4-1&#*+#*455%-%&42?#1"%@**2*!%"#$##B&'(
)@*$4-1&%*5T%*&488&%'%"(4*L+4--%*1''%&$4?#1"#*'8%	%"(4-#*+%,-#*455%-%&19%(&#M* -4*'1,-#4*4-*+#*'1((1*+%--4*I/4-%*'#*T4*(1(4-%*#"'%"'#7#-#()*+%#*'%"'1&#U**2*!)"#$%&'(
)@*$4-1&%*5T%*&488&%'%"(4F*8%&*#*<*'%51"+#*+#*1''%&$4?#1"%*+%'5&#((#F*#-*$4-1&%*8#V*4-(1*9#'/&4(1*+%-->455%-%&4?#1"%*+1$/(4*4-*&/91&%*497#%"(4-%U**2*!C"D&'(
)@*$4-1&%*5T%*&488&%'%"(4*-4*9%()*+%--4*8#V*,&4"+%*455%-%&4?#1"%*5T%*8/Q*%''%&%*9#'/2&4(4*+4#*'%"'1&#*/(#-#??4(#N*
!
!
!"#$%&'#()*+%,-#*.(/+#*+#*0&%"(1*2*3451-()*+#*6",%,"%*0%5"1-1,#%*+#'(/#(%*8%&*#-*91"#(1&4,,#1*'(&/((/&4-%*+#*%+#:#5#*'(1#*
*
!
*;;<*
=1"'#+%&4"+1*519%*/"#(4*/">455%-%&4?#1"%*!"#$##%&'()*'#*1((#%"%*/"*51&&#'81"+%"(%*'81'(429%"(1*94''#91*/"#(4*84&#*4@*
&&* A
94B CD<EF;G !"#
**H* I/%'(1* 8/"(1* J* 81''#7#-%* 51"* 7/1"4* 488&1''#94?#1"%* 51"1'5%&%* -1* '(4(1* +#* +%:1&94?#12"%K'1--%5#(4?#1"%*+%--4*'(&/((/&4*#"*&%-4?#1"%*4-*$4-1&%*+%-->455%-%&4?#1"%*9#'/&4(4*"%--%*81'#?#1"#*+%-*(%&?1*8#4"1*L+1$%*'1"1*8&%'%"(#*,-#*455%-%&19%(&#MN*O%&* :4&%*I/%'(1* '#* J* 488-#54(1*4--4* '(&/((/&4*91+%--4(4*/"4*+%:1&94?#1"%* #981'(4*84&#* 4*I/%--4*+%--4*8^* :1&94*91+4-%F*%* #"*%"(#()* (4-%*+4*$%&#:#54&%F* #"*51&&#'81"+%"?4*+%--4*81'#?#1"%*+%-*P1(%* EF* * -1* '81'(49%"(1* /"#(4* *&!*"#$##)+,&&* L5#1J* 519%* '#* J* +%((1* 51&&#'81"+%"(%*4-->455%-%&4?#1"%*!"#$##%&'(
)MN* H* I/%'(1* 8/"(1F* $#'(4* -4* -#"%4&#()* +%-* 91+%--1F* '4&)* 81''#7#-%*
'(47#-#&%*/"4*51&&#'81"+%"?4*(&4*'(4(1*+#*+%:1&94?#1"%*%+*455%-%&4?#1"%K'81'(49%"(1N**
******************************* *-
./01-+1%2-34567&!8/694-/&:6(;!$-<677/(:69=49;4-!>-:7/&6-&6=6-=/-?/@7!74-=4>>!-(;7A;;A7!-
*=#Q* &#'/-(4* *84&(#51-4&9%"(%* #981&(4"(%*8%&* -1*'5181*+%-*'#'(%94*+#*91"#(1&4,,#1@* ->/(%"(%*J*
51'R*#"*,&4+1*+4*&%91(1F*'%98-#5%9%"(%*%55%+%"+1*4--4*84,#"4*S%7F*+#*51"1'5%&%*#":1&94?#1"#*'/--1*'(4(1*+#*&#'5T#1*%*+#*+4""%,,#49%"(1*+%--4*'(&/((/&4*L4+*%'%98#1*'#*8/Q*51"1'5%&%*4*8&#*I/%-*$4-1&%*+#*455%-%&4?#1"%*5T%F*'%*-%((4F*51&&#'81"+%*4+*/"4*51&&#'81"+%"(%*48%&(/&4*+#*:%''/&%*"%,-#*4::&%'5T#MN*6"*I/%'(>1((#54*'#*'1"1*"/1$49%"(%*6$4(#*#*$4-1&#*+#*'81'(49%"(#*%*+%:1&94?#1"#*L"%--%*81'#2
?#1"#25T#4$%*+%'5&#((%*8&%5%+%"(%9%"(%M*51"*&#:%	%"(1*4*I/4((&1*84&(#51-4&#*$4-1&#*+#*455%-%&42?#1"%@**2*!%"#$##B&'(
)@*$4-1&%*5T%*&488&%'%"(4*L+4--%*1''%&$4?#1"#*'8%	%"(4-#*+%,-#*455%-%&19%(&#M* -4*'1,-#4*4-*+#*'1((1*+%--4*I/4-%*'#*T4*(1(4-%*#"'%"'#7#-#()*+%#*'%"'1&#U**2*!)"#$%&'(
)@*$4-1&%*5T%*&488&%'%"(4F*8%&*#*<*'%51"+#*+#*1''%&$4?#1"%*+%'5&#((#F*#-*$4-1&%*8#V*4-(1*9#'/&4(1*+%-->455%-%&4?#1"%*+1$/(4*4-*&/91&%*497#%"(4-%U**2*!C"D&'(
)@*$4-1&%*5T%*&488&%'%"(4*-4*9%()*+%--4*8#V*,&4"+%*455%-%&4?#1"%*5T%*8/Q*%''%&%*9#'/2&4(4*+4#*'%"'1&#*/(#-#??4(#N*
(a)
!
!
!"#$%&'#()*+%,-#*.(/+#*+#*0&%"(1*2*3451-()*+#*6",%,"%*0%5"1-1,#%*+#'(/#(%*8%&*#-*91"#(1&4,,#1*'(&/((/&4-%*+#*%+#:#5#*'(1#*
*
!
*;<=*
!"#$%&%#'()*+%&%#,!-./0123/#4*)56)789#4!-:/2;1<8=#*
********************** *
*
*************************************************** **
!
!
!"#$%&'#()*+%,-#*.(/+#*+#*0&%"(1*2*3451-()*+#*6",%,"%*0%5"1-1,#%*+#'(/#(%*8%&*#-*91"#(1&4,,#1*'(&/((/&4-%*+#*%+#:#5#*'(1#*
*
!
*;<=*
!"#$%&%#'()*+%&%#,!-./0123/#4*)56)789#4!-:/2;1<8=#*
********************** *
*
*************************************************** **
(b)
Figure 13: First (a) and second (b) vibrational modes.
Preliminary data analysis. The data collected is processedby a Bayesian algorithm that provides the user with the real-time probability of an ongoing structural disease. The algo-rithm can identify a hazardous condition many days in ad-vance w.r.t. to the actual occurrence of the damage [23], andit has already been applied for risk analysis of historic build-ings [24]. In the following, we provide a few examples ofcollected data and discuss the insights that the structural en-gineers on our team gained from them.
Figure 12 shows the acceleration measured on the X axisof #145. The top chart reports the time history over 5 s,while the bottom one shows the corresponding frequencyspectrum. The peaks in the spectrum indicate possible nat-ural frequencies of the structure, at 1.25 Hz, 1.80 Hz and2.40 Hz. Every natural frequency follows a specific deflec-tion shape, usually referred to as vibrational mode. For in-stance, Figure 13 shows the first two vibrational modes ofthe tower computed by a numerical model, respectively as-sociated to natural frequencies of 1.25 Hz and 1.80 Hz1.
Figure 14 reports the strain measured, in microstrains (µ!),1For sake of clarity, in the picture the amplitude of the vibrationalmodes have been artificially magnified.

!
!
!
!
Figure 14: Strain measurements from FOS #154.
16
18
20
22
24
26
28
30
03/09 09/09 15/09 21/09 27/09
De
gre
es C
els
ius
Date
148149152
Figure 15: Temperature on three floors of Torre Aquila.
by the FOS #154 placed across the joint. To eliminate thehigh frequency instrumental noise, we applied to the signala moving average filter with a 60-sample long window. Thegraph shows the well-known “breath” of the structure dueto daily thermal variations. The joint is forced to open be-cause of thermal expansion when sun rays hit the southernfacade, and then closes during the night. We also note adelay between the maximum irradiation at mid-day and themaximum joint elongation, presumably caused by the ther-mal inertia of the walls. The analysis of this behavior alsoallows assessing the sensitivity of the joint to temperature.As for the latter, the temperature data shown in Figure 15 fornodes on different floors confirm the presence of a gradientalong the tower, as well as significant seasonal changes. Thedaily strain variation (on the order of 500 µ!) agrees with thenumerical prediction under the assumption that the joint isfully released. To date, the strain response of the tower hasnot shown trends which may rise concerns about its stability.
The benefit of the above analysis is twofold: on one hand,in the short-term it permits identification of a reliable modelfor the structure response, and prediction of the behavior ofthe tower during exceptional events, e.g., earthquakes or sub-siding. On the other hand, the data are stored in a databasethat will remain available in the long-term and constantlycompared with more recent data, so that any change in thetower behavior can be detected, triggering specific analyses.
6. EVALUATIONIn this section, we study the effectiveness of our design
along two lines. We report first on the system performancein Torre Aquila, showing that our solution performs reliablyand efficiently. Next, we consider the benefits of using amiddleware during the development process.
6.1 System PerformanceTo assess the effectiveness of our middleware-based de-
sign we report on three key performance issues: i) reliabledelivery of data, ii) effective compression of accelerationreadings, and iii) energy consumption and system lifetime.
Reliable delivery. During the last four months of operation,the overall loss rate always remained below 0.01%. Thisperformance is striking if compared to the average yield oflong-running WSN deployments reported in the current liter-ature [1], and even more so if we consider that ours is one ofthe few WSN deployments featuring high-rate data reportingfor more than a few weeks.
The effectiveness of our reliability mechanisms for trafficof class I and II is exemplified in Figure 16, showing the cu-mulative loss rate (in log scale) over time. The loss rate forclass I traffic generally remains an order of magnitude lowerthan that of class II traffic. In the morning of September 3rd
a malfunctioning acceleration node lost a number of tuples,which generated the spike relative to class I traffic. Lateron the same day we replaced the faulty node and performeda few maintenance operations on the sink, temporarily sus-pending its operation. This caused the spike in class II traffic.After these two events, the loss rate decreased steadily.
This performance is achieved in spite of the peculiar char-acteristics of the deployment scenario. Although Torre A-quila is not particularly tall, the thickness of its walls greatlyhinders wireless propagation. As an indication of this, Fig-ure 17 reports the percentage of time some nodes spent at
1e-06
1e-05
0.0001
0.001
0.01
30/08 01/09 03/09 05/09 07/09 09/09 11/09 13/09 15/09Cu
mu
lative
lo
ss r
ate
(lo
g s
ca
le)
Date
Class I TrafficClass II Traffic
Figure 16: Cumulative loss rate.
0
0.2
0.4
0.6
0.8
1
#142#143
#146#148
#151#152
Pe
rce
nta
ge
of
tim
e
04 Sept - 09 Sept
#142#143
#146#148
#151#152
09 Sept - 14 Sept
1 Hop2 Hops3 Hops4 Hops5 Hops6 Hops
Figure 17: Distance in hops from the sink.
0
0.2
0.4
0.6
0.8
1
#142#143
#146#148
#151#152
Pe
rce
nta
ge
of
tim
e
04 Sept - 09 Sept
#142#143
#146#148
#151#152
09 Sept - 14 Sept
Sink#142#143#148#149#151#152#153
Figure 18: Time spent with a given parent node.
a given distance from the sink. Notably, the latter in somecases reaches the value of 6 hops. Moreover, we observedhow small changes in the node placement drastically changethe connectivity. Figure 17 shows two periods: in the latterwe moved the sink because of some restoration work takingplace in the tower. Although the sink was moved at mostby 1 m, the topology drastically changed: for instance, #148became able to reach the sink directly for most of the time,rather than through the 4-5 hops experienced previously.
In any case, our data collection protocol adapts effectivelyto topology changes. For instance, Figure 18 shows how,in the context of the same sink movement, nodes select anew, better parent. However, topology changes are more fre-quently induced by connectivity fluctuations caused by peo-ple visiting the tower and humidity gradients: the reactionto these common causes is equally effective. For instance,we observed nodes relying on up to 4 different parent nodes,according to the observed link reliability.
Compression. We used an Agilent 34411A digit multimeterto measure the processing time over 166 sampling sessionsof 30 s at 200 Hz, for a total of !1,000,000 raw accelera-tion samples. Although the code was not optimized for thisdata set, the worst compression time was 17.32 ms, whichsupports our choice of Huffman coding and confirms the ef-ficiency of the compression code we generate automatically.
Our tool-chain also enables optimization of the compres-sion scheme according to the specific node (i.e., position)and axis. In Torre Aquila, this brings considerable advan-tages w.r.t. a compression tuned using all acceleration sam-ples regardless of their source and axis, as illustrated in Fig-ure 19. Interestingly, the maximum improvement is achievedby generating the custom compression code for the Z axis.Indeed, this axis is subject to the gravitational field, and there-fore its values are rather different from those of the X-Y axes:a dedicated compression scheme better captures the statisti-cal properties of the corresponding data sets.
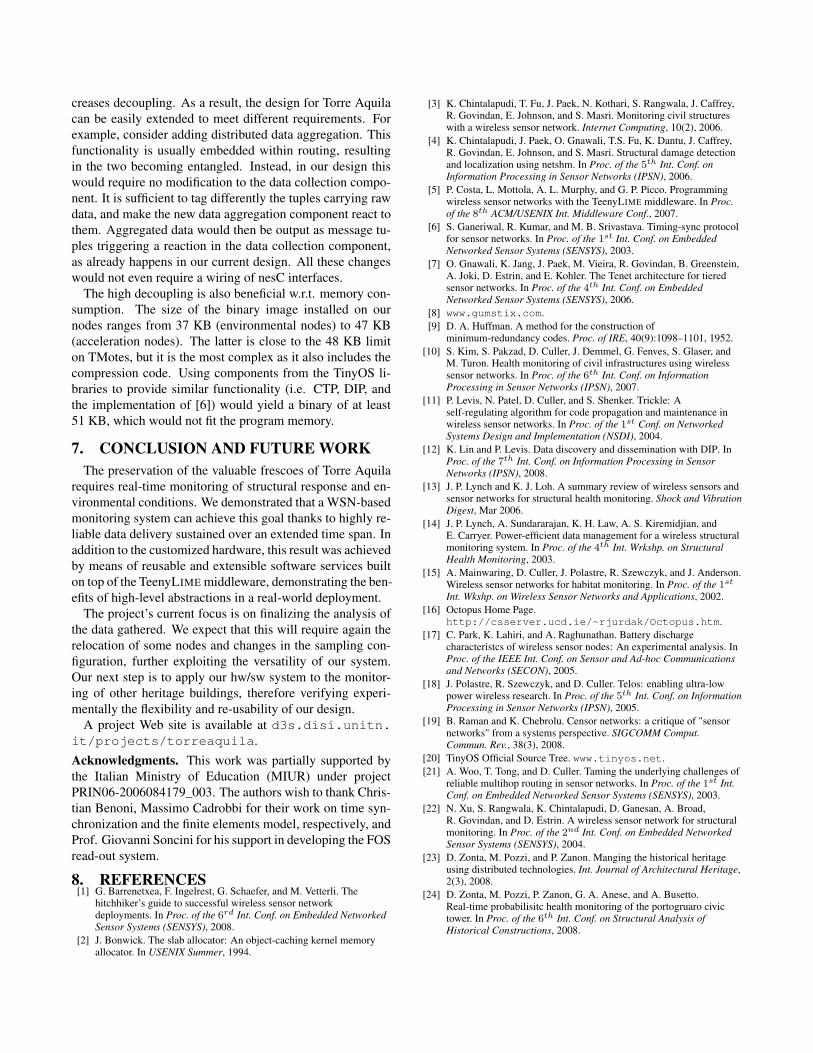
Energy consumption and lifetime. We observed that en-ergy consumption essentially depends on the node function-ality, as shown in Figure 20 using battery voltage. Acceler-ation nodes draw more current than environmental ones: notonly are they used more intensively, but they must also con-tinuously power the FRAM chip. Consequently, acceleration
Input Input Compression Reduction inNode Axes Ratio Data TrafficAll All 17.9% 17.9%144 All 31.45%
27.7%145 All 24.91%146 All 26.76%
144 X-Y 47.11%
51.23%
Z 69.34%
145 X-Y 41.65%Z 64.66%
146 X-Y 43.56%Z 62.43%
Figure 19: Compression ratios with different input sets.
2.6
2.65
2.7
2.75
2.8
2.85
2.9
2.95
3
27/07 29/07 31/07 02/08 04/08
Voltage
Date
Acceleration NodeEnvironmental Node
Figure 20: Battery voltage readings.Component Lines of codeSampling & Tasking 235–962Data collection 993Data dissemination 339Time synchronization 916
Figure 21: Lines of code for our core components.
nodes deplete their available energy more rapidly.Estimating the expected system lifetime of our system is
tricky due to the non-linear behavior of commercially avail-able batteries [17]. The first version of the system used a ra-dio duty-cycle of 100 ms and used the on-board LEDs for de-bugging. Under these conditions, and using one pair of sizeC batteries, we observed one node dying after 3.2 monthsof operation. The system is currently operating with a radioduty-cycle of 250 ms, yielding the same reliability. More-over, our packaging can accommodate two pairs of size Cbatteries. Assuming the single dead node as a worst case, weexpect the system lifetime to extend beyond one year.
6.2 Beneficial Impact of MiddlewareWe discuss the impact of our middleware-based design on
programming effort and re-usability.
Programming effort. Quantifying the programming effortis hard, as it is affected by factors difficult to measure (e.g.,the complexity of the processing). Research in WSNs hashitherto considered the number of lines of code (LOC) asa simple indication. Figure 21 reports this metric for thecore functionality of our system. It is interesting to com-pare these figures against similar functionality available inTinyOS libraries, where it is built directly on top of the OS.The CTP [20] collection protocol and the DIP disseminationprotocol [12] have almost twice as many LOC as our solu-tions, and yet the former addresses only low-rate data. Theoriginal implementation of the time synchronization proto-col [6] contains 80% more LOC than our version. We main-tain that the significant reduction in LOC is achieved by del-egating part of the processing to the middleware. For exam-ple, most of the recovery processing in our data collectioncomponent takes place within TeenyLIME, as described inSection 4.1. Parsing recovery requests, finding the messageto be re-sent, and re-trying the transmission are captured bya single remote read operation.
Decoupling and re-usability. The use of TeenyLIME fos-ters asynchronous and data-centric interactions, which in-
creases decoupling. As a result, the design for Torre Aquilacan be easily extended to meet different requirements. Forexample, consider adding distributed data aggregation. Thisfunctionality is usually embedded within routing, resultingin the two becoming entangled. Instead, in our design thiswould require no modification to the data collection compo-nent. It is sufficient to tag differently the tuples carrying rawdata, and make the new data aggregation component react tothem. Aggregated data would then be output as message tu-ples triggering a reaction in the data collection component,as already happens in our current design. All these changeswould not even require a wiring of nesC interfaces.
The high decoupling is also beneficial w.r.t. memory con-sumption. The size of the binary image installed on ournodes ranges from 37 KB (environmental nodes) to 47 KB(acceleration nodes). The latter is close to the 48 KB limiton TMotes, but it is the most complex as it also includes thecompression code. Using components from the TinyOS li-braries to provide similar functionality (i.e. CTP, DIP, andthe implementation of [6]) would yield a binary of at least51 KB, which would not fit the program memory.
7. CONCLUSION AND FUTURE WORKThe preservation of the valuable frescoes of Torre Aquila
requires real-time monitoring of structural response and en-vironmental conditions. We demonstrated that a WSN-basedmonitoring system can achieve this goal thanks to highly re-liable data delivery sustained over an extended time span. Inaddition to the customized hardware, this result was achievedby means of reusable and extensible software services builton top of the TeenyLIME middleware, demonstrating the ben-efits of high-level abstractions in a real-world deployment.
The project’s current focus is on finalizing the analysis ofthe data gathered. We expect that this will require again therelocation of some nodes and changes in the sampling con-figuration, further exploiting the versatility of our system.Our next step is to apply our hw/sw system to the monitor-ing of other heritage buildings, therefore verifying experi-mentally the flexibility and re-usability of our design.
A project Web site is available at d3s.disi.unitn.it/projects/torreaquila.Acknowledgments. This work was partially supported bythe Italian Ministry of Education (MIUR) under projectPRIN06-2006084179_003. The authors wish to thank Chris-tian Benoni, Massimo Cadrobbi for their work on time syn-chronization and the finite elements model, respectively, andProf. Giovanni Soncini for his support in developing the FOSread-out system.
8. REFERENCES[1] G. Barrenetxea, F. Ingelrest, G. Schaefer, and M. Vetterli. The
hitchhiker’s guide to successful wireless sensor networkdeployments. In Proc. of the 6rd Int. Conf. on Embedded NetworkedSensor Systems (SENSYS), 2008.
[2] J. Bonwick. The slab allocator: An object-caching kernel memoryallocator. In USENIX Summer, 1994.
[3] K. Chintalapudi, T. Fu, J. Paek, N. Kothari, S. Rangwala, J. Caffrey,R. Govindan, E. Johnson, and S. Masri. Monitoring civil structureswith a wireless sensor network. Internet Computing, 10(2), 2006.
[4] K. Chintalapudi, J. Paek, O. Gnawali, T.S. Fu, K. Dantu, J. Caffrey,R. Govindan, E. Johnson, and S. Masri. Structural damage detectionand localization using netshm. In Proc. of the 5th Int. Conf. onInformation Processing in Sensor Networks (IPSN), 2006.
[5] P. Costa, L. Mottola, A. L. Murphy, and G. P. Picco. Programmingwireless sensor networks with the TeenyLIME middleware. In Proc.of the 8th ACM/USENIX Int. Middleware Conf., 2007.
[6] S. Ganeriwal, R. Kumar, and M. B. Srivastava. Timing-sync protocolfor sensor networks. In Proc. of the 1st Int. Conf. on EmbeddedNetworked Sensor Systems (SENSYS), 2003.
[7] O. Gnawali, K. Jang, J. Paek, M. Vieira, R. Govindan, B. Greenstein,A. Joki, D. Estrin, and E. Kohler. The Tenet architecture for tieredsensor networks. In Proc. of the 4th Int. Conf. on EmbeddedNetworked Sensor Systems (SENSYS), 2006.
[8] www.gumstix.com.[9] D. A. Huffman. A method for the construction of
minimum-redundancy codes. Proc. of IRE, 40(9):1098–1101, 1952.[10] S. Kim, S. Pakzad, D. Culler, J. Demmel, G. Fenves, S. Glaser, and
M. Turon. Health monitoring of civil infrastructures using wirelesssensor networks. In Proc. of the 6th Int. Conf. on InformationProcessing in Sensor Networks (IPSN), 2007.
[11] P. Levis, N. Patel, D. Culler, and S. Shenker. Trickle: Aself-regulating algorithm for code propagation and maintenance inwireless sensor networks. In Proc. of the 1st Conf. on NetworkedSystems Design and Implementation (NSDI), 2004.
[12] K. Lin and P. Levis. Data discovery and dissemination with DIP. InProc. of the 7th Int. Conf. on Information Processing in SensorNetworks (IPSN), 2008.
[13] J. P. Lynch and K. J. Loh. A summary review of wireless sensors andsensor networks for structural health monitoring. Shock and VibrationDigest, Mar 2006.
[14] J. P. Lynch, A. Sundararajan, K. H. Law, A. S. Kiremidjian, andE. Carryer. Power-efficient data management for a wireless structuralmonitoring system. In Proc. of the 4th Int. Wrkshp. on StructuralHealth Monitoring, 2003.
[15] A. Mainwaring, D. Culler, J. Polastre, R. Szewczyk, and J. Anderson.Wireless sensor networks for habitat monitoring. In Proc. of the 1st
Int. Wkshp. on Wireless Sensor Networks and Applications, 2002.[16] Octopus Home Page.
http://csserver.ucd.ie/~rjurdak/Octopus.htm.[17] C. Park, K. Lahiri, and A. Raghunathan. Battery discharge
characteristcs of wireless sensor nodes: An experimental analysis. InProc. of the IEEE Int. Conf. on Sensor and Ad-hoc Communicationsand Networks (SECON), 2005.
[18] J. Polastre, R. Szewczyk, and D. Culler. Telos: enabling ultra-lowpower wireless research. In Proc. of the 5th Int. Conf. on InformationProcessing in Sensor Networks (IPSN), 2005.
[19] B. Raman and K. Chebrolu. Censor networks: a critique of "sensornetworks" from a systems perspective. SIGCOMM Comput.Commun. Rev., 38(3), 2008.
[20] TinyOS Official Source Tree. www.tinyos.net.[21] A. Woo, T. Tong, and D. Culler. Taming the underlying challenges of
reliable multihop routing in sensor networks. In Proc. of the 1st Int.Conf. on Embedded Networked Sensor Systems (SENSYS), 2003.
[22] N. Xu, S. Rangwala, K. Chintalapudi, D. Ganesan, A. Broad,R. Govindan, and D. Estrin. A wireless sensor network for structuralmonitoring. In Proc. of the 2nd Int. Conf. on Embedded NetworkedSensor Systems (SENSYS), 2004.
[23] D. Zonta, M. Pozzi, and P. Zanon. Manging the historical heritageusing distributed technologies. Int. Journal of Architectural Heritage,2(3), 2008.
[24] D. Zonta, M. Pozzi, P. Zanon, G. A. Anese, and A. Busetto.Real-time probabilisitc health monitoring of the portogruaro civictower. In Proc. of the 6th Int. Conf. on Structural Analysis ofHistorical Constructions, 2008.