modulation techniques for an airborne laser scanner
TRANSCRIPT
Modulation techniques for an airborne laser scanner
Stanley R. Robinson and Robert C. Chapuran
Methods of modulating the laser output power of an airborne scanner which can measure slant range and re-flectance are analyzed. The performance factors used in the range measurement are the range ambiguityinterval, the range resolution, and the variance of the range estimate. Variance of the estimate is used tocompare reflectance measurements. Three modulation techniques-the sinusoid, the FM chirp of a subcar-rier, and a pseudonoise (PN) coded pulse train-are shown to have promise. If range ambiguity can be tol-erated, the simplicity of the sinusoidal modulation technique makes it a prime contender, while the PN-coded technique shows most promise as detector and laser modulation bandwidth increase.
I. Introduction
Laser imaging systems which obtain both reflectanceand range information have recently appeared in theliterature.' The usefulness and accuracy of the rangedata obtained from such systems depend on the methodused to modulate the laser. The purpose of this paperis to investigate methods of modulating the laser andto determine the estimation performance of both therange and the reflectance measurements for each of theproposed techniques.
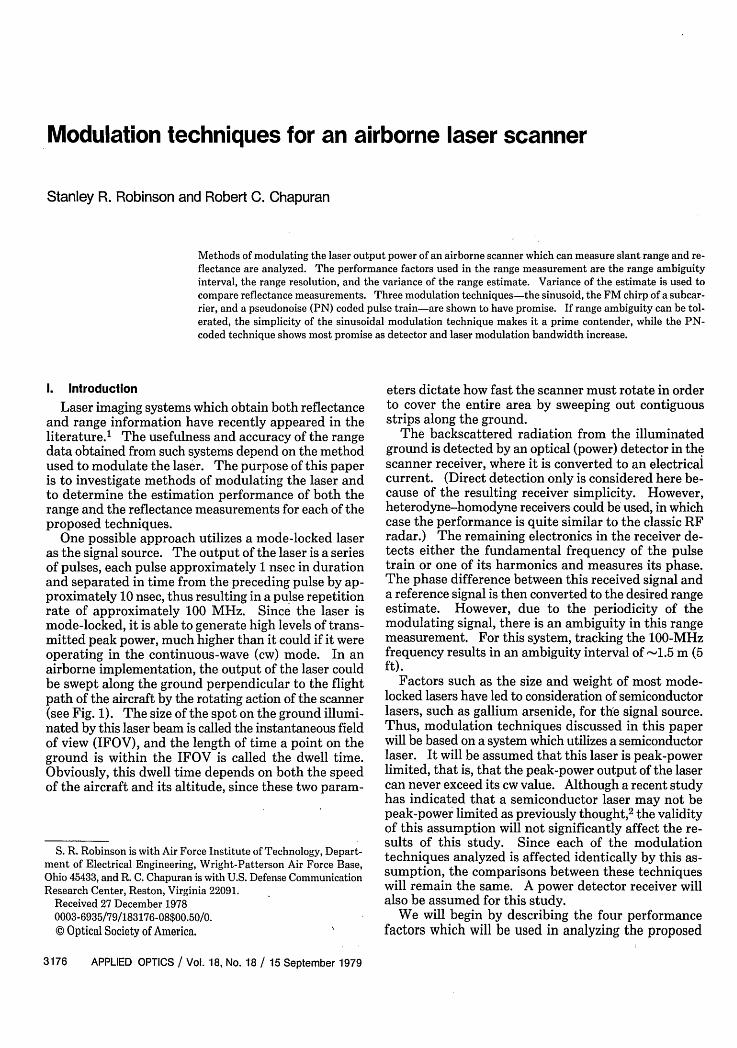
One possible approach utilizes a mode-locked laseras the signal source. The output of the laser is a seriesof pulses, each pulse approximately 1 nsec in durationand separated in time from the preceding pulse by ap-proximately 10 nsec, thus resulting in a pulse repetitionrate of approximately 100 MHz. Since the laser ismode-locked, it is able to generate high levels of trans-mitted peak power, much higher than it could if it wereoperating in the continuous-wave (cw) mode. In anairborne implementation, the output of the laser couldbe swept along the ground perpendicular to the flightpath of the aircraft by the rotating action of the scanner(see Fig. 1). The size of the spot on the ground illumi-nated by this laser beam is called the instantaneous fieldof view (IFOV), and the length of time a point on theground is within the IFOV is called the dwell time.Obviously, this dwell time depends on both the speedof the aircraft and its altitude, since these two param-
S. R. Robinson is with Air Force Institute of Technology, Depart-ment of Electrical Engineering, Wright-Patterson Air Force Base,Ohio 45433, and R. C. Chapuran is with U.S. Defense CommunicationResearch Center, Reston, Virginia 22091.
Received 27 December 19780003-6935/79/183176-08$00.50/0.C Optical Society of America.
eters dictate how fast the scanner must rotate in orderto cover the entire area by sweeping out contiguousstrips along the ground.
The backscattered radiation from the illuminatedground is detected by an optical (power) detector in thescanner receiver, where it is converted to an electricalcurrent. (Direct detection only is considered here be-cause of the resulting receiver simplicity. However,heterodyne-homodyne receivers could be used, in whichcase the performance is quite similar to the classic RFradar.) The remaining electronics in the receiver de-tects either the fundamental frequency of the pulsetrain or one of its harmonics and measures its phase.The phase difference between this received signal anda reference signal is then converted to the desired rangeestimate. However, due to the periodicity of themodulating signal, there is an ambiguity in this rangemeasurement. For this system, tracking the 100-MHzfrequency results in an ambiguity interval of -1.5 m (5ft).
Factors such as the size and weight of most mode-locked lasers have led to consideration of semiconductorlasers, such as gallium arsenide, for the signal source.Thus, modulation techniques discussed in this paperwill be based on a system which utilizes a semiconductorlaser. It will be assumed that this laser is peak-powerlimited, that is, that the peak-power output of the lasercan never exceed its cw value. Although a recent studyhas indicated that a semiconductor laser may not bepeak-power limited as previously thought,2 the validityof this assumption will not significantly affect the re-sults of this study. Since each of the modulationtechniques analyzed is affected identically by this as-sumption, the comparisons between these techniqueswill remain the same. A power detector receiver willalso be assumed for this study.
We will begin by describing the four performancefactors which will be used in analyzing the proposed
3176 APPLIED OPTICS / Vol. 18, No. 18 / 15 September 1979
modulation techniques. We will then give a detaileddescription of each of the three techniques and analyzethe performance of each. We will conclude with acomparison of the three techniques based on this per-formance analysis.
II. Performance Factors
In order to simplify the analysis, it will be assumedthat the range is constant in a resolution cell, i.e., in theIFOV, and that the signal has been reflected by a pointtarget. Furthermore, the effects of the spatial filteringoperation of the scanner on the transmitted signal willbe ignored. These effects have been described else-where. 3
In analyzing the three modulation techniques, fourperformance factors will be used; the first factor is theerror variance of the range estimate of the system. Theequations for calculating the error variance depend onthe type of receiver structure being used. Since one ofthe modulation techniques will utilize a harmonictracking receiver while the remaining two utilizematched filter receivers, the equations to be used foreach type of receiver will be described. For the har-monic tracking receiver, the error variance of the rangeestimate is determined by the accuracy of the receiverphase-lock loop (PLL) in tracking the phase of the re-ceived signal. For a PLL operating in its linear region,the variance of its phase error is given by
Ad = (NOWL)/(2PC), (1)
where No/2 is the double-sided noise power spectraldensity, WL is the double-sided closed-loop bandwidthof the PLL (in hertz), and P, is the average power in thereceived signal.4 (This result can also be obtained fromthe Cramer-Rao lower bound discussed in later para-graphs.) For a harmonic tracker, the bandwidth of thePLL need only be as large as is required to pass thespatial information. Thus, WL will be roughly 21-rd Hz,where Erd is the scanner dwell time. Also, since therange error variance is related to the phase error vari-ance by
z
2 = ( 2 (2)
where c is the speed of light and fm is the frequency ofthe harmonic being tracked, the range error variance fora harmonic tracking system can be expressed by
0" ~~~~~~~~~~~(3)1(4rm Pc Td
Use of this equation assumes that the PLL is operatingin its linear region and that the dominant noise in thereceiver is zero-mean, additive white noise. Note thatthe Gaussian noise assumption is not required.
For the matched filter receivers, the range errorvariance can be found by use of the Cramer-Rao lowerbound. This bound, when applied to the laser scannersystem, gives a theoretical lower bound on the rangeestimation accuracy of the system. Depending on theSNR and the type of processing used, this bound canactually be asymptotically approached in many prac-tical cases. Use of this bound assumes that the fre-quency of the received modulating signal, i.e., the signalat the output of the power detector, is known exactly.It also assumes that several conditions of regularity,usually adequately approximated in practice, are metby the modulating signal. Although the derivation ofthe bound does not require a high SNR in the receivedsignal, a high SNR (much greater than 1) is required forthis bound to be approached. And, finally, use of thebound assumes that the noise process is additive whiteGaussian noise.5 This last assumption could conceiv-ably invalidate use of the variance equation derivedfrom the Cramer-Rao bound, since the assumption ofGaussian noise may not be valid for the detector in thescanner system. Rather, a doubly stochastic Poissonprocess model, which is characteristic of the shot noiseof the optical detector, may be more appropriate. 6 7
However, it can be shown that the range error variancederived using a leading-edge analysis, which does notrequire the Gaussian assumption, results in an expres-sion fairly close to the lower bound provided by theCramer-Rao method.8
Application of the Cramer-Rao lower bound to thematched filter receiver results in an error variance of thetime delay measurement which is given by
a2= No/(2E 2 ), (4)
where N0 /2 is the double-sided noise spectral density,E is the total energy in the received signal, and 32 is themean-squared bandwidth of the signal, defined as
4X2 f f2 U(f) 12df
(5)
f l IU(f) 2df
where U(f) is the magnitude of the frequency spectrumof the complex representation of the signal modulation. 5
Changing Eq. (4) to a range error variance results in
(6)a = ( 2No)/(5E02),
Fig. 1. Basic geometry of the laser scanner system.
which is the equation that will be used in the analysisof the matched filter receiver.
15 September 1979 / Vol. 18, No. 18 / APPLIED OPTICS 3177
/Y
OF SCAN
x
PIl'
Pa L
S INE-WAVE DCGENERATOR LASER
M ~~BIAS
Pll _ a ( + cos2,fm tI2 m
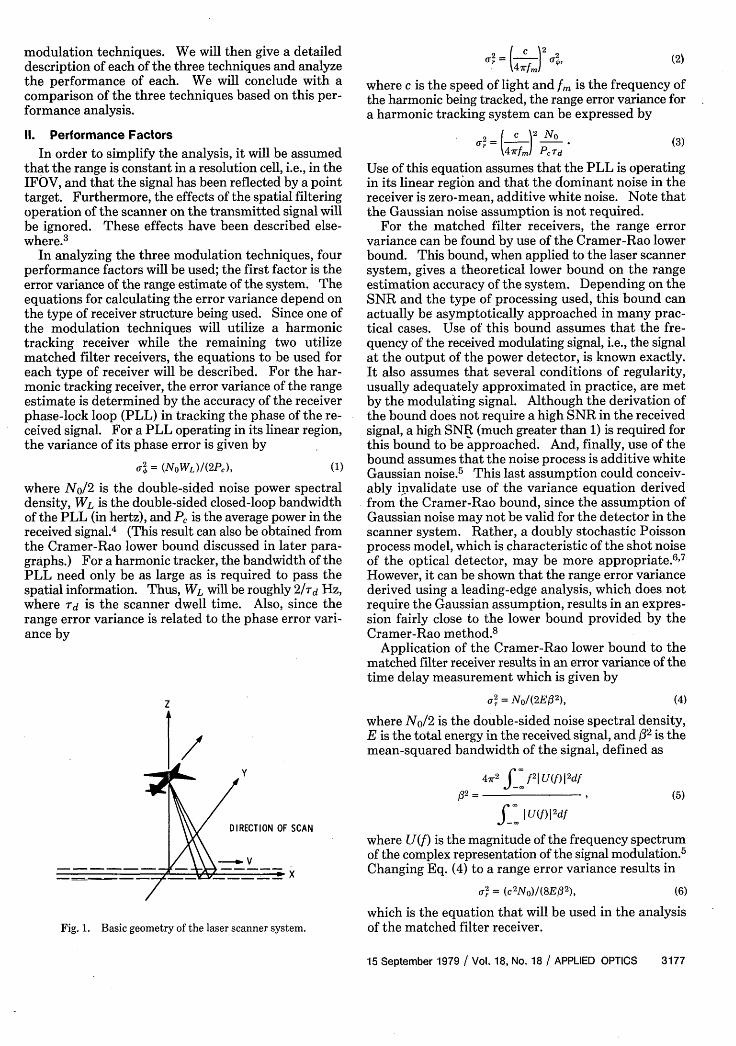
Fig. 2. Transmitter for a single-sinusoid system.
the system configuration. The resulting sinusoid, ofamplitude PaR/2, is used to calculate both the range andthe reflectance estimates. The range is calculated bymeans of a phase-lock loop which tracks the phase of thesinusoid and compares it to a reference signal. Byfilter output. Since this is an arbitrary measure, a givensystem may be able to resolve ranges much closer thanthis criterion would indicate. However, even if it is aworst-case estimate, it is still useful both for obtaininga rough estimate of the resolution and for comparing therelative advantages of several different systems.
The final performance factor of interest is that of therange ambiguity interval of the system. In a harmonictracking receiver, the ambiguity is caused by the peri-odicity of the phase every 2 ir rad. In a matched filterreceiver, it is caused by the periodicity of the modulatingsignal every T sec, where T is its period. In both cases,the range ambiguity interval can be found from
ramb = (cT)/2 = c/(2fm ).
Fig. 3. Receiver structure for a single-sinusoid system.
The second performance factor is that of the errorvariance of the reflectance estimate. Once again, it willbe assumed that the reflectance is constant in a reso-lution cell and that the signal has been reflected by apoint target. In both the harmonic tracking receiverand the matched filter receivers, the reflectance esti-mate will be obtained by maximum-likelihood pro-cessing of the received signal.9 The equation for theerror variance of the reflectance estimate derived fromthe maximum-likelihood processor is given by
2= No/(2E). (7)
Use of this equation assumes that the noise in the sys-tem is additive white noise with zero mean. Once again,the Gaussian noise assumption is not required.
The third performance factor to be used is that of therange resolution of the system. This range resolutionis a measure of how close together in slant range twoobjects can be placed and still be distinguished from oneanother by the scanner receiver. This is equivalent tothe concept of nominal resolution which is defined forradar systems.10 For the three techniques discussedin this paper, a conventional, though arbitrary, measureof the range resolution can be calculated from thehalf-power width of the main lobe of the time-auto-correlation function of the modulating signal. For thosetechniques which utilize matched filters in the scannerreceiver, this is just the half-power width of the matched
Thus, although it may be possible to estimate the rangeaccurately within the ambiguity interval, the receivercannot determine in which interval the actual range islocated.
111. Analysis of Proposed Systems
A. Sinusoidal Power Modulation
Now that the system performance factors have beenintroduced, the three modulation techniques can bedescribed and analyzed. The first technique is a har-monic tracking technique in which the output power ofthe laser is amplitude-modulated by a single sinusoidof arbitrary frequency fin. The laser output is gener-ated (conceptually) simply by adding a direct-current(dc) bias to the output of a sine-wave generator and thenusing the resulting signal to excite the laser (see Fig. 2).Although the addition of a dc bias may be accomplishedinternally by the laser modulator, it will still be con-sidered as a separate component of the over-all systemconfiguration.
The receiver structure for this system tracks the re-ceived sinusoid and measures range by calculating thephase change between the received signal and a refer-ence signal (see Fig. 3). In particular, the receivedsignal P(t) is first detected by a power detector whichconverts it to a current id (t) of value
id (t -(1 + cos27rfmt),2
where Pa is the cw power of the laser and R is the re-sponsivity of the detector in amperes per watt. Forsimplicity, the power losses due to such factors as thedistance between the transmitter and the scannedobject, atmospheric attenuation, and losses in the opticsof the system have been ignored, since they are the samefor all the systems to be discussed. The detector cur-rent id (t) is then passed through a blocking capacitorin order to eliminate the dc term. Although this fil-tering action may be inherent in the power detector it-self, it again will be considered as a separate element in
3178 APPLIED OPTICS / Vol. 18, No. 18 / 15 September 1979
(8)
(9)
providing both the transmitted signal and a range cor-rection signal (which corrects for the geometry of thescanning process) as inputs to the PLL in addition tothe received sinusoid, the output of the PLL is the phasechange that corresponds to the corrected slant rangefrom the scanner to the scanned object, or target. Alow-pass filter after the PLL eliminates the double-frequency term which is generated by the PLL, and theamplifier which follows converts the measured phasechange into the desired slant range estimate. The re-flectance estimate in this receiver is calculated simplyby means of a radio-frequency (RF) coherent de-tector.
The range error variance of this system can be cal-culated by use of Eq. (3), resulting in
2 = 2N (10)r r 2fR 2 r (10)
We observe that the range error variance of this systemcan be decreased by increasing the modulation fre-quency fin.
In order to calculate the error variance of the reflec-tance estimate, Eq. (7) can be used, resulting in
2 4NoP PR 2 Td
As can be seen, the only way to decrease this varianceis either by lengthening the observation interval Td orby increasing the laser power Pa. The resolution of thesystem is calculated from the half-power width of thetime-autocorrelation function of the modulating signal.For a sinusoid, this leads to a minimum resolvable dis-tance of
Rres = c/(8fm ). (12)
Thus, the higher the modulating frequency, the betterthe resolution. As an example, using a frequency ofabout 100 MHz, the system would be able to distinguishdistances of -0.3 m (1.2 ft). However, a frequency of10 MHz would result in a resolution of only 3.7 m (12.3ft). Although these figures provide a rough estimateof the resolution of the system, they are, as explainedpreviously, worst-case estimates. A receiver operatingat high SNRs should be able to distinguish objectswhich are much closer together than these figures wouldindicate.
The final performance factor of interest is that of theambiguity interval of the system. From Eq. (8), weobtain
ramb = c/(2fm). (13)
Thus, for a modulating frequency of 100 MHz, theambiguity interval would be roughly 1.5 m (5 ft),whereas for a frequency of 10 MHz, it would be -15 m(50 ft). Although decreasing fm would solve the am-biguity problem, it would also degrade both the rangeestimation performance and the resolution of thesystem.
B. Linear Frequency Modulation on a Subcarrier
The second technique to be considered is one whichutilizes a pulse-compression technique commonly used
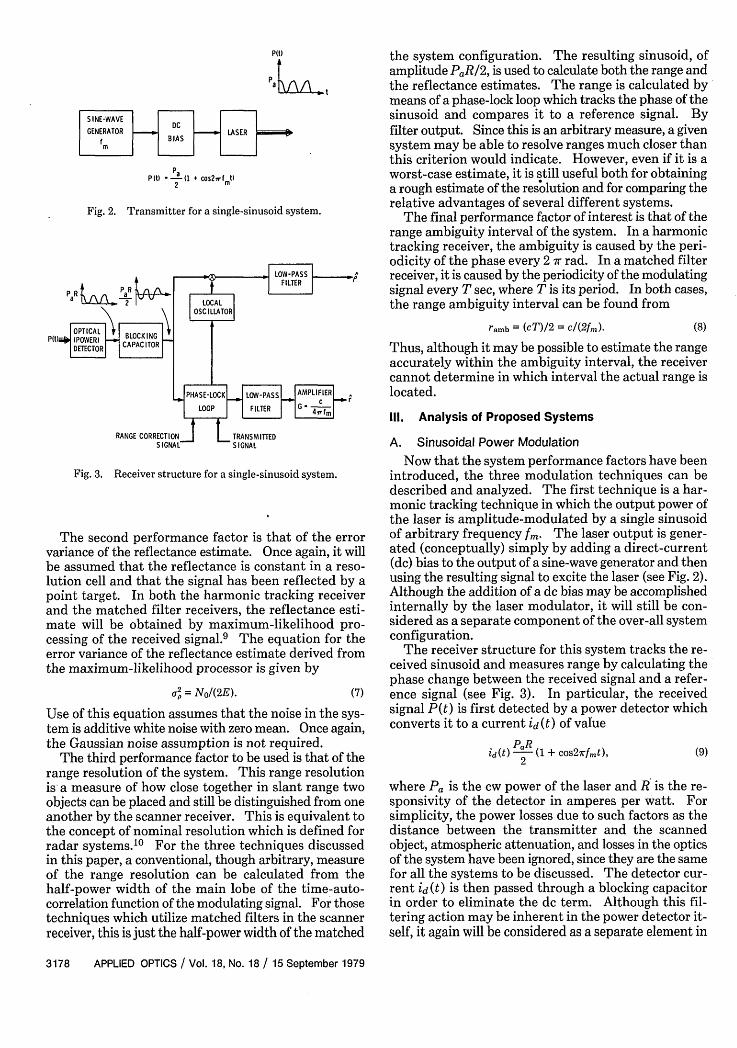
in radar systems, that of linear frequency modulation(FM). In a linear FM pulse, also called a chirp pulse,the carrier frequency is linearly increased so that at theend of the pulse, it is Af Hz higher than at the start. Aslong as the time-bandwidth product of the pulse islarge, Tp Af > 20, the frequency spectrum of the chirpis approximately rectangular with a total bandwidth ofAf Hz and is centered at what is called the carrier fre-quency fo.5 The obvious method of applying theFM-chirp technique to the laser scanner is by chirpingthe frequency of the laser itself. However, even if thiswere possible, it would not be feasible for use with adirect-detection receiver. Therefore, an alternativemethod must be found which utilizes some type ofsubcarrier modulation. Figure 4 shows just such amethod. In this system, an impulse is generated everyTd sec and is passed through an expansion filter. If theimpulse is of the form
sin AT t2
s(t) = cos27rfot,
-t2
(14)
where the pulse duration Tp is taken to be -Td sec andyu is a proportionality constant, the output of the filterwill be the desired series of contiguous chirp pulses.Adding a dc bias to this signal and then using it to excitethe laser results in an optical signal which has beenamplitude-modulated by an FM-chirp pulse.
The receiver for this FM-chirp system is alsostraightforward (see Fig. 5). After the received optical
Sin GENERATOR -EXPANS ION [C 1..2ASER 1 PIx FILTER BIAS
Fig. 4. Passive chirp transmitter.
Pit) COMESION THRESHOLD AMPLIFIERDETECTOR CAPACIOR FILTER DEETR G
RANGECHOE CORRECTIONLRET R SIGNAL
P
Pa 0 r'd
PaR i
<{ 2 W e IJh8 t
idt
P R
rd
(d) 0 I
Fig. 5. Receiver structure and related waveforms for a linear FMsystem.
15 September 1979 / Vol. 18, No. 18 / APPLIED OPTICS 3179
signal has been converted to an electrical signal by thepower detector, it is passed through a blocking capacitorwhich eliminates the dc term. The resulting signal,which is just the original series of chirp pulses, is thenpassed through a compression filter which is matchedto this chirp signal. The output of this filter is thecompressed pulse which is typical of a chirp system, thewidth of which is inversely proportional to the fre-quency deviation Af of the FM pulse.
In order to generate the range estimate in this re-ceiver, the output of the matched filter is passedthrough a threshold detector which marks the timewhen the output exceeds a predetermined threshold.The relative time delay from the beginning of the cur-rent T d -sec interval is then calculated and is convertedto a slant range estimate by an amplifier following thedetector. This range estimate is then combined withthe range correction signal in order to produce the cor-rected estimate of the target's slant range from thescanner. A reflectance estimate is also calculated fromthe matched filter output by choosing the peak valueof the output every time a range estimate is gener-ated.
In order to calculate the range error variance for thissystem, Eq. (6) can be used. Since the input to thematched filter is an FM pulse of amplitude PaR/2 andduration Td sec, the received energy is
E = (P2R2 Td)/8. (15)
Also, for large time-bandwidth products, -rdAf > 20,the value of the mean-squared bandwidth has beencalculated to be5
fl2 = (7r2Af2 )/3. (16)
Thus, the range error variance for the FM-chirp systembecomes
2 3C 2NO (17)
7r2 Af 2 p 2R 2Td
As can be seen from Eq. (17), the accuracy of the FM-chirp system can be increased either by increasing thefrequency deviation Af of the signal or by increasing thereceived energy, i.e., increasing either the laser powerPa or the pulse duration Td. For the case of non-Gaussian noise statistics, the range error variance de-rived by using a leading-edge analysis turns out to behigher than the variance found above by a factor ofapproximately 1.9.8
The reflectance error variance for this system can alsobe calculated using Eq. (7), resulting in
a2= (4NO)/(p2R 2 rd). (18)
Once again, this variance can be decreased by increasingeither Pa or -rd, which is equivalent to increasing thereceived energy per resolution cell.
The resolution of the system can be calculated fromthe half-power width of the output of the compressionfilter in the receiver, resulting in
Rres = (0.45c)/(Af). (19)
As an example, a Af of 100 MHz would result in a reso-
lution of 1.3 m (4.4 ft), while a Af of 1 GHz would leadto a 0.12-m (0.4-ft) resolution.
The final performance characteristic of the systemis that of its ambiguity interval. From Eq. (8), this isfound to be
ramb = (CTd)/2 . (20)
For a dwell time of 1.6 ,usec the ambiguity interval turnsout to be -238 m (782 ft). For a smaller dwell time of0.33 ,usec, the ambiguity interval is still quite large, 49m (162 ft). However, whether or not this interval islarge enough for use in a particular system depends onthe application of interest.
The implementation of an FM-chirp system as justdescribed would encounter several problems. The firstwould be the modulation of the laser. In an operationalsystem, requirements for the accuracy of the range es-timate and for the resolution of the system (both de-pendent on Af) would dictate a high value of Af. Thus,the highest frequency in the chirp noise could conceiv-ably be in the gigahertz region. The problem, then,would be to how high a frequency could a semiconductorlaser be modulated before it became inoperable. Arecent study has shown that a 25-MHz modulation rateis easily obtainable with currently available semicon-ductor lasers.2 However, this study did not attempt todetermine the maximum modulation rate achievable.If this maximum rate does not turn out to be highenough for system requirements, further developmentalwork in laser modulation may be required before anFM-chirp system becomes feasible.
The second problem would be in the required detec-tor bandwidth. The detector will have to have at leasta bandwidth equivalent to the highest frequency in thechirp pulse. This again could be in the gigahertz region.Thus, the FM-chirp system trades bandwidth for per-formance. The greater the available bandwidth, thebetter the system performance.
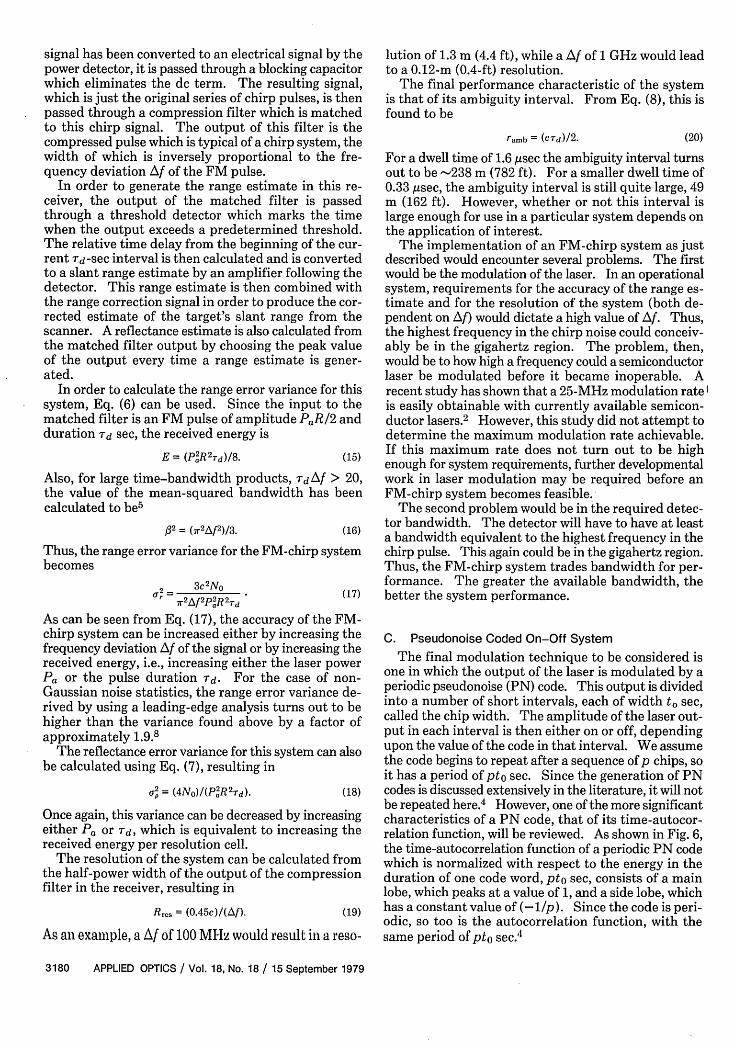
C. Pseudonoise Coded On-Off SystemThe final modulation technique to be considered is
one in which the output of the laser is modulated by aperiodic pseudonoise (PN) code. This output is dividedinto a number of short intervals, each of width to sec,called the chip width. The amplitude of the laser out-put in each interval is then either on or off, dependingupon the value of the code in that interval. We assumethe code begins to repeat after a sequence of p chips, soit has a period of pto sec. Since the generation of PNcodes is discussed extensively in the literature, it will notbe repeated here.4 However, one of the more significantcharacteristics of a PN code, that of its time-autocor-relation function, will be reviewed. As shown in Fig. 6,the time-autocorrelation function of a periodic PN codewhich is normalized with respect to the energy in theduration of one code word, pto sec, consists of a mainlobe, which peaks at a value of 1, and a side lobe, whichhas a constant value of (-l/p). Since the code is peri-odic, so too is the autocorrelation function, with thesame period of pto sec.4
3180 APPLIED OPTICS / Vol. 18, No. 18 / 15 September 1979

A transmitter which will generate just such a PN-coded output can be easily constructed (Fig. 7). A dcbias is first added to the output of a waveform generatorwhich produces the PN-coded binary signal. Thissignal is then used to excite the laser, resulting in thedesired coded on-off output. In order to maximize theenergy transmitted in each code word, the time durationof the code, pto sec, is set equal to the dwell time of thescanner, T d sec.
R t
.r~~~~~~~~~~~~~~~~~~~~~~~~~~~~~~~~~~~t
p
Fig. 6. Time-autocorrelation function of a periodic PN waveform.
CODEDWAVEFORM BISC GENERATORBISLERPt
put)
P
a to~ ] F
Fig. 7. Transmitter for a PN-coded on-off system.
The receiver structure for this system is slightly morecomplicated (Fig. 8). The received signal is first con-verted to an electrical current by the power detector andis then passed through a blocking capacitor to eliminatethe dc term. The resulting signal, which is just theoriginal binary-coded waveform, is sent into a tappeddelay line which has a total of p taps and where thedelay between taps is to sec. The output of each ofthese taps is multiplied by the appropriate value, 11,and then sent into a summing network. These p mul-tipliers are set equal to the transmitted PN code, withthe first code bit being placed into the multiplier at thelast tap on the delay line. The result of this delay-linesummer network is that when the current code word hasbeen received, i.e., it is completely within the delay line,it is, in effect, decoded by the multipliers, so that theoutputs of all of the multipliers add together in phase.The result is a signal at the summer output whose am-plitude is p times the original amplitude and whoseduration is to sec. Due to the characteristics of a PNcode, all other combinations of code bits in the delay linewill result in destructive addition in the summer, andthe resultant summer output will be a signal whoseamplitude is a constant negative value.
The output of this summing network is routedthrough a filter which is matched to the t-sec chipwidth of the signal. As long as the summer output isnegative, the output of this filter will also be negative.However, when the summer output peaks due to thereception of the complete code word, the output of thefilter will be the sharp peak corresponding to the mainlobe of the time-autocorrelation function of the PNcode. The width of this output is dependent only on thesize of the chip width to, and its peak value is propor-tional to the energy contained in the entire rd-sec pulse.The output of this filter is processed in the same manneras in the FM-chirp system. Thus, the range estimateis generated from the time-delay information obtainedby a threshold detector, and the reflectance estimate isgenerated by noting the peak value of the output everytime a range estimate is generated.
The range error variance for this system can again becalculated by using Eq. (6). For this system, the energyin one complete code word of duration -rd sec is givenby
E = (Pa2,R21-d)/4. (21)
Also, the value for the mean-squared bandwidth of thePN code can be calculated to be4 .
Pa :I FU LP r tL I
2 ,
ti
Pa R I
PR
2 E
(p-to
ptD
Fig. 8. Receiver structure and associated waveforms for a PN-codedon-off system. (Waveforms assume that the system has been oper-
ating for at least pto sec.)
/32 = [4(p + 1)]/(7rpt2). (22)
Thus, the range error variance for the PN system be-comes
2 7rc2NotoI R 8p2 2(p + 1) (23)
As can be seen from this equation, the accuracy can beimproved either by decreasing the chip width to andincreasing the code length p or by increasing the re-ceived energy.
The reflectance error variance is calculated from Eq.(7), resulting in
15 September 1979 / Vol. 18, No. 18 / APPLIED OPTICS 3181
at
2 = (2NO)/(P2R2 d). (24)
Once again, the reflectance performance can be im-proved only by increasing the received energy.
The resolution of the system is calculated from thehalf-power width of the matched filter output, resultingin
Rres = 0.3cto. (25)
As an example, for a chip width of 10 nsec, the systemresolution would be roughly 0.9 m (3 ft). Decreasing toto 5 nsec improves the resolution to -0.6 m (1.5 ft).
The final performance factor, the ambiguity interval,is found from Eq. (8) to be
ramb = (CTd)/2, (26)
which is identical to that of the FM-chirp system.The difficulty of implementing a PN-coded system
would depend on the required performance. In orderto obtain good resolution capabilities the chip widthmust be on the order of 5 nsec or less. This would re-quire a PN-code generator operating at 200 Mbits/secor greater. Although this may be too fast a rate for agenerator which uses a linear shift register, new tech-nology using surface acoustic waves" as well ascharge-coupled devices'2 shows promise for such ap-plications. Also, for nanosecond chip widths, the codelength p would be several hundred, based on the presentdwell time. Again, development of delay lines usingsurface-wave technology should result in devices ca-pable of handling these requirements.' 3
A 5-nsec chip width would also require the laser to bemodulated at a rate of 200 MHz. As discussed earlier,the feasibility of this is unknown at the present time andwill have to be investigated. And, finally, for this chipwidth, the detector would have to have a bandwidth ofapproximately 400 MHz.
IV. Comparison of Proposed Systems
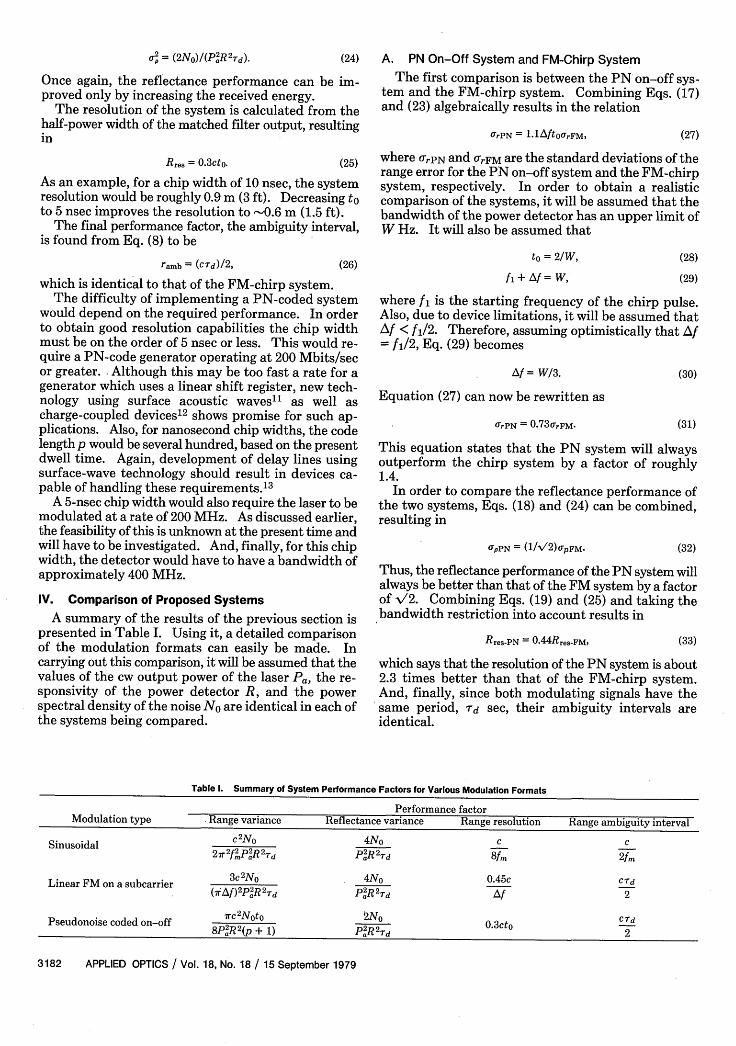
A summary of the results of the previous section ispresented in Table I. Using it, a detailed comparisonof the modulation formats can easily be made. Incarrying out this comparison, it will be assumed that thevalues of the cw output power of the laser Pa, the re-sponsivity of the power detector R and the powerspectral density of the noise No are identical in each ofthe systems being compared.
A. PN On-Off System and FM-Chirp System
The first comparison is between the PN on-off sys-tem and the FM-chirp system. Combining Eqs. (17)and (23) algebraically results in the relation
0,PN = llAftO0rFM, (27)
where 0IrPN and yrFM are the standard deviations of therange error for the PN on-off system and the FM-chirpsystem, respectively. In order to obtain a realisticcomparison of the systems, it will be assumed that thebandwidth of the power detector has an upper limit ofW Hz. It will also be assumed that
to = 2/W,
f + Af= W.
(28)
(29)
where f is the starting frequency of the chirp pulse.Also, due to device limitations, it will be assumed thatzAf < fl/2. Therefore, assuming optimistically that Af= f/2, Eq. (29) becomes
Af = W/3.
Equation (27) can now be rewritten as
OrPN = 0.7 3 OrFM-
(30)
(31)
This equation states that the PN system will alwaysoutperform the chirp system by a factor of roughly1.4.
In order to compare the reflectance performance ofthe two systems, Eqs. (18) and (24) can be combined,resulting in
OYpPN = (l/V/ 2 )apFM. (32)
Thus, the reflectance performance of the PN system willalways be better than that of the FM system by a factorof v/2. Combining Eqs. (19) and (25) and taking thebandwidth restriction into account results in
Rres-PN = 0.4 4 Rres-FM, (33)
which says that the resolution of the PN system is about2.3 times better than that of the FM-chirp system.And, finally, since both modulating signals have thesame period, rd sec, their ambiguity intervals areidentical.
Table 1. Summary of System Performance Factors for Various Modulation Formats
Performance factorModulation type Range variance Reflectance variance Range resolution Range ambiguity interval
Sinusoidal CN 0 4N0 c c27r fm,,PSJ 21Td P2R2Td 8f 2f.
Linear FM on a subcarrier 3c2No 4No 0.45c crd(7 f)2PRR2 d P'R2Td Af 2
Pseudonoise coded on-off 7rc2 Nt(+ 0 2 0.3cto CTd8R 2(p + 1 p 2 d2
3182 APPLIED OPTICS / Vol. 18, No. 18 / 15 September 1979

B. FM-Chirp System and Single-Sinusoid System
The next comparison is between the FM-chirp systemand the single-sinusoid system. Combining Eqs. (10)and (17) and taking the detector bandwidth restrictioninto account results in
UrFM = 7.2(frlW)rs, (34)
where ars is the standard deviation of the range errorof the single-sinusoid system. Although the value of ris also restricted to an upper limit of W Hz, it would notbe practical to use such a high frequency due to ambi-guity considerations. Therefore, the value of frn hasbeen left arbitrary. Equation (34) shows that the rel-ative performance of the two systems depends on therelationship of /rn and W. In particular, the chirpsystem will outperform the sinusoid system if
7.2/m < W. (35)
For example, if /r is 100 MHz, the detector bandwidthmust be greater than 700 MHz for the chirp system tobe better. However, if r is only 50 MHz, the detectorneed only have a bandwidth of 360 MHz.
The reflectance performance of the two systems canbe compared by combining Eqs. (11) and (18), resultingin the fact that the reflectance performance is identical.Combining Eqs. (12) and (19) results in
Rres-FM = 10.8(fn/W)Rres-s, (36)
where, once again, the resolution comparison is de-pendent upon the relationship of /r and W. For an rof 100 MHz and a W of 720 MHz as used in the rangeerror comparison, the resolution of the sinusoid systemis about 1.5 times better than that of the chirp system.And, finally, the ambiguity interval of the chirp systemis definitely better than that of the sinusoid system sinceit is based on the dwell time of the scanner.
C. PN On-Off System and Single-Sinusoid System
The final comparison is between the PN on-off sys-tem and the single-sinusoid system. Combining Eqs.(10) and (23) and taking the bandwidth restriction intoaccount leads to
OfrPN = 5.6(f/mW)Grs. (37)
Thus, the range performance of the PN system will bebetter if
5.6fm < W. (38)
For an n of 100 MHz, W must be greater than 560 MHzfor the PN system to be better. For an /n of 50 MHz,the bandwidth needs only to be greater than 280MHz.
Comparing the reflectance performance by combin-ing Eqs. (11) and (24) results in
UpPN = (1/A2)tips. (39)
Thus, the reflectance performance of the PN system isalways better than that of the sinusoid system by afactor of -/2. Combining Eqs. (12) and (25) leads to therelation
Rres-PN = 4.8(/m/W)Rres-s. (40)
Using the values of fm = 100 MHz and W = 560 MHz,as used in the range error comparison, in the aboveequation results in the fact that the resolution capabilityof the PN system is about 1.2 times better than that ofthe sinusoid system. And, finally, once again there isno real comparison of the ambiguity intervals; the PNsystem definitely is the better of the two.
Based upon the previous paragraphs, we emphasizethat any difference in reflectivity variance was due tochange in detected signal energy in the various modu-lation formats. The range variance depended moststrongly on fl2 and, to a lesser extent, on the signal en-ergy in the various modulation schemes. These ob-servations are not surprising in view of well-establishedresults from estimation theory.6 9
V. Conclusions
Three different modulation techniques for obtainingrange and reflectance information have been described,analyzed, and compared. All three techniques appearfeasible for use with a single source scanner. However,problems concerning the actual modulation of the laserwould have to be investigated before either the FM-chirp or the PN system could be implemented.
In addition, if the main goal of the system is sim-plicity, and if the short ambiguity interval is not aproblem, then the single-sinusoid system appears to bethe preferred technique. However, if the ambiguityinterval is indeed a major consideration, then the PNor chirp systems show promise. Although the chirpsystem is feasible, however, it would require a greaterdetector bandwidth for the same performance and thuswould not have much of an advantage over the PNsystem.
Since the PN system trades bandwidth for perfor-mance, using it in place of the sinusoid system places amuch more stringent requirement on the bandwidth ofall the system components, especially that of the powerdetector. However, since its ambiguity interval is de-pendent only on the dwell time of the scanner and itsperformance improves as its bandwidth increases, thePN system is definitely the one to use if the requiredbandwidth is available.
References1. D. Nitzan et at., Proc. IEEE 65, 206 (1977).2. Perkin-Elmer Corporation Report No. 13170, "Gallium Arsenide (GaAs) Diode Laser:
RF Experiment Results," (Perkin-Elmer Corp., Norwalk, Conn., 1976).3. S. R. Robinson and W. D. Strautman, Appl. Opt. 18, 781 (1979).4. W. C. Lindsey and M. K. Simon, Telecommunication Systems Engineering (Prentice-
Hall, Englewood Cliffs, N.J., 1973).5. C. E. Cook and M. Bernfeld, Radar Signals: An Introduction to Theory and Application
(Academic, New York, 1967).6. R. M. Gagliardi and S. Karp, Optical Communication (Wiley, New York, 1976).7. D. L. Snyder, Random Point Processes (Wiley, New York, 1975).8. R. C. Chapuran, "An Analysis of Modulation Techniques for the Simultaneous Mea-
surement of Range and Reflectance Information by an Airborne Laser Scanner," un-published Master's Thesis, Air Force Institute of Technology, Wright-Patterson AFB,Ohio 45433 (December 1976).
9. J. M. Wozencraft and 1. M. Jacobs, Principles of Communication Engineering (Wiley,New York, 1965).
10. A. W. Rihaczek, Principles of High-Resolution Radar (McGraw-Hill, New York,1969).
11. D. P. Morgan and J. P. Sutherland, IEEE Trans. Sonics Ultrason. SU-20, 224 (1973).12. R. Melen and D. Buss, Charge-Coupled Devices: Technology and Applications (IEEE
Press, New York, 1977).13. D. T. Bell et al., IEEE Trans. Sonics Ultrason. SU-20, 181 (1973).
15 September 1979 / Vol. 18, No. 18 / APPLIED OPTICS 3183