modeling of crime pattern in anaocha l.g.a, anambra state ... irem388e82939b1-6973-4d27-8fcb... ·...
TRANSCRIPT
International Journal of Innovative Research in Engineering & Management (IJIREM) ISSN: 2350-0557, Volume-3, Issue-5, September-2016
Copyright © 2016. Innovative Research Publications. All Rights Reserved 403
Modeling of Crime Pattern in Anaocha L.G.A, Anambra State, Nigeria Using GIS Approach
Ojiako, J.C. Department of Surveying &
Geoinformatics, Nnamdi Azikiwe University Awka,
Anambra State, Nigeria
Okafor, C. K. Department of Surveying &
Geoinformatics, Nnamdi Azikiwe University Awka,
Anambra State, Nigeria
Igbokwe, E.C. Department of Surveying &
Geoinformatics, Nnamdi Azikiwe University Awka,
Anambra State, Nigeria
Enedah, I.C. Department of Surveying &
Geoinformatics, Nnamdi Azikiwe University Awka,
Anambra State, Nigeria
ABSTRACT This research paper puts into operation, the application and utilization of Geographical Information System (GIS) in crime management and in security situation analysis for efficient community policing in Nigeria, using Anaocha as case study. The aim was to model crime patterns in Anaocha L.G.A, Anambra state using GIS approach. Methodology adopted included the acquisition of GPS coordinates of crime locations, attribute data and analogue map of Anaocha L.G.A which was scanned and digitized amongst others. The GPS coordinates of the crime locations were imported into ArcGIS environment and a database was designed. The results showed that about 85 out of 88 crimes in the area were committed by males, 27 out of 88 crimes resulted in more than one casualty, 18 out of 88 crimes were shoplifting, out of 88 crimes there were just two cases of kidnapping. It was therefore recommended that the result of this research paper serves as a decision support system in managing crime within Anaocha L.G.A of Anambra State, Security agencies like Vigilantes should complement the efforts of the police in checking crimes especially in areas with no police posts or police station amongst other recommendations.
KEYWORDS: Crime Mapping, Geographic Information System, Database, Spatial Query.
1. INTRODUCTION Crime mapping involves the manipulation and processing of spatially referenced crime data in order to display visually in an output that is informative to the particular user (Alex and Kate 2001). Crime mapping can provide information concerning the location of hotspots or high level of reported crime. Crime analysis is a set of processes applied on relevant information about crime patterns. Administrative and operational personnel can use the result of analysis to prevent and suppress criminal activities and also for investigation aims. Crime prevention seeks to reduce the risks of criminal events and related anti-social behavior by intervening in their causes.
In Anaocha L.G.A, GIS has not yet been viewed as an obligatory technology within the police force, whereas organizations such as the utilities have taken GIS on board, this is due to high cost of GIS tools and lack of GIS experts in the police force. Law enforcement needs information management, especially location information. Traditional law enforcement for different types of police applications really deals with data collection. However, data collection without data analysis is useless. GIS not only allows integration and spatial analysis of data to identify, apprehend, and prosecute suspects, it also improves more proactive measures through effective allocation of resources and better policy setting. It is quite obvious that if the police authorities have goals of improving crime management (crime prevention) in the rural areas, the manual recordings of crime incidents cannot be the way forward. The various police stations under the Anaocha divisional headquarters’ office have the responsibility of handling the various crime incidences under their jurisdiction but at the moment have problems with their recording system and aggregation of crimes incidents in all police stations within their jurisdiction. All the recordings that are done in the police station are manually written in blotters (police blotter is a record of all arrests, crime events, and charges) and it is difficult to do decision making relating to crime management for all the police stations in their jurisdictions. There were also, no system for evaluating the effectiveness of crime prevention initiatives and assistance in the prevention and rapid response to crime. Hence, there is no decision support system for crime management within the Local Government Area
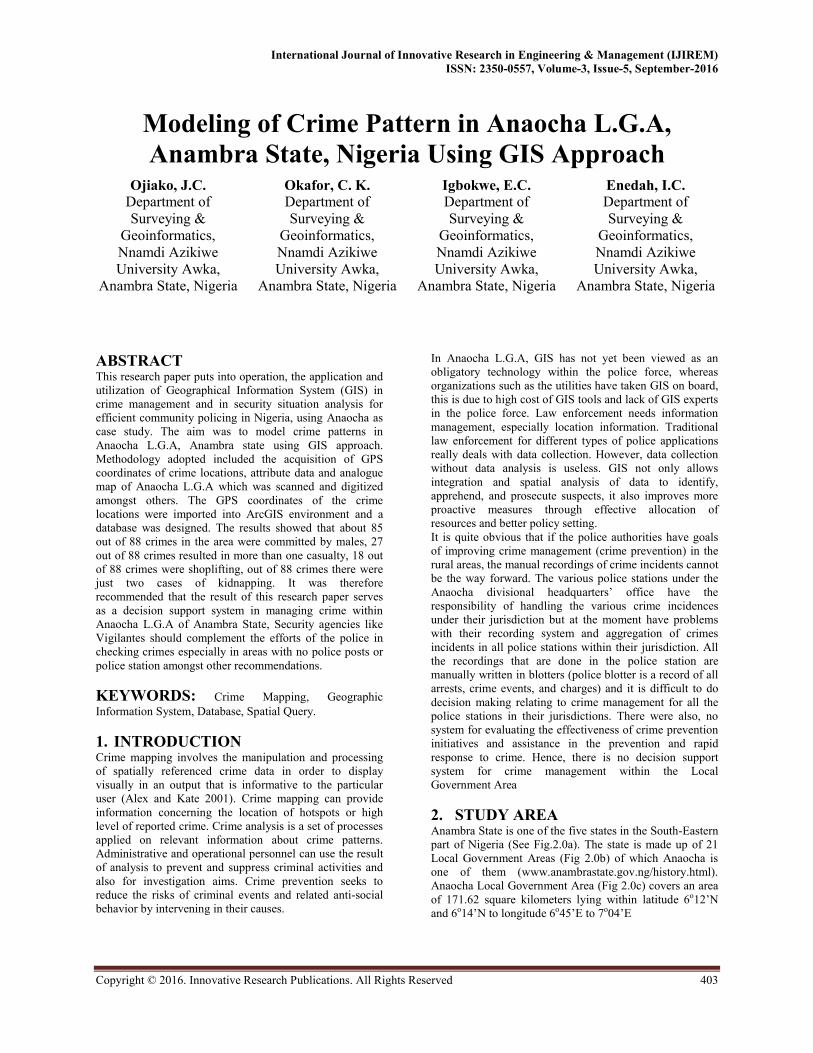
2. STUDY AREA Anambra State is one of the five states in the South-Eastern part of Nigeria (See Fig.2.0a). The state is made up of 21 Local Government Areas (Fig 2.0b) of which Anaocha is one of them (www.anambrastate.gov.ng/history.html). Anaocha Local Government Area (Fig 2.0c) covers an area of 171.62 square kilometers lying within latitude 6o12’N and 6o14’N to longitude 6o45’E to 7o04’E
Modeling of Crime Pattern in Anaocha L.G.A, Anambra State, Nigeria Using GIS Approach
Copyright © 2016. Innovative Research Publications. All Rights Reserved 404
Fig 2.0(a): Map of Nigeria, (b) Map of Anambra State, (c) Map of Anaocha L.G.A.(Study Area) (Source: State Ministry of lands and Survey, Awka. Nigeria)
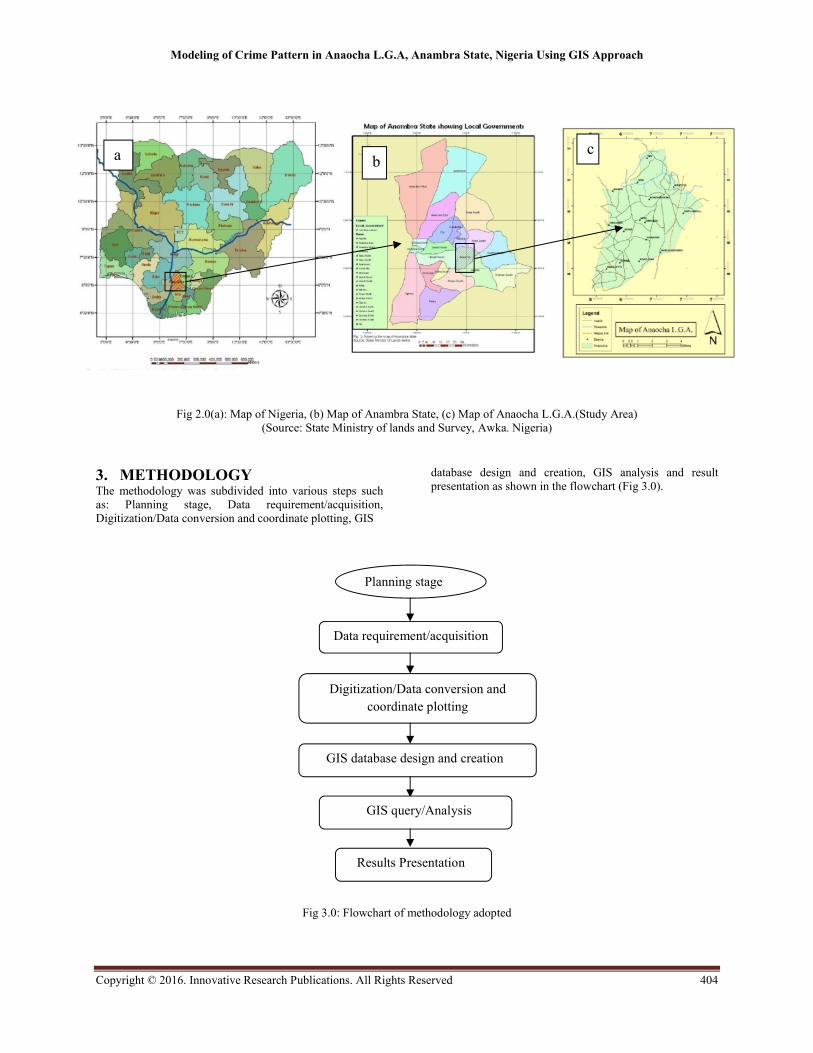
3. METHODOLOGY The methodology was subdivided into various steps such as: Planning stage, Data requirement/acquisition, Digitization/Data conversion and coordinate plotting, GIS
database design and creation, GIS analysis and result presentation as shown in the flowchart (Fig 3.0).
Fig 3.0: Flowchart of methodology adopted
a b c
Planning stage
Data requirement/acquisition
Digitization/Data conversion and
coordinate plotting
GIS database design and creation
GIS query/Analysis
Results Presentation
International Journal of Innovative Research in Engineering & Management (IJIREM) ISSN: 2350-0557, Volume-3, Issue-5, September-2016
Copyright © 2016. Innovative Research Publications. All Rights Reserved 405
3.1 Planning Stage For a proper and effective optimization, planning is very important. In this phase of the research paper, a user requirement analysis was done to focus on what information is presently being used, who is using it and how the source is being collected, stored and maintained. The necessary information can be obtained through interviews, documentations, reviews and workshops.
3.2 Data Requirements/Acquisition The data used for the research is grouped into two main classes; primary and secondary data sets.
3.2.1 Primary Data Source The primary data source that was used for this research included the following:
(i) GPS co-ordinates: The entire crime locations and police stations were co-ordinated using the GPS. The GPS has accuracy of 5 meters which makes it appropriate enough for the purpose of co-coordinating the crime locations since only their locations on the local government map is required.
(ii) Attribute data: this includes non-spatial descriptive information of sites of interest that will be obtained.
3.2.2 Secondary Data Source The secondary data source that was required for this research included the following:
(i) Anaocha L.G.A map at a scale of 1:100,000 showing road network, towns and locations of sites of interest obtained from the Ministry of Lands and Survey Awka Anambra State.
(ii) Paper archives of the crime reports with their locations gotten from the police department in Anaocha L.G.A
(iii) General information about crimes in Anaocha L.G.A was also obtained from journals, networks, newspapers,
3.3 Digitalization/Data Conversion This stage involved the conversion of the topographic map of Anaocha L.G.A which was originally in analogue format into a computer-based format using the AO Scanner. Subsequently, the scanned topographic map was exported to the Arc Map environment for geo-referencing using the Arc GIS 10.1 software. This was then be followed by the creation and on-screen digitizing of shape file layers for each of the geographic features and classes on the map, this was done in order to get a vectorized map of the L.G.A . Each of the layers became themes. The following themes were available amongst others: major roads, crime locations, towns and local government boundary.
3.4 Database Design The creation of a structured, digital database is the most important and complex task upon which the usefulness of the cadastral information system depends. Database design is the process of producing a detailed data model of a database (Hernandez, 2012). The design phase consists of three levels (Kufoniyi, 1998):
3.4.1 Conceptual Design 3.4.2 Logical Design 3.4.3 Physical design
3.4.1 Conceptual Design Conceptual design is the first step in database design where the contents of the intended database are identified and described. It deals with the identification of the basic terrain objects together with the spatial relationship that exist among them. It is human-oriented, often partially structured, model of selected objects and process that are though relevant to a particular problem domain. Conceptual design was carried out independent of the software and hardware that was used to implement the database.
3.4.2 Logical Design This is another stage of the database design in which all the real world entities conceptualized were modeled into the real world using logical design. It is the representation of the conceptual design to reflect the recording of the data in the computer system using a relational database management system (RDBMS) (Effiong and Alagbe, 2012). In this phase, the entities, their attributes and their relationships were represented in a single uniform manner inform of relation in such a way that would be no information loss and at the same time no unnecessary duplication of data.
3.4.3 Physical Design This involves the translation of the real world entities into the computer compactable forms of the chosen structuring model such as relational, geo-relational, network, and hierarchical. For this project, relational (table) structuring method was used due to its easy implementation and management. All geospatial and non spatial (attribute) data were structured and actualized to form a database in a format acceptable by the implementing software and hardware. Thus, point, line and polygon layers were created for spatial objects on the digital map. Attribute data needs of the database were also structured as shown in the following tables. This was done such that;
(i) Stored information can be accessed and retrieved at a later date
(ii) Update can be done from time to time. (iii) Analytical functions can be performed to
answer some generic question for the study ArcGIS 10.1 was used for the database creation for the study area.
4. RESULTS AND DISCUSSIONS Database query involves the retrieval of information stored in the database through the use of certain parameters or criteria based on the researcher’s aim in order to aid in decision-making. The major spatial/attribute query results in the study are shown below in figures 4.0- 4.4. Using the ArcGIS 10.1 software, the following query were generated and discussed:
A. Query 1: Crimes committed in Anaocha Local Government area by Males
A query to determine the crimes committed by males in the years btw 2013- March, 2015 was formulated using the Query module: ("sex" = ‘’male’’) as shown in Fig 4.0

Modeling of Crime Pattern in Anaocha L.G.A, Anambra State, Nigeria Using GIS Approach
Copyright © 2016. Innovative Research Publications. All Rights Reserved 406
Fig 4.0: Query command showing crimes committed by males
From the query result shown in Fig 4.0, it shows that about 85 out of 88 crimes in the area are committed majorly by males. This could be attributed to the number of local delinquents with nothing to keep them busy.
B. Query 2: Crimes with more than 1 casualty in Anaocha Local Government area
A query to determine the crimes with more than 1casualty as crime victim in the area was formulated using the command ("casualties" > ‘’1’’) as shown in Fig 4.1
From the query result shown in Fig 4.1. About 27 out of 88 crimes in the area have more than one casualty as crime victim.
C. Query 3: Shop Lifting Crimes in Anaocha Local Government area
A query to determine the shop lifting crimes in the area was formulated using the command ("Crime_type" = ‘’Shoplifting’’) as shown in Fig 4.2.
Fig 4.1: Query showing crimes with more than 1 casualty
International Journal of Innovative Research in Engineering & Management (IJIREM) ISSN: 2350-0557, Volume-3, Issue-5, September-2016
Copyright © 2016. Innovative Research Publications. All Rights Reserved 407
Fig 4.2: Query Showing Shop Lifting Crimes in the Area
From the query result shown in Fig 4.2 it shows that about 13 out of 88 crimes in the area are shoplifting crimes.
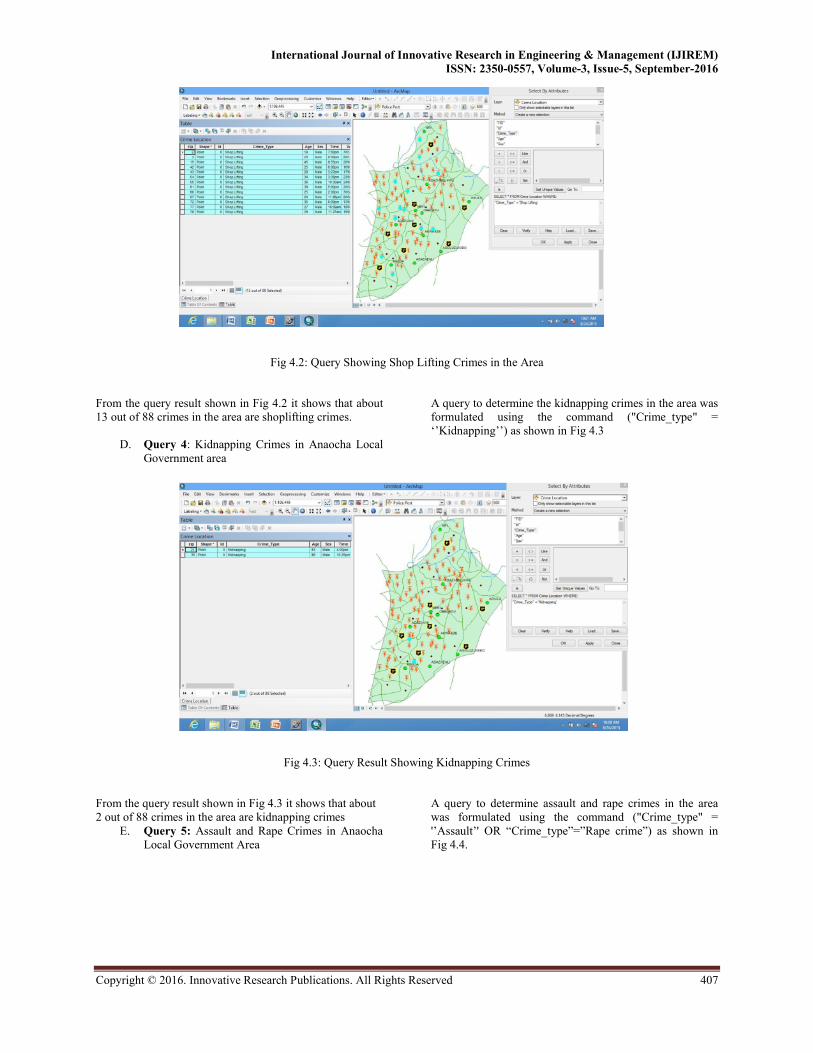
D. Query 4: Kidnapping Crimes in Anaocha Local Government area
A query to determine the kidnapping crimes in the area was formulated using the command ("Crime_type" = ‘’Kidnapping’’) as shown in Fig 4.3
Fig 4.3: Query Result Showing Kidnapping Crimes
From the query result shown in Fig 4.3 it shows that about 2 out of 88 crimes in the area are kidnapping crimes
E. Query 5: Assault and Rape Crimes in Anaocha Local Government Area
A query to determine assault and rape crimes in the area was formulated using the command ("Crime_type" = '’Assault’' OR “Crime_type”=”Rape crime”) as shown in Fig 4.4.
Modeling of Crime Pattern in Anaocha L.G.A, Anambra State, Nigeria Using GIS Approach
Copyright © 2016. Innovative Research Publications. All Rights Reserved 408
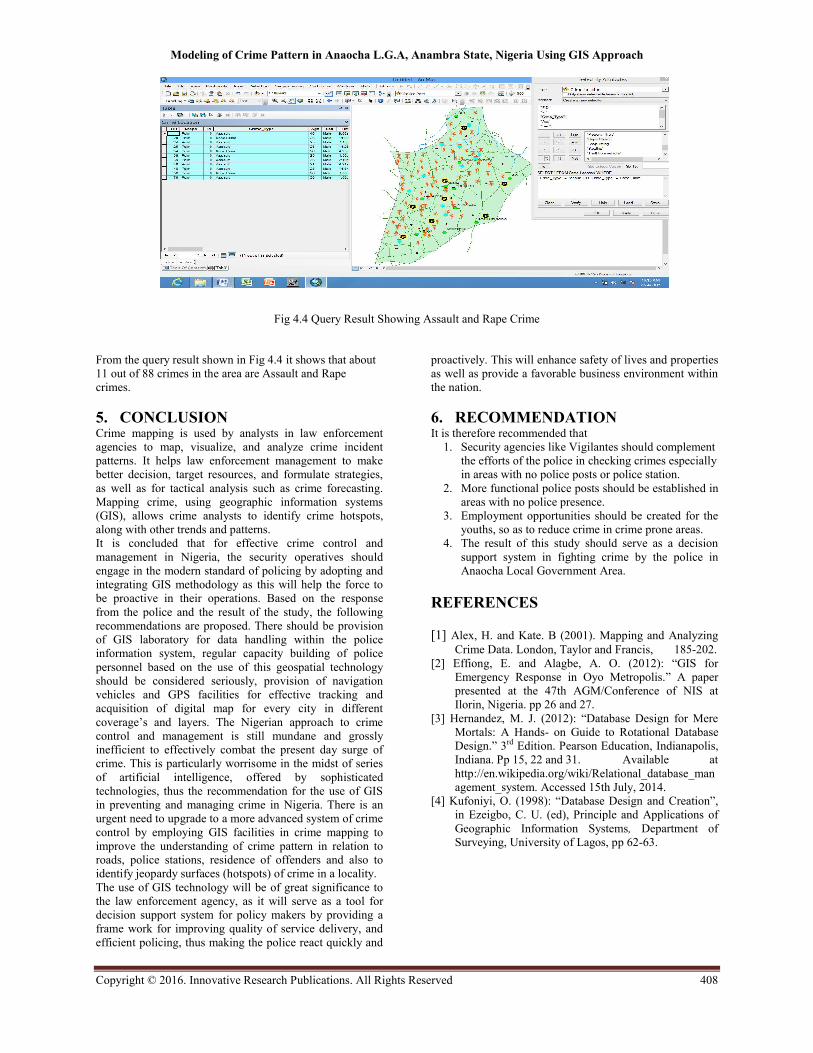
Fig 4.4 Query Result Showing Assault and Rape Crime
From the query result shown in Fig 4.4 it shows that about 11 out of 88 crimes in the area are Assault and Rape crimes.
5. CONCLUSION Crime mapping is used by analysts in law enforcement agencies to map, visualize, and analyze crime incident patterns. It helps law enforcement management to make better decision, target resources, and formulate strategies, as well as for tactical analysis such as crime forecasting. Mapping crime, using geographic information systems (GIS), allows crime analysts to identify crime hotspots, along with other trends and patterns. It is concluded that for effective crime control and management in Nigeria, the security operatives should engage in the modern standard of policing by adopting and integrating GIS methodology as this will help the force to be proactive in their operations. Based on the response from the police and the result of the study, the following recommendations are proposed. There should be provision of GIS laboratory for data handling within the police information system, regular capacity building of police personnel based on the use of this geospatial technology should be considered seriously, provision of navigation vehicles and GPS facilities for effective tracking and acquisition of digital map for every city in different coverage’s and layers. The Nigerian approach to crime control and management is still mundane and grossly inefficient to effectively combat the present day surge of crime. This is particularly worrisome in the midst of series of artificial intelligence, offered by sophisticated technologies, thus the recommendation for the use of GIS in preventing and managing crime in Nigeria. There is an urgent need to upgrade to a more advanced system of crime control by employing GIS facilities in crime mapping to improve the understanding of crime pattern in relation to roads, police stations, residence of offenders and also to identify jeopardy surfaces (hotspots) of crime in a locality. The use of GIS technology will be of great significance to the law enforcement agency, as it will serve as a tool for decision support system for policy makers by providing a frame work for improving quality of service delivery, and efficient policing, thus making the police react quickly and
proactively. This will enhance safety of lives and properties as well as provide a favorable business environment within the nation.
6. RECOMMENDATION It is therefore recommended that
1. Security agencies like Vigilantes should complement the efforts of the police in checking crimes especially in areas with no police posts or police station.
2. More functional police posts should be established in areas with no police presence.
3. Employment opportunities should be created for the youths, so as to reduce crime in crime prone areas.
4. The result of this study should serve as a decision support system in fighting crime by the police in Anaocha Local Government Area.
REFERENCES
[1] Alex, H. and Kate. B (2001). Mapping and Analyzing Crime Data. London, Taylor and Francis, 185-202.
[2] Effiong, E. and Alagbe, A. O. (2012): “GIS for Emergency Response in Oyo Metropolis.” A paper presented at the 47th AGM/Conference of NIS at Ilorin, Nigeria. pp 26 and 27.
[3] Hernandez, M. J. (2012): “Database Design for Mere Mortals: A Hands- on Guide to Rotational Database Design.” 3rd Edition. Pearson Education, Indianapolis, Indiana. Pp 15, 22 and 31. Available at http://en.wikipedia.org/wiki/Relational_database_management_system. Accessed 15th July, 2014.
[4] Kufoniyi, O. (1998): “Database Design and Creation”, in Ezeigbo, C. U. (ed), Principle and Applications of Geographic Information Systems, Department of Surveying, University of Lagos, pp 62-63.