mlc investment management annual investor review main pack: wholesale 30 june 2011
DESCRIPTION
MLC Investment Management Annual Investor Review Main pack: Wholesale 30 June 2011. General advice warning and disclaimer. This information has been provided by MLC Limited (ABN 90 000 000 402) a member of the National Group, 105–153 Miller Street, North Sydney 2060. - PowerPoint PPT PresentationTRANSCRIPT

MLC Investment ManagementAnnual Investor Review Main pack: Wholesale
30 June 2011

2Slide title 2
General advice warning and disclaimer
This information has been provided by MLC Limited (ABN 90 000 000 402) a member of the National Group, 105–153 Miller Street, North Sydney 2060.
Any opinions expressed in this communication constitute our judgement at the time of issue and are subject to change. We believe that the information contained in this communication is correct and that any estimates, opinions, conclusions or recommendations are reasonably held or made as at the time of compilation. However, no warranty is made as to their accuracy or reliability (which may change without notice) or other information contained in this communication.
Past performance is not indicative of future performance. The value of an investment may rise or fall with the changes in the market. Please note that all performance reported is before management fees and taxes, unless otherwise stated.
The specialist investment managers are current as at the date this communication was prepared. Investment managers are regularly reviewed and may be appointed or removed at any time without prior notice to you.
This communication contains general information and may constitute general advice. Any advice in this communication has been prepared without taking account of individual objectives, financial situation or needs. It should not be relied upon as a substitute for financial or other specialist advice.
Before making any decisions on the basis of this communication, you should consider the appropriateness of its content having regard to your particular investment objectives, financial situation or individual needs. You should obtain a Product Disclosure Statement or other disclosure document relating to any financial product issued by MLC Investments Limited (ABN 30 002 641 661 [include AFSL for PDSs/FSGs/Annual Reports]) and consider it before making any decision about whether to acquire or continue to hold the product. A copy of the Product Disclosure Statement or other disclosure document is available upon request by phoning the MLC call centre on 132 652 or on our website at mlc.com.au.

3Slide title 3
Table of contents
Topic Slides
1. Key themes 4
2. What has MLC been doing? 14
3. MLC Horizon 4 Performance, including: - Asset Allocation Performance Contribution
- Manager Performance Attribution
- Debt Strategy
- Peer relative performance
15
4. MLC’s outlook and prospective Returns 30
5. Key messages 34
6. MLC Fund performance tables 35

4Slide title 4
1. Key economic themes
Global economy in summary
The Good• Industrial Production has surged in Japan, both May and June, which should see the economy recover
strongly in the second half of 2011.• The soft patch in global economic growth, affected by the Japan experience, will likely gradually improve
alongside improvement in global trade activity as Japan manufacturing switches back on
The Bad• US economic data has decelerated in line with global activity• China continues to slow from its previous breakneck speed and is likely to see GDP growth slipping
and The Ugly• Increasing concerns about risk of default in Europe, particularly focussed on the debt woes of the Greek
government • The imminent end of the US Federal Reserve’s second period of bond buy backs, known colloquially as
QE2.

5Slide title 5
The two speed world economy
Source: Datastream
Real GDP - annual growth (%)
-15
-10
-5
0
5
10
15
20
Q2 2006 Q2 2007 Q2 2008 Q2 2009 Q2 2010 Q2 2011
US
Europe
Japan
UK
China
India

6Slide title 6
Most developed nations are some distance away from their pre-GFC peak output
Source: Datastream
Latest GDP level vs pre GFC peak (%)
-15
-13-11
-9
-7
-5
-3
-1
13
5
Au
stra
lia
Ca
na
da
NZ
US
Be
lgiu
m
Au
stria
Ge
rma
ny
Fra
nce
Po
rtu
ga
l
Ne
the
rlan
ds
EA
16
Jap
an
Sp
ain
Fin
lan
d
UK
Ita
ly
Gre
ece
Ire
lan
d

7Slide title 7
US consumer spending supported by jobs, income growth
Private sector wage and salary incomes are rising
-2.5
-2.0
-1.5
-1.0
-0.5
0.0
0.5
1.0
1.5
Jun-07 Jun-08 Jun-09 Jun-10
m/m% (with 3mth moving average)
The US private sector IS hiring
-1000
-800
-600
-400
-200
0
200
400
600
Jan-99 Jan-02 Jan-05 Jan-08 Jan-11
32
33
33
34
34
35
35
Private payrolls - monthly change
(lhs)
Average weekly hours - private
non-farm (rhs)
'000 Hours
Source: Datastream

8Slide title 8Source: Datastream
China is “tapping the brakes” to slow things

9Slide title 9
Australian economy in summary
The Good• Indications of investment activity remain extremely buoyant
• A raft of new infrastructure projects linked to mining are likely to boost investment activity over the next year, seeing GDP accelerate
The Bad• Activity has moderated with an ebbing of confidence in the outlook of the economy
• A combination of the strong Australian dollar and relatively high interest rates is having a depressing effect on many parts of the economy, not directly affected by the mining boom.
and The Ugly• Increasing signs of a downturn in housing prices across the country, while, at the same time, new housing activity
remains lacklustre
• Consumer spending growth has been anaemic
• Business confidence in key sectors such as manufacturing, tourism and retailing has been deteriorating
1. Key economic themes

10Slide title 10
Australian dollar above long term fair value
Source: Datastream

11Slide title 11
The rise and rise of mining investment
Source: ABS, MLC Investment Management
0
10
20
30
40
50
60
70
1987
/88
1988
/89
1989
/90
1990
/91
1991
/92
1992
/93
1993
/94
1994
/95
1995
/96
1996
/97
1997
/98
1998
/99
1999
/00
2000
/01
2001
/02
2002
/03
2003
/04
2004
/05
2005
/06
2006
/07
2007
/08
2008
/09
2009
/10F
2010
/11F
2011
/12F
Capital expenditure in mining as a % of total
Projections for for 2010/11 and 2011/12 are based on latest capex survey estimates.

12Slide title 12
Asset class returns
Asset class performance
-15.0%
-5.0%
5.0%
15.0%
25.0%
35.0%
45.0%
AustralianShares
GlobalShares
(hedged)
GlobalShares
(unhedged)
EmergingMarkets
AustralianProperty
Securities
GlobalProperty
Securities
AustralianBonds
GlobalBonds
(hedged)
Global HighYield Bonds
(hedged)
Inflation-LinkedBonds
Cash
Quarter to Jun-11 % p.a. 1 Year to Jun-11 % p.a. 3 Year to Jun-11 % p.a. 5 Year to Jun-11 % p.a.
Index data source: Australian Shares - S&P/ASX 300 Accumulation Index; Global Shares (hedged) - MSCI All Countries (A$ hedged); Global Shares (unhedged) - MSCI All Countries; Australian Property Securities - S&P/ASX 300 LPT Accumulation Index; Global Property Securities - UBS Global REIT (hedged); Australian Bonds - UBS Composite Bond (all mats); Global Bonds (hedged) - BCGA Global Agg (hedged); Global High Yield Bonds (hedged) - BCGA US Corp HY BB/B (hedged), Australian Inflation Linked Bonds - UBS Inflation Linked Bonds (all mats); Cash - UBS Australian Bank Bill;
13Slide title 13
1. Key investment themes
• More short term market volatility predicted by most of MLC’s managers with modest prospective returns
• Dividend recovery continues however, external macro risks and domestic risks (2 speed economy) have constrained market returns
• Globally, Financials struggled over the quarter due to increased risk aversion whilst traditionally defensive sectors, such as Healthcare and Consumer Staples surged
• Over the year however, most sectors, both domestically and globally, posted strong positive returns, with the exception being the Australian Information Technology sector
• AUD tailwind to hedged returns, headwind for unhedged following its 27.5% rise against the USD over the year

14Slide title 14
2. What has MLC been doing?
Change in manager ownership:• On 21 June 2011 Franklin Templeton Investments Australia Ltd (“Franklin
Templeton”) announced the purchase of Balanced Equity Management Pty Ltd (Australian Equity Manager). Interestingly, Franklin Templeton is also one of MLC’s managers
• As with any personnel or ownership changes in any of the managers engaged by MLC, the MLC Investment Management research team will continue to monitor and assess the implications of the change in ownership, as part of the ongoing research of all incumbent managers
Strategic Overlay:• While the past quarter had several significant events, none drastically altered the
key investment themes we focus on. As such we have not made any change to our existing strategic overlay positions

15Slide title 15
3. MLC Horizon 4 Balanced Portfolio
Source: MLC Investment Management
Highlights:• It was a mixed bag over the quarter with some asset classes making positive contributions and others not. However, over
the year all asset classes were positive.
• Standout performers for the quarter came from the Global REITS sector (+3.8%). Australian Inflation linked Securities also performed well as yields fell in Australia and globally.
• Australian Shares were the main detractor over the quarter as the asset class was buffeted by short term volatility, to some extent driven by global factors. Over the year all managers in this asset class made solid contributions.
• The debt strategy continued its recent strong performance with all but 1 manager making positive contributions over the quarter. Over the year Franklin Templeton (All Maturities) and W.R. Huff (Extended Credit) were standouts with performance close to 20%.
3 Months 1 Year 3 Years 5 Years 10 Years
% % % p.a. % p.a. % p.a.
MLC Wholesale/Masterkey Investment Service Fundamentals -1.5 9.3 1.4 1.8 4.5(takes into account fees)
Performance overview to 30 June 2011

16Slide title 16
3. MLC Horizon 4 Balanced Portfolio
Source: MLC Investment Management
5 year returns have always been positive
Historical Absolute PerformanceMLC Wholesale Horizon 4 Balanced Portfolio
(after taking into account fees)
-20%
-15%
-10%
-5%
0%
5%
10%
15%
20%
1999 2000 2001 2002 2003 2004 2005 2006 2007 2008 2009 2010 2011
Ret
urn
% p
.a.
1 Year Ended 30 June 5 Years Ended 30 June

17Slide title 17
3. MLC Horizon 4 strategy - asset class contribution
Source: MLC Investment Management
Contribution to Total Return by Asset ClassMLC Wholesale Horizon 4 Balanced Portfolio
(before taking into account fees)
-2
-1
0
1
2
3
4
Australian Shares Global Shares -Hedged
Global Shares -Unhedged
Global PropertySecurities
LTAR Debt Securities
Ret
urn
Co
ntr
ibu
tio
n %
(an
nu
alis
ed f
or
per
iod
s g
reat
er t
han
1 y
ear)
3 months to Jun-2011 1 year to Jun-2011 3 years to Jun-2011 5 years to Jun-2011
18Slide title 18
3. Performance attribution
• MLC’s underweight position to Government securities has benefited the portfolio over the last year with the broad Barclays Index out-performing the Treasuries Index.
• Our increased weighting to Unhedged Global Shares has detracted over the last year as the AUD has continued to appreciate.
• In Australian Equities, JCP Investment Partners stock selection expertise has seen them add significant value above the index, with overweights in midcap miners, NAB and Intoll adding the most value.
• Globally, Tweedy Browne has shown consistent outperformance over the quarter and year, with the Consumer Staples and Industrial Holding sectors delivering up some first-rate opportunities.

19Slide title 19
3. Australian shares strategy – manager contribution
Source: MLC Investment Management
Manager performance in excess of the indexAustralian Share Diversified Strategy
(before taking into account fees and tax)
-6%
-4%
-2%
0%
2%
4%
Map
le-B
row
nA
bbot
t
Dim
ensi
onal
Con
cord
JCP
-C
once
ntra
ted
JCP
- A
ctiv
e C
ore
Wal
lara
Bal
ance
d E
quity
-C
once
ntra
ted
Bal
ance
d E
quity
-A
ctiv
e C
ore
Nor
thca
pe
Nor
thw
ard
Cap
ital
Aus
tral
ian
Sha
reD
iver
sifie
dS
trat
egy
Exc
ess
Re
turn
vs
S&
P/A
SX
30
0 A
ccum
ula
tion
In
dex
(ann
ua
lised
fo
r pe
rio
ds
gre
ate
r th
an
1 y
ear
)
Quarter to Jun-11 1 Year to Jun-11
3 years to Jun-11 5 Years to Jun-11

20Slide title 20
3. Manager performance*
Source: MLC Investment Management*The performance on this page represents our Australian Shares div strategy pre fees.
Australian shares Absolute Benchmark Comments
1 year (%) 1 year (%) Benchmark: S&P/ASX 300 Accumulation Index
Dimensional 13.5% 11.9% Dimensional’s bias to smaller companies who tended to outperform larger companies benefited their one year return versus market. Major performance contributors over the year were Iluka Resources, Incitec Pivot, Alumina, Seven Group & zero Telstra exposure.
Maple-Brown Abbott 6.9% 11.9% Limited exposure to small-medium sized resources companies, considered to be very over-valued, was the main contributor to MBA’s one year underperformance of the market. Their preference for cheap “cyclical” companies (such as Fairfax Media, Billabong, Toll Holdings) also detracted, offsetting good returns from owning Brambles, Rio Tinto and Fosters Group.
Balanced Equity Management
10.9% 11.9% Strategies which contributed to Balanced’s one year underperformance included owning Westpac, ANZ, Qantas, Boral and Telstra. All are trading at prices below their assessed values.
Concord 6.0% 11.9% Concord’s bottom-up approach to stock selection created the largest underperformance amongst MLC’s appointed managers. Stocks such as Billabong, James Hardie and JB Hi-Fi were some of the largest underperformers versus market return for the year.

21Slide title 21
3. Manager performance cont…*
Source: MLC Investment Management*The performance on this page represents our Australian Shares div strategy pre fees.
Australian shares Absolute Benchmark Comments
1 year (%)
1 year (%) Benchmark: S&P/ASX 300 Accumulation Index
JCP Investment Partners
14.2% 11.9% JCP’s consistent outperformance through the year reflects successful stock selection strategies, including investments in Intoll, National Australia Bank, Invocare, Whitehaven Coal, Independence Group and underweighting Telstra. JCP retain a cautious view on the market’s outlook and direction, describing 2012 as likely to be “very challenging”.
Wallara 13.1% 11.9% Wallara’s one year outperformance was due to investments in QR National, Challenger, Mineral Resources and Worley Parsons. Underweight Telstra for the year was also beneficial. Wallara are more cautious towards the market. They expect the market to remain volatile and any market appreciation will be “modest”.
Northcape 12.3% 11.9% Stock selection strategies such as Brambles, Sonic Healthcare, Rio Tinto, BHP Billiton and Orica contributed to their modest outperformance of the market return over the year. They anticipate industrial earnings will be under pressure so have added companies such as Woolworths with “defensive” qualities to the portfolio.
Northward 11.2% 11.9% Stock selection that caused the modest underperformance for the year were Energy Resources of Australia, Resmed, National Australia Bank, Computershare and not owning Iluka Resources. Northward continues to favour companies exposed to growth themes in Australia (mining), recovery in the US (Brambles) and China’s growth.

22Slide title 22
3. Global shares strategy – manager contribution
Source: MLC Investment Management
Manager Performance in Excess of the IndexGlobal Share Strategy
(before taking into account fees and tax)
-6%
-4%
-2%
0%
2%
4%
6%
8%
10%
CapitalInternational
Carnegie Walter Scott HardingLoevner
Sands Capital Mondrian Tweedy,Browne
Dimensional Global ShareStrategy
(unhedged)
Exc
ess
Ret
urn
vs
MS
CI A
ll C
ou
ntr
y W
orl
d In
dex
(an
nu
alis
ed f
or
per
iod
s g
reat
er t
han
1 y
ear)
Quarter to Jun-11 1 Year to Jun-11 3 years to Jun-11 5 Years to Jun-11
23Slide title 23
3. Manager performance*
*The performance on this page represents our Global Shares strategy pre fees.
Source: MLC Investment Management
Global shares Absolute Benchmark Comments
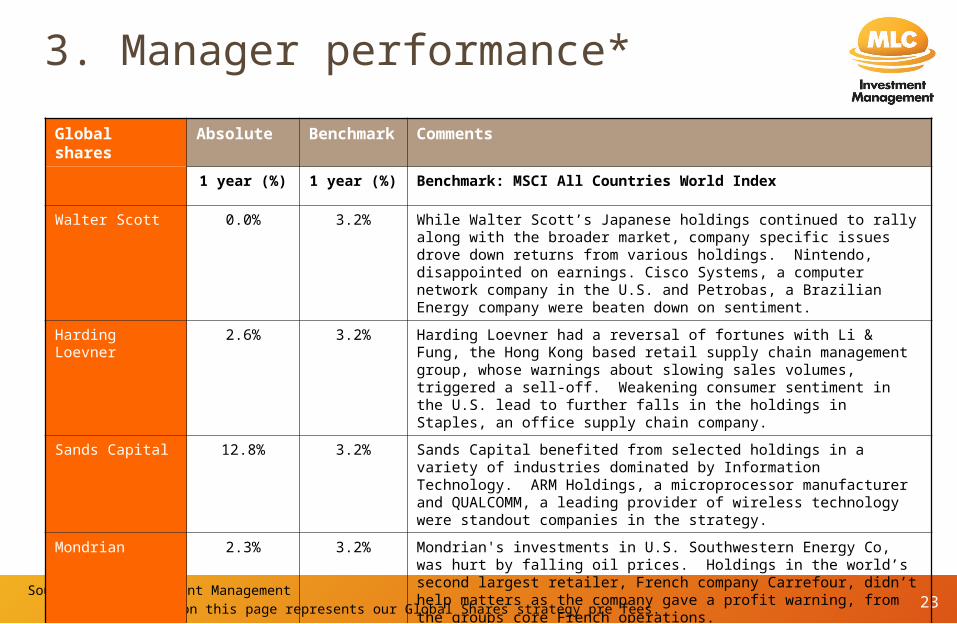
1 year (%) 1 year (%) Benchmark: MSCI All Countries World Index
Walter Scott 0.0% 3.2% While Walter Scott’s Japanese holdings continued to rally along with the broader market, company specific issues drove down returns from various holdings. Nintendo, disappointed on earnings. Cisco Systems, a computer network company in the U.S. and Petrobas, a Brazilian Energy company were beaten down on sentiment.
Harding Loevner 2.6% 3.2% Harding Loevner had a reversal of fortunes with Li & Fung, the Hong Kong based retail supply chain management group, whose warnings about slowing sales volumes, triggered a sell-off. Weakening consumer sentiment in the U.S. lead to further falls in the holdings in Staples, an office supply chain company.
Sands Capital 12.8% 3.2% Sands Capital benefited from selected holdings in a variety of industries dominated by Information Technology. ARM Holdings, a microprocessor manufacturer and QUALCOMM, a leading provider of wireless technology were standout companies in the strategy.
Mondrian 2.3% 3.2% Mondrian's investments in U.S. Southwestern Energy Co, was hurt by falling oil prices. Holdings in the world’s second largest retailer, French company Carrefour, didn’t help matters as the company gave a profit warning, from the groups core French operations.

24Slide title 24
3. Manager performance cont…*
*The performance on this page represents our Global Shares strategy pre fees. Source: MLC Investment Management
Global shares Absolute Benchmark Comments
1 year (%) 1 year (%) Benchmark: MSCI All Countries World Index
Tweedy, Browne 6.0% 3.2% Tweedy, Browne's returns were driven in large part by strong returns from Consumer Staples companies and Industrial holdings, more specifically their Beverage, Tobacco, Machinery and Rail companies. From a regional perspective, U.S. holdings once again outperformed their European and Asian counterparts. MasterCard, a global credit card provider and ConocoPhillips, an energy company were amongst the largest contributors.
Dimensional 2.2% 3.2% Dimensional struggled during a year when smaller companies were out of favour as investors sought the comfort of larger companies with strong cash flows and high dividend payouts. The returns were notably poor in the volatile June quarter.
Capital International
-0.2% 3.2% Capital International detracted over the year due to earnings downgrades at Nintendo, a Japanese electronic games manufacturer, disappointing results from Target, a U.S. based retailer and share price volatility at Hypermarcas, a diversified Brazilian conglomerate on speculation about acquisition activity in the Health Care sector.
Carnegie -2.4% 3.2% Carnegie’s performance was driven by weak company selection over the first three quarters of the performance year. Selections within Information Technology, namely Google and Hewlett-Packard hurt during the year and final quarter.

25Slide title 25
3. Global property strategy – manager contribution
Source: MLC Investment Management
Manager Performance in Excess of the IndexGlobal Property Strategy
(before taking into account fees and tax)
-5%
-3%
-1%
1%
3%
5%
7%
LaSalle InvestmentManagement
Morgan Stanley Resolution Capital Global Property SecuritiesStrategy (Hedged)
Exc
ess
Ret
urn
vs
UB
S R
eal
Est
ate
Inve
sto
rs T
rust
In
dex
(an
nu
alis
ed f
or
per
iod
s g
reat
er t
han
1 y
ear)
Quarter to Jun-11 1 Year to Jun-11 3 years to Jun-11 5 Years to Jun-11

26Slide title 26
3. Manager performance*
Source: MLC Investment Management*The performance on this page represents our Global Property Securities strategy pre fees and tax. ** The global property managers are benchmarked against the unhedged index.
Global property securities
Absolute Benchmark Comments
1 year (%) 1 year (%) Benchmark:
UBS Global Investors Index**
LaSalle 9.0% 9.8% LaSalle’s close to market benchmark return for the year reflected successful regional allocation decisions, including an overweight position in Hong Kong during 2010 and underweight position in Japan in 2011. However, stock selection in Singapore, Japan, Hong Kong, United Kingdom and Canada tended to detract from returns. LaSalle remains optimistic on the outlook for global real estate and prospective returns.
Morgan Stanley
7.6% 9.8% Portfolio strategy remains focused on Hong Kong, regarded by Morgan Stanley as having the best commercial property market fundamentals in the world, with a number of listed stocks providing exposure to key office markets, retail and residential assets. Exposure to a number of Japanese real estate operating companies focused on prime office properties in central Tokyo remains another portfolio strategy. European portfolio exposure remains focused on prime London office and retail assets while in the US, attractive relative valuations have led to ownership of a number of apartment, CBD office and retail property owners.
Resolution Capital
11.5% 9.8% Resolution’s outperformance in the year was due to successful bottom-up stock selection, including Land Securities (UK), SL Green (US), Unibail-Rodamco (Europe), Derwent London (UK), Hufvudstaden (Sweden) and Hong Kong Land (Singapore). These and other successful strategies reflect Resolution’s preference for property related REITs and real estate operating companies who represent quality (i.e. quality property portfolios, management skill, financially sound).

27Slide title 27
3. Debt strategy
Source: MLC Investment Management
Contribution to Total Return by Asset ClassMLC Wholesale Horizon 4 Portfolio Diversified Debt Strategy
(before taking into account fees)
-0.5%
0.0%
0.5%
1.0%
1.5%
2.0%
2.5%
3.0%
AustralianBonds
AustralianInflation-Linked
Bonds
GlobalGovernment
Bonds
Global Non-Government
Bonds
GlobalAbsolute
Return Bonds
Global Multi-Sector Bonds
Global HighYield Bonds
Global BankLoans
GlobalMortgages
Ret
urn
Co
ntr
ibu
tio
n %
(an
nu
alis
ed f
or
per
iod
s g
reat
er t
han
1 y
ear)
Quarter to Jun-11 1 Year to Jun-11 3 years to Jun-11 5 Years to Jun-11

28Slide title 28
3. Debt strategy
• Yields rose in Australia and major overseas bond markets over the year
• Our managers are generally positioned for rising interest rates, due to signs of economic improvement, and therefore most have outperformed their market benchmarks over the year
• Strongest performing sectors were global non-government bonds and less traditional bonds such as non-investment grade, Australian and global inflation-linked, emerging markets and global multi-sector bonds
• In the last quarter, yields fell in Australia and globally due to increased risk aversion and softening of global economic activity
• Australian yield curve relatively flat although positive sloping for longer terms. Shorter end of the curve is slightly negative sloping with 2 year government bond yield 4.74%, below the cash rate 4.75%

29Slide title 29
MLC Wholesale Horizon 4 Balanced PortfolioComparison with the Mercer Wholesale-Balanced Growth Universe
Performance before tax and after fees for periods ended June 2011Rates of Return(%)
12
8
4
0
-4
3 Months (% ) 1 Year (% ) 3 Years (% pa) 5 Years (% pa) 7 Years (% pa)
MLC0260AU -1.5 (24) 9.3 (19) 1.4 (22) 1.8 (11) 5.3 (13)
95th Percentile -0.4 11.7 3.0 2.8 6.5Upper Quartile -1.1 10.4 2.3 2.0 5.7
Median -1.4 9.1 1.6 1.3 5.2Lower Quartile -1.7 7.8 1.0 0.9 4.65th Percentile -2.9 5.3 0.0 0.3 4.3
Number of Funds 42 41 39 37 29
Data Source: Morningstar and Lipper, A Thomson Reuters Company
4. Peer relative performance
Q3
Q2
Q3 Q2
Q2

30Slide title 30
4. Outlook – Insight from our managers
• As we move ahead towards the August reporting season it is likely that earnings risk will be a key issue, caused by the strong Australian dollar, weak consumer demand and the impact from numerous natural disasters that will all contribute to lower earnings for many Australian listed companies.
• - JCP Investment Partners
• Improving real estate fundamentals should help drive healthy earnings growth over the next few years. We expect worldwide earnings per share growth to be in the mid to high single-digits per annum through 2013, with the strongest growth in the US, UK and Hong Kong. - LaSalle Investment Management
• Global -Over the year, the standout factor which came to the fore was the appreciation of the Australian dollar ($A). According to our in-house purchasing power parity calculations, the $A is now over 40% over-valued against the USD. This presents a potential gain for Australian investors with international holdings, assuming a return to fair value. The timing of such is uncertain, but historically currencies have not stayed as dear for sustained periods. - Mondrian Investment Partners

31Slide title 31
4. Scenario probability weighted real returns
Source: MLC Investment Management
Scenario Probability Weighted Real Returns (June 2011)
-10%
-5%
0%
5%
10%
15%
20%
25%
DomesticEquity
Global equityUnhedged
Global equityHedged
EmergingMarketsWorld
Unhedged
Domesticcash
Short durationDiversified
Debt
All maturitiesDiversified
Debt
Domesticnominal
government
Domesticnominal
corporate
Globalnominal
government
Globalnominal
corporate
Domesticinflation linked
Global highyield debt(extended
credit)
Ret
urn
% p
.a.
-10%
-5%
0%
5%
10%
15%
20%
25%Average of best 10% tail
Average of worst 10% tail
Probability weighted expected returns
Long-term 'normal' return
(7 years, 0% tax with franking credits, pre fees, pre alpha)
32Slide title 32
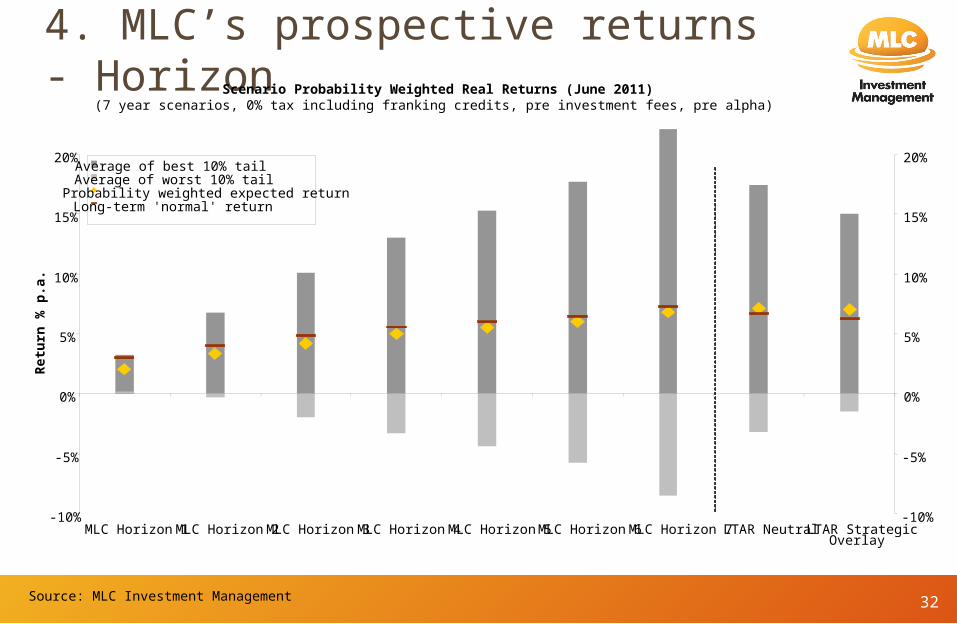
4. MLC’s prospective returns - Horizon
Source: MLC Investment Management
Scenario Probability Weighted Real Returns (June 2011)
-10%
-5%
0%
5%
10%
15%
20%
MLC Horizon 1 MLC Horizon 2 MLC Horizon 3 MLC Horizon 4 MLC Horizon 5MLC Horizon 6 MLC Horizon 7 LTAR Neutral LTAR StrategicOverlay
Ret
urn
% p
.a.
-10%
-5%
0%
5%
10%
15%
20%Average of best 10% tailAverage of worst 10% tailProbability weighted expected returnLong-term 'normal' return
(7 year scenarios, 0% tax including franking credits, pre investment fees, pre alpha)

33Slide title 33
4. MLC’s prospective returns and outlook
• Credible sustainable future scenarios all seem to involve (at best) modest GDP growth. While that constrains earnings potential, persistent low cash rates support global shares.
• Deflation will likely remain a stronger force than inflation for a prolonged period. Despite this global sovereign bond markets are expensively priced.
• We have increased the focus on more muted and adverse growth paths. This is in response to a shift in focus of major advanced countries to tighter fiscal policy.
• The possibility of a second round credit crunch or of an escalation of sovereign risks remains

34Slide title 34
5. Key messages – MLC Horizons
• Diversified across 14 asset classes and sub asset classes including overseas investment exposure
• Include Alternative and Absolute Return investments such as Insurance Related Investments and multi sector strategies
• Actively managed using some of the best available managers from around the world
• Are robustly tested using sophisticated scenario analysis
• Have a good long term track record
• Backed by MLC Investment Management, a highly respected money manager.

35Slide title 35
6. MLC Diversified fund performance table
Source: MLC Investment Management
1 Year
3 Years
5 Years
7 Years
10 years
% % p.a. % p.a. % p.a. % p.a.
MLC Horizon 1 Bond Portfolio 5.0 5.2 5.1 - -
MLC Horizon 2 Income Portfolio 6.6 4.0 3.3 - -
MLC Horizon 3 Conservative Growth Portfolio 8.3 2.7 2.9 5.4 -
MLC Horizon 4 Balanced Portfolio 9.3 1.4 1.8 5.3 4.5
MLC Horizon 5 Growth Portfolio 9.7 0.0 0.7 4.8 3.7
MLC Horizon 6 Share Portfolio 10.5 -1.2 0.0 4.7 -
MLC Horizon 7 Accelerated Growth Portfolio 12.2 -3.9 -2.5 3.6 -
LTAR 12.3 1.5 2.7 - -
Performance to 30 June 2011

36Slide title 36
6. MLC asset class fund performance table
Source: MLC Investment Management
1 Year 3 Years 5 Years 7 Years 10 years
% % p.a. % p.a. % p.a. % p.a.
MLC Australian Share Fund 9.2 0.8 1.8 7.6 6.4
S&P/ASX 300 Accumulation Index(S&P/ASX200 Index prior to Nov 2002)
11.9 0.3 2.4 8.4 7.2
MLC Global Share Fund 1.6 -4.4 -5.3 -1.1 -3.4
MSCI All Country World Index (MSCI World Index prior to July 2002)
3.2 -2.2 -3.6 0.5 -2.4
MLC Hedged Global Share Fund 21.1 -2.7 - - -
MSCI All Country World Index Hedged (MSCI World Index Hedged prior to July 2002)
26.4 2.1 - - -
Performance to 30 June 2011

37Slide title 37
6. MLC asset class fund performance table
Source: MLC Investment Management
1 Year 3 Years 5 Years
% % p.a. % p.a.
MLC Global Property Fund 30.0 2.7 -
UBS Global Investors Index (hedged) 33.8 2.6 -
MLC Diversified Debt Fund 6.6 6.0 -
50% UBS Composite Bond Index & 50% Barclays Capital Global Aggregate Bond Index (hedged) 6.2 8.8 -
Performance to 30 June 2011