mid-year expenditure report 2018
TRANSCRIPT
MID-YEAR EXPENDITURE REPORT 2018
July 2018
Prepared by the Department of Public Expenditure & Reform
www.per.gov.ie


i
MID-YEAR EXPENDITURE REPORT 2018
July 2018
ii
Foreword
The Government’s budgetary strategy was set out in the Summer Economic Statement 2018
(SES) and is based on steady increases in public expenditure, underpinned by stable and predictable tax revenues. This approach is targeted at delivering steady and sustainable
improvements in public services and infrastructure and increases in living standards for all. A key consideration in allocating funding for the delivery of public services is that the level of
funding is affordable both now and in the future.
Starting in 2015, we have been in a position to increase expenditure on an annual basis. In this period the focus has been on ensuring ongoing, sustainable improvements in public
services and infrastructure by providing prudent levels of increases in expenditure each year.
A key component of this strategy has been to target the provision of additional public sector staff to key frontline areas, such as Health, Education and Policing. Indeed, comparing staffing
numbers from the start of 2015 to end of quarter one 2018, Health staff numbers have increased by over 12,000, across the primary and secondary education systems numbers are
up by over 9,000 and Garda numbers have increased by over 1,000.
Given the key role of public servants in delivering public services, it is important to ensure that the number of public servants employed by the state is both affordable and appropriate
to ensure effective service delivery. This requires an approach that is compatible with economic conditions, national competitiveness and available revenues over the medium-
term. This can be delivered by embedding a workforce planning methodology across the public service that is underpinned by: a clear consideration of the available fiscal resources;
and a drive to increase productivity by harnessing ICT, ensuring appropriate skills, and delivering ongoing reform.
As outlined in the SES, there is already €2.6 billion pre-committed to expenditure increases in 2019. Almost €1.5 billion of this amount has been allocated towards increased capital investment, an increase of almost 25 per cent. This reflects the key role that capital spending can play in mitigating risk, enhancing the resilience of the economy and raising our growth
capacity. Furthermore, an allocation has also been provided to cover the cost of demographic changes on the delivery of day-to-day public services. This investment will ensure that public service provision is not adversely affected by changing dynamics of the Irish population.
Instead, going forward, the Government is focused on incrementally improving the scope and availability of public services in a sustainable manner. Undoubtedly, the delivery of this goal will require the continuation of prudent management of the public finances. However, further to this, we must also continue to engage with all stakeholders in our society to ensure that
the programmes that are prioritised result in the best outcomes for citizens. To this end, in addition to pursuing sustainable expenditure policy, over the last number of years the Government has implemented a number of reforms aimed at increasing
transparency and accountability in the Budget process, facilitating meaningful dialogue around our policies and priorities. This includes our Performance and Equality Budgeting Programmes, the publication of additional reports such as this one and the SES, and the roll -
iii
out of the Spending Review. All of these initiatives are intended to foster a more collaborative response to decision making between Government, the Oireachtas and society. To continue this process of improved transparency in the allocation of Exchequer funds, the Government
is committed to putting in place improved Governance structures to ensure that we have greater accountability regarding how taxpayer’s money is spent.
All of these elements together form the process by which we seek to ensure that each
Government programme is delivering on its objectives and achieving the best possible outcomes for the money spent. With €56 billion allocated to the delivery of day-to-day public
services in 2018, it is crucial that there is as much focus on the value for money of the existing level of expenditure as on any additional amount to be made available on Budget day. The
rolling nature of the current Spending Review will provide this focus and will further embed an evaluation culture across the Public Service. This Report is accompanied by a range of
Spending Review papers which assess how we can strengthen the way existing policy delivers for the public.
Paschal Donohoe T.D. Minister for Finance and Public Expenditure and Reform

Contents
Foreword__________________________________________________________________ii
Chapter 1: 2018 Expenditure Update and Pre-Budget Expenditure Position ____________ 1
1.1 Overview of Budgetary Strategy for Expenditure ________________________________ 1
1.2 Pre-Budget Departmental Expenditure Ceilings 2018 to 2020 ______________________ 3
1.3 Expenditure in 2018 ______________________________________________________ 8
1.4 Expenditure Summary ____________________________________________________ 13
Chapter 2: Public Expenditure Trends __________________________________________ 15
2.1 Context for Public Expenditure _____________________________________________ 15
2.2 International Comparisons ________________________________________________ 19
2.3 Trends in Social Protection Expenditure ______________________________________ 20
2.4 Trends in Health Expenditure ______________________________________________ 23
2.5 Trends in Education Expenditure____________________________________________ 28
2.6 Future Expenditure Policy _________________________________________________ 32
Chapter 3: Spending Review 2018 _____________________________________________ 36
3.1 Introduction____________________________________________________________ 36
3.2 Objectives of the Spending Review __________________________________________ 37
3.3 Conduct of the Spending Review____________________________________________ 38
3.4 Outcomes of the Spending Review 2017______________________________________ 41
3.5 Key Findings of the Spending Review 2018 ____________________________________ 42
3.6 Conclusion _____________________________________________________________ 46

Mid-Year Expenditure Report | July 2018 Page | 1
Chapter 1 2018 Expenditure Update and Pre-Budget Expenditure Position
The Government’s Summer Economic Statement (SES), published on 19th June sets out the fiscal parameters for Budget 2019 with a headline deficit of 0.1 per cent of GDP being projected for 2019. As outlined in the SES, the Government will not adopt taxation and spending measures that result in a larger deficit than this. In this context, based on the fiscal projections in the SES, a budgetary package of €3.4 billion can be accommodated for 2019, of which €2.6 billion has been pre-committed to expenditure increases leaving €0.8 billion for further allocation to tax and expenditure measures. Any unfunded tax or expenditure measures that go beyond this level would necessarily involve even more borrowing and would result in a subsequent increase in the deficit position.
In line with the Stability Programme Update, published in April, the SES projects a headline
deficit of 0.2 per cent of GDP for 2018. The projections in the SES assume that revenue and expenditure for 2018 are in line with the overall budgetary parameters for this year. In this
context, the Mid-Year Expenditure Report reviews the expenditure position at the end of June and considers the potential impact on the full year position.
1.1 Overview of Budgetary Strategy for Expenditure
The key principles underpinning the budgetary strategy as set out in the SES are:
steady and sustainable increases in living standards; rebuilding fiscal capacity;
need for prioritisation and realism; need to avoid pro-cyclicality; and
fiscal sustainability.
As outlined in Chapter 2 of this Report, the period 2014 – 2018 has seen moderate, sustainable expenditure increases that have allowed for targeted investment in key public services and infrastructure. A key consideration for Budget 2019 is that the level of resources allocated to the delivery of public services continues to be affordable and sustainable, both
in the short-term but also, crucially, in the future. As set out in the SES, a headline deficit of 0.1 per cent of GDP is projected for next year. Based on current estimates, this headline deficit delivers a structural deficit of 0.4 per cent of GDP
next year, representing a marginal ‘overachievement’ of the MTO. Within this deficit a budgetary package of €3.4 billion can be accommodated. With €2.6 billion in pre-committed expenditure increases, this leaves €0.8 billion for further allocation to taxation and expenditure measures in Budget 2019.

Mid-Year Expenditure Report | July 2018 Page | 2
Pre-committed expenditure for next year amounts to €2.6 billion – that is to provide for:
an increase of almost €1.5 billion in capital expenditure as part of the National Development Plan (NDP);
€0.3 billion carryover costs associated with measures introduced this year;
€0.4 billion in public service pay increases already agreed; and
€0.4 billion for demographic costs. While the expenditure benchmark (EB) would allow an additional €0.9 billion to be allocated beyond this amount, this would result in a worsening of the headline deficit by an additional 0.3 per cent of GDP and involve additional borrowing in the absence of any offsetting revenue-raising measures or additional receipts. Spending Review The fiscal projections in the SES, include an amount of €64.5 billion for gross voted expenditure next year. The total resources available for Budget 2019 of €3.4 billion therefore represent just over 5 per cent of total expenditure. In this context, it is important to shift the emphasis away from the incremental nature of the annual Estimates process, with a focus instead on assessing the effectiveness of the totality of existing programmes.
As a small open economy, there are significant external risks facing Ireland in the period ahead
and it is of key importance that expenditure decisions are based on evidence. There is a requirement for Ireland to ensure the public finances are in a strong position to support
sustainable economic growth and to continue to improve the living conditions of citizens. The Spending Review is a tool that can assist us in allocating Government resources in the most
efficient and effective way to achieve these aims.
National Development Plan Investment in public infrastructure is essential to support sustainable and balanced growth across all sectors of the economy. It is also a key factor in increasing the long-run productive capacity of the economy. The NDP sets out a strategic vision for Ireland’s public capital infrastructure priorities over the next 10 years strictly aligned with the National Strategic Outcomes for Ireland’s new spatial strategy contained in the National Planning Framework (NPF). The plan signals a shift to a greater integration of regional investment plans, stronger coordination of sectoral strategies
and more rigorous selection and appraisal of projects to secure value-for-money.
The Government has committed to increasing public capital investment over the lifetime of the NDP. The Exchequer resources allocated for investment under the NDP are based on
projected nominal growth in national income (GNI*) averaging 4 per cent over the period 2022-2027 (2 per cent real and 2 per cent inflation). This is consistent with long term growth
forecasts for the Irish economy produced by international organisations.
While economic forecasts may fluctuate, it is envisaged that the ceilings in the NDP will remain relatively constant over the remainder of the plan, subject to the mid-term review of
the NDP which is currently due to take place in 2022. All Departments' capital programmes
Mid-Year Expenditure Report | July 2018 Page | 3
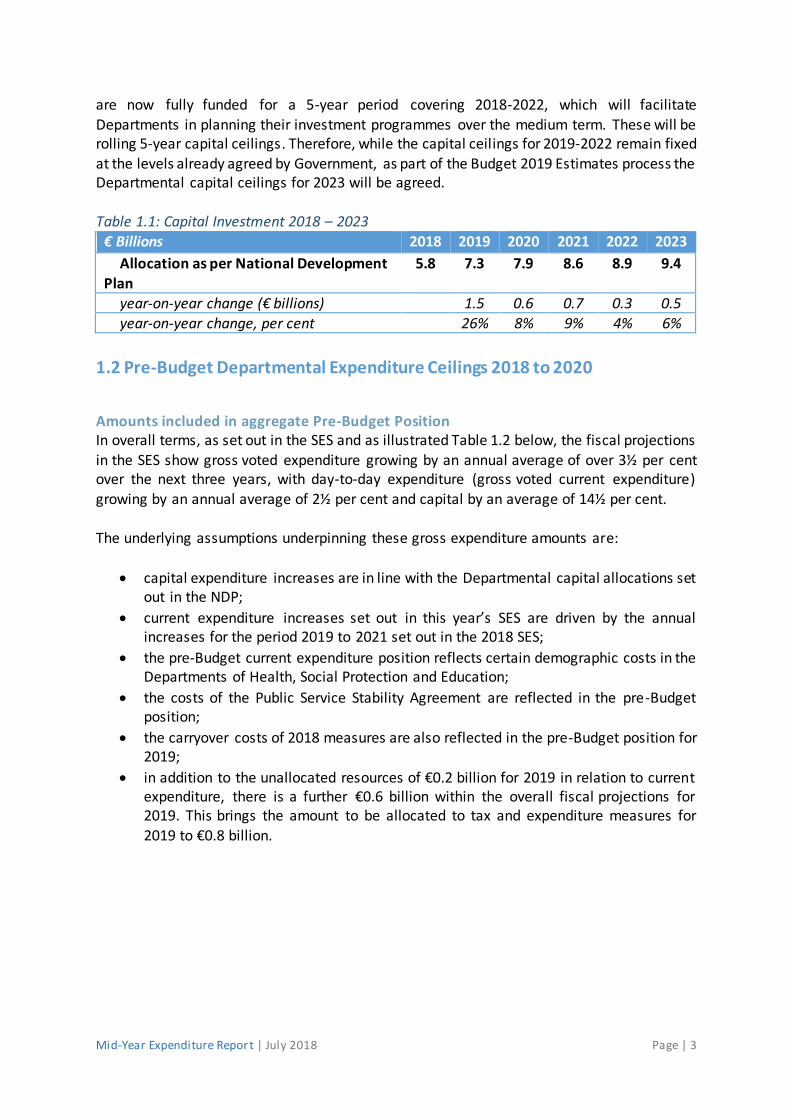
are now fully funded for a 5-year period covering 2018-2022, which will facilitate Departments in planning their investment programmes over the medium term. These will be rolling 5-year capital ceilings. Therefore, while the capital ceilings for 2019-2022 remain fixed
at the levels already agreed by Government, as part of the Budget 2019 Estimates process the Departmental capital ceilings for 2023 will be agreed.
Table 1.1: Capital Investment 2018 – 2023
€ Billions 2018 2019 2020 2021 2022 2023
Allocation as per National Development
Plan
5.8 7.3 7.9 8.6 8.9 9.4
year-on-year change (€ billions) 1.5 0.6 0.7 0.3 0.5
year-on-year change, per cent 26% 8% 9% 4% 6%
1.2 Pre-Budget Departmental Expenditure Ceilings 2018 to 2020
Amounts included in aggregate Pre-Budget Position In overall terms, as set out in the SES and as illustrated Table 1.2 below, the fiscal projections in the SES show gross voted expenditure growing by an annual average of over 3½ per cent over the next three years, with day-to-day expenditure (gross voted current expenditure)
growing by an annual average of 2½ per cent and capital by an average of 14½ per cent. The underlying assumptions underpinning these gross expenditure amounts are:
capital expenditure increases are in line with the Departmental capital allocations set out in the NDP;
current expenditure increases set out in this year’s SES are driven by the annual increases for the period 2019 to 2021 set out in the 2018 SES;
the pre-Budget current expenditure position reflects certain demographic costs in the Departments of Health, Social Protection and Education;
the costs of the Public Service Stability Agreement are reflected in the pre-Budget position;
the carryover costs of 2018 measures are also reflected in the pre-Budget position for 2019;
in addition to the unallocated resources of €0.2 billion for 2019 in relation to current expenditure, there is a further €0.6 billion within the overall fiscal projections for 2019. This brings the amount to be allocated to tax and expenditure measures for 2019 to €0.8 billion.

Mid-Year Expenditure Report | July 2018 Page | 4
Table 1.2: Pre-Budget Expenditure Increases 2018 - 2021 € Billions 2018 2019 2020 2021
Gross Voted Current Expenditure - Baseline1 55.9 55.9 57.3 58.7
Demographics net of Live Register Savings2 0.4 0.4 0.5
Carryover Impact of Budget 2018 Measures3 0.3
Cost of Public Service Stability Agreement 0.4 0.3 0.2
Gross Current Expenditure - Pre-Budget Position 57.1 58.1 59.4
Unallocated Resources4 0.2 0.6 0.8
Gross Current Expenditure Ceiling 55.9 57.3 58.7 60.2
year-on-year change (€) 1.4 1.4 1.5
year-on-year change (%) 2.5% 2.4% 2.6%
Gross Voted Capital Expenditure - Baseline1 5.8 5.8 7.3 7.9
Gross Voted Capital Increase under NDP 1.5 0.6 0.7
Gross Capital Expenditure Ceiling 5.8 7.3 7.9 8.6
year-on-year change (€) 1.5 0.6 0.7
year-on-year change (%) 25.9% 8.2% 8.9%
Total Gross Voted Expenditure 61.7 64.6 66.6 68.8
year-on-year change (€) 2.9 2.0 2.2
year-on-year change (%) 4.70% 3.10% 3.30% 1 The baseline for each year in the period 2019 - 2021 is the previous year's expenditure. 2 Live register savings are reassessed each year 3 Estimated carryover impact of Budget 2018 measures that must be met from available resources in the absence of reprioritisation 4 This figure relates only to expenditure measures. A further €600 million is contained within the overall fiscal projections bringing the total unallocated resources for Budget 2019 to €800 million.
The starting baseline in relation to the gross voted expenditure amounts is Revised Estimates Volume (REV) 2018, published in December 2017 and approved by the Dáil this year. The 2018
gross voted expenditure amounts reflect a significant technical adjustment relating to the funding of domestic water services. While the adjustment has no impact on overall general
government expenditure it has the following effect on expenditure in 2018 and on the 2018 year-on-year increase:
gross voted current expenditure in the Department of Housing, Planning and Local Government increases by €292 million with an increase of €500 million in gross voted
capital; while the headline year-on-year increase in expenditure is 5.5 per cent, the underlying
increase compared to 2017 on a like-for-like basis is 4.2 per cent.
Current Expenditure
Demographics The pre-Budget position reflects certain expenditure pressures in Health, Education and Social Protection arising from demographics. These estimates of demographic costs are informed

Mid-Year Expenditure Report | July 2018 Page | 5
by the Irish Government Economics and Evaluation Service paper ‘Budgetary Impact of Changing Demographics 2017 – 20271’.
For 2019, the total figure allocated in the Ministerial Vote Group ceilings for demographics across Health, Social Protection and Education is €413 million. This cost is net of
estimated reductions in Live Register related expenditure of €50 million. As is usual, the savings currently projected arising from expected improvements in the Live Register will
be re-estimated during the Budget Estimates process taking account of the employment situation and projections in relation to unemployment at that time. Furthermore, all other
demographic costs will be revisited during the Estimates process and adjusted accordingly at that point.
Carryover
Expenditure Report 2018 set out estimated carryover costs for certain current expenditure measures introduced in Budget 2018. As set out below, these estimated costs amounted to
€192 million. Table 1.3: Estimated Carryover Costs of Certain Budget 2018 Measures
€ Millions Additional Impact in 2019 Social Protection 110
Education 42
Justice 40
Total 192
It is estimated that there are additional carryover costs arising from certain other measures of approximately €150 million. This includes an amount in respect of Social Welfare Pensions arising from the Government decision in January that the cohort affected by the State Pension Contributory rate band changes made in 2012 would be allowed to avail of the new Total Contributions Approach, with the revised payments to be made from January 2019 and backdated to March this year. In addition, this amount reflects costs relating to the carryover impact of the planned increase of 1,800 fulltime equivalent staff (FTEs) in the Health sector as set out in REV 2018, and a provision to allow for certain carryover costs relating to the Housing Assistance Payment. This brings the total estimated carryover cost at this time to €340 million. However, as outlined later in this Chapter, expenditure developments this year in the Health sector have the potential to increase the level of resources required to fund carryover costs in 2019. Gross Current Expenditure Ceilings
Table 1.4 below sets out the pre-Budget Ministerial Gross Current Expenditure Ceilings for 2019. These ceilings are set out on a technical pre-Budget basis, with the budgetary decisions
for 2019 to be incorporated into Ministerial Expenditure Ceilings to be published on Budget day. The starting current expenditure baseline for all Departments, other than Health, Social
Protection and Education, where amounts are included in respect of demographics, is the allocation for this year set out in REV 2018.
1 Connors, Duffy and Newman, 2016. https://igees.gov.ie/budgetary-impact-of-changing-demographics-2016-
2026/

Mid-Year Expenditure Report | July 2018 Page | 6
For the purposes of this report, the carryover impact of Budget 2018 measures is included as a separate line. These costs will be reassessed during the Estimates process based on the implementation of the measures and any reprioritisation opportunities that may be
identified. On that basis, allocations will be made on a Departmental level.
Table 1.4: Pre-Budget Ministerial Gross Current Expenditure Ceilings 2019-2021 € Millions 2019 2020 2021
Agriculture, Food and the Marine Group 1,285 1,285 1,285
Business, Enterprise & Innovation Group 316 316 316
Children and Youth Affairs Group 1,355 1,355 1,355
Communications, Climate Action & Environment Group
372 372 372
Culture, Heritage & the Gaeltacht Group 249 249 249
Defence Group 869 869 869
Education & Skills Group 9,392 9,430 9,468
Employment Affairs & Social Protection Group 20,242 20,502 20,762
Finance Group 458 458 458
Foreign Affairs Group 725 725 725
Health Group 14,962 15,099 15,236
Housing, Planning & Local Government Group 1,673 1,673 1,673
Justice Group 2,433 2,433 2,433
Public Expenditure and Reform Group 989 989 989
Rural & Community Development 144 144 144
Taoiseach's Group 187 187 187
Transport, Tourism & Sport Group 703 703 703
Public Service Stability Agreement 370 340 230
Carryover of Budget 2018 Measures1 340 - -
Resources to be Allocated2 231 675 775
Total Gross Current Expenditure 57,295 58,745 60,185
*Figures subject to rounding
1 Estimated carryover impact of Budget 2018 measures that must be met from available resources in the absence of reprioritisation 2 This figure relates only to expenditure measures. A further €600 million is contained within the overall fiscal
projections bringing the total unallocated resources for Budget 2019 to €800 million.
Capital Expenditure As set out in the recently published SES, a long-term strategic approach to investment for the next ten years was adopted in the NDP. These funding allocations are closely aligned with the 10 National Strategic Outcomes of the NPF. The primary rationale for setting out 10 year Exchequer Gross Voted Capital Ceilings is to provide greater certainty to all those involved in the planning of infrastructure delivery.
Mid-Year Expenditure Report | July 2018 Page | 7
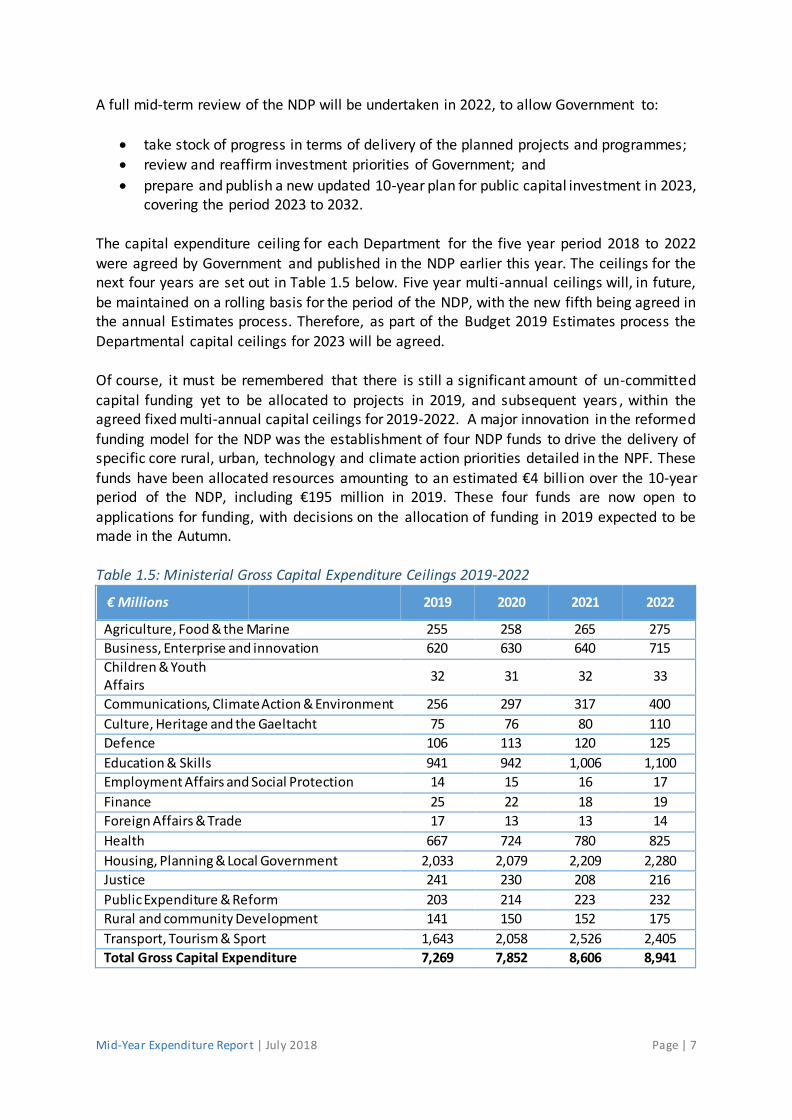
A full mid-term review of the NDP will be undertaken in 2022, to allow Government to:
take stock of progress in terms of delivery of the planned projects and programmes;
review and reaffirm investment priorities of Government; and
prepare and publish a new updated 10-year plan for public capital investment in 2023, covering the period 2023 to 2032.
The capital expenditure ceiling for each Department for the five year period 2018 to 2022 were agreed by Government and published in the NDP earlier this year. The ceilings for the next four years are set out in Table 1.5 below. Five year multi-annual ceilings will, in future, be maintained on a rolling basis for the period of the NDP, with the new fifth being agreed in the annual Estimates process. Therefore, as part of the Budget 2019 Estimates process the Departmental capital ceilings for 2023 will be agreed. Of course, it must be remembered that there is still a significant amount of un-committed
capital funding yet to be allocated to projects in 2019, and subsequent years , within the agreed fixed multi-annual capital ceilings for 2019-2022. A major innovation in the reformed
funding model for the NDP was the establishment of four NDP funds to drive the delivery of specific core rural, urban, technology and climate action priorities detailed in the NPF. These
funds have been allocated resources amounting to an estimated €4 billion over the 10-year period of the NDP, including €195 million in 2019. These four funds are now open to
applications for funding, with decisions on the allocation of funding in 2019 expected to be made in the Autumn.
Table 1.5: Ministerial Gross Capital Expenditure Ceilings 2019-2022
€ Millions
2019 2020 2021 2022
Agriculture, Food & the Marine 255 258 265 275
Business, Enterprise and innovation 620 630 640 715
Children & Youth Affairs
32 31 32 33
Communications, Climate Action & Environment 256 297 317 400
Culture, Heritage and the Gaeltacht 75 76 80 110
Defence 106 113 120 125
Education & Skills 941 942 1,006 1,100
Employment Affairs and Social Protection 14 15 16 17
Finance 25 22 18 19
Foreign Affairs & Trade 17 13 13 14
Health 667 724 780 825
Housing, Planning & Local Government 2,033 2,079 2,209 2,280
Justice 241 230 208 216
Public Expenditure & Reform 203 214 223 232
Rural and community Development 141 150 152 175
Transport, Tourism & Sport 1,643 2,058 2,526 2,405
Total Gross Capital Expenditure 7,269 7,852 8,606 8,941

Mid-Year Expenditure Report | July 2018 Page | 8
1.3 Expenditure in 2018
Total Year to Date Voted Expenditure in 2018 As outlined in Figure 1.1 below, and as set out in the June Exchequer Statement, total gross voted expenditure at end-June 2018 amounted to €29,519 million. This is €107 million, or 0.4 per cent, below profile and €2,075 million, or 7.6 per cent higher than the same period in 2017. Gross current expenditure of €27,551 million is 0.2 per cent, or €68 million, above profile and up 6.3 per cent, or €1,629 million, year-on-year. Gross voted capital of €1,968 million is €175 million, or 8.2 per cent below profile and up €445 million, or 29.2 per cent on
the same period in 2017. Figure 1.1: Gross Voted Expenditure performance to end-June 2018 (€m)
Source: End-June 2018 and 2017 Exchequer Returns and 2018 expenditure profiles.
Gross voted current expenditure for the first half of the year amounts to 47.8 per cent of the overall gross current expenditure allocation of €55,941 million. In 2017, gross current expenditure of €25,770 million represented 48.2 per cent of the outturn for the year of €58,989.
29,519 29,626
27,445
32,139
31,150
32,246
20,000
22,000
24,000
26,000
28,000
30,000
32,000
34,000
H1 Outturn 2018 H1 Profile 2018 H1 Outturn 2017 H2 Profile 2018 H2 Outturn 2017 Allocationremaining at end-
H1 2018

Mid-Year Expenditure Report | July 2018 Page | 9
Figure 1.2: Gross Voted Current Expenditure 2018 to Date (€m)
Source: End-June 2018 and 2017 Exchequer Returns and 2018 expenditure profiles.
Gross voted capital expenditure for the first half of the year amounts to 34.1 per cent of the
total gross voted capital allocation for 2018 of €5,823 million. In 2017, gross capital expenditure of €1,508 million amounted to 33.2 per cent of the total capital outturn for the year of €4,536 million. Figure 1.3: Gross Voted Capital Expenditure 2018 to Date (€m)
Source: End-June 2018 and 2017 Exchequer Returns and 2018 expenditure profiles.
Year to Date Current Expenditure by Department in 2018 Gross voted current expenditure by Health for end-June was €7,634 million. This is €168 million, or 2.3 per cent above profile, and an increase of €606 million, or 8.6 per cent, on the
27,551 27,483
25,922
28,45828,067
28,390
20,000
21,000
22,000
23,000
24,000
25,000
26,000
27,000
28,000
29,000
H1 Outturn 2018 H1 Profile 2018 H1 Outturn 2017 H2 Profile 2018 H2 Outturn 2017 AllocationRemaining atend-H1 2018
1,9682,143
1,523
3,680
3,083
3,855
0
500
1,000
1,500
2,000
2,500
3,000
3,500
4,000
4,500
H1 Outturn 2018 H1 Profile 2018 H1 Outturn 2017 H2 Profile 2018 H2 Outturn 2017 AllocationRemaining at end-
H1 2018

Mid-Year Expenditure Report | July 2018 Page | 10
outturn for end-June 2017. The budgeted year-on-year increase in current expenditure for Health is 3½ per cent. The potential impact of this year-on-year increase will be discussed in more detail below in the broader discussion on the outlook for the overall expenditure
position for 2018.
Figure 1.4: Health Current Expenditure 2018 to Date (€m)
Source: End-June 2018 and 2017 Exchequer Returns and 2018 expenditure profiles.
Figure 1.5: Employment Affairs and Social Protection Current Expenditure 2018 (€m)
Source: End-June 2018 and 2017 Exchequer Returns and 2018 expenditure profiles.
Gross voted current expenditure by the Employment Affairs and Social Protection Vote to
end-June was €10,019 million. This is €8 million, or 0.1 per cent, above profile and an increase
7,634
7,466
7,028
7,3737,317
7,205
6,700
6,800
6,900
7,000
7,100
7,200
7,300
7,400
7,500
7,600
7,700
H1 Outturn 2018 H1 Profile 2018 H1 Outturn 2017 H2 Profile 2018 H2 Outturn 2017 AllocationRemaining at end-
H1 2018
10,019 10,011
9,880
9,99010,056
9,982
8,500
8,700
8,900
9,100
9,300
9,500
9,700
9,900
10,100
10,300
H1 Outturn 2018 H1 Profile 2018 H1 Outturn 2017 H2 Profile 2018 H2 2017 Outturn AllocationRemaining atend-H1 2018

Mid-Year Expenditure Report | July 2018 Page | 11
of €139 million, or 1.4 per cent, on the same period in 2017. While not reflected in voted expenditure figures, surplus on the Social Insurance Fund (SIF) is €127 million ahead of profile driven by the PRSI receipts to the SIF being €141 million, or 2.8 per cent over profile.
Figure 1.6: Education and Skills Current Expenditure 2018 to Date (€m)
Source: End-June 2018 and 2017 Exchequer Returns and 2018 expenditure profiles.
Gross voted current expenditure by the Education and Skills vote was €4,596 million at end-June 2018. This is €16 million, or 0.3 per cent, ahead of profile, with the National Training Fund (NTF) €4 million ahead of profile. Overall, this is an increase of €314 million on the end-June outturn for 2017. Employment Affairs and Social Protection, Health and Education and Skills together account for the vast majority of current expenditure at c. 80 per cent. Collectively, these Votes are over profile by €192 million. Managing current expenditure in these votes effectively is a crucial element of overall expenditure management. In aggregate, the remaining 14 vote groups are under profile by €124 million. 12 vote groups in total are under profile for current expenditure at end-June, while 5 are over profile. Gross current expenditure in the Justice and Equality Vote Group is €42 million, or 3.5 per cent, over profile. This variance relates
primarily to Garda pay and overtime.
Year to Date Capital Expenditure by Department in 2018 Gross voted capital expenditure at end-June 2018 was €1,968 million. This is €175 million, or
8.2 per cent, below profile, and €445 million above the outturn at end-June 2017. The year-on-year increase in capital expenditure at just over 29 per cent is broadly in line with the
estimated increase for the full year of 27 per cent. The increase in capital expenditure in 2018 reflects a significant technical adjustment relating to Irish Water, which resulted in an
increase of €500 million in the gross voted capital allocation to the Department of Housing,
4,596 4,580
4,281
4,763
4,624
4,747
3,000
3,200
3,400
3,600
3,800
4,000
4,200
4,400
4,600
4,800
5,000
H1 Outturn 2018 H1 Profile 2018 H1 Outturn 2017 H2 Profile 2018 H2 Outturn 2017 AllocationRemaining at end-
H1 2018

Mid-Year Expenditure Report | July 2018 Page | 12
Planning and Local Government. Excluding this adjustment the increase for the year is 17½ per cent.
Figure 1.7: Housing, Planning and Local Government Capital Expenditure 2018 to Date (€m)
Source: End-June 2018 and 2017 Exchequer Returns and 2018 expenditure profiles.
Outlook for the Full Year Expenditure Position Given the scale of gross voted expenditure, nearly €62 billion in aggregate for 2018, the need for Supplementary Estimates or the surrender of funds to the Exchequer at end-year can arise for a number of reasons. Additional funding requirements in one area may be offset by underspends in another area. Based on the outturn in 2017, an underspend of €0.3 billion was recorded in the Vote groups
that did not fully utilise their allocations for the year. Given the cash basis of Government accounting, and the funding implications that unexpected events can have on expenditure
requirements such underspends can arise due to a number of factors. These factors include timing issues, re-estimations of demand for particular programmes, cost savings in the
delivery of programmes. Given the nature of these underspends, it is not possible to estimate the amount until a later stage of the year. Expenditure pressures can arise in a similar way.
With these uncertainties in mind, it is positive that at this point 14 out of 17 Vote Groups are managing within their expenditure profiles for the first half of the year with overall gross expenditure just 0.4 per cent below profile. While the Department of Employment Affairs and Social Protection is one of the three Vote Groups over profile, it is only over profile by €5 million, with a total spend for the first half of the year of €10 billion. In addition, while not reflected in the Exchequer figures for the first half of the year, the surplus on the SIF is almost €130 million ahead of profile, driven by PRSI receipts to the SIF being c €140 million ahead of profile.
Gross current expenditure in the Justice Vote Group is €42 million or 3.5 per cent above
profile at the end of June. A key element of this variance relates to Garda pay and in particular,
525 546
312
1,085
480
1,107
0
200
400
600
800
1,000
1,200
H1 Outturn 2018 H1 Profile 2018 H1 Outturn 2017 H2 Profile 2018 H2 Outturn 2017 AllocationRemaining at end-
H2 2018

Mid-Year Expenditure Report | July 2018 Page | 13
overtime. The Garda Vote required a Supplementary Estimate in 2017, mainly driven by pay and overtime costs, that was partly offset by underspends elsewhere in the Justice Vote Group. Taking into account that overtime continues to be a driver of overspends this issue is
covered as part of this year’s Spending Review.
Given the scale of overall expenditure in the Health sector, and the additional resources allocated over the last four years, it is crucial that the Health allocation of over €15 billion is
managed effectively by the Department of Health and the HSE as significant overspends in this area put pressure on overall resources available for other areas. At end-June while Health
expenditure was just over 2 per cent above profile it was up nearly 9½ per cent in year-on-year terms. This indicates that managing Health expenditure for the rest of the year will be
particularly challenging within the agreed 2018 allocation. Therefore taking into account the run rate on Health expenditure a continuation at that rate would indicate the requirement
for a Supplementary Estimate. Given the priority placed on ensuring the delivery of sustainable improvements in the Health service, the Government is prepared to consider the
provision of additional resources this year. The provision of such additional resources to Health would need to be accompanied by increased levels of accountability in relation to expenditure by senior management in the HSE. The extent to which an overspend in the Health sector for this year would impact on available resources for next year would depend on the driver of the overspend and the compensating items that offset any deficit impact in 2018 continuing into next year. An area of spend that would impact on the available resources for next year is staffing costs. The REV 2018 included an increase in staff numbers of 1,800, which assuming recruitment on an even basis across the year would have a carryover cost in 2019 of c. €50 million. However, up to the end of May staff numbers in the Health sector have increased by almost 1,709 or approximately 340 per month. A continuation of recruitment in line with the first five months would have a cost of over €230 million this year and a carryover cost of approximately €115 million next year. It is imperative that recruitment within the Health Service is managed in a sustainable manner for the remainder of the year.
1.4 Expenditure Summary
Post-consolidation, expenditure policy has been focussed on providing prudent and
sustainable increases in expenditure. While increases in expenditure have impacted broadly across all sectors, a particular focus has been placed on ensuring the areas of Health, Housing,
Education and Social Protection are sufficiently funded to support the Government’s social goal for a fairer and more inclusive society. This policy of moderate and sustainable increases
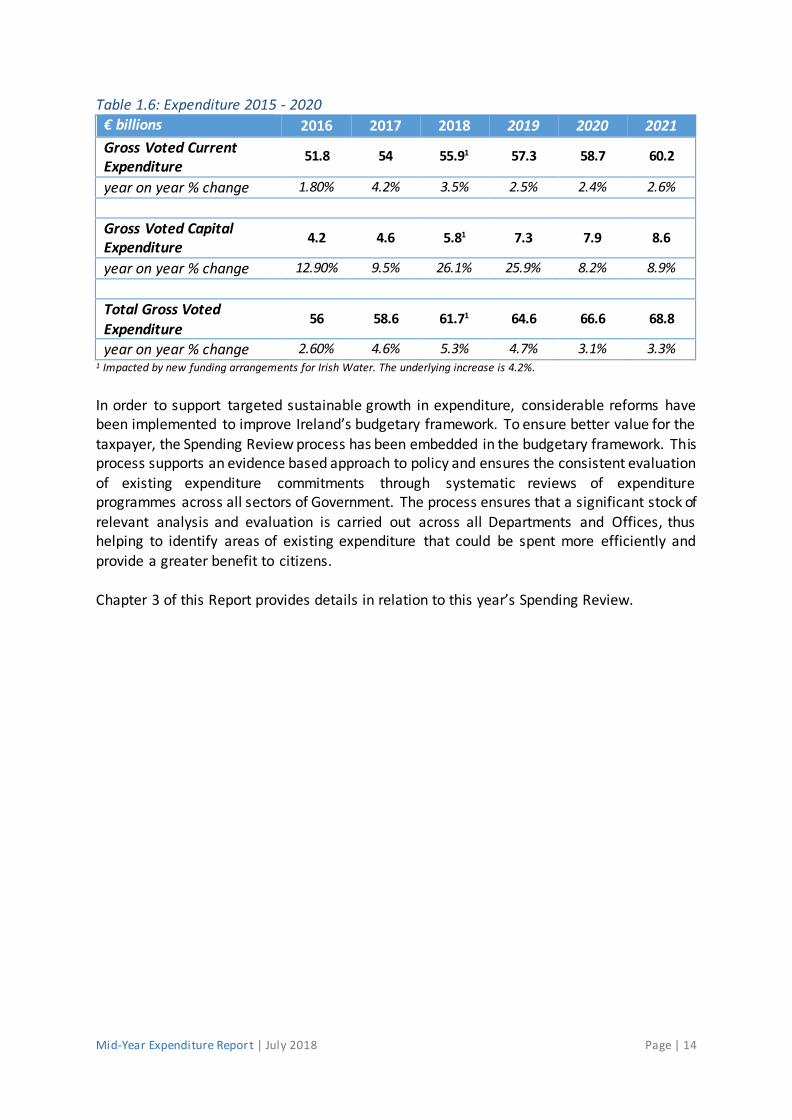
will continue to apply to expenditure policy over the medium-term as set out in Table 1.6 below.
Mid-Year Expenditure Report | July 2018 Page | 14
Table 1.6: Expenditure 2015 - 2020 € billions 2016 2017 2018 2019 2020 2021
Gross Voted Current Expenditure
51.8 54 55.91 57.3 58.7 60.2
year on year % change 1.80% 4.2% 3.5% 2.5% 2.4% 2.6%
Gross Voted Capital Expenditure
4.2 4.6 5.81 7.3 7.9 8.6
year on year % change 12.90% 9.5% 26.1% 25.9% 8.2% 8.9%
Total Gross Voted
Expenditure 56 58.6 61.71 64.6 66.6 68.8
year on year % change 2.60% 4.6% 5.3% 4.7% 3.1% 3.3% 1 Impacted by new funding arrangements for Irish Water. The underlying increase is 4.2%.
In order to support targeted sustainable growth in expenditure, considerable reforms have been implemented to improve Ireland’s budgetary framework. To ensure better value for the
taxpayer, the Spending Review process has been embedded in the budgetary framework. This process supports an evidence based approach to policy and ensures the consistent evaluation
of existing expenditure commitments through systematic reviews of expenditure programmes across all sectors of Government. The process ensures that a significant stock of
relevant analysis and evaluation is carried out across all Departments and Offices, thus helping to identify areas of existing expenditure that could be spent more efficiently and provide a greater benefit to citizens. Chapter 3 of this Report provides details in relation to this year’s Spending Review.

Mid-Year Expenditure Report | July 2018 Page | 15
Chapter 2 Public Expenditure Trends
This chapter builds on the findings of the sectoral expenditure trends report published as part of the Spending Review process. This paper examines movements across sectors and examines not only resourcing but also the key outputs and outcomes. This chapter focuses on these findings and considers the underlying trends presented in conjunction with the findings of the Spending Review paper on the efficiency of Irish public spending2.
2.1 Context for Public Expenditure
Between 1998 and 2008 there was an overall increase of €41.9 billion in gross voted expenditure, with an average annual growth rate of 11.8 per cent. These expenditure
increases proved to be unsustainable. Between 2009 and 2014, gross voted expenditure decreased by approximately €9 billion. From 2015 onwards, with an improvement in
economic conditions, and in recognition of the need for improved public services and increased public investment, expenditure has increased by an average of 3½ per cent
annually.
Figure 2.1 below shows how expenditure changed from 1998 to 2018 in four-year intervals. It is clear from this graphical representation of expenditure trends, that expenditure policy since 2014 has been characterised by more prudent and sustainable increases in public expenditure compared to levels observed in the period leading up to the crisis. Figure 2.1: Expenditure Growth 1998 - 2018 by Interval
Looking at expenditure over a 20 year period, Figure 2.2 below compares voted expenditure with Exchequer tax receipts and PRSI, and economic growth over the period 1998 to 2017.
2 Meaney & Oyewole (2018) ‘Comparative Levels and Efficiency of Irish Public Spending ’ Department of Public
Expenditure and Reform Spending Review 2018.
75%
40%
26%
-4%
21%
-11%
14%
-20% -10% 0% 10% 20% 30% 40% 50% 60% 70% 80%
1998-2002
2002-2006
2006-2009
2009-2010
2006-2010
2010-2014
2014-2018
19
98
- 2
00
6W
ith
in 2
006-
2010
Inte
rval
2006
- 2
018
Mid-Year Expenditure Report | July 2018 Page | 16
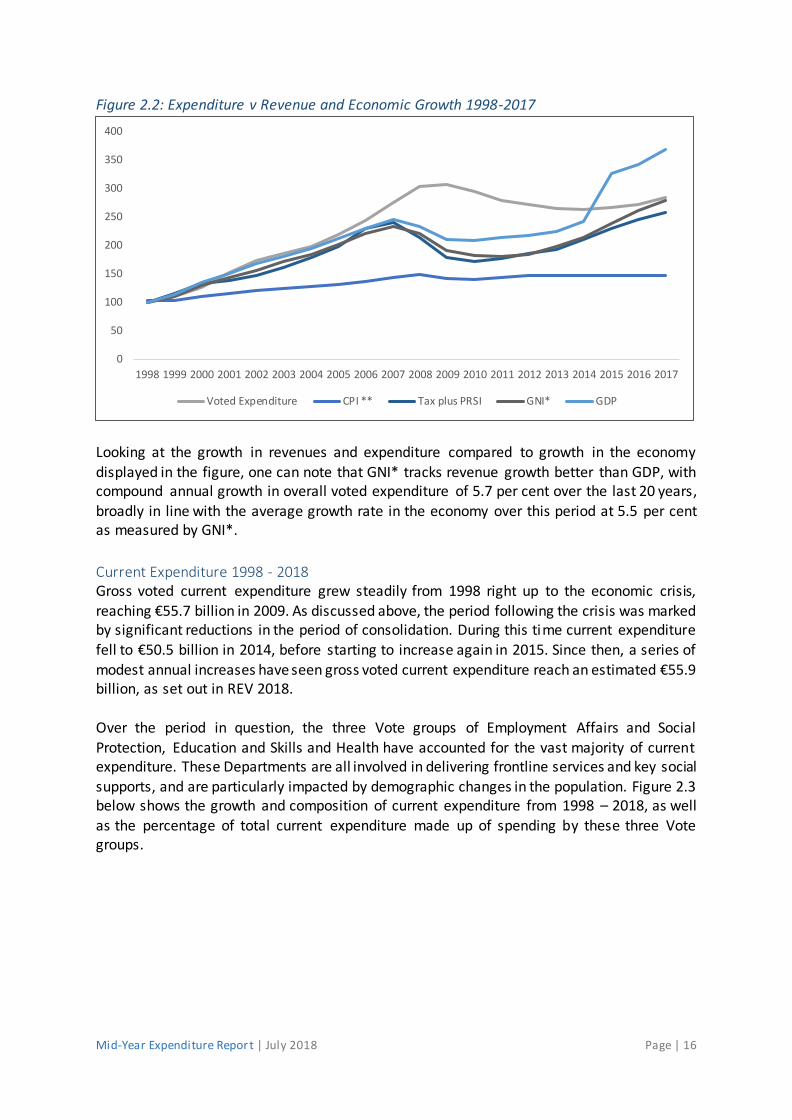
Figure 2.2: Expenditure v Revenue and Economic Growth 1998-2017
Looking at the growth in revenues and expenditure compared to growth in the economy
displayed in the figure, one can note that GNI* tracks revenue growth better than GDP, with compound annual growth in overall voted expenditure of 5.7 per cent over the last 20 years,
broadly in line with the average growth rate in the economy over this period at 5.5 per cent as measured by GNI*.
Current Expenditure 1998 - 2018 Gross voted current expenditure grew steadily from 1998 right up to the economic crisis, reaching €55.7 billion in 2009. As discussed above, the period following the crisis was marked by significant reductions in the period of consolidation. During this time current expenditure fell to €50.5 billion in 2014, before starting to increase again in 2015. Since then, a series of
modest annual increases have seen gross voted current expenditure reach an estimated €55.9 billion, as set out in REV 2018.
Over the period in question, the three Vote groups of Employment Affairs and Social
Protection, Education and Skills and Health have accounted for the vast majority of current expenditure. These Departments are all involved in delivering frontline services and key social
supports, and are particularly impacted by demographic changes in the population. Figure 2.3 below shows the growth and composition of current expenditure from 1998 – 2018, as well as the percentage of total current expenditure made up of spending by these three Vote groups.
0
50
100
150
200
250
300
350
400
1998 1999 2000 2001 2002 2003 2004 2005 2006 2007 2008 2009 2010 2011 2012 2013 2014 2015 2016 2017
Voted Expenditure CPI ** Tax plus PRSI GNI* GDP

Mid-Year Expenditure Report | July 2018 Page | 17
Figure 2.3 Current Expenditure 1998 – 2018 (€ millions)
In 1998, the three largest Vote groups accounted for 73 per cent of gross voted current expenditure. In 2018, they account for almost 80 per cent of the total. Of the three, Employment Affairs and Social Protection makes up the largest share, at 36 per cent of current expenditure in 2018. Health and Education and Skills make up 27 per cent and 17 per cent respectively in 2018.
Capital Expenditure 1998 – 2018 Gross voted capital expenditure increased significantly in the years leading up to the
economic crisis, growing from €2.5 billion in 1998 to just over €9 billion in 2008. However, the consolidation effort in the following years resulted in marked reductions in the capital budget,
which had reached a low of €3.3 billion by 2013. More recent years, however, have seen
increasing capital investment with the allocation for 2018 at €5.8 billion.
As discussed in Chapter 1, the recently published NDP sets out Departmental capital expenditure ceilings out to 2022, emphasising the Government’s commitment to prioritising
investment in public infrastructure. Ceilings for 2023 will be set as part of the Budget 2019 process.
68%
70%
72%
74%
76%
78%
80%
82%
84%
0
10,000
20,000
30,000
40,000
50,000
60,000
€m
Education & Skills Employment Affairs & Social Protection
Health Other
DHealth, DEASP ad DES as % of Total

Mid-Year Expenditure Report | July 2018 Page | 18
Figure 2.4: Current and Capital Expenditure 1998 – 2018 (€ millions)
Source: DPER Databank
Pay and Numbers Since 1997, the number of public servants employed by the State has increased by nearly 50
per cent from 222,013 FTEs to 317,495 FTEs at the end of 2017. The largest increases in staffing levels over this 20 year period were recorded in the Education and Health sectors, up nearly 65 per cent in both areas. Combined, these two sectors now account for nearly 70 per cent of all public service staffing, a share which has increased from 60 per cent in 1997. This increasing share is also reflected in the recent increase in frontline public service staffing levels which, at the end of 2017, accounted for nearly 70 per cent of all Exchequer funded public servants. These increases have allowed the Public Service to meet demographic pressures and changes in the population structure and to expand public services.
A key issue from an expenditure policy perspective is how the pay bill has developed. As Figure 2.5 below shows, the pay bill rose dramatically from 2000 to 2008, increasing at an
annual average rate of over 10 per cent. This was an unsustainable pattern of growth which was reversed through implementation of a variety of reform measures during the crisis
including significant reductions in public service numbers. These measures reduced the pay bill from €17.2 billion in 2008 to €13.8 billion in 2014. Since 2015, the average annual rate of
growth in the pay bill has been a more sustainable 4.6 per cent. In order to ensure that incremental improvements can be made to the delivery of public services the overall pay bill needs to be managed in a sustainable manner that takes into account the trade-offs between the recruitment of additional staff and other pay cost drivers. In addition, reflecting the
significant level of resources that are, and will continue to be, committed to the Exchequer pay bill, it is important that the level and composition of public service staffing supports the effective and efficient delivery of public services. A key consideration within this is the need to develop a public service that is outcome focused and can respond to and embrace demographic and technology change. One of the key ways this can be achieved is through embedding workforce planning across the public service, aligned with strategic planning.
0%
2%
4%
6%
8%
10%
12%
14%
16%
18%
0
10,000
20,000
30,000
40,000
50,000
60,000
70,000
€m
Gross Voted Current Gross Voted Capital Capital as % of Total

Mid-Year Expenditure Report | July 2018 Page | 19
Figure 2.5: Long Term Trend in Public Service Employment (FTEs) and Exchequer Pay Bill (€bn)
Source: DPER Databank
2.2 International Comparisons
In comparing Ireland to other countries in terms of spending and efficiency it is important to
note that Ireland’s expenditure comparisons are more volatile than other Euro Area (EA) countries. Key economic output measurements, such as GDP and GNI*, vary to a greater
extent in Ireland than other EA countries, making expenditure comparisons difficult and causing Ireland’s comparative position to vary significantly over time.
On first glance, spending as a percentage of GDP is well below EA norms. However, taking account of certain differences between Ireland and other EA countries, this gap in spending tends to shrink. Firstly, using GNI* for Ireland the gap in total spending decreases from 20 per cent of GDP to 5 per cent of GNI*. Secondly, accounting for the differing age structures across EA countries, the gap as a percentage of GNI* falls further to only -0.6 per cent. Table 2.1: Snapshot of 2015 gap between Ireland and Euro-area average expenditure (%)
Total Expenditure Non Age-Adjusted Age-Adjusted
GDP base -19.7 -16.9 GNI base -11.5 -7.9
GNI* base -4.9 -0.6 Source: Meaney, Oyewole and Bedogni, 2018. ‘Comparative levels and efficiency of Irish Public Spending’
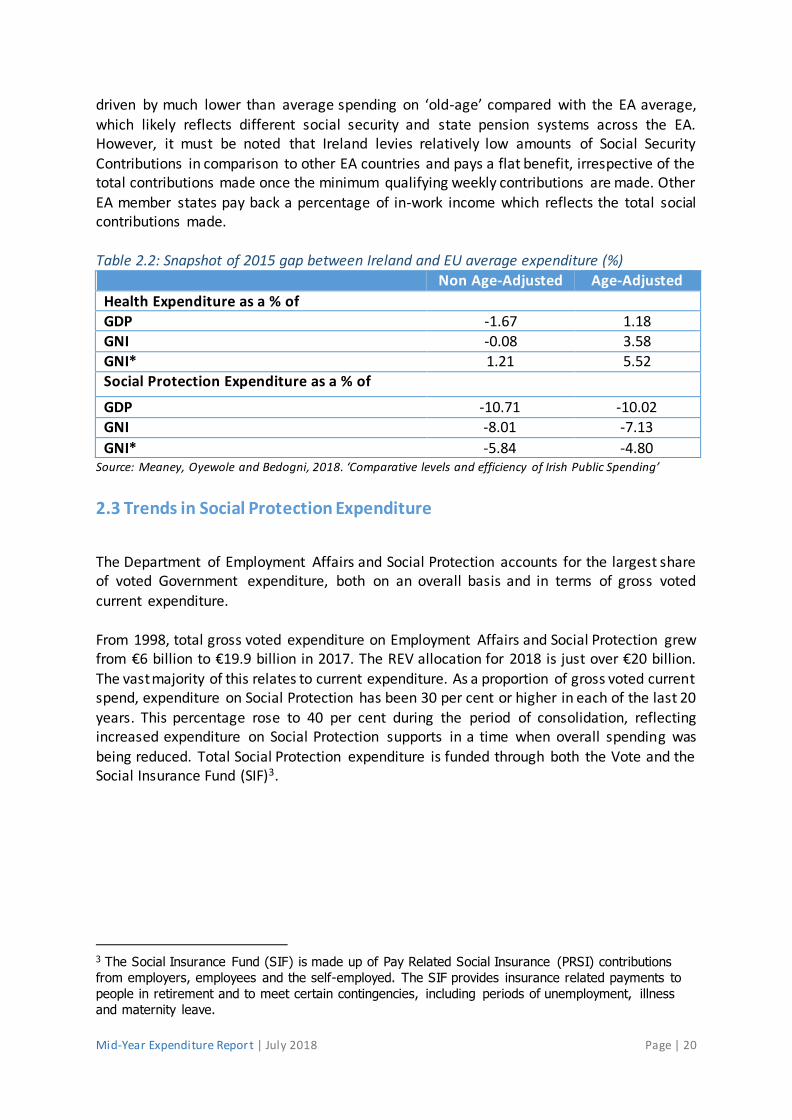
However, on a sectoral basis there are two notable gaps that persist over time. These are
Health spending and Social Protection spending, which have been consistent drivers of the expenditure gap over time. Based on GDP, Health is at or slightly under the average spending
across the EA. However, this changes when using GNI* and accounting for age, where it is shown that Irish Health expenditure is well above average. The spending on social protection
is below average using all economic output bases and even after adjusting for age. This is
0.0
2.0
4.0
6.0
8.0
10.0
12.0
14.0
16.0
18.0
20.0
0
50,000
100,000
150,000
200,000
250,000
300,000
350,000
Exch
eq
uer
Pa
y B
ill (
€bn)
Pub
lic
Serv
ice
Empl
oym
ent (
FTEs
)
Total - Ex. Local Authorities (Lhs) Local Authorities (Lhs) Exchequer Pay Bill (Rhs)
Mid-Year Expenditure Report | July 2018 Page | 20
driven by much lower than average spending on ‘old-age’ compared with the EA average, which likely reflects different social security and state pension systems across the EA. However, it must be noted that Ireland levies relatively low amounts of Social Security
Contributions in comparison to other EA countries and pays a flat benefit, irrespective of the total contributions made once the minimum qualifying weekly contributions are made. Other
EA member states pay back a percentage of in-work income which reflects the total social contributions made.
Table 2.2: Snapshot of 2015 gap between Ireland and EU average expenditure (%)
Non Age-Adjusted Age-Adjusted
Health Expenditure as a % of
GDP -1.67 1.18 GNI -0.08 3.58
GNI* 1.21 5.52 Social Protection Expenditure as a % of
GDP -10.71 -10.02 GNI -8.01 -7.13
GNI* -5.84 -4.80 Source: Meaney, Oyewole and Bedogni, 2018. ‘Comparative levels and efficiency of Irish Public Spending’
2.3 Trends in Social Protection Expenditure
The Department of Employment Affairs and Social Protection accounts for the largest share of voted Government expenditure, both on an overall basis and in terms of gross voted current expenditure.
From 1998, total gross voted expenditure on Employment Affairs and Social Protection grew from €6 billion to €19.9 billion in 2017. The REV allocation for 2018 is just over €20 billion. The vast majority of this relates to current expenditure. As a proportion of gross voted current spend, expenditure on Social Protection has been 30 per cent or higher in each of the last 20 years. This percentage rose to 40 per cent during the period of consolidation, reflecting increased expenditure on Social Protection supports in a time when overall spending was being reduced. Total Social Protection expenditure is funded through both the Vote and the Social Insurance Fund (SIF)3.
3 The Social Insurance Fund (SIF) is made up of Pay Related Social Insurance (PRSI) contributions
from employers, employees and the self-employed. The SIF provides insurance related payments to
people in retirement and to meet certain contingencies, including periods of unemployment, illness
and maternity leave.

Mid-Year Expenditure Report | July 2018 Page | 21
Figure 2.6: Gross Voted Current Expenditure by DEASP
Source: DPER Databank
Increases have occurred across all programme areas over the 20 year period. A major driver
of the growth in Social Protection expenditure is Pensions, the cost of which is expected to reach €7.5 billion in 2018. This growth is driven by increases in both pension rates and
pensioner numbers. Other significant increases include the Working Age – Employments Supports programme, which has grown by 466 per cent between 1998 and 2017 and the
Children programme, which has grown by 361 per cent. Since just 2012, the allocation to illness, disability and carers schemes has increased by 23 per cent. These increases reflect
increases in rates and both recipients and beneficiaries. Expenditure drivers
Demographics: Demographic change has led to an expansion in the volume of Social Protection support recipients. The overall population expanded by 1.128 million or 31 per cent in the period 1997 to 2017. Critically, the two significant groups in terms of universal social protection payments, are children and older people. Over the review period, the
number of children increased by 125,800, or 11 per cent, and the number of people aged 65 and over increased by 233,600, or 56 per cent.
Economic Cycle: Social Protection expenditure is particularly sensitive to changes in the
economic cycle. Social Protection plays a leading role in providing a social safety net/automatic stabilisers in the face of economic shocks and accordingly elements of
expenditure such as jobseekers benefit and assistance and employment supports are driven by cyclical conditions. The number of people on the Live Register fell below 150,000 at the
turn of the century and remained relatively constant until the economic downturn in 2008. The number rose sharply to approximately 450,000 in 2010/2011. Since 2012 it has been on
a downward trajectory reaching 241,000 at end 2017 on a seasonally adjusted basis.
6,011
19,936
33%
37%
20%
25%
30%
35%
40%
45%
0
5,000
10,000
15,000
20,000
25,000€
m
Gross Voted Current DEASP as % of total gross voted current
Mid-Year Expenditure Report | July 2018 Page | 22
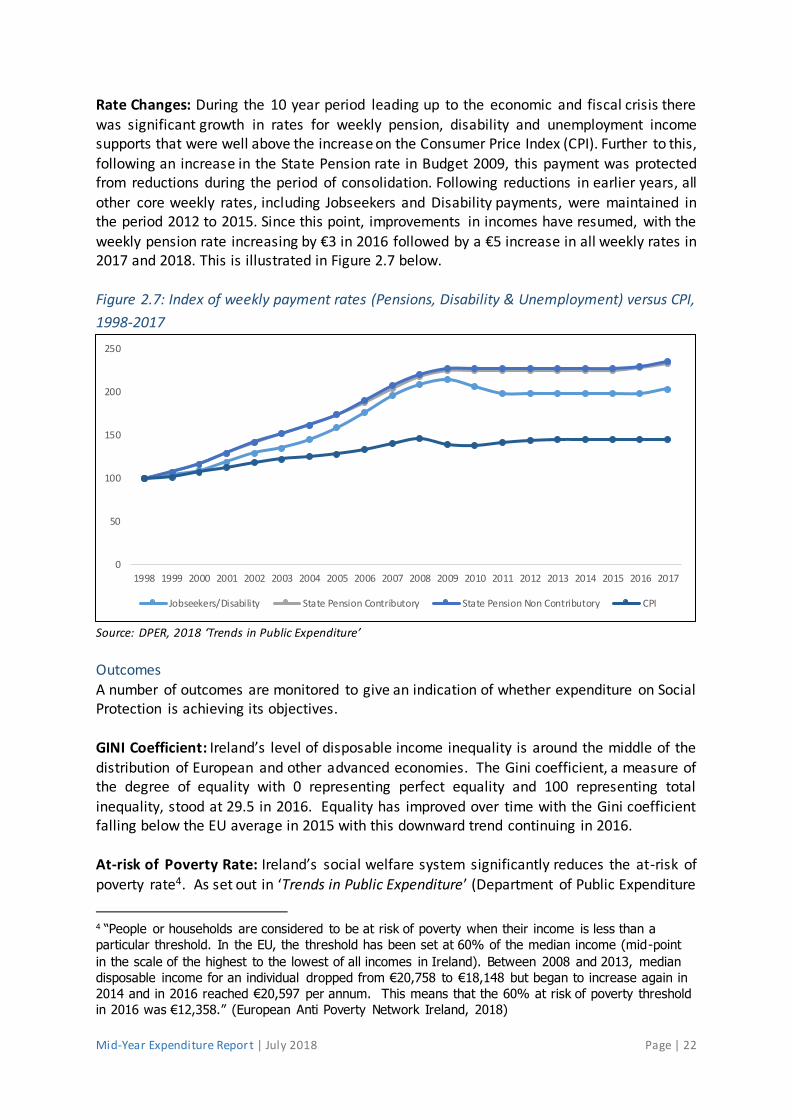
Rate Changes: During the 10 year period leading up to the economic and fiscal crisis there was significant growth in rates for weekly pension, disability and unemployment income supports that were well above the increase on the Consumer Price Index (CPI). Further to this,
following an increase in the State Pension rate in Budget 2009, this payment was protected from reductions during the period of consolidation. Following reductions in earlier years, all
other core weekly rates, including Jobseekers and Disability payments, were maintained in the period 2012 to 2015. Since this point, improvements in incomes have resumed, with the
weekly pension rate increasing by €3 in 2016 followed by a €5 increase in all weekly rates in 2017 and 2018. This is illustrated in Figure 2.7 below.
Figure 2.7: Index of weekly payment rates (Pensions, Disability & Unemployment) versus CPI,
1998-2017
Source: DPER, 2018 ‘Trends in Public Expenditure’
Outcomes A number of outcomes are monitored to give an indication of whether expenditure on Social Protection is achieving its objectives.
GINI Coefficient: Ireland’s level of disposable income inequality is around the middle of the
distribution of European and other advanced economies. The Gini coefficient, a measure of the degree of equality with 0 representing perfect equality and 100 representing total
inequality, stood at 29.5 in 2016. Equality has improved over time with the Gini coefficient falling below the EU average in 2015 with this downward trend continuing in 2016.
At-risk of Poverty Rate: Ireland’s social welfare system significantly reduces the at-risk of
poverty rate4. As set out in ‘Trends in Public Expenditure’ (Department of Public Expenditure
4 “People or households are considered to be at risk of poverty when their income is less than a
particular threshold. In the EU, the threshold has been set at 60% of the median income (mid-point
in the scale of the highest to the lowest of all incomes in Ireland). Between 2008 and 2013, median
disposable income for an individual dropped from €20,758 to €18,148 but began to increase again in
2014 and in 2016 reached €20,597 per annum. This means that the 60% at risk of poverty threshold
in 2016 was €12,358.” (European Anti Poverty Network Ireland, 2018)
0
50
100
150
200
250
1998 1999 2000 2001 2002 2003 2004 2005 2006 2007 2008 2009 2010 2011 2012 2013 2014 2015 2016 2017
Jobseekers/Disability State Pension Contributory State Pension Non Contributory CPI
Mid-Year Expenditure Report | July 2018 Page | 23
and Reform, 2018), the at-risk of poverty rate excluding social transfers increased continually from 2008, going from 41 per cent in 2007 to a peak of 50.7 per cent in 2011 before declining thereafter to 44.9 per cent in 2016. The at risk of poverty rate - including social transfers -
highlights the effectiveness of the social welfare system with the rate at 14.1 per cent in 2009, increasing gradually to 17.3 per cent in 2012 before reducing to 16.5 per cent in 2016.
Future issues
Over the period 2014 to 2018 Social Protection expenditure is projected to have increased by €220 million or 1.1 per cent. At the same time, Live Register related expenditure is projected
to have fallen by €1.2 billion due to improvements in the labour market. Therefore underlying Social Protection expenditure (excluding cyclical Live Register costs) is projected to have
increased by €1.4 billion or 8.5 per cent over the period.
A key driver of this significant increase in underlying expenditure is demographic pressures, as well as increasing recipient numbers. Excluding Live Register related income and
employment supports, the number of recipients of weekly social welfare payments grew by 7 per cent over the period 2014 to 2018. The number of people in receipt of pension payments increased by over 50,000, or 9 per cent, over the same period. The number of working-age recipients, excluding the Live Register, increased by 4 per cent, mainly due to an expansion in recipient numbers of Disability and Carer’s Allowances. Budget packages have also played a role, with full year costs of €142 million in 2015, €279m in 2016, €469 million in 2017 and a further €453 million in 2018. This increased level of funding has allowed for a higher level of support to be delivered, through higher payment rates and an increasing number of recipients. There are a number of challenges facing the Social Protection sector over the short- and long-term, including demographic related pressures, an evolving labour market and other structural challenges. Pensions is a key issue, as demographic pressures will continue to drive up recipient numbers. Structural issues will also likely further contribute to upward pressures, specifically on disability and carer related support. The employment situation is continuing to improve and the future outlook is positive, with a medium-term expected growth rate of 1.95
per cent. At end-2017, unemployment stood at 6.1 per cent. This low level of unemployment
drives down Live Register related costs and demand for employment supports, resulting in savings. However, as we approach what can reasonably be described as full employment, these savings will soon begin to level off. However, challenges remain in relation to the level of participation in a constantly evolving labour market.
2.4 Trends in Health Expenditure
The annual amount spent by Government on healthcare provision has increased substantially
over the last 20 years. In 1998, the Government spent nearly €4.2 billion on Health. In 2018 just over €15.3 billion has been allocated to Health expenditure.
As outlined in Figure 2.8 below, the increase in Health expenditure over the last 20 years can
be categorised into three phases, in the period from 1998 to 2009 Health spending increased

Mid-Year Expenditure Report | July 2018 Page | 24
significantly. This was followed by a period of spending contraction in the years of consolidation, largely the result of central pay agreements and the recruitment moratorium. Health expenditure has risen annually since the end of 2013.
Figure 2.8: Gross Voted Health Expenditure 1998-2017 (€ Millions)
Source: DPER, 2018 ‘Trends in Public Expenditure’
It is difficult to compare Health expenditure across the last 20 years on a like-for-like basis
due to a number of significant changes that have taken place. These changes include the transfer of some functions to the Departments of Employment and Social Affairs and the Department of Children and Youth Affairs and the movement of approximately €1 billion of HSE own income off the Vote. Controlling for these changes, it is clear that the amount Government spend on Health has increased substantially since 1997. That year, the Government spent just over €3.6 billion on Health. By 2017 that figure had more than quadrupled to €15.6 billion. Investment in healthcare provision has become an increas ing priority within overall Government spending over the past two decades. In 1998 Health spending accounted for 20 per cent of Voted Government expenditure. In contrast this
proportion has increased to 25 per cent in 2018.
This commitment to Health can been seen by the annual increases in expenditure compared to other sectors of Government in the period post-consolidation. An examination of gross
voted Health expenditure outturn demonstrates the level to which Health has been prioritised over the last number of years. This is set out graphically in Figure 2.9 below.
0
2,000
4,000
6,000
8,000
10,000
12,000
14,000
16,000
1997 1998 1999 2000 2001 2002 2003 2004 2005 2006 2007 2008 2009 2010 2011 2012 2013 2014 2015 2016 2017
€m
Capital Current
3.6
14.815.6

Mid-Year Expenditure Report | July 2018 Page | 25
Figure 2.9 Gross Voted Health Expenditure Outturn 2015 – 2018 (€ Millions)
Source: DPER Databank
Expenditure drivers A range of factors have played a role in driving change in the scale of Health expenditure over the past 20 years. The main factors are set out in this section. Firstly, the demographic profile of Ireland is markedly different today compared to 20 years ago. Indeed, the overall population expanded by roughly 1.2 million or 30 per cent in this 20 year period. Such a large increase demanded increased levels of resources and impacted on the increase in Exchequer funding being allocated to Health. Against this, the age profile of the State remains young. Ireland’s older population (those aged over 65) is significantly lower than the EU average at 12.7 per cent of the population in Ireland compared with the 17.5 per cent EU average. This disparity should enable Ireland to spend a lower proportion of resources
on Health compared to other European States but as will be discussed in the next section, expenditure in Ireland remains comparatively high.
A further indictor of expenditure growth is the large increase in Health staff numbers. Indeed,
staffing levels in the Health sector increased by approximately 42,900 or 63 per cent over the period 1997 to 2017, as illustrated in Figure 2.10 below. Staffing levels over the last 20 years can be broken into three different cohorts: Pre-consolidation, staffing levels increased considerably by 43,611 FTEs or 64 per cent to reach a peak in 2007 of just over 108,000, adjusted for transfer of functions. This was followed by staffing levels being reduced incrementally to roughly 97,000 FTEs in 2014. Since 2014 there has been a significant increase in recruitment levels with HSE staff numbers rising by 15 per cent.
13,341
14,107
14,798
15,332
12,000
12,500
13,000
13,500
14,000
14,500
15,000
15,500
2015 Outturn 2016 Outturn 2017 Outturn 2018 REV Allocation

Mid-Year Expenditure Report | July 2018 Page | 26
Figure 2.10: HSE Staffing Levels 1997 - 2017
Source: DPER, 2018 ‘Trends in Public Expenditure’
Another key driver in Health expenditure over the last 20 years is the increasing cost of
pharmaceuticals, particularly so in recent years. This cost has fluctuated over the period 2012 to 2017 as expenditure on some schemes decreased from 2012 to 2014 as a consequence of
the introduction of a number of measures tightening eligibility and reducing supplier fees before increasing in recent years. Indeed, from 2014 to 2016 pharmaceutical costs were on a
similar upward trajectory to overall Health expenditure before the finalisation of the agreement with The Irish Pharmaceutical Healthcare Association.
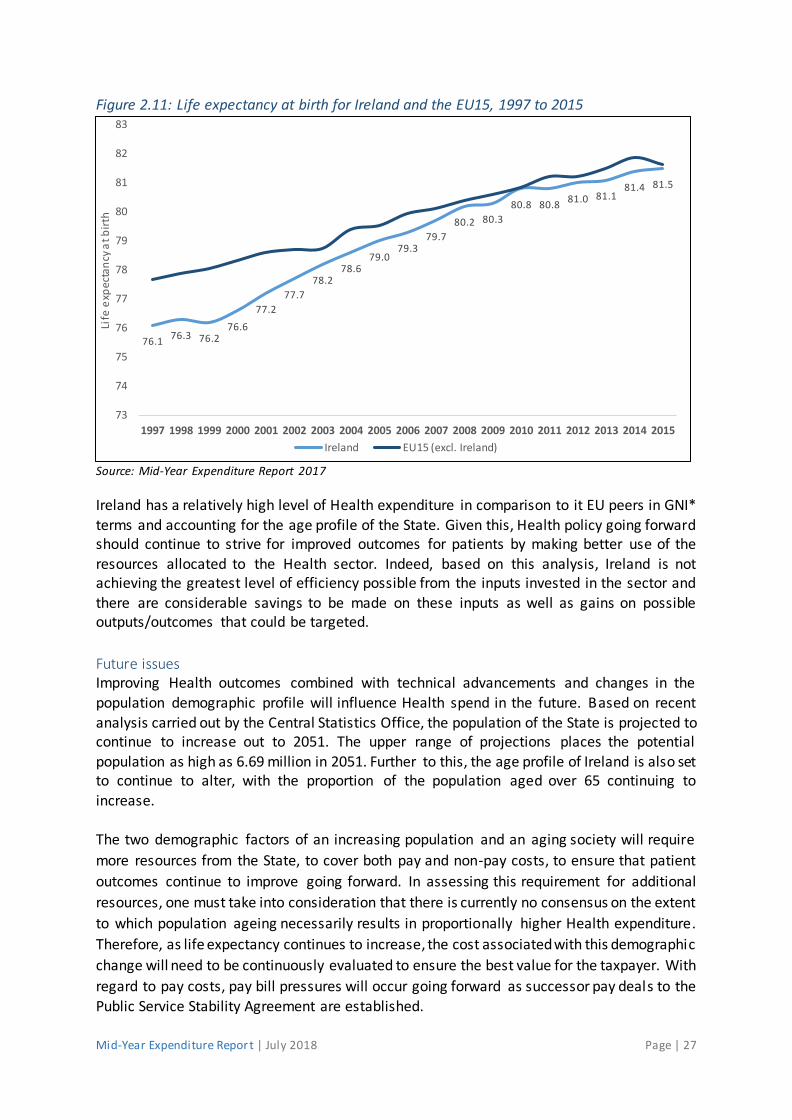
Outcomes As Health expenditure has increased over the past two decades, Irish Health outcomes have also improved. This is best illustrated by the growth in life expectancy that has occurred over
the last 20 years. As graphically shown in Figure 2.11 below, Irish life expectancy at birth has improved from 76.1 years in 1997 to 81.5 years in 2015. The rate in 1997 was roughly a year
and a half less than the average for the rest of the EU15 of 77.7 years. In contrast in 2015 Ireland’s life expectancy at birth is almost the same as the EU15 average.
This growth in life expectancy demonstrates that the investment by the Government into the
healthcare system has translated into tangible benefits for Irish society. However, given the amount spent on healthcare each year and Ireland’s relatively young population, it may be
the case that our standing in outcome indicators should be much better. Indeed, in a number
of measures there is scope for Ireland to improve outcomes. For example, based on hospital discharge rates, activity in Irish hospital is below the OECD average and while the five year
survival rates in Ireland for all cancers is improving, we are still below the OECD average in terms of breast cancer five year net survival; 82 per cent compared with 85 per cent.
67,895
110,795
50,000
60,000
70,000
80,000
90,000
100,000
110,000
120,000
1997 1998 1999 2001 2002 2003 2004 2005 2006 2007 2008 2009 2010 2011 2012 2013 2014 2015 2016 2017
FTEs
Mid-Year Expenditure Report | July 2018 Page | 27
Figure 2.11: Life expectancy at birth for Ireland and the EU15, 1997 to 2015
Source: Mid-Year Expenditure Report 2017
Ireland has a relatively high level of Health expenditure in comparison to it EU peers in GNI* terms and accounting for the age profile of the State. Given this, Health policy going forward should continue to strive for improved outcomes for patients by making better use of the resources allocated to the Health sector. Indeed, based on this analysis, Ireland is not achieving the greatest level of efficiency possible from the inputs invested in the sector and there are considerable savings to be made on these inputs as well as gains on possible outputs/outcomes that could be targeted.
Future issues Improving Health outcomes combined with technical advancements and changes in the
population demographic profile will influence Health spend in the future. Based on recent
analysis carried out by the Central Statistics Office, the population of the State is projected to continue to increase out to 2051. The upper range of projections places the potential population as high as 6.69 million in 2051. Further to this, the age profile of Ireland is also set to continue to alter, with the proportion of the population aged over 65 continuing to
increase. The two demographic factors of an increasing population and an aging society will require
more resources from the State, to cover both pay and non-pay costs, to ensure that patient
outcomes continue to improve going forward. In assessing this requirement for additional
resources, one must take into consideration that there is currently no consensus on the extent
to which population ageing necessarily results in proportionally higher Health expenditure.
Therefore, as life expectancy continues to increase, the cost associated with this demographic
change will need to be continuously evaluated to ensure the best value for the taxpayer. With
regard to pay costs, pay bill pressures will occur going forward as successor pay deals to the
Public Service Stability Agreement are established.
76.176.3 76.2
76.6
77.2
77.7
78.278.6
79.079.3
79.7
80.2 80.3
80.8 80.881.0 81.1
81.4 81.5
73
74
75
76
77
78
79
80
81
82
83
1997 1998 1999 2000 2001 2002 2003 2004 2005 2006 2007 2008 2009 2010 2011 2012 2013 2014 2015
Life
exp
ecta
ncy
at b
irth
Ireland EU15 (excl. Ireland)
Mid-Year Expenditure Report | July 2018 Page | 28
Against this, there are also downward expenditure pressures in the Health sector. For example, numbers in receipt of Medical Card provision may decline, absent policy changes, as the labour market improves, and further savings on pharmaceuticals will arise from the
2016 agreement with the Irish Pharmaceutical Healthcare Association. Both of these factors will come under pressure as new pharmaceuticals are introduced, and in the event that
medical card cover is expanded.
The potential upward trajectory of Health expenditure is clear. It is against this backdrop of rising demographic pressures and diminishing returns from heath spending that Spending
Review 2018 is taking place. In order to continue to improve population health outcomes and grow Health expenditure in a sustainable manner, it is important that existing resources are
deployed, and continue to be deployed, in the most efficient and effective manner possible.
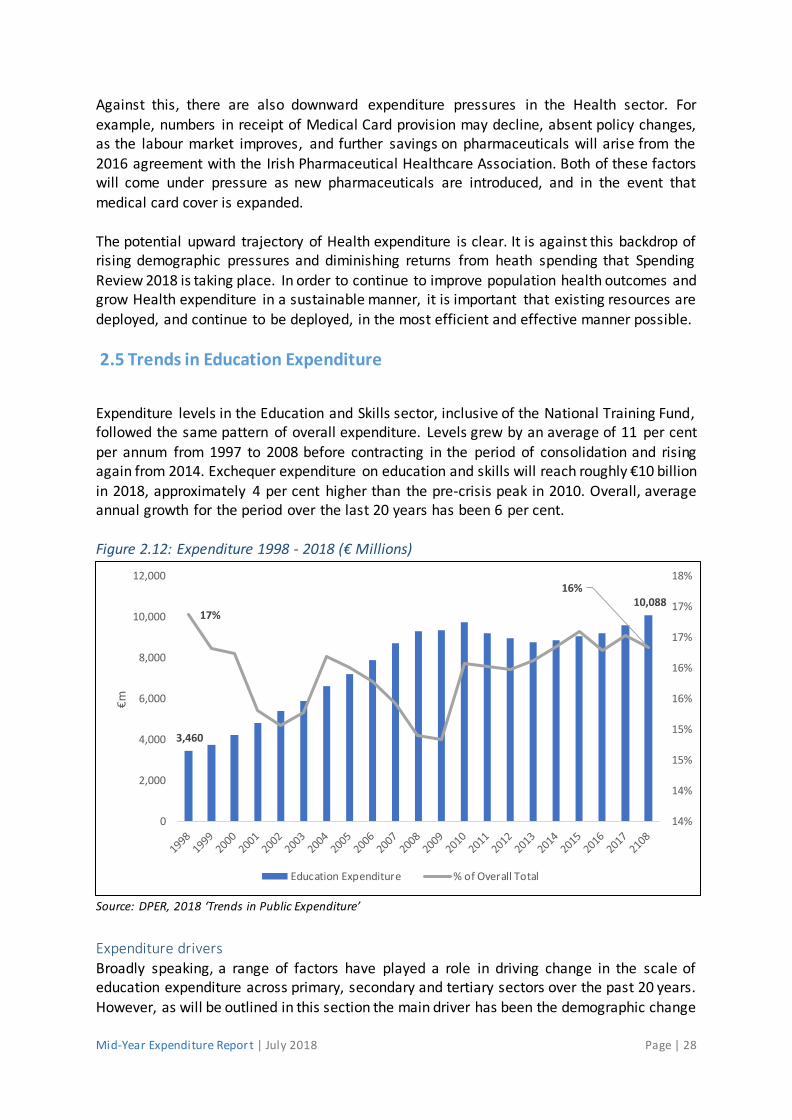
2.5 Trends in Education Expenditure
Expenditure levels in the Education and Skills sector, inclusive of the National Training Fund, followed the same pattern of overall expenditure. Levels grew by an average of 11 per cent per annum from 1997 to 2008 before contracting in the period of consolidation and rising again from 2014. Exchequer expenditure on education and skills will reach roughly €10 billion in 2018, approximately 4 per cent higher than the pre-crisis peak in 2010. Overall, average annual growth for the period over the last 20 years has been 6 per cent. Figure 2.12: Expenditure 1998 - 2018 (€ Millions)
Source: DPER, 2018 ‘Trends in Public Expenditure’
Expenditure drivers
Broadly speaking, a range of factors have played a role in driving change in the scale of education expenditure across primary, secondary and tertiary sectors over the past 20 years.
However, as will be outlined in this section the main driver has been the demographic change
3,460
10,088 17%
16%
14%
14%
15%
15%
16%
16%
17%
17%
18%
0
2,000
4,000
6,000
8,000
10,000
12,000
€m
Education Expenditure % of Overall Total

Mid-Year Expenditure Report | July 2018 Page | 29
in Irish society and the subsequent impact this has had on the pay bill within the education sector.
As shown in Figure 2.13 below, the percentage share of expenditure on first, second and early year’s education has increased slightly in recent years. Conversely, the percentage share of
expenditure spent on higher education has been on a downward decline since the onset of the fiscal crisis, albeit if the absolute spend has increased year-on-year since 2014. The total
share of capital expenditure increased over the period.
Figure 2.13: Expenditure 1994 - 2018 by education sector
Source: DPER, 2018 ‘Trends in Public Expenditure’
While, the Department of Education and Skills assumed full responsibility for the Further
Education and Training sector in 2010, with expenditure averaging 4 per cent of aggregate spend from 2010 to 2018, this component of expenditure has not been included in this
analysis to illustrate the movement of expenditure between primary, secondary and tertiary sectors .
The increasing percentage share of expenditure in the State directed to first, second and early
years education is in recent years can be explained by the substantial demographic growth experienced in Ireland in the period post-consolidation and by policy decisions. During this
period, pupil numbers at primary and post-primary noticeably increased.
The demographic shift is best illustrated by comparing the staffing trend across the different education sectors, set out in Figure 2.14 below. From the figure one can note that staffing
levels in the primary education sector have been on an upward trend from 2008 to 2017, growing by 16 per cent over the period. Similarly, second level staffing increased by 12 per
cent over the period. Conversely, staffing levels in the Third level sector decreased by 13 per
cent from 2008 to 2017. An important component of these staffing shifts, and reflective of Government policy, the number of Special Needs Assistants increased by 31 per cent over the period 2008-2017.
0%
20%
40%
60%
80%
100%
First, Second & Early Year's Education Higher Education Capital Services

Mid-Year Expenditure Report | July 2018 Page | 30
Figure 2.14: Staffing trend for 1st, 2nd and 3rd Level, 2008 - 2017
Source: DPER, 2018 ‘Trends in Public Expenditure’
Outcomes The investment of Exchequer resources in the education system has been beneficial to Irish
society with the numbers of those with a third level qualification in the State rising from 13.6
per cent in 1991 to 42.0 per cent by 20165.
The improvement of educational attainment across the State has played a pivotal role in raising living standards in Ireland. Figure 2.15 below outlines the earnings differential of
workers by educational attainment in Ireland, the OECD and EU22. From the graph one can clearly see that Ireland has the highest earnings for educated adult workers at all categories,
when compared with the OCED and EU22. However, the difference between Ireland and the OECD average is most pronounced amongst third levels graduates compared to those with
education achievement below upper secondary.
The translation of improved levels of education attainment to higher earnings is encouraging and reflective of the efficient use of these resources. Indeed, Ireland spends less on education
than most of its EU peers and achieves relatively efficient outcomes. This dis parity is particularly noticeable in the third level sector where Ireland spends substantially less per
student than either the OECD or EU average.
5 CSO Report 2016.
16,000
21,000
26,000
31,000
36,000
41,000
FTE
First Level Second Level Third Level
16% Increase Over Period
12% Increase Over Period
13% Decrease Over Period

Mid-Year Expenditure Report | July 2018 Page | 31
Figure 2.15: Relative earnings of workers, by educational attainment (2015)
Source: DPER, 2018 ‘Trends in Public Expenditure’
Future issues Looking forward, there are a number of identifiable future expenditure drivers that will require attention from the Government. Not dissimilar from the Health sector these mostly
relate to demographic factors.
Firstly, in the short term the shift of demographic pressures from primary level to second level will need to be managed. The current demographic spike in student numbers for primary
schools are expected to peak this year with the pressure shifting to the secondary sector which is projected to peak in 2025. As these demographic needs shift, there will be a need to
reprioritise existing resources towards second level which will require careful workforce planning for the entire sector.
In the medium term, this pressure will shift to the third level sector. This represents a
significant challenge on the horizon as the expected increase in student demand over the coming years from demographic pressures will be coupled with higher participation rates.
Long term, expected increases in student numbers will further drive the need for capital investment across the Irish education system, most noticeably in the third level sector. This is reflected within the resource allocations set out in the NDP for the Higher Education Sectors. Going forward, significant funding will be made available to support the refurbishment,
maintenance and equipment renewal across the sector, in addition to an Exchequer-supported building programme.
0
50
100
150
200
250
Below uppersecondary
Total tertiary Short-cycle tertiary Bachelor's orequivalent
Master's, doctorateor equivalent
Ireland OECD average EU22 average
25-64 year-olds with income from employment (full- and part-time workers); upper secondary education = 100Source: OECD Education at a Glance, 2017

Mid-Year Expenditure Report | July 2018 Page | 32
2.6 Future Expenditure Policy
As outlined in the SES, the Government’s budgetary strategy is based on steady increases in public expenditure that are underpinned by stable and predictable tax revenues. This approach is targeted at ensuring that fiscal policy supports sustainable improvements in public services and social supports. Expenditure increases need to be affordable both today and in the longer-term. Such an approach works towards mitigating the risk of future sharp expenditure reductions of the scale seen during the fiscal and economic crisis.
As outlined above, the areas of Health, Social Protection and Education account for c. 80 per cent of all current expenditure on delivering public services and providing social supports. Given the demographic challenges facing these sectors over the coming years and the requirement for increased and enhanced services in these areas, there must be as much focus on examining the totality of expenditure in these and all other areas of Government as there is on the incremental amount available to be allocated at Budget time each year. Critically, maintaining a sustainable public expenditure policy requires focus not only on the quantum of expenditure each year, but also on the quality of that expenditure and the results being achieved. Systematic information about the efficiency and effectiveness of expenditure is crucial in assessing the extent to which public expenditure is delivering key social and economic objectives. Over the last number of years, the budgetary framework has undergone significant reform. A number of initiatives are now in place that focus on what is being achieved by public spending. Consequently, in order to avoid a return to unsustainable growth in expenditure, while supporting targeted improvements in the delivery of public services, there are two key
instruments in the framework for sustainable expenditure policy:
ensuring consistent evaluation of the effectiveness of existing levels of expenditure in the delivery of targeted outputs and outcomes: and
the setting of sustainable levels of structural expenditure growth. Budgetary reforms to support evaluation of effectiveness of public expenditure In recent years, significant reforms have been implemented to Ireland’s budgetary framework to embed sound expenditure management practice that maintains a focus on the results
being achieved across the public service and the extent to which public spending is delivering on key policy objectives. Key elements within this suite of expenditure reform measures include Performance Budgeting, enhanced resourcing of the Irish Government Economic and
Evaluation Service (IGEES), which is tasked with promoting and embedding evidence in the policy making process, and the Spending Review process, which also enhances the evidence base to inform the prioritisation of expenditure. The Performance Budgeting initiative, introduced in 2011, has undergone significant review and refinement over the last number of years. The aim of the initiative is to improve the effectiveness and efficiency of public expenditure by linking the funding of public service organisations to the results they deliver, making systematic use of performance information.

Mid-Year Expenditure Report | July 2018 Page | 33
Each year, performance information is published in the REV alongside financial and human resources information for each Vote, on a programme level. The newest element of the Performance Budgeting initiative is the Public Service Performance Report, the second
iteration of which was published in 2018. This Report outlined the key outputs and outcomes delivered in 2017 by the diverse range of bodies across the Public Service. The aim of the
Report is to facilitate timely, meaningful and constructive dialogue between Government and the Oireachtas on what is being delivered with public funds.
Alongside performance budgeting information, REV 2018 also saw the rollout of a pilot
programme of Equality Budgeting, on foot of a Programme for Government Commitment. Equality Budgeting is a process in which the budget is considered as a process with specific
values that embodies long-standing societal choices about how resources are used, rather than simply a neutral process of resource allocation. In practice, this means that Equality
Budgeting attempts to provide greater information on how proposed or ongoing budgetary decisions will impact on particular groups within society, with a view to better facilitating the
integration of equality concerns into the budgetary process. Equality Budgeting targets were set out in REV 2018 and reported on in the Public Service Performance Report 2017. While the initial focus is on gender, the intention is to broaden the scope of the initiative to other equality grounds. One of the key elements in responding to the Programme for Government commitment regarding equality budgeting has been the development of a Social Impact Assessment (SIA) Framework, which is designed to focus on policy areas that cannot easily be incorporated into the existing SWITCH model, specifically the impacts of public expenditure on recipient households. The framework aims to complement the existing process that takes place each year with additional information on where Government resources are spent and who the key beneficiaries are. The framework allows evaluators to broaden the scope of the current SIA practice to take account of not only tax and social welfare measures, but also assess how changes in public expenditure policy can impact on household outcomes and living standards. By doing so it may, in the future, be possible to compare the distributional impact of changes to various types of public service spending and the implications for household outcomes. To date, SIAs have been carried out in relation to targeted childcare schemes and
the general medical services scheme. In the future, the aim will be to expand the assessment,
in so far as is possible within the available data constraints, to demonstrate the impact of particular policy measures across the income distribution. Other policy areas, including the National Minimum Wage, are under consideration for publication in 2018. Systematic evaluation and reprioritisation of resources also have a significant role to play in embedding a culture of efficiency. The Spending Review, which is in the second year of a three-year process, is a valuable tool in moving towards this goal. The objectives and progress of Spending Review 2018 are discussed in greater detail in Chapter 3. Setting sustainable levels of structural expenditure growth As already outlined in this chapter, increases in expenditure post-consolidation have been more modest than those seen in the pre-crisis period. Adopting growth levels applicable to the EB position under the EU fiscal rules has helped to ensure that spending growth has been

Mid-Year Expenditure Report | July 2018 Page | 34
limited in this period while guiding the structural deficit towards the Medium Term Budgetary Objective.
However, given the likely current cyclical position of the Irish economy against the backdrop of sustained high growth and with the labour market approaching estimates of full
employment, overheating risks could be exacerbated if expenditure growth was allowed to continue to grow in line with the EB rule. While the EB is designed to ensure that spending
growth is limited to the potential growth rate of the economy, the evidence is that it can produce pro-cyclical outcomes. For example, the EB, if it had been in place, would have
suggested growth rates in expenditure of c. 10 per cent in the period 2003 to 20056, as illustrated below. Furthermore, EB calculations are based on estimates that fluctuate from
one year to the next that create difficulties in planning medium term expenditure levels.
Figure 2.16: Real-time Reference Rates vs. Actual Fiscal Growth
Source: Bedogni and Meaney (2017)
Consequently, it may be preferable to consider an alternative expenditure strategy which
would diminish the risk of the emergence of unsustainable expenditure trends and act as a more stable and predictable anchor for the evolution of expenditure policy. Ideally, year-on-
year increases in expenditure growth should be set at a level that broadly tracks the long-term trend in economic growth in Ireland. Applying this strategy to medium term expenditure
planning would help to mitigate against the risk of pro-cyclicality in the coming years and, hence, would also be consistent with the principles underpinning the EB rule.
As outlined in section 2.1 above, while looking back over a twenty year period revenue growth
has broadly tracked growth in the economy as measured by GNI*, there is a clear gap between revenue growth and GDP growth. Consequently, linking expenditure growth to potential GDP
growth may not meet the objective of matching expenditure growth with stable and
6 Bedogni, J and Meaney, K (2017) ‘EU Fiscal Rules and International Expenditure Rules’ Dublin: Irish
Government Economic and Evaluation Service

Mid-Year Expenditure Report | July 2018 Page | 35
predictable tax revenues. Indeed, as discussed earlier in this chapter, annual growth in GNI* has tracked growth in tax and PRSI revenues more precisely than the growth in GDP.
In light of this, it is important to give careful consideration to the appropriate approach to planning for expenditure increases into the future that facilitates planning for medium and
long term developments in public services and infrastructure underpinned by stable and predictable tax revenues. The pattern of unsustainable growth funded by high levels of
economic and tax growth, followed by a period of significant expenditure reductions must not be repeated.

Mid-Year Expenditure Report | July 2018 Page | 36
Chapter 3 Spending Review 2018
3.1 Introduction
The State has a key role in developing processes which are designed to safeguard the future prosperity and health of its citizens. This has been the driving force behind recent reforms to improve how public sector business is carried out. This is particularly key in how we allocate
funding, to ensure that each Government programme is delivering on its objectives and ensuring the best possible outcomes for the money spent.
This current rolling three-year Spending Review, announced on Budget day 2016 by the
Minister for Finance and Public Expenditure & Reform, is another key process designed to improve how Government spending is allocated and maintained. This process builds on the
significant expenditure reforms over the past number of years, such as: the establishment of IGEES, which directly recruits evaluators and economists and
assigns them throughout the public service; the Public Spending Code (PSC), which details the rules regarding the appraisal of new
proposed capital and current expenditure programmes; the Value for Money Review (VFMR) process, which requires spending Departments
to produce a number of extensive reviews on the efficiency and effectiveness of programmes; and
the Medium-Term Expenditure Framework (MTEF), which embeds the domestic and EU fiscal rules into the medium-term planning of expenditure allocations.
These processes, along with the current Spending Review, all seek to embed an evaluation
mentality within the public service, with the goal of avoiding reactionary budgets and large annual shifts in expenditure. It is important to ensure that budgetary allocations are
prioritised for policies that have a strong evidence base in gaining the best positive outcomes for the citizens of Ireland.
The specific purpose of the Spending Review, within the wider reforms, is to shift the
emphasis away from the year-on-year incremental increases in spending, through the examination of baseline Government expenditure. The Spending Review seeks to maximise the impact of Government spending by reprioritising spending from programmes with poorer outcomes to those with better outcomes. This creates a clear link between the programme evaluations carried out across the public sector and the budgetary process. The current process, with its focus on reprioritisation, differs substantially from previous reviews which were conducted following the Global Financial Crisis and sought to reduce the overall levels of spending. For more detail on prior reviews and the revised approach for the
current review cycle see Kennedy and Howlin (2017)7. The current review examines whether the money that is already being spent could be more efficiently and effectively allocated. This
7 Kennedy, F. and J. Howlin (2017), Spending reviews in Ireland – Learning from experience, OECD Journal on
Budgeting, vol. 16/2, https://doi.org/10.1787/budget-16-5jg30cchf0g0.

Mid-Year Expenditure Report | July 2018 Page | 37
should also provide Ministers with greater scope to deliver new services as more resources could become available through the reprioritisation of existing funds.
The nature of engagement between the Department of Public Expenditure and Reform (DPER) and spending Departments has been reformed as part of the current Spending Review
process. In seeking to embed an evaluation culture and an evidenced-based approach to policy development, the Spending Review process has targeted a greater level of involvement
by spending Departments. In the papers published alongside this Report, there are a significant number of high quality analyses authored by officials in spending Departments
which investigate the efficiency and effectiveness of existing programmes. In addition, this year has seen a greater number of papers co-authored or co-steered between officials in
spending Departments and their corresponding officials in DPER (discussed further in section 3.3). This represents a shift in the engagement between Departments and it is hoped that this
will lead to clearer and more aligned engagements during the budgetary process.
Finally, the Spending Review both contributes towards and utilises the current public service reform programme, Our Public Service 20208. Across the three pillars of the reform plan, namely ‘delivering for our public’; ‘innovating for our future’; and ‘developing our people and organisations’, this current Spending Review process addresses the key themes of efficiency and effectiveness, data, collaboration, evidence & evaluation, workforce planning and culture & values. The Spending Review provides an opportunity for evaluators across the public services to utilise their skills to affect policy and improve programme outcomes.
3.2 Objectives of the Spending Review
The 2017 SES outlined the approach taken to carrying out the Spending Review 2017-2019.
The purpose of carrying out a review of spending is to shift the emphasis away from the incremental nature of the annual Estimates process, with the focus instead on assessing the
effectiveness of the totality of existing programmes. This review differs from the 'comprehensive' reviews of expenditures carried out post-crisis, with the introduction of a
'rolling' system of selective reviews. The objective is that a substantial majority of current expenditure will be examined over the three year period from 2017 to 2019.
In recent years, Ireland’s strong economic performance has been reflected in robust revenue
growth. On the back of this, public and stakeholder expectations for increases in public spending have grown and budgetary discussions have tended to focus on the additionality of
funds available for future years. However, it is reasonable to expect that some element of strong revenue growth reflects a cyclical upswing in economic activity, while only a portion
reflects underlying structural growth. For this reason, the key public expenditure goal over the medium-term is to budget for sustainable expenditure growth that can be retained throughout the economic cycle. The purpose of the Spending Review is to ensure that
expenditure decisions, to meet Government objectives, also include consideration of existing spending programmes. This will allow Ministers the scope to deliver new and improved
8 Available at: https://ops2020.gov.ie/resources/Our-Public-Service-2020-WEB.pdf

Mid-Year Expenditure Report | July 2018 Page | 38
services not exclusively through new resources allocated in the Estimates process but also through the reprioritisation of existing funding.
The reprioritisation of expenditure should be driven by an evidenced based approach, which takes into account evaluations of the efficiency and effectiveness of outcomes delivered by
existing programmes. One of the key objectives for this review is to embed this ongoing evaluation culture across the Public Service, with analytical reviews of pre-selected
programme areas. The rolling three-year nature of the current Spending Review will allow for the build-up of expertise and awareness of the process and allow analysts to revisit key topics
if issues are emerging.
For the Spending Review in 2018, a further aim is to encourage greater input of policy Departments into the Spending Review and to enhance the role for IGEES staff throughout
the Civil Service. The intention is that this work will then promote the use of an analytical approach to evaluating expenditure and should provide the Government with a stronger
evidence based approach to allocating resources in the Budget. The changed context, and lessons from past reviews, led to a re-design of the Spending Review process. This new Spending Review process is designed to further embed the principles of expenditure efficiency and effectiveness into the wider budget process through:
(i) creating a larger stock of relevant analysis and evaluation across all Departments and Offices;
(ii) identifying areas of existing expenditure that require ongoing analysis if issues are emerging; and
(iii) ensuring that this analysis feeds into the Estimates process.
It is important that expenditure decisions are backed by strong evidence that spending will be worthwhile. A strong public financial position is necessary to support sustainable economic growth and to make improvements in the living conditions of citizens. The Spending Review is a tool that can allow us promote the allocation of Government resources in the most efficient and effective way to achieve these aims.
3.3 Conduct of the Spending Review
The Spending Review will assist in preparations for Budget 2019 by providing evaluations of existing expenditure and recent trends. By continually expanding the evidence base and
evaluation learnings from papers, the Spending Review process also enables longer-term improvements in how policy is developed and how expenditure is targeted. The analysis
undertaken as part of the Spending Review process focuses on improvements to the efficiency and effectiveness of programmes and assists Government in maximising the
benefits for the citizens of Ireland.
The Spending Review process operates within the wider budgetary architecture and the
MTEF, which supports sustainable expenditure policy anchored to the domestic and European

Mid-Year Expenditure Report | July 2018 Page | 39
Union fiscal rules. This framework is designed to allow expenditure to grow in a responsible and sustainable manner, in that expenditure growth is aligned to the economy’s underlying revenue-generating capacity. This should mitigate the need to undergo sharp reductions in
spending in the event of an economic downturn.
The 2018 Spending Review is the second round in a series of rolling, selective reviews that will examine all significant day-to-day spending by 2019. Specific topics for review were selected
in advance for this round, mostly agreed between the policy Departments and DPER, allowing for a more focussed and detailed examination of specific schemes and programmes over a
reasonably compact timeframe. The Spending Review process was once again run by a high-level steering group consisting of Department of Public Expenditure and Reform staff.
As detailed in the Mid-Year Expenditure Report in 2017, there was an intention ‘to build on
the initial progress made last year over the remaining two years of this Review cycle to widen the involvement of Departments and other public service bodies and offices’9. Departments
and agencies have worked closely with the DPER officials to deliver rigorous, evidence informed analysis. Publishing this will inform public discussion, strengthen accountability and assist policymakers in delivering the best possible value from programmes of expenditure. DPER seeks to continually improve the Spending Review process, and this year some changes were made with a view to maximising the opportunities for other Departments, agencies and offices to participate in the process. Among the changes made were: Timing: The process this year began earlier than in 2017 and previous reviews, with Departments asked to set aside staff to partake in the Spending Review. The objective to increase the participation of analysts in policy Departments this year meant that it was necessary to start the review earlier to ensure that the Spending Review was included as part of ongoing business plans. Collaboration: The process promoted the use of collaborative working, between DPER and Departments, in producing analytical papers. This increased the involvement of Departments in producing evidence at an earlier stage and allowed for a common analytical base for budget
negotiations to be agreed.
Incentives: The Spending Review process initially had a necessary focus on control and reduction of expenditure. With improving economic conditions, there has been an opportunity to shift focus to delivering value and maximising the benefit of public expenditure. The Spending Review now has a focus on highlighting where there may be potential for Departments to change the targeting of expenditure within their areas of responsibility, increasing their ability to deliver; rather than curtailing funding. As a result, policy specialists working in Departments and agencies now see a clear benefit to participation in the review process. The lessons from the research conducted as part of the 2017 and 2018 Spending Reviews will contribute to the conduct of the 2019 Spending Review. It is planned that the reformed
9 Available at: https://www.per.gov.ie/wp-content/uploads/Mid-Year-Expenditure-Report.pdf

Mid-Year Expenditure Report | July 2018 Page | 40
Review process will be subject to annual review but will be formally evaluated after the completion of the first three year cycle, 2017 to 2019.
Objectives and design of policy papers
To ensure a consistency of approach across the individual papers, each paper is expected to address at least one of the following key evaluation criteria which have informed Value-for-
Money (VfM) evaluations:
whether the objective of the programme remains a priority for government; the sustainability of spending trends in terms of the key drivers of expenditure;
the efficiency of the spending (i.e. the relationship between the outputs and inputs); and
the effectiveness of spending (i.e. the outcomes achieved from the spending).
The Spending Review papers differ from VfM reviews in that the goal is to specifically identify how funds could be reprioritised into more impactful areas. However, it is important to acknowledge the number of different spending programmes reviewed, the complexity of the public policy objectives to which these spending programmes relate and the changes in the broader environment which impact on the delivery. For this reason, the analytical approach taken in the papers is not applied on a ‘one-size-fits-all’ basis. The depth and detail of the analyses carried out are very much dependent on the stock of existing analysis already carried out on the area, the data availability of programmes and whether staff resources were available. A key resource in overcoming challenges of reviewing programmes, and in insuring a high-quality standard of output, was the enhanced role of IGEES in this year’s review.
The role of IGEES in the Spending Review
IGEES is an integrated, cross-Government service that aims to support better policy
formulation and implementation in the civil service through economic analysis and
evaluation. It was established in 2012, and as set out in its Medium Term Strategy out to 2019,
the focus is on an increased level of high quality IGEES output to impact on the policy analysis
process and inform the policy debate.
The service is not standalone but rather IGEES staff are part of each Department adding their
skill set to the varied expertise working on policy analysis and formulation as directed by
Departmental business plans. By operating as a cross Government service, IGEES supports
and builds economic and evaluation capacity and consistency across the civil service. IGEES
staff in Departments prepare analysis as part of the Spending Review and to inform the annual
budgetary process as directed by their Departmental business plans. In seeking to reinforce a
more structured and systematic means of analysing spending in the 2019 Spending Review, it
would be envisaged that a greater involvement of IGEES units, both in DPER and in

Mid-Year Expenditure Report | July 2018 Page | 41
Departments, will play a key role. The IGEES programme of work is clearly wider than this
review but IGEES has, and will continue to have, a key role in the Spending Review process.10
In addition to producing analysis, IGEES has hosted a Spending Review Conference for the
past two years. The purpose of the conference is to provide an opportunity for all
Departments to come together to discuss the analysis being conducted to inform the
Spending Review. This supports a wider capacity building in analysis and evidence in the Civil
Service, and complements the objective of promoting greater engagement with the Spending Review amongst all Departments. It provides a forum for analysts to talk about the challenges
in conducting analysis, potential solutions, and how analysis can inform policy choices.
3.4 Outcomes of the Spending Review 2017
Last year’s Spending Review culminated in the publication of 23 analytical papers, most alongside the Mid-Year Expenditure Report in July, with the remainder following the
completion of Budget 2018 in October. Some significant outcomes resulted from this review, particularly when focusing on the three main objectives:
(i) to create a larger stock of relevant analysis and evaluation across all Departments
and Offices; (ii) to identify areas of existing expenditure that require ongoing analysis if issues are
emerging; and (ii) to ensure that this analysis is more firmly embedded in the budgetary process.
Firstly, a significant number of analytical papers were produced, with the direct involvement
of five Departmental vote groups that were involved in the oversight and/or drafting of analysis for Spending Review topics. As detailed in the Mid-Year Expenditure Report 2017, the
objective for 2018 was to increase this number. Secondly, some key issues for the control of expenditure have been identified through the Spending Review in 2017 which will be revisited this year, particularly in the areas of education, social housing, the public service obligation for transport companies and the Garda pay bill. In addition, a key theme identified was the need for greater data and data provision. While this remains to be a key theme in 2018, the level of collaboration between Departments with regard to data sharing has improved in 2018. The hope would be to enhance this once more in 2019. Finally, the analysis from last year’s review provided a strong evidence base for estimates discussions across many sectors. In particular, analysis in the Spending Review 2017 highlighted the reduced demand for employment supports in the employment affairs and social protection sector. During the estimates discussions, it was agreed between the policy
10 The IGEES Work Programme for 2018 can be found on the IGEES website at: https://igees.gov.ie/publications/igees-corporate-programme/. It sets out the work being conducted within each Department in 2018 and highlights cross Departmental collaboration on analysis to inform policy.

Mid-Year Expenditure Report | July 2018 Page | 42
Department and DPER that substantial savings from this area of expenditure could be reprioritised towards increasing the social welfare rates as announced on Budget day. The analysis was also useful in providing a key evidence base in agreeing the base existing level of
service estimates prior to the estimates process.
3.5 Key Findings of the Spending Review 2018
This year a number of key themes emerged from the analysis that cut across different sectors. It has been possible to consolidate the papers and the recommendations of the analysis into
6 key themes: 1. Staffing and Workforce Planning;
2. Labour Market Supports; 3. Key Sectoral Expenditure Drivers; 4. Current Spending on Infrastructure;
5. Efficiency Reviews; and 6. Data Shortfalls.
The following sections will detail some of the key findings and recommendations that have
emerged from the analytical papers.
Staffing and workforce planning
Staffing and Workforce planning has emerged as a key theme of this year’s Spending Review.
As the Irish economy recovers and demand for public services increase, it is important for Departments to take stock of their staffing and pay bill trends to guide future workforce
projections and planning. Strategic workforce planning will allow for an improvement in how
services are delivered by ensuring that public service staffing is allocated in a manner that
achieves the greatest outcome for citizens. As a scene setter, DPER has produced an overall
Public Service Pay Bill Management paper which assesses the recent trends in public sector numbers and discusses policy levers for its sustainable management over time. The paper
highlights how for a structured approach to fiscal planning, competitive rates of pay for public
servants and embedded strategic workforce planning across the public service can support
sustainable management of the pay bill.
On a sectoral basis, a series of papers track trends in staffing across the biggest sectors of
Government. Papers such as the HSE Staff Trend Analysis 2014-2017 and a Review of
Overtime Expenditure in An Garda Síochána assess the rising trends in staffing and pay costs
in the Health and Justice sectors respectively. Both papers provide recommendations on
improving governance structures within their relevant sectors to mitigate the risk of future pay overruns. In addition, two papers analysing the key drivers of spending in Education
(discussed in key sectoral drivers section), across the primary, secondary and tertiary sectors,
also analyse trends in overall staffing levels. The papers analyse the current ratio of pupils to
teachers at first and second level, the workforce planning challenges of managing peaks in

Mid-Year Expenditure Report | July 2018 Page | 43
student numbers passing from primary education in 2018 to secondary education in 2024 and
the implication of demographic pressures for higher education.
Further papers tackle the issue of reforming workforce composition through workforce
planning. A paper on Police Civilianisation: Lessons from International Best Practice was
produced as part of the Spending Review. The paper provides a peer country comparison of
the levels of civilianisation within different police forces and makes recommendations for
increasing the share of civilians within An Garda Síochána. In addition to this, a paper looking
at efficiency improvements due to ICT spending in the Revenue Commissioners (discussed in
efficiency reviews section) also looks at the implications of automation on workforce
planning.
Labour market supports
Papers analysing the levels of supports within the labour market, and the implications for those unemployed, emerged as common features of this year’s Spending Review. Three papers look at the range of supports provided to private enterprises to encourage investment, research and development and employment growth. A paper on Enterprise Supports and the Labour Market provides an overview of how supports are targeted across regions and sectors, while a separate paper provides a more detailed breakdown of the composition of IDA grants. A further detailed policy assessment by the Department of Business, Enterprise and Innovation on direct supports to start-ups and entrepreneurship finds that client companies have enjoyed greater levels of growth in recent years, while the paper also recommends that future evaluations be carried out in this area.
The barriers to movement between unemployment and employment were also assessed across three papers. Firstly, a Replacement Rates paper investigated the possible financial
disincentives to move from unemployment into employment by comparing out-of-work income to in-work income. The paper found that a low percentage of households faced
significant financial disincentives, but certain larger family types or single parent families with housing supports may face greater disincentives to take up employment. A further paper
looked at the range of in-work income supports for those on low income which are intended to remove work disincentives. The paper finds that those on lower income are more reliant
on public income supports and that these supports reduce overall inequality. However, the paper also finds that eligibility for income supports can vary substantially depending on the
scheme and it is difficult to conclude what defines low income as a result. Finally, a paper on Public Employment Services analyses all the providers and resources dedicating to activation
of the unemployed. The paper details the growth in the provision of activation services since the crisis and investigates how these resources could be more efficiently monitored and allocated where Ireland is approaching full employment.
Key sectoral expenditure drivers
Assessments of key expenditure drivers has remained a theme this year, with papers focussing on recent trends in expenditure and the underlying drivers, while also looking at
the potential sustainability of future costs. Examples of such reviews this year are the two papers on the Education sector, looking at the funding needs of the primary and post-primary sectors and separately, understanding the funding requirements of the third level sector. The

Mid-Year Expenditure Report | July 2018 Page | 44
Higher Education paper explores student-to-staff ratio as a proxy for quality and in particular the limitations of using such a ratio as the basis for determining funding requirements in the sector.
In addition, a paper analysing the spending on older people services in the Department of Health assesses the range of options available for older people to remain at home while
receiving vital healthcare, and the recent trends in take-up of these schemes. The Department of Justice also looked at the costs of the Criminal Legal Aid Scheme and the current operation
of the scheme. The paper details the future reforms and legislation planned for this scheme.
An assessment of the current and potential future costs of pensions is also explored. A broader DPER paper looks at future cash-flow projections for pensions across the public
sector out to 2055. This paper details the medium term cash-flow implications for current public servants reaching pensionable age, scenarios accounting for increased public wages
and numbers, and the long-term effects of pension reform initiatives such as the new Single Pension Scheme.
Current spending in infrastructure
One theme to have emerged across the review focuses on grants for infrastructure and
alternatives to capital spending. As the Irish economy continues to grow, questions about possible overheating in certain sectors and for the economy overall have emerged. It is a key
concern for Government to ensure that the levels of investment planned currently will be sustainable in the longer-term and will be retained throughout the business cycle. As such, in
addition to the extensive work carried out in the NDP11, the Spending Review in 2018 has assessed in detail some of the key current expenditure allocated as alternatives to capital
investment. This includes investment in various infrastructural grants, along with areas where renting or leasing is being provided instead of capital investment. In a continuation from last year, the split between current and capital spending on social housing is examined jointly by DPER and the Department of Housing, Planning and Local Government. The paper finds that in areas where general housing prices are higher, the net present cost of current delivery mechanisms is also higher. Therefore leasing/renting would be considered the best option in some parts of the country, while building would be better in other locations. Within the context of policy objectives and wider issues, this should be an important consideration in determining the appropriate mix of current and capital delivery mechanisms for social housing. Naturally, the Department of Transport, Tourism and Sport (D/TTS) features under this theme, as a paper examined the Public Services Obligation expenditure on public transport to forecast the next steps to take in the delivery and evaluation of efficiency of public transport in Ireland. In addition, the 2017 applicants to the Sports Capital Programme are also
subject to a preview for a future Value for Money review, gathering baseline data on the programme and setting out how to assess its impact. Looking at accommodation for public
servants, the State Rents of the Office for Public Works was assessed. The paper recommended that policies should be developed to assess whether it was more appropriate
to rent or buy state property to ensure the greatest value for money and efficiency of 11 Available at: https://www.per.gov.ie/en/national -development-plan-2018-2027/
Mid-Year Expenditure Report | July 2018 Page | 45
spending. Finally, the Department of Culture, Heritage and the Gaeltacht assessed the subsidised ferry services to the islands. The review concludes that there is a continued need for the State to provide these services to ensure the continued viability of the communities
on these islands, but there is also a need to update the policy context for these services, supported by an enhanced evidence base around community needs and a performance
management framework.
Efficiency reviews
Reviews of efficiency are core to the work of the Spending Review. Hospital productivity is one of the key Health papers, as an Analysis of Hospital Inputs and Outputs 2014-2017 looks to provide an overview of key inputs (expenditure, pay and staffing resources) and outputs (activity levels, waiting lists) and examines the trends and issues relating to Hospital Budget management over recent years. Similarly, an analysis of Efficiency and Digitalisation within
the Office of the Revenue Commissioners was conducted. This paper takes a detailed view of the successful effort to digitalise the mechanisms of Revenue, analysing inputs data, outputs
(change in people, forms filed online) and outcomes (customer survey outcomes, employees delivering higher level services, better compliance/refunds, timing, savings on postage), with
a view to establishing the level of efficiency achieved by the digitalisation.
Finally, a Department of Public Expenditure and Reform paper looks at a comparison of public expenditure efficiency against peer Euro-Area countries, which is broken down by sector.
Broadly, this means comparing the key input for the sectors (public expenditure in the sector) compared against the outcomes of the sector (healthy life-years and non-communicable diseases for Health, PISA scores and participation rates for Educations and Poverty statistics for Social Protection), and assessing how far Ireland is from frontier countries. The paper also adjusts for the differing economic output metrics that can be used (GDP, GNI and GNI*) and also accounts for the differing age structures across the Euro-Area.
Data shortfalls
One of the more common themes across the areas examined in this year’s Review was in
relation to a general deficit in terms of relevant data for analysis. Spending Review papers have highlighted the need for relevant, quality data to be readily available in order to support
evaluation. In many cases, papers have highlighted where data gaps exist and can make recommendations that would improve data availability for future evaluations. The need for
more data is not unique to this cycle, as it was also a key theme last year.
However, in moving ahead with the Spending Review, it is intended that the rolling nature of
the process will act to review and highlight data requirements on an ongoing basis to underpin more precise evaluation. The focussed nature of the Spending Review papers means that data
gaps have been identified and there is now an opportunity to address these specific data requirements directly. The reforms that have already taken place through public service
reform initiatives and the Government ICT strategy have improved data linkages and availability. There is a continued commitment to improving the transparency and efficiency
of Government data, through the Open Data 2017-202212 initiative and the current public
12 Available at: https://www.per.gov.ie/wp-content/uploads/Draft-Open-Data-Strategy-2017-2022.pdf
Mid-Year Expenditure Report | July 2018 Page | 46
service reform initiative, Our Public Service 2020. It is envisaged that this year’s Spending Review and future cycles of the Spending Review will assist in progressing data availability that are key for evidence-based policy development.
3.6 Conclusion
The Spending Review has a key role in promoting and embedding an evaluation culture throughout the Public Service. In asking Departments to analyse the totality of existing spending for efficiency and effectiveness, it is possible to improve policy outcomes for citizens using an evidenced-based approach. This will also improve the budgetary process through
reducing the focus on year-to-year incremental expenditure and providing additional scope for new measures through the reprioritisation of existing spending. The Spending Review is firmly linked to the positive budgetary and operational reforms that are improving how the business of Government is carried out. The Spending Review utilises the skills of the professional economists and evaluators across the IGEES network, and provides a platform for these professionals to showcase the benefits of evidenced-based policy development. The outputs of the Spending Review in 2018 are also closely aligned with the current public service reform programme, Our Public Service 2020. In particular, the Spending Review and the overarching themes emerging from the analysis this year dovetail with some of the key reform initiatives, particularly regarding:
1. workforce planning; 2. efficiency and effectiveness; 3. data; 4. collaboration; 5. evidence & evaluation; and
6. culture & values.
It would be envisaged that the Spending Review process and the recommendations highlighted within the papers this year can provide lessons for how the initiatives above could
be introduced at an operational level within the Public Service.
Finally, the analysis produced as part of the Spending Review 2018 will be drawn on as part of the forthcoming Estimates process and will guide the selection of topics for the third cycle
of the Spending Review in 2019.

Mid-Year Expenditure Report | July 2018 Page | 47
Mid-Year Expenditure Report | July 2018 Page | 1