mena regional water outlook desalination using csp
TRANSCRIPT

DME S-002-2011 - Lecture 13
MENA Regional Water Outlook Desalination Using CSP
Massimo Moser, DLR
DME - SeminarDesalination and Renewable Energies
May 4th – 5th, 2011Berlin, Germany
13- 2
DME S-002-2011 – Lecture 13MENA Regional Water OutlookDesalination Using CSP
MENA Regional Water Outlook
Project supported by the World Bank
In collaboration with Governments in the MENA Countries
Objective: review of desalination potential in combination with renewable energies (CSP in particular) in the region as alternative water supply

13- 3
DME S-002-2011 – Lecture 13MENA Regional Water OutlookDesalination Using CSP
Presentation overview
1. Applied Methodology
2. Typical CSP and Desalination Plants
3. CSP Potential Assessment
4. The Scope of CSP in the MENA Region• Electricity Supply Scenario• Water Supply Scenario
13- 4
DME S-002-2011 – Lecture 13MENA Regional Water OutlookDesalination Using CSP
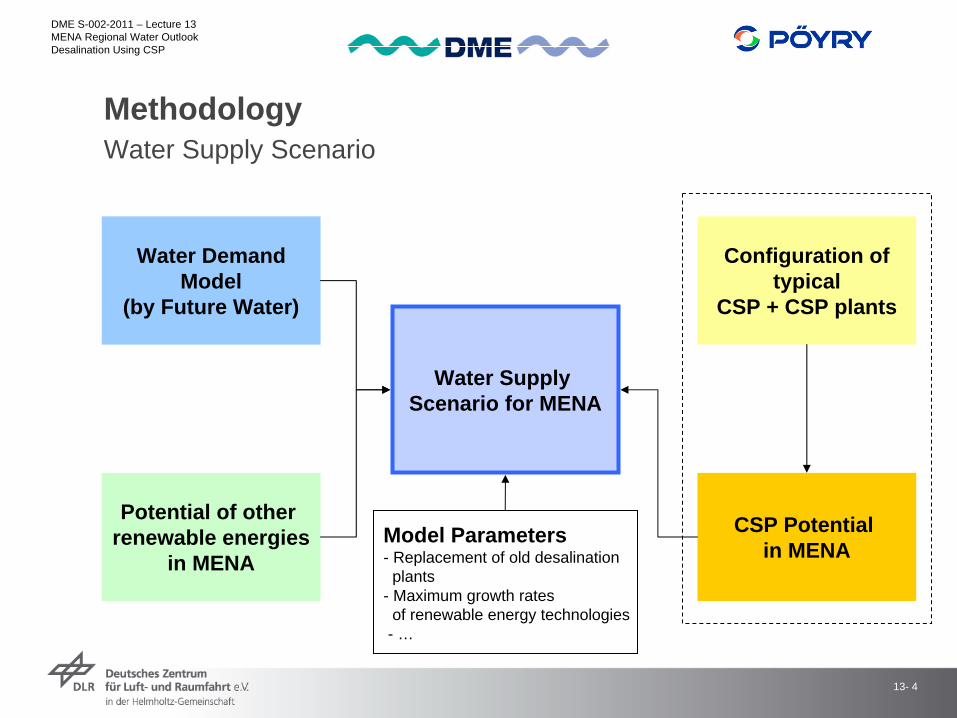
Methodology Water Supply Scenario
CSP Potential in MENA
Water Supply Scenario for MENA
Configuration oftypical
CSP + CSP plants
Model Parameters- Replacement of old desalination
plants- Maximum growth rates
of renewable energy technologies- …
Potential of other renewable energies
in MENA
Water DemandModel
(by Future Water)

13- 5
DME S-002-2011 – Lecture 13MENA Regional Water OutlookDesalination Using CSP
CSP Technology Overview
www.dlr.de/desertec
13- 6
DME S-002-2011 – Lecture 13MENA Regional Water OutlookDesalination Using CSP
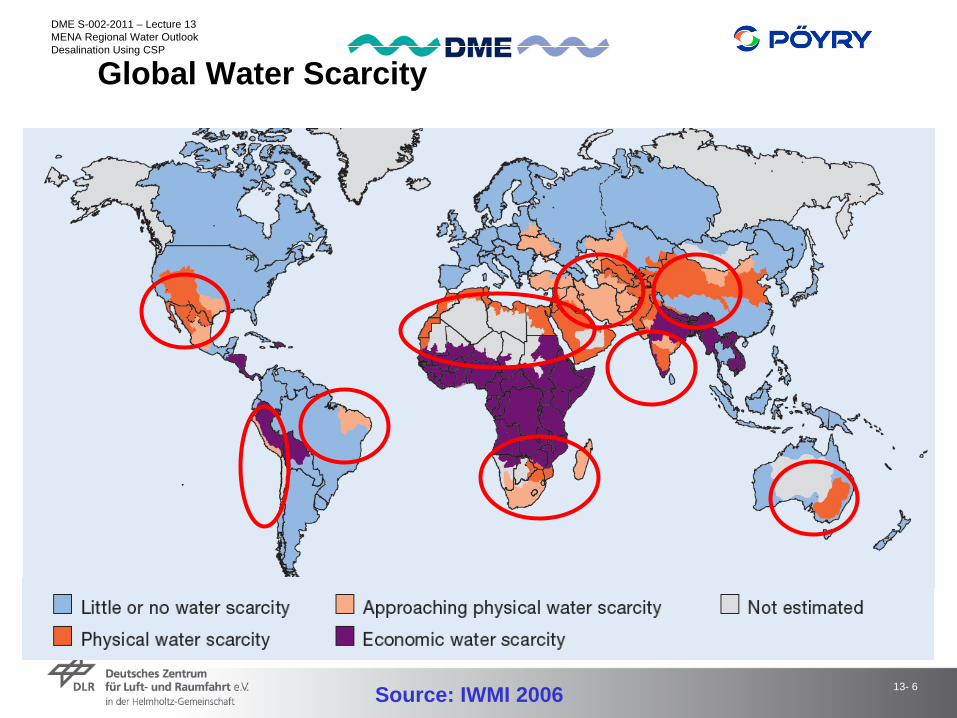
Source: IWMI 2006
Global Water Scarcity
13- 7
DME S-002-2011 – Lecture 13MENA Regional Water OutlookDesalination Using CSP
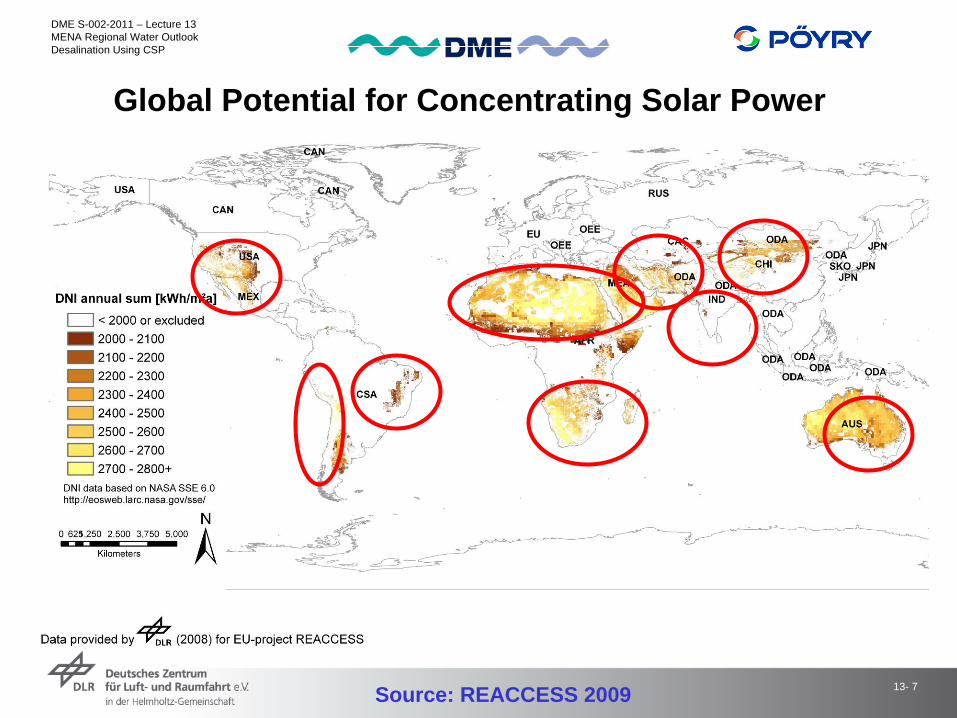
Global Potential for Concentrating Solar Power
Source: REACCESS 2009

13- 8
DME S-002-2011 – Lecture 13MENA Regional Water OutlookDesalination Using CSP
Renewable energies for desalination: why CSP?
Wind Power Photovoltaic CSP
Desalination plants require continuous operation
This conflicts with the intermittent nature of renewable energies
Storage of electricity is expensive
CSP offers the option of thermal energy storage
Hybrid operation is possible in the same power block (no “shadow power plant” required)
13- 9
DME S-002-2011 – Lecture 13MENA Regional Water OutlookDesalination Using CSP
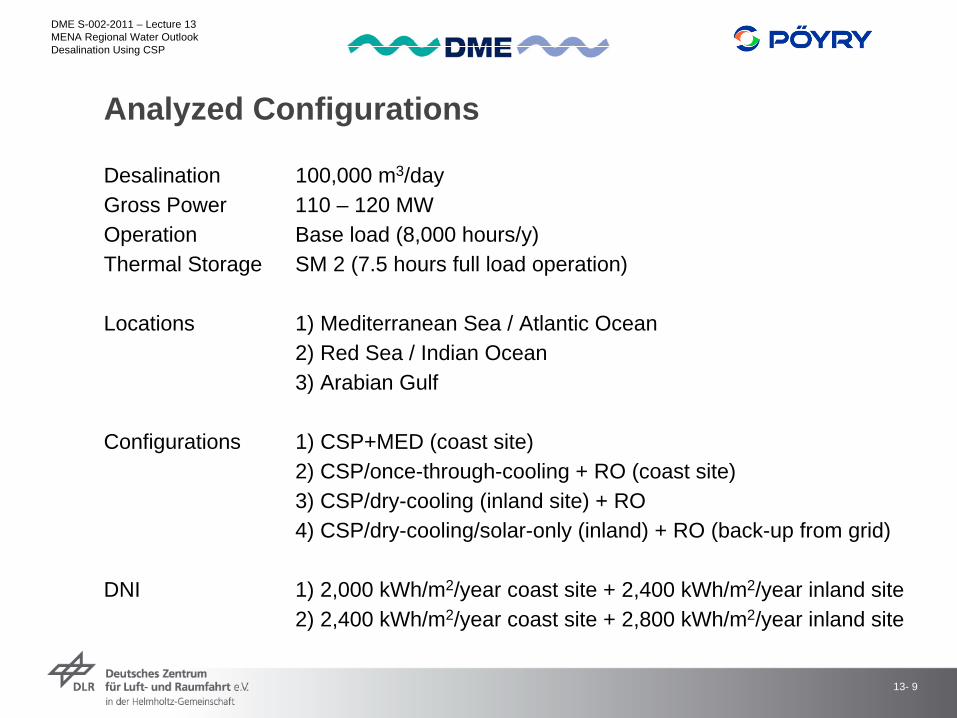
Analyzed Configurations
Desalination 100,000 m3/dayGross Power 110 – 120 MWOperation Base load (8,000 hours/y)Thermal Storage SM 2 (7.5 hours full load operation)
Locations 1) Mediterranean Sea / Atlantic Ocean2) Red Sea / Indian Ocean3) Arabian Gulf
Configurations 1) CSP+MED (coast site)2) CSP/once-through-cooling + RO (coast site)3) CSP/dry-cooling (inland site) + RO4) CSP/dry-cooling/solar-only (inland) + RO (back-up from grid)
DNI 1) 2,000 kWh/m2/year coast site + 2,400 kWh/m2/year inland site 2) 2,400 kWh/m2/year coast site + 2,800 kWh/m2/year inland site

13- 10
DME S-002-2011 – Lecture 13MENA Regional Water OutlookDesalination Using CSP
CSP - MED
Pre-treatment
MED
G
1
Sea
2 3 4 14
73 °C0,35 bar
377 °C16,5 bar
377 °C100 bar
Water intake
Brine discharge
13- 11
DME S-002-2011 – Lecture 13MENA Regional Water OutlookDesalination Using CSP
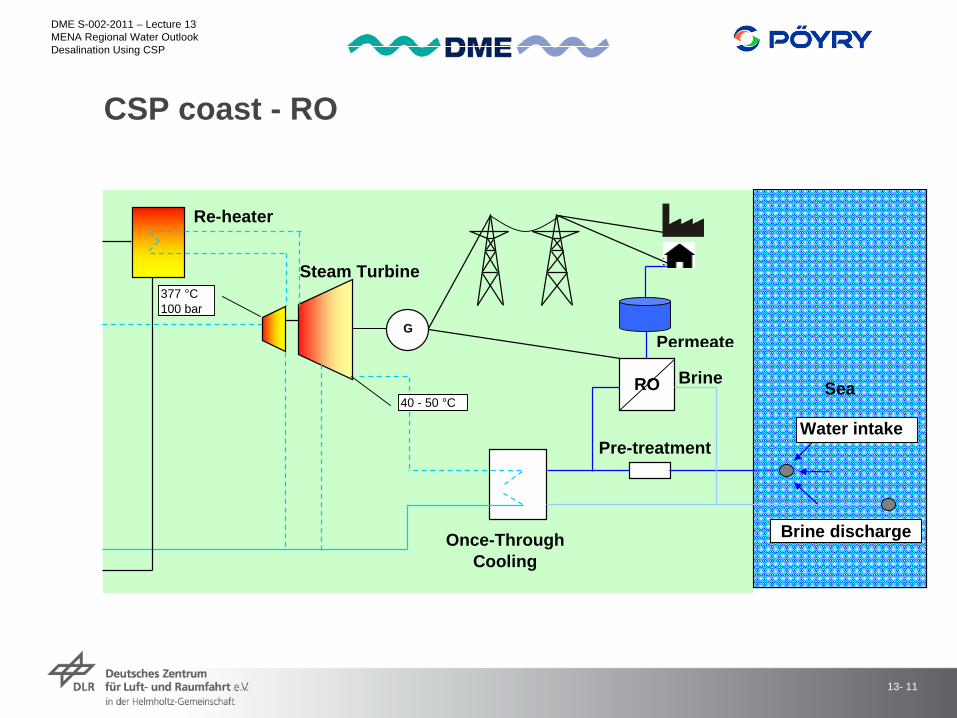
CSP coast - RO
Re-heater
Steam Turbine
Permeate
Brine
Pre-treatment
Once-ThroughCooling
G
SeaRO
Water intake
Brine discharge
377 °C100 bar
40 - 50 °C

13- 12
DME S-002-2011 – Lecture 13MENA Regional Water OutlookDesalination Using CSP
Investment Cost
CSP/MED CSP/once-through-cooling/RO
= 651.8 Mio. €
= 672.5 Mio. €

13- 13
DME S-002-2011 – Lecture 13MENA Regional Water OutlookDesalination Using CSP
40%
50%
60%
70%
80%
90%
100%
110%
120%
TurbineEfficiency
Internal El.Consumption
Required LandArea
LEC
MED/CSPRO/CSP + Once-Through CoolingRO/CSP + Dry CoolingRO/CSP + Dry Cool. + Solar Only
Comparison of Configurations
Assumptions: Location: Arabian Gulf; DNI: 2,400 kWh/m2/y; Fuel: HFO

13- 14
DME S-002-2011 – Lecture 13MENA Regional Water OutlookDesalination Using CSP
CSP Potential in MENA Methodology:
I. Solar Resource Assessment II. Land Resource Assessment
III. CSP Potential IV. Statistical EvaluationTechnical CSP Potential in MENA - Case Total
0
10000
20000
30000
40000
50000
60000
70000
80000
1800 1900 2000 2100 2200 2300 2400 2500 2600 2700 2800 2900 3000
DNI [kWh/m²/y]
Elec
trici
ty P
oten
tial [
TWh/
y]

13- 15
DME S-002-2011 – Lecture 13MENA Regional Water OutlookDesalination Using CSP
CSP Potential in MENA Land Resource Assessment:
13- 16
DME S-002-2011 – Lecture 13MENA Regional Water OutlookDesalination Using CSP
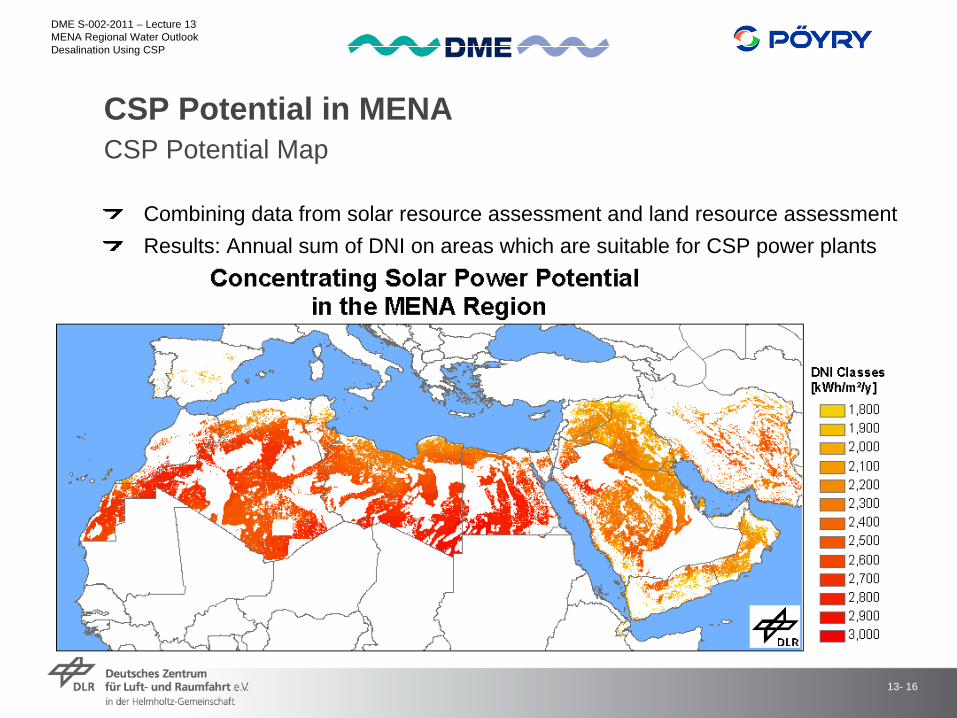
CSP Potential in MENA CSP Potential Map
Combining data from solar resource assessment and land resource assessmentResults: Annual sum of DNI on areas which are suitable for CSP power plants

13- 17
DME S-002-2011 – Lecture 13MENA Regional Water OutlookDesalination Using CSP
CSP Potential in MENA Input for Electricity and Water Supply Scenarios
CSP potential for electricity generation of each MENA country
Technical Potential [TWh/y]
Economical Potential [TWh/y]
Technical Potential [TWh/y]
Economical Potential [TWh/y]
[DNI > 1800 kWh/m²/y] [DNI > 2000 kWh/m²/y] [DNI > 1800 kWh/m²/y] [DNI > 2000 kWh/m²/y]Algeria 135823 135771 0.3 0Bahrain 16 16 9 9Djibouti* 372 300 0 0Egypt 57143 57140 74 74Gaza Strip & Westbanks 8 8 0 0Iran* 32597 32134 267 267Iraq 27719 24657 0 0Israel 151 151 2 2Jordan 5885 5884 0 0Kuwait 1372 1372 18 18Lebanon 5 5 0 0Libya 82727 82714 135 132Malta 0 0 0 0Morocco 8463 8428 15 15Oman 15460 14174 84 84Qatar 696 555 56 43Saudi Arabia 76318 75832 152 152Syria 9616 8449 1 1Tunisia 5762 5673 58 49United Arab Emirates 493 447 15 15Yemen 11432 8486 108 104Total 472057 462196 995 964
Total Coast
13- 18
DME S-002-2011 – Lecture 13MENA Regional Water OutlookDesalination Using CSP
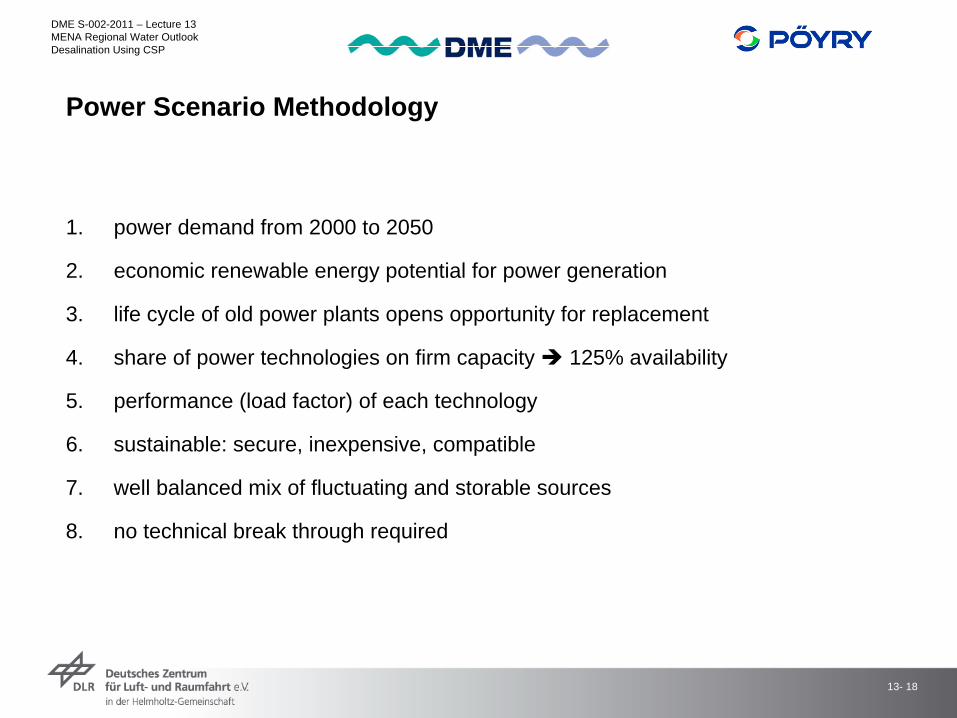
Power Scenario Methodology
1. power demand from 2000 to 2050
2. economic renewable energy potential for power generation
3. life cycle of old power plants opens opportunity for replacement
4. share of power technologies on firm capacity 125% availability
5. performance (load factor) of each technology
6. sustainable: secure, inexpensive, compatible
7. well balanced mix of fluctuating and storable sources
8. no technical break through required
13- 19
DME S-002-2011 – Lecture 13MENA Regional Water OutlookDesalination Using CSP
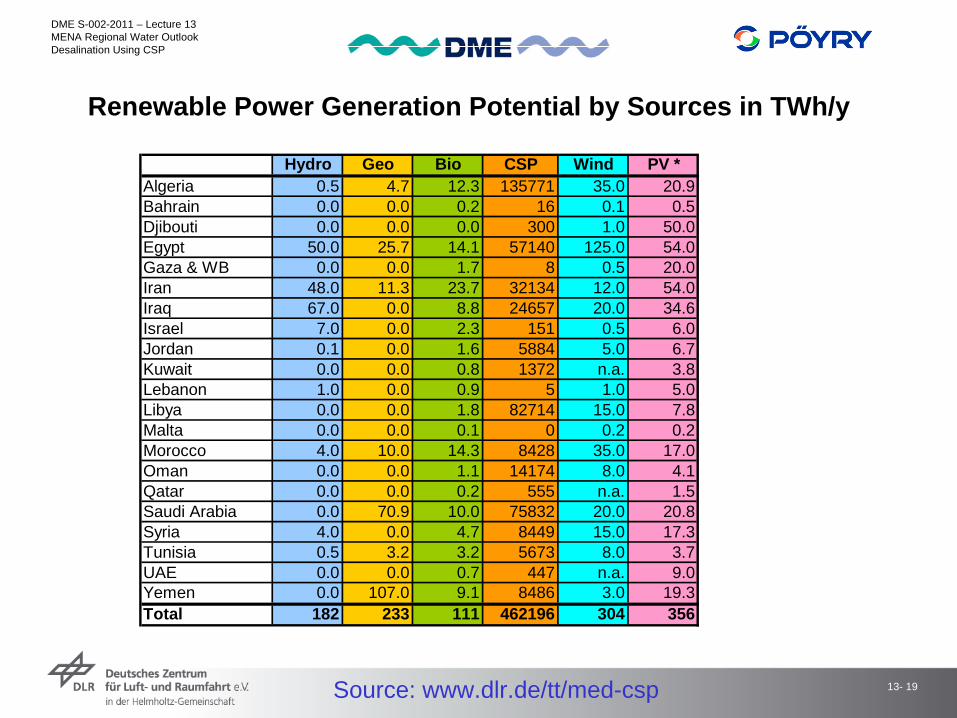
Algeria 0.5 4.7 12.3 135771 35.0 20.9Bahrain 0.0 0.0 0.2 16 0.1 0.5Djibouti 0.0 0.0 0.0 300 1.0 50.0Egypt 50.0 25.7 14.1 57140 125.0 54.0Gaza & WB 0.0 0.0 1.7 8 0.5 20.0Iran 48.0 11.3 23.7 32134 12.0 54.0Iraq 67.0 0.0 8.8 24657 20.0 34.6Israel 7.0 0.0 2.3 151 0.5 6.0Jordan 0.1 0.0 1.6 5884 5.0 6.7Kuwait 0.0 0.0 0.8 1372 n.a. 3.8Lebanon 1.0 0.0 0.9 5 1.0 5.0Libya 0.0 0.0 1.8 82714 15.0 7.8Malta 0.0 0.0 0.1 0 0.2 0.2Morocco 4.0 10.0 14.3 8428 35.0 17.0Oman 0.0 0.0 1.1 14174 8.0 4.1Qatar 0.0 0.0 0.2 555 n.a. 1.5Saudi Arabia 0.0 70.9 10.0 75832 20.0 20.8Syria 4.0 0.0 4.7 8449 15.0 17.3Tunisia 0.5 3.2 3.2 5673 8.0 3.7UAE 0.0 0.0 0.7 447 n.a. 9.0Yemen 0.0 107.0 9.1 8486 3.0 19.3Total 182 233 111 462196 304 356
Wind PV *Hydro Geo Bio CSP
Renewable Power Generation Potential by Sources in TWh/y
Source: www.dlr.de/tt/med-csp

13- 20
DME S-002-2011 – Lecture 13MENA Regional Water OutlookDesalination Using CSP
0
100
200
300
400
500
600
700
800
900
1000
2000 2010 2020 2030 2040 2050
Year
Inst
alle
d C
apac
ity (G
W)
0
100
200
300
400
500
600
700
800
900
1000
PhotovoltaicsWindGeothermalHydropowerBiomassCSP PlantsOil / GasCoalNuclearPeak Load
Installed Capacity in all MENA Countries by Sources
260 GW fluctuating!

13- 21
DME S-002-2011 – Lecture 13MENA Regional Water OutlookDesalination Using CSP
0
500
1000
1500
2000
2500
3000
3500
2000 2010 2020 2030 2040 2050
Year
Elec
tric
ity P
rodu
ctio
n (T
Wh/
y) PhotovoltaicsWindGeothermalHydropowerBiomassCSP PlantsOilGasCoalNuclear
Electricity Production of all MENA Countries by Sources

13- 22
DME S-002-2011 – Lecture 13MENA Regional Water OutlookDesalination Using CSP
Water Scenario Methodology
1. water demand from 2000 to 2050
2. total and coastal CSP potential for desalination
3. life cycle of old desal plants opens opportunity for replacement
4. top priority for efficiency gains
5. second priority for reuse of waste water
6. third priority for sustainable surface and ground water extractions
7. fourth priority for existing and planned conventional desal plants
8. last priority for CSP desalination after 2015
9. no priority for unsustainable water extractions
13- 23
DME S-002-2011 – Lecture 13MENA Regional Water OutlookDesalination Using CSP
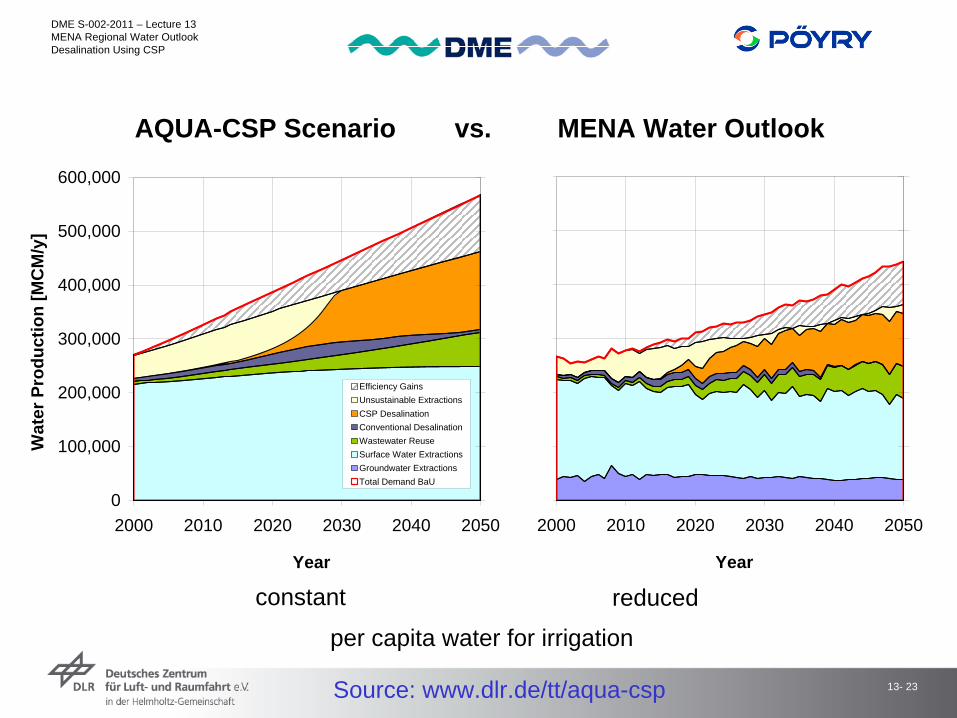
AQUA-CSP Scenario vs. MENA Water Outlook
per capita water for irrigation
constant reduced
0
100,000
200,000
300,000
400,000
500,000
600,000
2000 2010 2020 2030 2040 2050
Year
Wat
er P
rodu
ctio
n [M
CM
/y]
0
1
2
3
4
5
6
0
0
0
0
0
0
0
2000 2010 2020 2030 2040 2050
Year
0
1
2
3
4
5
6
Efficiency GainsUnsustainable ExtractionsCSP DesalinationConventional DesalinationWastewater ReuseSurface Water ExtractionsGroundwater ExtractionsTotal Demand BaU
Source: www.dlr.de/tt/aqua-csp

13- 24
DME S-002-2011 – Lecture 13MENA Regional Water OutlookDesalination Using CSP
Middle East & North Africa (MENA)
0
50,000
100,000
150,000
200,000
250,000
300,000
350,000
400,000
450,000
500,000
2000 2010 2020 2030 2040 2050
Year
Wat
er P
rodu
ctio
n [M
CM
/y]
0
50,000
100,000
150,000
200,000
250,000
300,000
350,000
400,000
450,000
500,000
Efficiency GainsUnsustainable ExtractionsCSP DesalinationConventional DesalinationWastewater ReuseSurface Water ExtractionsGroundwater ExtractionsTotal Demand BaU
Average Climate Change

13- 25
DME S-002-2011 – Lecture 13MENA Regional Water OutlookDesalination Using CSP
North Africa
0
20,000
40,000
60,000
80,000
100,000
120,000
140,000
160,000
2000 2010 2020 2030 2040 2050
Year
Wat
er P
rodu
ctio
n [M
CM
/y]
0
20,000
40,000
60,000
80,000
100,000
120,000
140,000
160,000
Efficiency GainsUnsustainable ExtractionsCSP DesalinationConventional DesalinationWastewater ReuseSurface Water ExtractionsGroundwater ExtractionsTotal Demand BaU

13- 26
DME S-002-2011 – Lecture 13MENA Regional Water OutlookDesalination Using CSP
Western Asia
0
50,000
100,000
150,000
200,000
250,000
2000 2010 2020 2030 2040 2050
Year
Wat
er P
rodu
ctio
n [M
CM
/y]
0
50,000
100,000
150,000
200,000
250,000
Efficiency GainsUnsustainable ExtractionsCSP DesalinationConventional DesalinationWastewater ReuseSurface Water ExtractionsGroundwater ExtractionsTotal Demand BaU
13- 27
DME S-002-2011 – Lecture 13MENA Regional Water OutlookDesalination Using CSP
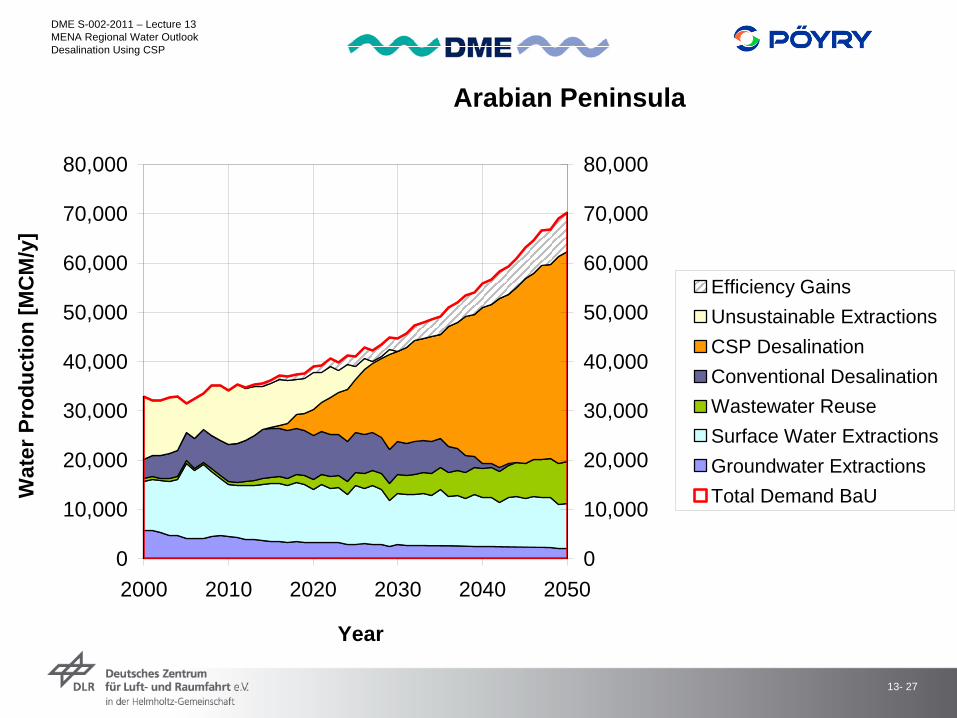
Arabian Peninsula
0
10,000
20,000
30,000
40,000
50,000
60,000
70,000
80,000
2000 2010 2020 2030 2040 2050
Year
Wat
er P
rodu
ctio
n [M
CM
/y]
0
10,000
20,000
30,000
40,000
50,000
60,000
70,000
80,000
Efficiency GainsUnsustainable ExtractionsCSP DesalinationConventional DesalinationWastewater ReuseSurface Water ExtractionsGroundwater ExtractionsTotal Demand BaU

13- 28
DME S-002-2011 – Lecture 13MENA Regional Water OutlookDesalination Using CSP
0 2 4 6 8 10 12 14
Algeria
Bahrain
Djibouti
Egypt
Gaza
Iran
Iraq *
Israel
Jordan *
Kuwait
Lebanon
Libya
Malta
Morocco
Oman
Qatar
Saudi Arabia
Syria
Tunisia
UAE
West Bank
Yemen
CSP Desalination Potential [Bm³/y]
RO or MEDRO only
23.7

13- 29
DME S-002-2011 – Lecture 13MENA Regional Water OutlookDesalination Using CSP
Why CSP for Water in MENA?
1. CSP potential is very large even at coastal sites
2. good seasonal correlation of availability and demand
3. most abundant in regions with highest water scarcity
4. base load for uninterrupted operation of desalination plants
5. solar powered pre-treatment replaces chemicals
13- 30
DME S-002-2011 – Lecture 13MENA Regional Water OutlookDesalination Using CSP
Thank You!