medicaid long-term services and supports expenditures, fy … · medicaid expenditures for...
TRANSCRIPT

Medicaid Expenditures for Long-Term Services and Supports (LTSS) in FY 2015
April 14, 2017
Steve Eiken Kate Sredl Brian Burwell Rebecca Woodward
This report contains information which resulted from Contract No. HHSM-500-2010-00026I, between Mathematica Policy Research, Inc. and the Centers for Medicare & Medicaid Services (CMS), under which project Truven Health Analytics was a subcontractor.

Medicaid Expenditures for Long-Term Services and Supports in FY 2015 2
Table of Contents
Executive Summary........................................................................................................................... 3
Trends in Total LTSS Expenditures ................................................................................................. 7
The Percentage of Total LTSS Spending for HCBS ...................................................................... 10
LTSS as a Percentage of Total Medicaid Spending ...................................................................... 13
Growth of Managed Long-Term Services and Supports (MLTSS) .............................................. 14
Changes in Federal Authorities to Deliver HCBS ......................................................................... 16
Variation by Population ................................................................................................................... 18
Conclusion ....................................................................................................................................... 22
Appendix A: Data Sources, Methods and Limitations ................................................................. 23
List of Attached Data Tables .......................................................................................................... 28
Abbreviations in Attached Data Tables ......................................................................................... 31

Medicaid Expenditures for Long-Term Services and Supports in FY 2015 3
For more than 25 years, Truven Health Analytics, now part of the IBM Watson
Health Business, has produced annual reports of Medicaid long-term services
and supports (LTSS) expenditures, documenting Medicaid’s significant role in
LTSS and changes in LTSS over time. The series of reports shows decades-
long trends such as the increasing role of home and community-based services
(HCBS) and the continued, significant state variation in Medicaid LTSS. This
report presents data for federal fiscal year (FY) 2015 along with updates for FY
2012 through 2014. We also compare recent trends to historical patterns.
Total Medicaid LTSS expenditures were FY 2015 continued historically low LTSS spending growth. Since FY 2012, the average expenditures increase has been four percent per year. LTSS spending grew more than five percent per year from the early 1980s through FY 2010.
$158 billion in FY 2015, a four percent
increase from FY 2014. FY 2015
continued the recent trend of historically
low LTSS spending growth. In the three
years since FY 2012, expenditures grew by an average of four percent per year.
In contrast, from the early 1980s through FY 2010 LTSS spending grew more
than five percent per year.
HCBS have accounted for all Medicaid LTSS growth in recent years while
institutional service expenditures have been flat. HCBS spending increased
seven percent in FY 2015, with three-year average annual growth of eight
Executive Summary

Medicaid Expenditures for Long-Term Services and Supports in FY 2015 4
percent. Institutional service spending decreased less than 0.1 percent in FY
2015, with an average annual decline of 0.2 percent over three years.
The percentage of total Medicaid LTSS spent on HCBS increased from 53
percent in FY 2014 to 55 percent in FY 2015. This percentage has climbed one-
to-three percentage points almost every year since FY 1992. The number of
states (including the District of Columbia) in which HCBS were a majority of
expenditures increased from 25 in FY 2014 to 28 in FY 2015.
LTSS provided through managed care continued to grow more rapidly than
overall Medicaid LTSS, increasing 24 percent in FY 2015 from $23 billion to $29
billion. Managed care accounted for 18 percent of FY 2015 LTSS spending.
The $29 billion figure is a conservative estimate; some managed care data are
missing because of ongoing data collection challenges. Starting in FY 2016,
CMS required states to estimate institutional and HCBS expenditures within
Medicaid managed care, which will improve managed LTSS data availability.
Another trend is the increased use of relatively new Medicaid State Plan
authorities and demonstrations—state plan HCBS (section 1915(i)), self-directed
personal assistance services (section 1915(j)), community first choice (section
1915(k)), health homes (section 1945), and the Money Follows the Person
Demonstration. In FY 2015, spending for these authorities grew 57 percent from
$5.9 billion to $9.3 billion, driven primarily by new states implementing the
community first choice benefit.
The percentage of LTSS expenditures for HCBS continued to vary across
population groups. HCBS accounted for 76 percent of spending in programs
targeting people with developmental disabilities, compared to 44 percent of

Medicaid Expenditures for Long-Term Services and Supports in FY 2015 5
expenditures for programs targeting older adults and people with physical
disabilities and 42 percent for behavioral health services provided to people with
mental health and substance use disorders. HCBS spending for all three
populations increased relative to institutional services in FY 2015.
Accompanying this report are numerous data tables that summarize national
and state-level expenditures by service category and state. These tables
document state variation in Medicaid LTSS, including overall expenditures
growth, the balance between institutional and HCBS spending, the use of new
program authorities, differences in data by target population, and the use of
managed care.

Medicaid Expenditures for Long-Term Services and Supports in FY 2015 6
Medicaid Expenditures for Long-Term Services and Supports (LTSS) in FY 2015
Medicaid is the largest payer of long-term services and supports (LTSS),1 which includes home and
community-based services (HCBS) such as personal care, section 1915(c) waiver services, and rehabilitative
services as well as institutional services such as nursing facilities and intermediate care facilities for
individuals with intellectual disabilities (ICF/IID). For over 25 years, Truven Health Analytics, now part of the
IBM Watson Health Business, has produced annual Medicaid LTSS expenditures reports. The series of
reports has shown changes in LTSS over time, such as the increasing role of HCBS and the growth in
managed care service delivery models, as well as the significant state variation in Medicaid LTSS.
This report presents data for the most recent federal fiscal year (FY) available, FY 2015, along with updates
for FY 2012 through 2014. We also compare recent trends to historical expenditure patterns to show unique
aspects of contemporary Medicaid LTSS. The report describes national data regarding:
1. Historically low rates of increase in Medicaid LTSS expenditures;
2. The increasing HCBS portion of Medicaid LTSS expenditures;
3. Reductions in the percentage of total Medicaid spending used for LTSS;
4. The rapid growth of managed LTSS;
5. Increases in relatively new federal authorities and demonstrations to deliver HCBS; and
6. Variation by targeted population group.
Accompanying this report are numerous data tables that provide expenditures by service category and state.
The primary data source is CMS-64 reports that states use to claim federal matching funds for their Medicaid
expenditures. The CMS-64 data are supplemented with data collected directly from states that have
managed LTSS programs, although not all managed care states have provided data for all years. Appendix A
provides more information on data sources, methods, and limitations.
1 O’Shaughnessy, C. The Basics: National Spending for Long-Term Services and Supports (LTSS), 2012. National Health Policy Forum, 2014. Available online at http://www.nhpf.org/library/the-basics/Basics_LTSS_03-27-14.pdf.

Medicaid Expenditures for Long-Term Services and Supports in FY 2015 7
Trends in Total LTSS Expenditures
The recent trend of historically low expenditure growth continued in FY 2015. Total Medicaid LTSS
expenditures were $158 billion in FY 2015, a four percent increase from $153 billion in FY 2014. For three
consecutive years, LTSS spending has increased three or four percent, averaging 3.8 percent per year.
Expenditures grew less than one percent per year during the previous two years, FY 2011 and FY 2012. In
contrast, Medicaid LTSS spending increased more than 5 percent per year in the previous three decades as
shown in Figure 1.
Figure 1. Average Annual Growth in Medicaid LTSS Expenditures, FY 1982–2015

Medicaid Expenditures for Long-Term Services and Supports in FY 2015 8
HCBS expenditures grew from $81 billion in FY 2014 to $87 billion in FY 2015 (a seven percent increase),
accounting for all FY 2015 LTSS growth. As was true for total LTSS, HCBS spending has grown at a slower
rate in recent years than in previous decades: 7.6 percent per year since FY 2012. HCBS increased more
than 10 percent per year during the previous three decades. The rate of HCBS spending increase has
declined steadily over time as shown in Figure 2. One factor is that baseline data are higher in more recent
years. In FY 2005, for example, HCBS spending was $39 billion, less than half the FY 2015 amount. A
billion-dollar HCBS increase in FY 2005 caused twice the percentage increase as the same amount in FY
2015.
Figure 2. Average Annual Growth in Medicaid HCBS Expenditures, FY 1982–2015

Medicaid Expenditures for Long-Term Services and Supports in FY 2015 9
Institutional service spending was essentially flat in FY 2015, rounding to $71.5 billion in both FY 2014 and FY
2015 with a decrease of less than 0.1 percent. Institutional spending has declined less than one percent per
year starting in FY 2011. The recent decrease follows relatively small increases per year during the late
1990s and the decade starting in 2000, as shown in Figure 3.
Figure 3. Average Annual Growth in Medicaid Institutional LTSS Expenditures, FY 1982–2015
Declining institutional expenditures may be temporary: changes since FY 2012 have been driven primarily by
a $2.0 billion decline in New York public ICF/IID spending from $2.3 billion to $349 million. If New York’s
spending had not changed, institutional LTSS would have increased by an average of 0.7 percent per year
from FY 2012 through FY 2015.

Medicaid Expenditures for Long-Term Services and Supports in FY 2015 10
The Percentage of Total LTSS Spending for HCBS
HCBS increased from 53 percent of total Medicaid LTSS in FY 2014 to 55 percent in FY 2015, reflecting the
increase in HCBS spending and flat institutional expenditures. As Figure 4 illustrates, FY 2015 continued a
pattern of one to three percentage point increases almost every year since FY 1993. Within this national
trend, there was significant variation across states, as shown in Figure 5 on the following page.
Figure 4. Medicaid HCBS and Institutional LTSS Expenditures as a Percentage of Total Medicaid LTSS Expenditures, FY 1981–2015
* ICF/IID data for FY 1987 were nearly double expenditures for FY 1986 and for FY 1988. The reason for the one-time reported increase in expenditures is not known, and data from this outlier year are excluded.

Medicaid Expenditures for Long-Term Services and Supports in FY 2015 11
Figure 5. Medicaid HCBS Expenditures as a Percentage of Total Medicaid LTSS Expenditures, by State, FY 2015
* California and North Carolina were excluded from this figure because a high proportion of LTSS were delivered through managed care and detailed managed care information was not available for FY 2015.
The bar for each state on Figure 5 represents HCBS spending as a percentage of total LTSS spending,
ranging from 31 percent in Mississippi to 82 percent in Oregon. The variation shows the importance of state-
level actions to balance LTSS systems. HCBS exceeded 50 percent of LTSS expenditures in most states
with complete data—27 states and the District of Columbia. In FY 2014, only 24 states and the District spent
more on HCBS than on institutional LTSS. Institutional services comprised a majority of LTSS spending in 21
states in FY 2015. The FY 2015 percentage of spending for HCBS was not calculated for California and
North Carolina because managed care data were missing.

Medicaid Expenditures for Long-Term Services and Supports in FY 2015 12
Figure 6 shows the ten states with the greatest increase in HCBS as a percentage of total LTSS from FY
2013 to FY 2015, a measure of balancing progress during the last two years of data. This chart shows that
states at all points on the balancing continuum continue to modify their LTSS systems.
Figure 6. States with the Greatest Increase in Medicaid HCBS Expenditures as a Percentage of Total Medicaid LTSS Expenditures, FY 2013–2015
Six of the 10 states with the highest percentage increases in HCBS between FY 2013 and FY 2015 (New
Jersey, Ohio, Massachusetts, Connecticut, Mississippi, and Nevada) were among the 21 states that
participated in the Balancing Incentive Program. This program provided an enhanced federal matching rate
for HCBS through FY 2015 for states that applied for these payments and met program requirements. States
that spent less than 50 percent of LTSS expenditures on HCBS in FY 2009 received an additional two
percentage points in federal funds. States where HCBS comprised less than 25 percent of LTSS spending in
FY 2009 received five percentage points.
Medicaid Expenditures for Long-Term Services and Supports in FY 2015 13
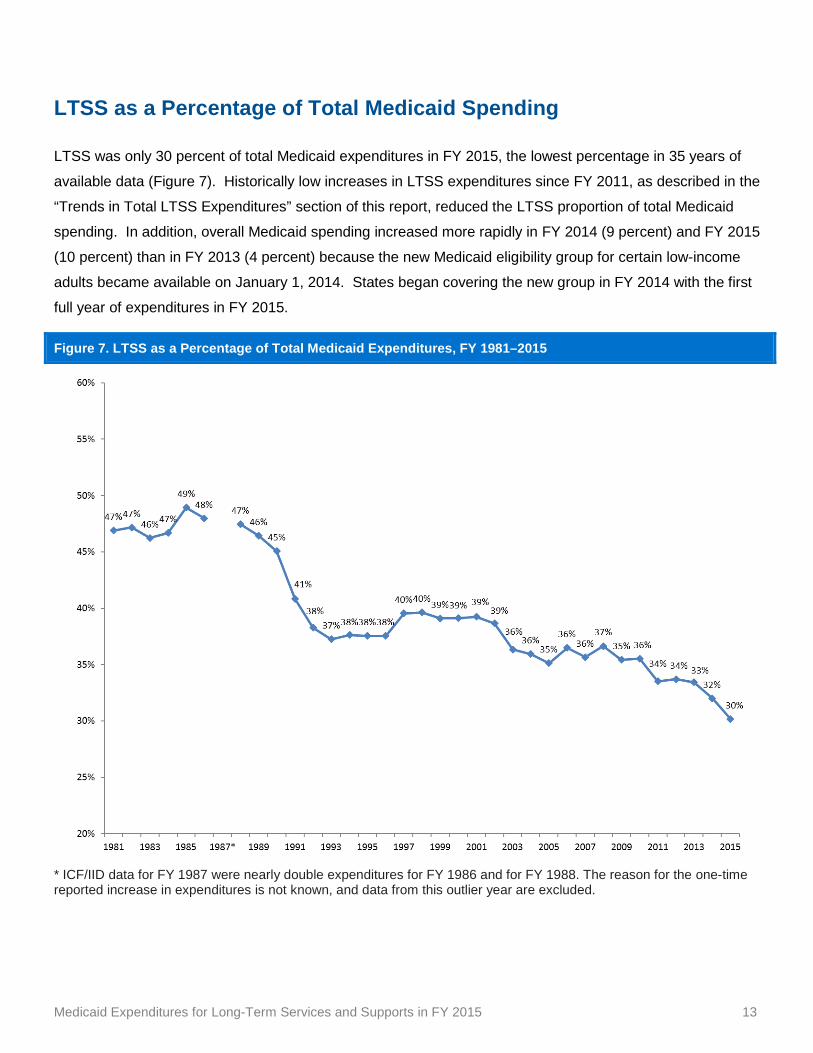
LTSS as a Percentage of Total Medicaid Spending LTSS was only 30 percent of total Medicaid expenditures in FY 2015, the lowest percentage in 35 years of
available data (Figure 7). Historically low increases in LTSS expenditures since FY 2011, as described in the
“Trends in Total LTSS Expenditures” section of this report, reduced the LTSS proportion of total Medicaid
spending. In addition, overall Medicaid spending increased more rapidly in FY 2014 (9 percent) and FY 2015
(10 percent) than in FY 2013 (4 percent) because the new Medicaid eligibility group for certain low-income
adults became available on January 1, 2014. States began covering the new group in FY 2014 with the first
full year of expenditures in FY 2015.
Figure 7. LTSS as a Percentage of Total Medicaid Expenditures, FY 1981–2015
* ICF/IID data for FY 1987 were nearly double expenditures for FY 1986 and for FY 1988. The reason for the one-time reported increase in expenditures is not known, and data from this outlier year are excluded.

Medicaid Expenditures for Long-Term Services and Supports in FY 2015 14
Growth of Managed Long-Term Services and Supports
Expenditures for LTSS provided through managed care increased 24 percent to $29 billion in FY 2015 from
$23 billion in FY 2014. FY 2015 continued the trend of rapid managed LTSS (MLTSS) growth. In three
years, MLTSS spending has increased $18 billion (182%). MLTSS data in Figure 8 are conservative
estimates because of challenges in collecting MLTSS data described in Appendix A. Data start in FY 2008,
the first year Truven Health contacted states to collect MLTSS data that was not available in CMS-64 reports.
Figure 8. Medicaid Managed LTSS Expenditures, in billions, FY 2008–2015
Managed LTSS includes the Program of All-Inclusive Care for the Elderly (PACE) and the following services provided through managed care organizations: nursing facilities, ICF/IID, personal care, home health, section 1915(c) waivers, and HCBS provided through managed care programs (e.g., a section 1115 demonstration or section 1915(b) waiver) that were not authorized under another state plan or waiver authority (called “HCBS – unspecified” in the data tables).
Four states accounted for 80 percent of FY 2015 MLTSS growth: $4.4 billion of the $5.5 billion increase.
Texas expanded an existing MLTSS program during that year. In the other three states—Florida,

Medicaid Expenditures for Long-Term Services and Supports in FY 2015 15
Massachusetts, and Ohio—FY 2015 was the first full year of managed care expenditures for programs that
expanded or began in FY 2014.
Managed care accounted for 18 percent of LTSS expenditures in FY 2015 compared to seven percent in FY
2012. We expect growth to continue as the data reflect recently implemented Medicaid-only MLTSS and
Financial Alignment Initiative programs that test models to align Medicare and Medicaid financing and to
integrate services from both programs. In addition, we expect more complete data starting in FY 2016, the
first-year CMS required all states to estimate three categories of Medicaid managed care spending in the
CMS-64—acute care, institutional LTSS, and non-institutional LTSS. Between FY 2012 and FY 2015, only
the states that participated in the Balancing Incentive Program estimated LTSS spending within Medicaid
managed care using these categories.
The managed care portion of LTSS expenditures varied by population. MLTSS was 24 percent of all
Medicaid LTSS spending for programs targeting older adults and people with physical disabilities,2 but only
seven percent of LTSS expenditures for programs targeting people with developmental disabilities.3 For more
information on managed care data, see Tables AZ through BO in Appendix A, which show MLTSS data by
state and category of service.
2 MLTSS for programs targeting older adults and people with physical disabilities includes PACE (Table R) and managed care expenditures for nursing facilities (Table BA), personal care (Table BF), home health (Table BG), section 1915(c) waivers targeted to this population (Table BJ), and HCBS targeted to this population provided through managed care programs (e.g., a section 1115 demonstration or section 1915(b) waiver) that were not authorized under another state plan or waiver authority (a.k.a. HCBS – Unspecified, Table BM). 3 MLTSS for programs targeting people with developmental disabilities includes managed care expenditures for ICF/IID (Table BB), section 1915(c) waivers targeted to this population (Table BK), and HCBS targeted to this population provided through managed care programs (e.g., a section 1115 demonstration or section 1915(b) waiver) that were not authorized under another state plan or waiver authority (a.k.a. HCBS – Unspecified, Table BN).
Medicaid Expenditures for Long-Term Services and Supports in FY 2015 16
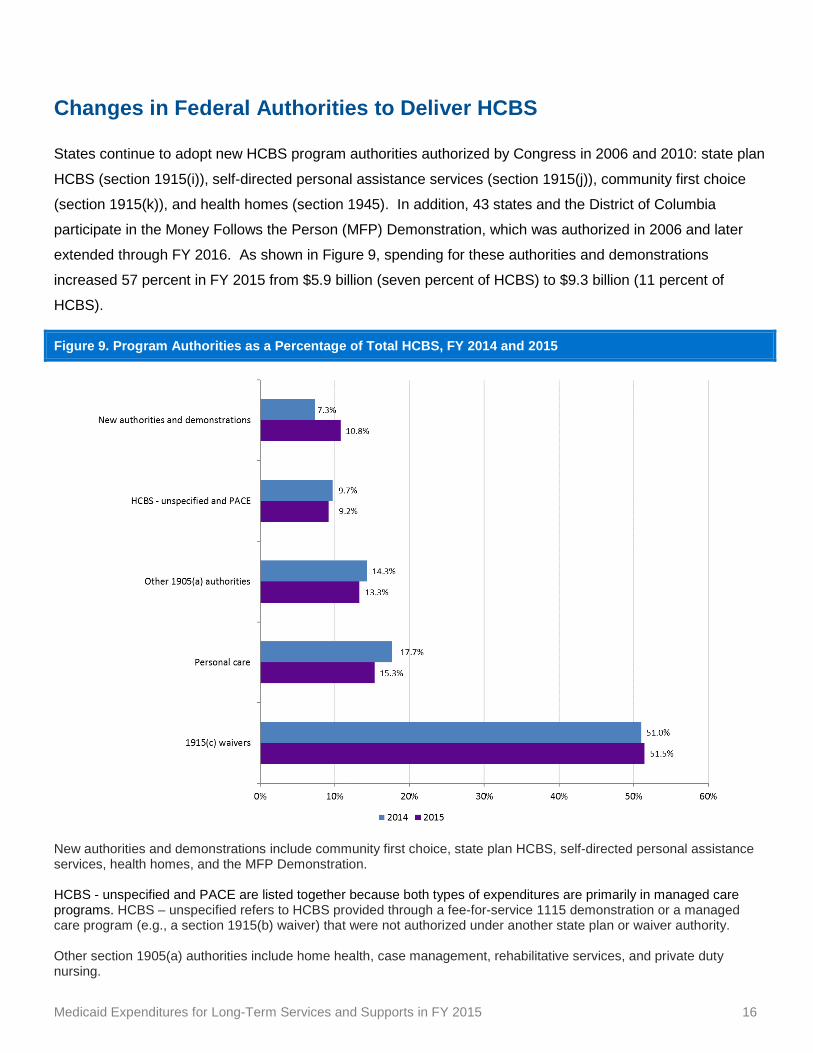
Changes in Federal Authorities to Deliver HCBS
States continue to adopt new HCBS program authorities authorized by Congress in 2006 and 2010: state plan
HCBS (section 1915(i)), self-directed personal assistance services (section 1915(j)), community first choice
(section 1915(k)), and health homes (section 1945). In addition, 43 states and the District of Columbia
participate in the Money Follows the Person (MFP) Demonstration, which was authorized in 2006 and later
extended through FY 2016. As shown in Figure 9, spending for these authorities and demonstrations
increased 57 percent in FY 2015 from $5.9 billion (seven percent of HCBS) to $9.3 billion (11 percent of
HCBS).
Figure 9. Program Authorities as a Percentage of Total HCBS, FY 2014 and 2015
New authorities and demonstrations include community first choice, state plan HCBS, self-directed personal assistance services, health homes, and the MFP Demonstration. HCBS - unspecified and PACE are listed together because both types of expenditures are primarily in managed care programs. HCBS – unspecified refers to HCBS provided through a fee-for-service 1115 demonstration or a managed care program (e.g., a section 1915(b) waiver) that were not authorized under another state plan or waiver authority. Other section 1905(a) authorities include home health, case management, rehabilitative services, and private duty nursing.

Medicaid Expenditures for Long-Term Services and Supports in FY 2015 17
Four states started offering community first choice in FY 2015: Connecticut, New York, Texas, and
Washington. These states explain 51 percent of the total spending increase for new authorities ($1.7 billion of
$3.4 billion). In addition, expenditures increased for most existing programs. Four states implemented health
homes benefits in FY 2015—Kansas, Oklahoma, Michigan, and West Virginia—but these programs
accounted for only $35 million.
Community first choice comprised 81 percent of all expenditures for the newer program authorities and
demonstrations, with total federal and state expenditures of $7.6 billion (Figure 10). Three other authorities or
demonstrations each accounted for several hundred million dollars: health homes ($684 million), state plan
HCBS ($511 million), and the MFP Demonstration ($440 million). Self-directed personal assistance services
programs accounted for only one percent of spending for new authorities ($136 million).
Figure 10. Distribution of Medicaid Expenditures for New HCBS Program Authorities, FY 2015

Medicaid Expenditures for Long-Term Services and Supports in FY 2015 18
Variation by Population
The percentage of spending on HCBS varied by target population in FY 2015, as it has in previous years.
HCBS represented about three-fourths of LTSS dollars targeted to people with developmental disabilities (76
percent), but only a minority of spending for older adults and people with physical disabilities (44 percent) and
for behavioral health services to people with mental health and substance use disorders (42 percent).
Tables AS through AU present the HCBS percentage of LTSS expenditures for these target population
groups based on two key assumptions:
1. Certain state plan services--personal care, home health, private duty nursing, and nursing facilities—
are more likely to be used by older adults and people with physical disabilities
2. Most rehabilitative services are behavioral health services.
For some services, such as case management and the MFP demonstration, multiple populations are possible
and available data do not distinguish among these populations. Expenditures for each subgroup are
discussed in more detail on the following pages.

Medicaid Expenditures for Long-Term Services and Supports in FY 2015 19
Figure 11 shows HCBS and institutional expenditures for services targeted to older adults and people with
physical disabilities from FY 1995 through FY 2015. Nationally, HCBS comprised 44 percent of FY 2015
LTSS expenditures for this group. Some states spent a significantly higher percentage on HCBS services,
including nine states that spent more than 50 percent of LTSS dollars on HCBS (See Table AS). The HCBS
portion of LTSS expenditures has increased significantly from 17 percent in FY 1995, the first year with target
population data available for section 1915(c) waivers, which comprise a large portion of spending for this
group. Most of the increase occurred after FY 2002, when HCBS was 22 percent of LTSS expenditures.
Figure 11. Medicaid LTSS Expenditures Targeted to Older Adults and People with Physical Disabilities, by Service Category, FY 1995–2015 (in billions)
Institutional includes nursing facilities. HCBS includes personal care, home health, community first choice, PACE, private duty nursing, self-directed personal assistance services, and HCBS targeting older adults and people with physical disabilities in section 1915(c) waivers, state plan HCBS, health homes, and in a fee-for-service 1115 demonstration or a managed care program (e.g., a section 1915(b) waiver) that were not authorized under another state plan or waiver authority (called “HCBS – unspecified” in the data tables).

Medicaid Expenditures for Long-Term Services and Supports in FY 2015 20
In FY 2015, 76 percent of national Medicaid LTSS expenditures for programs targeting people with
developmental disabilities were for HCBS, a one-point increase from 75 percent in FY 2014. Only one state
spent less than 50 percent of LTSS dollars on HCBS services (See Table AT). The HCBS portion of LTSS
expenditures targeting people with developmental disabilities has more than doubled from 30 percent in FY
1995, the first year with target population data available for section 1915(c) waivers that comprise most HCBS
for this group (Figure 12).
Figure 12. Medicaid LTSS Expenditures Targeted to People with Developmental Disabilities, by Service Category, FY 1995–2015 (in billions)
Institutional includes ICF/IID. HCBS includes supports targeting people with intellectual disability, autism spectrum disorder, and/or other developmental disabilities authorized in section 1915(c) waivers, section 1915(i) state plan benefits, and in a fee-for-service 1115 demonstration or a managed care program (e.g., a section 1915(b) waiver) that were not authorized under another state plan or waiver authority (called “HCBS – unspecified” in the data tables).

Medicaid Expenditures for Long-Term Services and Supports in FY 2015 21
HCBS comprised 42 percent of FY 2015 LTSS expenditures for behavioral health services provided to people
with mental health and substance use disorders, as shown in Figure 13. Some states spent a significantly
higher percentage on HCBS, including 21 that spent more than 50 percent (See Table AU). The HCBS
portion of LTSS expenditures has increased from 28 percent in FY 2010, the year data became available for
rehabilitative services, which accounts for most behavioral health HCBS. This report likely under estimates
behavioral health services. Due to limited resources, we have not collected managed care spending
estimates for the largest program authorities for behavioral health services: rehabilitative services and
institution for mental disease services for individuals age 65 or older and/or under age 21.
Figure 13. Medicaid LTSS Expenditures for Behavioral Health Services, by Service Category, FY 2010–2015 (in billions)
Institutional includes fee-for-service payments for institution for mental disease services for individuals age 65 or older and/or under age 21 and Disproportionate Share Hospital payments to mental health facilities. HCBS includes rehabilitative services and behavioral health services authorized under section 1915(c) waivers, state plan HCBS, and health homes.

Medicaid Expenditures for Long-Term Services and Supports in FY 2015 22
Conclusion The most recent year of Medicaid LTSS data, FY 2015, continued several trends we have identified in recent
years. Some trends show distinct, recent changes. Medicaid LTSS expenditures grew only four percent per
year on average from FY 2013 through FY 2015 and LTSS spending was the lowest percentage of total
Medicaid (30 percent) in the 35 years for which data are available. Managed LTSS spending continued to
grow by more than 20 percent per year as states implement and expand Financial Alignment Initiative
demonstrations and Medicaid-only MLTSS programs. Finally, more states implemented new Medicaid HCBS
program authorities and demonstrations, especially community first choice and health homes. Benefits added
in 2006 and 2010 comprised 11 percent of HCBS in FY 2015, an increase from seven percent in FY 2014.
Other trends continued long-standing patterns. HCBS spending continued to increase while institutional
service spending was flat. The percentage of LTSS expenditures for HCBS increased to 55 percent. The
data provide no indication that HCBS has reached a natural limit beyond which it will be difficult to expand;
even states with high percentages of HCBS continued to progress. In addition, wide variation by state and
target population continued. These patterns illustrate the importance of state policy and the different
approaches to LTSS states have taken for different population groups.
Gaps in available data persist. Most notably, managed LTSS data are not complete, especially for behavioral
health services. Appendix A starting on the following page provides more information on sources, methods,
and limitations.

Medicaid Expenditures for Long-Term Services and Supports in FY 2015 23
Appendix A: Data Sources, Methods and Limitations Sources
This report was compiled using four sources:
1. The CMS-64 Quarterly Expense Report that states submit to CMS to claim federal matching funds
2. Managed care data collected by Truven Health from states with managed LTSS programs
3. Grantee budget worksheets for the Money Follows the Person (MFP) Demonstration in applicable
states provided by Mathematica Policy Research
4. Annual population estimates by the U.S. Census Bureau to calculate expenditures per state resident.4
Expenditures per state resident was spending divided by the estimated state population as of July 1 of
that year.
Methods
We downloaded CMS-64 forms from the CMS Medicaid and Children's Health Insurance Program Budget and
Expenditure System (MBES). The CMS-64 includes expenditures by category of service. It does not report
the number of people who receive each service or their characteristics. States report fee-for-service
expenditures by program authority (e.g., state plan personal care, state plan home health, section 1915(c)
waiver). We identified LTSS services among all Medicaid services included in the CMS-64.
The CMS-64 also includes reporting categories for capitated payments to managed care organizations. For
most states, managed care expenditures were reported as a lump sum without specifying the program
authorities included in the capitation. To address this data gap, Truven Health requested certain types of
LTSS data from states with managed care programs. We focused on categories of service that historically
comprised most LTSS expenditures: nursing facilities, ICF/IID, personal care, home health, and section
1915(c) waiver services. We also collected data for HCBS similar to supports in section 1915(c) waiver
services provided under managed care program authorities such as section 1115 demonstrations, section
1915(b) waivers, section 1915(a) contracts, and section 1932(a) state plan amendments, which are called
“HCBS-unspecified” in the data tables. State-reported “HCBS – unspecified” data also were collected from
Rhode Island and Vermont, which offered HCBS on a fee-for-service basis within 1115 demonstrations that
was not identifiable in the CMS-64 reports. We used data from the state Medicaid agency’s web site for two
states (New Jersey and Rhode Island) because the state did not provide separate state-reported data. We
4 U.S. Census Bureau, Population Division “Table 1. Annual Estimates of the Resident Population for the United States, Regions, States, and Puerto Rico: April 1, 2010 to July 1, 2014” December 2014. Available on-line at https://www.census.gov/popest/data/state/totals/2014/.

Medicaid Expenditures for Long-Term Services and Supports in FY 2015 24
added state-reported data to the CMS-64 data by program authority. For example, MLTSS nursing facility
expenditures were added to the fee-for-service nursing facility spending reported in the CMS-64.
The CMS-64 required more specific MLTSS information from states participating in the Balancing Incentive
Program. These states split all Medicaid managed care expenditures into three categories: acute care,
institutional LTSS, and non-institutional LTSS. Ten states reported MLTSS expenditures on the CMS-64:
Illinois, Indiana, Iowa, Louisiana, Massachusetts, New Hampshire, New Jersey, New York, Ohio, and Texas.
In FY 2012 through FY 2014, some states only reported data for part of a year because they joined the
program mid-year. For six states—Illinois, Massachusetts, New Jersey, New York, Ohio, and Texas—both
CMS-64 data and additional state-reported data were available. We used the greater of the amount reported
in state-reported data or the amount reported on the CMS-64 for these states.
We received MFP expenditures from the MFP evaluation contractor, Mathematica Policy Research. MFP
states submitted these data to CMS on grantee budget worksheets.5
Identifying Population Groups
Truven Health categorized most services by population based on a common understanding in the LTSS field
that certain benefits are more likely to be used by certain populations such as older adults and people with
physical disabilities, people with intellectual or developmental disabilities, or people with mental health and
substance use disorders. For example, nursing facilities, personal care, and home health are primarily used
by older adults and people with physical disabilities. For some services, such as case management and the
MFP demonstration, multiple populations are possible and available data do not distinguish among these
populations.
For a few benefits, the CMS-64 provides additional information that enables population classification. For
example, the CMS-64 includes spending for each section 1915(c) waiver. We use data in the CMS Waiver
Management System to learn the target population for each waiver. Similarly, the CMS-64 requires separate
reporting for each program for health homes and for state plan HCBS authorized under section 1915(i). We
downloaded State Plan Amendments for these program authorities from the CMS website and reviewed each
State Plan Amendment for population information.
5 Expenditures include qualified HCBS expenditures, demonstration services, and supplemental services.

Medicaid Expenditures for Long-Term Services and Supports in FY 2015 25
Starting with FY 2010 data, we calculated the percentage of LTSS spent on HCBS for behavioral health
services provided to people with mental health and substance use disorders. FY 2010 was the first year the
CMS-64 included rehabilitative services as a distinct service. States must provide more detailed data for
rehabilitative services in the CMS-64, indicating the type of spending such as physical therapy, mental health
services, and substance use disorder services. In the fall of 2013, we analyzed this detailed data and found
most rehabilitative services spending was for behavioral health services. As a result, we included
rehabilitative services within behavioral health services.
Several states reported very low percentages of HCBS spending for behavioral health services, including
seven states with zero percent of expenditures for HCBS. These states may provide HCBS for this population
within managed care programs, including managed behavioral health carve-out programs. We have not yet
collected state-reported data for behavioral health services. We anticipate managed care behavioral health
spending will be included in the CMS-64 starting with FY 2016 data, when all states were required to estimate
HCBS and institutional managed LTSS spending.
Prior Period Adjustments
States may submit adjustments to their CMS-64 reports from prior reporting periods. The practice is common
and usually results in expenditures being revised upwards. Adjustments by large states can affect national
expenditures significantly, as can the sum of adjustments made by multiple smaller states. The following
table indicates the year for which LTSS expenditures report data first reflected adjustments for prior periods.
Table A-1. First Year of Inclusion of Prior Period Adjustments in Medicaid LTSS Expenditures Report
Program Authority First Year of Prior Period Adjustments
Section 1915(c) waiver services 1995
Personal care, California only 2001
Personal care, all other states 2002
Nursing facility
ICF/IID
Inpatient hospital
Institution for mental disease services for individuals age 65 or older and/or under age 21
Disproportionate Share Hospital, Inpatient
Disproportionate Share Hospital Payments to Mental Health Facilities
2002
PACE 2004
All other services 2009

Medicaid Expenditures for Long-Term Services and Supports in FY 2015 26
Balancing Incentive Program Data
The Balancing Incentive Program provided an enhanced federal matching rate for HCBS through FY 2015 for
states that applied for these payments and met program requirements. An additional two percentage points in
federal funds were available for states that spent less than 50 percent of LTSS expenditures on HCBS in FY
2009. Five percentage points were available for states where HCBS comprised less than 25 percent of LTSS
spending in FY 2009.
Table AQ shows payments under this program since they began in FY 2012. Data include only the federal
enhanced payments, i.e., the additional federal funds these states received because they participated in the
Balancing Incentive Program. These payments were not added to total LTSS expenditures because they do
not affect total Medicaid spending. They affect the percentage paid by the federal government, but not the
total payment amount. This table also differs from other tables based on CMS-64 data because expenditures
are based on the date the state reported spending, which can differ from the date of payment if the state
submits prior period adjustments.
Limitations
The primary source for this report, the CMS-64, is considered among the more reliable sources of state
Medicaid spending because states must submit the CMS-64 to claim the federal share of spending and the
federal government audits reported expenditures. However, the data have limitations as described below.
Managed Care: We used a combination of the CMS-64 and state-reported data for MLTSS expenditures.
State-reported data do not include behavioral health services due to limited resources, so this report likely
under estimates behavioral health spending within LTSS. Another limitation of state-reported data is that
state responsiveness varies; some states provided data in some years but not others. We note specific gaps
in managed care data at the bottom of data tables where applicable. When analyzing spending over time in
states with long-standing MLTSS programs (e.g., Arizona, Hawaii, Massachusetts, Minnesota, New Mexico,
North Carolina, Wisconsin), users are advised to make careful note of years for which managed care data
were not available and assess the appropriateness of longitudinal analyses accordingly.
Identifying Certain Services: Prior to FY 2010, it was not possible to identify certain services from the CMS-
64 data. Therefore, the following services were first included in FY 2010: rehabilitative services, private duty
nursing, and state plan HCBS. In FY 2015, these three services represented three percent of total LTSS
expenditures. These additions to the data should be considered when analyzing expenditures over time.

Medicaid Expenditures for Long-Term Services and Supports in FY 2015 27
Disallowances: CMS may disallow certain claims as a result of its audit process. Disallowances are not
reported by type of service and therefore cannot be used to adjust previously reported Medicaid spending by
type of service. Therefore, the data in this report have not been adjusted for disallowances.
Date of Payment Basis: The CMS-64 is based on a state’s date of payment, as opposed to date of service
delivery, which can cause unusual results based on a state’s one-time payment policy. For example, a state
may choose to delay nursing facility payments by a month to push them into the next fiscal year. As a result,
only 11 months of nursing facility expenditures would be reported in the earlier period.

Medicaid Expenditures for Long-Term Services and Supports in FY 2015 28
List of Attached Data Tables
Summary Tables:
A: Medicaid Expenditures for Long-Term Services and Supports: FY 2012 – FY 2015
B: Medicaid Expenditures for LTSS by Target Population: FY 2012 – FY 2015
C: State Summary Table: Medicaid Expenditures for LTSS, FY 2015
Tables D through AN: LTSS Services by State, FY 2012 – FY 2015
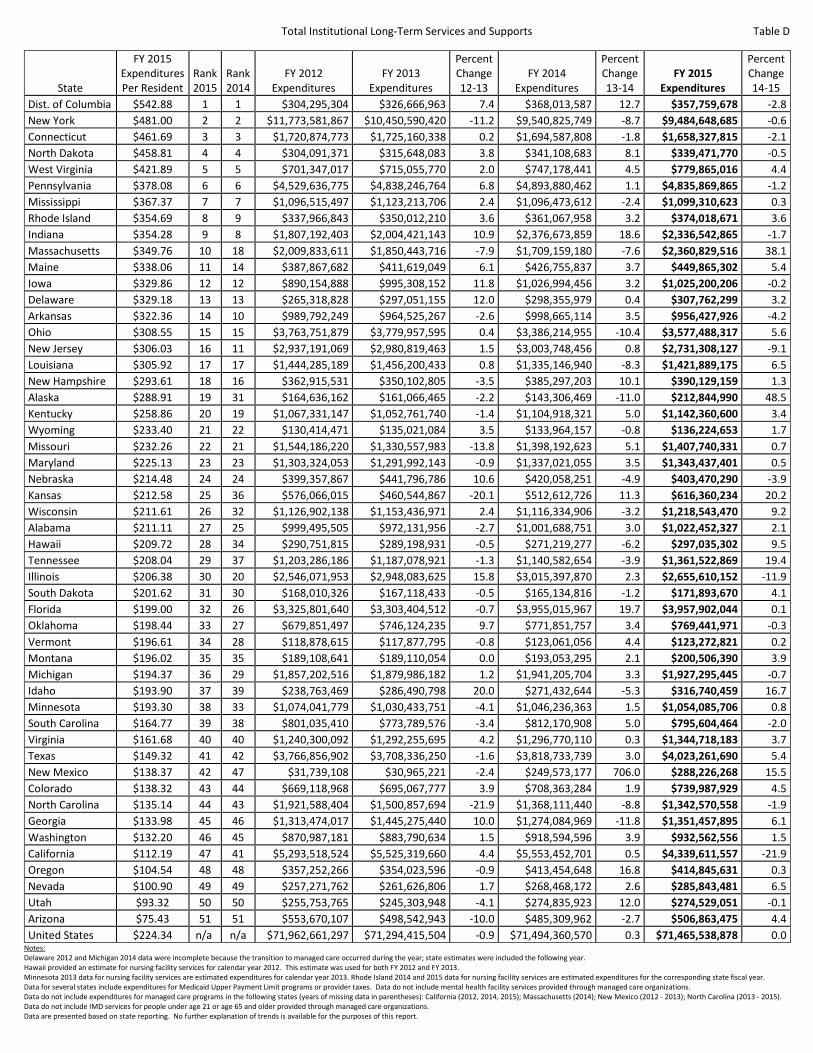
D: Total Institutional Long-Term Services and Supports
E: Nursing Facilities
F: Intermediate Care Facilities for Individuals with Intellectual Disabilities (ICF/IID)
G: Institution for Mental Disease Services for Individuals Age 65 or Older and/or Under Age 21
H: Mental Health Facilities – Disproportionate Share Hospital Payments
I: Institutional Managed LTSS – Unspecified
J: Total Home and Community-Based Services
K: Section 1915(c) Waivers
L: Personal Care
M: Home Health
N: Community First Choice
O: Case Management
P: Rehabilitative Services (non-school based)
Q: HCBS – Unspecified
R: Program of All-Inclusive Care for the Elderly (PACE)
S: Private Duty Nursing
T: State Plan HCBS (Section 1915(i))
U: Self-Directed Personal Assistance Services (Section 1915(j)) as an Alternative to Section 1915(c)
Waivers
V: Self-Directed Personal Assistance Services (Section 1915(j)) as an Alternative to Personal Care
W: Health Homes
X: Money Follows the Person Demonstration
Y: Total Long-Term Services and Supports
Z: Section 1915(c) Waivers for Older Adults and People with Physical Disabilities
AA: Section 1915(c) Waivers for People with Developmental Disabilities
AB: Section 1915(c) Waivers for Behavioral Health Services
AC: Section 1915(c) Waivers for Other Populations
Medicaid Expenditures for Long-Term Services and Supports in FY 2015 29
AD: HCBS – Unspecified for Older Adults and People with Physical Disabilities
AE: HCBS – Unspecified for People with Developmental Disabilities
AF: HCBS – Unspecified for Other Populations
AG: State Plan HCBS (Section 1915(i)) for Older Adults and People with Physical Disabilities
AH: State Plan HCBS (Section 1915(i)) for People with Developmental Disabilities
AI: State Plan HCBS (Section 1915(i)) for Behavioral Health Services
AJ: Health Homes for Older Adults and People with Physical Disabilities
AK: Health Homes for Behavioral Health Services
AL: Health Homes for Other Populations or Multiple Populations
AM: ICF/IID - Public
AN: ICF/IID - Private
Table AO: Total Medicaid Expenditures- States Rank Order
Table AP: Total Medicaid Expenditures- States Alphabetical Order
Table AQ: Balancing Incentive Program
Tables AR-AU: Percentage of LTSS for HCBS
AR: Percentage of LTSS for HCBS
AS: Percentage of LTSS for HCBS: Services for Older Adults and People with Physical Disabilities
AT: Percentage of LTSS for HCBS: Services for People with Developmental Disabilities
AU: Percentage of LTSS for HCBS: Behavioral Health Services
Tables AV-AY: Selected Additional Services (Non-LTSS) By State, FY 2012 – FY 2015
AV: Inpatient Hospital
AW: Inpatient Hospital - Disproportionate Share Hospital Payments
AX: Medicaid Managed Care Premiums
AY: Drugs
Tables AZ – BO: Managed LTSS Expenditures By State, FY 2012 – FY 2015
Table AZ: Managed Care Institutional LTSS Expenditures
Table BA: Managed Care Nursing Facility Expenditures
Table BB: Managed Care ICF/IID Expenditures
Table BC: Managed Care Institutional LTSS Expenditures - Unspecified
Table BD: Managed Care HCBS Expenditures
Table BE: Managed Care 1915(c) Waiver Expenditures

Medicaid Expenditures for Long-Term Services and Supports in FY 2015 30
Table BF: Managed Care Personal Care Expenditures
Table BG: Managed Care Home Health Expenditures
Table BH: Managed Care HCBS – Unspecified
Table BI: Total Managed Care LTSS
Table BJ: Managed Care 1915(c) Waiver Expenditures for Older Adults and People with Physical Disabilities
Table BK: Managed Care 1915(c) Waiver Expenditures for People with Developmental Disabilities
Table BL: Managed Care 1915(c) Waiver Expenditures for Other Populations
Table BM: Managed Care HCBS – Unspecified for Older Adults and People with Physical Disabilities
Table BN: Managed Care HCBS – Unspecified for People with Developmental Disabilities
Table BO: Managed Care HCBS – Unspecified for Other Populations
Tables 1-51: LTSS Summary Tables by State and the District of Columbia, in Alphabetical Order

Medicaid Expenditures for Long-Term Services and Supports in FY 2015 31
Abbreviations in Attached Data Tables
ACRG – annual compound rate of growth
AD - older adults and people with physical disabilities (previously used for aging/disability)
BHS – behavioral health services
DD - developmental disabilities
DSH - disproportionate share hospital payments
FY – fiscal year
HCBS - home and community-based services
ICF/IID - intermediate care facilities for individuals with intellectual disabilities
IMD - institutions for mental disease
LTSS - long-term services and supports
MFP - Money Follows the Person
MLTSS - managed long-term services and supports
PACE - Program of All-inclusive Care for the Elderly
PAS – personal assistance services
PD – physical disabilities

Medicaid Expenditures for Long-Term Services and Supports: 2012-2015 (in thousands of dollars)
Table A
Type of Service FY 2012 Expenditures
FY 2013 Expenditures
Percent Change
FY 2014 Expenditures
Percent Change
FY 2015 Expenditures
Percent Change ACRG
Total institutional LTSS $71,962,661 $71,294,416 -0.9 $71,494,361 0.3 $71,465,539 0.0 -0.2% Nursing facilities $52,604,473 $53,630,347 2.0 $54,707,579 2.0 $54,832,318 0.2 1.4% ICF/IID $13,230,574 $11,503,030 -13.1 $10,437,069 -9.3 $10,764,687 3.1 -6.6% IMD for people under age 21 or age 65 and older $3,132,722 $3,063,737 -2.2 $2,728,539 -10.9 $2,739,968 0.4 -4.4% Mental health facilities DSH $2,994,892 $2,915,425 -2.7 $2,922,444 0.2 $2,677,969 -8.4 -3.7% Institutional MLTSS – unspecified $0 $181,876 100.0 $698,730 284.2 $450,597 -35.5 57.4% Total HCBS $69,576,499 $75,113,977 8.0 $81,108,144 8.0 $86,735,496 6.9 7.6% 1915(c) waivers $39,320,133 $40,720,241 3.6 $41,367,149 1.6 $44,634,344 7.9 4.3% Personal care $10,936,425 $12,092,833 10.6 $14,315,582 18.4 $13,280,401 -7.2 6.7% Home health $5,167,230 $4,901,394 -5.1 $4,665,534 -4.8 $4,757,275 2.0 -2.7% Community first choice $4,236,541 $4,652,860 9.8 $4,554,995 -2.1 $7,555,048 65.9 21.3% Case management $2,777,837 $2,540,414 -8.5 $2,747,066 8.1 $2,568,686 -6.5 -2.6% Rehabilitative services $2,759,436 $3,085,118 11.8 $3,382,870 9.7 $3,490,890 3.2 8.2% HCBS - unspecified $1,973,655 $3,589,541 81.9 $6,525,806 81.8 $6,493,398 -0.5 48.7% PACE $1,057,715 $1,175,192 11.1 $1,360,946 15.8 $1,463,260 7.5 11.4% Private duty nursing $704,996 $768,474 9.0 $807,129 5.0 $720,530 -10.7 0.7% State plan HCBS $41,251 $627,840 1422.0 $387,848 -38.2 $511,275 31.8 131.4% Self-directed PAS - alternative to 1915(c) $64,109 $71,576 11.6 $66,737 -6.8 $83,163 24.6 9.1% Self-directed PAS - alternative to personal care $132,757 $119,118 -10.3 $81,028 -32.0 $53,227 -34.3 -26.3% Health homes $114,687 $394,363 243.9 $443,942 12.6 $684,397 54.2 81.4% MFP demonstration $289,727 $375,013 29.4 $401,511 7.1 $439,603 9.5 14.9% Total LTSS $141,539,161 $146,408,393 3.4 $152,602,505 4.2 $158,201,035 3.7 3.8% Total Medicaid $419,825,573 $437,862,911 4.3 $476,820,651 8.9 $524,287,389 10.0 7.7% Balancing Incentive Program $39,790 $434,783 992.7 $748,419 72.1 $946,633 26.5 187.6%
Notes: Expenditures are total Medicaid spending, including both federal and state payments. Data exclude expenditures for managed care programs in the following states (years of missing data in parentheses): California (2012, 2014, 2015); Massachusetts (2014); New Mexico (2012, 2013); North Carolina (2013 - 2015). Data for several states include expenditures for Medicaid Upper Payment Limit programs or provider taxes. IMD for people under age 21 or age 65 and older, case management, rehabilitative services, private duty nursing, state plan HCBS, and health homes data do not include services provided through managed care organizations. Institutional MLTSS - unspecified refers to institutional LTSS provided through managed care organizations and reported on the CMS-64. The CMS-64 does not specify the type of institutional LTSS. HCBS - unspecified refers to HCBS provided through managed care organizations and fee-for-service HCBS provided in section 1115 demonstrations that were not authorized under another state plan or waiver authority. Balancing Incentive Program expenditures include only enhanced federal payments to states for HCBS. These enhanced federal payments are in addition to the federal share of expenditures for these services. Balancing Incentive Program expenditures are not included in the calculation of total LTSS because the program does not increase total expenditures - it increases the federal share of spending.
Sources: CMS-64 data reported through the first two quarters of FY 2016, Centers for Medicare & Medicaid Services, Division of Financial Operations Data provided to Truven Health Analytics by states for services provided through managed care organizations and for fee-for-service HCBS provided in section 1115 demonstrations that are not identified as LTSS in the CMS-64 Money Follows the Person web-based report data provided by Mathematica Policy Research

Medicaid Expenditures for Long-Term Services and Supports by Target Population: 2009-2014 (in thousands of dollars)
Table B
Type of Service FY 2012 Expenditures
FY 2013 Expenditures
Percent Change
FY 2014 Expenditures
Percent Change
FY 2015 Expenditures
Percent Change ACRG
Total-Older Adults & People with PD $85,894,204 $89,648,189 4.4 $92,892,322 3.6 $97,502,065 5.0 4.3% Nursing facilities $52,604,473 $53,630,347 2.0 $54,707,579 2.0 $54,832,318 0.2 1.4% Personal care $10,936,425 $12,092,833 10.6 $14,315,582 18.4 $13,280,401 -7.2 6.7% 1915(c) waivers - AD $10,000,043 $10,667,710 6.7 $10,399,323 -2.5 $11,448,724 10.1 4.6% Home health $5,167,230 $4,901,394 -5.1 $4,665,534 -4.8 $4,757,275 2.0 -2.7% Community first choice $4,236,541 $4,652,860 9.8 $4,554,995 -2.1 $7,555,048 65.9 21.3% HCBS - unspecified - AD $932,409 $1,496,341 60.5 $1,931,300 29.1 $3,305,107 71.1 52.5% PACE $1,057,715 $1,175,192 11.1 $1,360,946 15.8 $1,463,260 7.5 11.4% Private duty nursing $704,996 $768,474 9.0 $807,129 5.0 $720,530 -10.7 0.7% Self-directed PAS - alternative to 1915(c) $64,109 $71,576 11.6 $66,737 -6.8 $83,163 24.6 9.1% Self-directed PAS - alternative to personal care $132,757 $119,118 -10.3 $81,028 -32.0 $53,227 -34.3 -26.3% Health homes - AD $54,661 $69,975 28.0 $0 -100.0 $0 0.0 -100.0% State plan HCBS - AD $2,845 $2,369 -16.7 $2,169 -8.5 $3,012 38.9 1.9% Total-People with DD $42,621,779 $42,208,592 -1.0 $41,707,079 -1.2 $44,367,924 6.4 1.3% ICF/IID $13,230,574 $11,503,030 -13.1 $10,437,069 -9.3 $10,764,687 3.1 -6.6% 1915(c) waivers - DD $28,346,687 $29,088,403 2.6 $29,815,597 2.5 $32,000,819 7.3 4.1% HCBS - unspecified - DD $1,033,330 $1,083,331 4.8 $1,167,155 7.7 $1,190,157 2.0 4.8% State plan HCBS - DD $11,188 $533,828 4671.5 $287,258 -46.2 $412,261 43.5 232.8% Total-Behavioral Health Services $9,097,028 $9,393,891 3.3 $9,417,310 0.2 $9,373,060 -0.5 1.0% IMD for people under age 21 or age 65 and older $3,132,722 $3,063,737 -2.2 $2,728,539 -10.9 $2,739,968 0.4 -4.4% Mental health facilities DSH $2,994,892 $2,915,425 -2.7 $2,922,444 0.2 $2,677,969 -8.4 -3.7% Rehabilitative services $2,759,436 $3,085,118 11.8 $3,382,870 9.7 $3,490,890 3.2 8.2% 1915(c) waivers - BHS $144,835 $148,050 2.2 $212,353 43.4 $230,961 8.8 16.8% State plan HCBS - BHS $27,218 $91,643 236.7 $98,421 7.4 $96,002 -2.5 52.2% Health homes - BHS $37,925 $89,918 137.1 $72,683 -19.2 $137,270 88.9 23.6% Total-Other/Multiple Populations $3,926,149 $5,157,719 31.4 $8,585,792 66.5 $6,957,988 -19.0 21.0% Case management $2,777,837 $2,540,414 -8.5 $2,747,066 8.1 $2,568,686 -6.5 -2.6% 1915(c) waivers - other $828,568 $816,077 -1.5 $939,875 15.2 $953,840 1.5 4.8% HCBS - unspecified - other $7,916 $1,009,869 12657.5 $3,427,351 239.4 $1,998,135 -41.7 532.0% Health homes - other or multiple $22,101 $234,470 960.9 $371,259 58.3 $547,127 47.4 52.8% Institutional MLTSS – unspecified $0 $181,876 100.0 $698,730 284.2 $450,597 -35.5 57.4% MFP demonstration $289,727 $375,013 29.4 $401,511 7.1 $439,603 9.5 14.9% Total LTSS $141,539,161 $146,408,393 3.4 $152,602,505 4.2 $158,201,035 3.7 3.8%
Notes: Expenditures are total Medicaid spending, including both federal and state payments. Data exclude expenditures for managed care programs in the following states (years of missing data in parentheses): California (2012, 2014, 2015); Massachusetts (2014); New Mexico (2012, 2013); North Carolina (2013 - 2015). Data for several states include expenditures for Medicaid Upper Payment Limit programs or provider taxes. IMD for people under age 21 or age 65 and older, case management, rehabilitative services, private duty nursing, state plan HCBS, and health homes data do not include services provided through managed care organizations. Institutional MLTSS - unspecified refers to institutional LTSS provided through managed care organizations and reported on the CMS-64. The CMS-64 does not specify the type of institutional LTSS. HCBS - unspecified refers to HCBS provided through managed care organizations and fee-for-service HCBS provided in section 1115 demonstrations that were not authorized under another state plan or waiver authority.
Sources: CMS-64 data reported through the first two quarters of FY 2016, Centers for Medicare & Medicaid Services, Division of Financial Operations Data provided to Truven Health Analytics by states for services provided through managed care organizations and for fee-for-service HCBS provided in section 1115 demonstrations that are not identified as LTSS in the CMS-64 Money Follows the Person web-based report data provided by Mathematica Policy Research

State Summary Table: Medicaid Expenditures for Long-Term Services and Supports, FY 2015 Table C (in thousands of dollars)
State Total
Institutional Nursing Facilities ICF/IID
Other Institutional
LTSS Total HCBS 1915(c) Waivers
Personal Care Other HCBS Total
Percent HCBS
Oregon $414,846 $388,305 $0 $26,541 $1,913,040 $71,717 $33,995 $1,807,328 $2,327,885 82.2% New Mexico $288,226 $260,091 $26,286 $1,849 $1,062,071 $321,242 $0 $740,829 $1,350,297 78.7% Minnesota $1,054,086 $780,647 $167,948 $105,491 $3,470,010 $2,254,469 $745,723 $469,818 $4,524,096 76.7% Arizona $506,863 $448,951 $27,513 $30,400 $1,170,466 $0 $1,330 $1,169,136 $1,677,329 69.8% Vermont $123,273 $121,984 $1,287 $2 $278,667 $0 $30,516 $248,151 $401,940 69.3% Washington $932,563 $644,037 $125,308 $163,217 $1,993,802 $1,253,747 $441,682 $298,373 $2,926,365 68.1% Massachusetts $2,360,830 $1,814,969 $406,467 $139,394 $4,456,345 $1,319,846 $1,060,509 $2,075,990 $6,817,174 65.4% Wisconsin $1,218,543 $1,059,237 $143,626 $15,681 $2,275,598 $1,632,839 $467,782 $174,977 $3,494,142 65.1% Colorado $739,988 $694,011 $38,769 $7,208 $1,377,220 $756,536 $0 $620,683 $2,117,208 65.0% Alaska $212,845 $181,745 $2,839 $28,261 $358,822 $273,281 $84,602 $939 $571,667 62.8% New York $9,484,649 $6,882,589 $1,862,066 $739,993 $13,325,817 $5,586,277 $4,639,054 $3,100,487 $22,810,466 58.4% Missouri $1,407,740 $1,068,006 $104,679 $235,056 $1,934,093 $826,663 $606,357 $501,073 $3,341,834 57.9% Texas $4,023,262 $2,640,412 $1,109,208 $273,642 $5,524,409 $1,272,553 $2,358,006 $1,893,850 $9,547,671 57.9% Rhode Island $374,019 $361,594 $7,928 $4,497 $501,134 $0 $0 $501,134 $875,153 57.3% Montana $200,506 $165,541 $11,604 $23,362 $268,142 $138,338 $10,294 $119,510 $468,648 57.2% Maryland $1,343,437 $1,174,675 $19,596 $149,166 $1,747,289 $977,274 $32,558 $737,457 $3,090,726 56.5% Virginia $1,344,718 $948,887 $231,508 $164,323 $1,674,976 $1,379,836 $37,095 $258,044 $3,019,694 55.5% Maine $449,865 $277,016 $78,945 $93,905 $541,496 $365,800 $73,869 $101,828 $991,362 54.6% Dist. of Columbia $357,760 $232,784 $95,400 $29,576 $426,360 $223,130 $165,424 $37,807 $784,120 54.4% Nevada $285,843 $214,753 $17,047 $54,043 $330,022 $106,956 $89,603 $133,463 $615,866 53.6% New Hampshire $390,129 $341,826 $8,891 $39,412 $422,879 $290,254 $4,482 $128,142 $813,008 52.0% Arkansas $956,428 $661,360 $178,581 $116,488 $1,034,362 $320,755 $101,523 $612,085 $1,990,790 52.0% Iowa $1,025,200 $623,815 $296,445 $104,940 $1,106,581 $636,540 $0 $470,041 $2,131,781 51.9% Utah $274,529 $190,765 $67,321 $16,443 $288,971 $250,201 $2,925 $35,846 $563,500 51.3% Idaho $316,740 $266,129 $48,890 $1,722 $332,128 $289,790 $22,867 $19,471 $648,868 51.2% Nebraska $403,470 $340,032 $61,951 $1,487 $416,579 $349,137 $20,620 $46,823 $820,049 50.8% Connecticut $1,658,328 $1,197,886 $264,688 $195,754 $1,702,323 $1,306,520 $0 $395,803 $3,360,650 50.7% Ohio $3,577,488 $2,786,965 $697,090 $93,433 $3,655,975 $2,314,893 $0 $1,341,082 $7,233,463 50.5% Kansas $616,360 $525,010 $65,229 $26,122 $602,892 $532,354 $0 $70,539 $1,219,252 49.4% Wyoming $136,225 $103,148 $19,960 $13,117 $131,438 $113,396 $0 $18,041 $267,662 49.1% Tennessee $1,361,523 $1,096,127 $214,439 $50,957 $1,265,929 $674,680 $0 $591,249 $2,627,452 48.2% South Carolina $795,604 $583,852 $135,213 $76,539 $732,647 $518,956 $12,111 $201,579 $1,528,252 47.9% South Dakota $171,894 $138,775 $29,565 $3,554 $157,893 $131,689 $1,088 $25,117 $329,787 47.9% West Virginia $779,865 $606,591 $67,562 $105,712 $698,352 $462,644 $75,896 $159,812 $1,478,217 47.2% Georgia $1,351,458 $1,289,089 $46,293 $16,077 $1,210,134 $985,286 $0 $224,848 $2,561,592 47.2% Pennsylvania $4,835,870 $3,848,905 $618,319 $368,646 $4,206,394 $3,854,456 $0 $351,938 $9,042,264 46.5% Illinois $2,655,610 $1,428,479 $673,181 $553,950 $2,227,619 $1,864,036 $0 $363,583 $4,883,229 45.6% Oklahoma $769,442 $577,093 $97,513 $94,836 $631,444 $516,448 $11,980 $103,017 $1,400,886 45.1% Delaware $307,762 $272,899 $28,774 $6,089 $250,455 $115,476 $20,895 $114,084 $558,217 44.9% New Jersey $2,731,308 $1,759,936 $508,434 $462,939 $2,158,483 $964,171 $63,974 $1,130,337 $4,889,791 44.1% Alabama $1,022,452 $944,141 $2,060 $76,252 $743,073 $398,926 $0 $344,147 $1,765,526 42.1% North Dakota $339,472 $226,606 $98,852 $14,013 $246,587 $189,426 $22,595 $34,567 $586,059 42.1% Kentucky $1,142,361 $957,640 $140,521 $44,200 $805,336 $741,504 $0 $63,832 $1,947,696 41.3% Michigan $1,927,295 $1,782,637 $0 $144,658 $1,302,516 $772,445 $320,395 $209,677 $3,229,812 40.3% Hawaii $297,035 $287,794 $9,242 $0 $200,674 $107,394 $0 $93,280 $497,709 40.3% Louisiana $1,421,889 $963,115 $383,417 $75,357 $859,200 $587,780 $201,295 $70,126 $2,281,090 37.7% Indiana $2,336,543 $2,006,714 $275,915 $53,913 $1,185,597 $841,392 $0 $344,205 $3,522,139 33.7% Florida $3,957,902 $3,472,597 $334,093 $151,212 $1,941,997 $1,588,110 $77,749 $276,138 $5,899,899 32.9% Mississippi $1,099,311 $761,814 $263,051 $74,445 $483,810 $381,866 $0 $101,944 $1,583,121 30.6% California $4,339,612 $3,250,424 $648,762 $440,426 $9,392,520 $2,724,901 $979,369 $5,688,251 $13,732,132 n/a North Carolina $1,342,571 $1,179,921 $2,415 $160,235 $1,710,928 $1,048,416 $462,241 $200,271 $3,053,499 n/a United States $71,465,539 $54,832,318 $10,764,687 $5,868,534 $86,735,496 $44,634,344 $13,280,401 $28,820,751 $158,201,035 54.8%
Notes: Data do not include expenditures for managed care programs in California and North Carolina. Percent HCBS is not calculated for these states because a significant portion of data are missing. Data for several states include expenditures for Medicaid Upper Payment Limit programs or provider taxes. IMD for people under age 21 or age 65 and older, case management, rehabilitative services, private duty nursing, state plan HCBS, and health homes data do not include services provided through managed care organizations.
5
10
15
20
25
30
35
40
45
50
Total Institutional Long-Term Services and Supports Table D
State
FY 2015 Expenditures Per Resident
Rank 2015
Rank 2014
FY 2012 Expenditures
FY 2013 Expenditures
Percent Change 12-13
FY 2014 Expenditures
Percent Change 13-14
FY 2015 Expenditures
Percent Change 14-15
Dist. of Columbia $542.88 1 1 $304,295,304 $326,666,963 7.4 $368,013,587 12.7 $357,759,678 -2.8 New York $481.00 2 2 $11,773,581,867 $10,450,590,420 -11.2 $9,540,825,749 -8.7 $9,484,648,685 -0.6 Connecticut $461.69 3 3 $1,720,874,773 $1,725,160,338 0.2 $1,694,587,808 -1.8 $1,658,327,815 -2.1 North Dakota $458.81 4 4 $304,091,371 $315,648,083 3.8 $341,108,683 8.1 $339,471,770 -0.5 West Virginia $421.89 5 $701,347,017 $715,055,770 2.0 $747,178,441 4.5 $779,865,016 4.4 Pennsylvania $378.08 6 6 $4,529,636,775 $4,838,246,764 6.8 $4,893,880,462 1.1 $4,835,869,865 -1.2 Mississippi $367.37 7 7 $1,096,515,497 $1,123,213,706 2.4 $1,096,473,612 -2.4 $1,099,310,623 0.3 Rhode Island $354.69 8 9 $337,966,843 $350,012,210 3.6 $361,067,958 3.2 $374,018,671 3.6 Indiana $354.28 9 8 $1,807,192,403 $2,004,421,143 10.9 $2,376,673,859 18.6 $2,336,542,865 -1.7 Massachusetts $349.76 18 $2,009,833,611 $1,850,443,716 -7.9 $1,709,159,180 -7.6 $2,360,829,516 38.1 Maine $338.06 11 14 $387,867,682 $411,619,049 6.1 $426,755,837 3.7 $449,865,302 5.4 Iowa $329.86 12 12 $890,154,888 $995,308,152 11.8 $1,026,994,456 3.2 $1,025,200,206 -0.2 Delaware $329.18 13 13 $265,318,828 $297,051,155 12.0 $298,355,979 0.4 $307,762,299 3.2 Arkansas $322.36 14 10 $989,792,249 $964,525,267 -2.6 $998,665,114 3.5 $956,427,926 -4.2 Ohio $308.55 15 $3,763,751,879 $3,779,957,595 0.4 $3,386,214,955 -10.4 $3,577,488,317 5.6 New Jersey $306.03 16 11 $2,937,191,069 $2,980,819,463 1.5 $3,003,748,456 0.8 $2,731,308,127 -9.1 Louisiana $305.92 17 17 $1,444,285,189 $1,456,200,433 0.8 $1,335,146,940 -8.3 $1,421,889,175 6.5 New Hampshire $293.61 18 16 $362,915,531 $350,102,805 -3.5 $385,297,203 10.1 $390,129,159 1.3 Alaska $288.91 19 31 $164,636,162 $161,066,465 -2.2 $143,306,469 -11.0 $212,844,990 48.5 Kentucky $258.86 19 $1,067,331,147 $1,052,761,740 -1.4 $1,104,918,321 5.0 $1,142,360,600 3.4 Wyoming $233.40 21 22 $130,414,471 $135,021,084 3.5 $133,964,157 -0.8 $136,224,653 1.7 Missouri $232.26 22 21 $1,544,186,220 $1,330,557,983 -13.8 $1,398,192,623 5.1 $1,407,740,331 0.7 Maryland $225.13 23 23 $1,303,324,053 $1,291,992,143 -0.9 $1,337,021,055 3.5 $1,343,437,401 0.5 Nebraska $214.48 24 24 $399,357,867 $441,796,786 10.6 $420,058,251 -4.9 $403,470,290 -3.9 Kansas $212.58 36 $576,066,015 $460,544,867 -20.1 $512,612,726 11.3 $616,360,234 20.2 Wisconsin $211.61 26 32 $1,126,902,138 $1,153,436,971 2.4 $1,116,334,906 -3.2 $1,218,543,470 9.2 Alabama $211.11 27 25 $999,495,505 $972,131,956 -2.7 $1,001,688,751 3.0 $1,022,452,327 2.1 Hawaii $209.72 28 34 $290,751,815 $289,198,931 -0.5 $271,219,277 -6.2 $297,035,302 9.5 Tennessee $208.04 29 37 $1,203,286,186 $1,187,078,921 -1.3 $1,140,582,654 -3.9 $1,361,522,869 19.4 Illinois $206.38 20 $2,546,071,953 $2,948,083,625 15.8 $3,015,397,870 2.3 $2,655,610,152 -11.9 South Dakota $201.62 31 30 $168,010,326 $167,118,433 -0.5 $165,134,816 -1.2 $171,893,670 4.1 Florida $199.00 32 26 $3,325,801,640 $3,303,404,512 -0.7 $3,955,015,967 19.7 $3,957,902,044 0.1 Oklahoma $198.44 33 27 $679,851,497 $746,124,235 9.7 $771,851,757 3.4 $769,441,971 -0.3 Vermont $196.61 34 28 $118,878,615 $117,877,795 -0.8 $123,061,056 4.4 $123,272,821 0.2 Montana $196.02 35 $189,108,641 $189,110,054 0.0 $193,053,295 2.1 $200,506,390 3.9 Michigan $194.37 36 29 $1,857,202,516 $1,879,986,182 1.2 $1,941,205,704 3.3 $1,927,295,445 -0.7 Idaho $193.90 37 39 $238,763,469 $286,490,798 20.0 $271,432,644 -5.3 $316,740,459 16.7 Minnesota $193.30 38 33 $1,074,041,779 $1,030,433,751 -4.1 $1,046,236,363 1.5 $1,054,085,706 0.8 South Carolina $164.77 39 38 $801,035,410 $773,789,576 -3.4 $812,170,908 5.0 $795,604,464 -2.0 Virginia $161.68 40 $1,240,300,092 $1,292,255,695 4.2 $1,296,770,110 0.3 $1,344,718,183 3.7 Texas $149.32 41 42 $3,766,856,902 $3,708,336,250 -1.6 $3,818,733,739 3.0 $4,023,261,690 5.4 New Mexico $138.37 42 47 $31,739,108 $30,965,221 -2.4 $249,573,177 706.0 $288,226,268 15.5 Colorado $138.32 43 44 $669,118,968 $695,067,777 3.9 $708,363,284 1.9 $739,987,929 4.5 North Carolina $135.14 44 43 $1,921,588,404 $1,500,857,694 -21.9 $1,368,111,440 -8.8 $1,342,570,558 -1.9 Georgia $133.98 46 $1,313,474,017 $1,445,275,440 10.0 $1,274,084,969 -11.8 $1,351,457,895 6.1 Washington $132.20 46 45 $870,987,181 $883,790,634 1.5 $918,594,596 3.9 $932,562,556 1.5 California $112.19 47 41 $5,293,518,524 $5,525,319,660 4.4 $5,553,452,701 0.5 $4,339,611,557 -21.9 Oregon $104.54 48 48 $357,252,266 $354,023,596 -0.9 $413,454,648 16.8 $414,845,631 0.3 Nevada $100.90 49 49 $257,271,762 $261,626,806 1.7 $268,468,172 2.6 $285,843,481 6.5 Utah $93.32 50 $255,753,765 $245,303,948 -4.1 $274,835,923 12.0 $274,529,051 -0.1 Arizona $75.43 51 51 $553,670,107 $498,542,943 -10.0 $485,309,962 -2.7 $506,863,475 4.4 United States $224.34 n/a n/a $71,962,661,297 $71,294,415,504 -0.9 $71,494,360,570 0.3 $71,465,538,878 0.0
Notes: Delaware 2012 and Michigan 2014 data were incomplete because the transition to managed care occurred during the year; state estimates were included the following year. Hawaii provided an estimate for nursing facility services for calendar year 2012. This estimate was used for both FY 2012 and FY 2013. Minnesota 2013 data for nursing facility services are estimated expenditures for calendar year 2013. Rhode Island 2014 and 2015 data for nursing facility services are estimated expenditures for the corresponding state fiscal year. Data for several states include expenditures for Medicaid Upper Payment Limit programs or provider taxes. Data do not include mental health facility services provided through managed care organizations. Data do not include expenditures for managed care programs in the following states (years of missing data in parentheses): California (2012, 2014, 2015); Massachusetts (2014); New Mexico (2012 - 2013); North Carolina (2013 - 2015). Data do not include IMD services for people under age 21 or age 65 and older provided through managed care organizations. Data are presented based on state reporting. No further explanation of trends is available for the purposes of this report.

5
10
15
20
25
30
35
40
45
50
Nursing Facilities Table E
State
FY 2015 Expenditures Per Resident
Rank 2015
Rank 2014
FY 2012 Expenditures
FY 2013 Expenditures
Percent Change 12-13
FY 2014 Expenditures
Percent Change 13-14
FY 2015 Expenditures
Percent Change 14-15
Dist. of Columbia $353.24 1 1 $216,525,388 $226,766,565 4.7 $245,851,596 8.4 $232,783,949 -5.3 New York $349.04 2 2 $7,275,624,053 $7,265,138,796 -0.1 $6,944,351,612 -4.4 $6,882,589,408 -0.9 Rhode Island $342.91 3 4 $323,345,787 $334,521,953 3.5 $347,534,642 3.9 $361,594,353 4.0 Connecticut $333.50 4 3 $1,257,493,079 $1,250,852,152 -0.5 $1,217,243,251 -2.7 $1,197,886,175 -1.6 West Virginia $328.15 7 $534,038,607 $539,260,544 1.0 $566,939,083 5.1 $606,591,246 7.0 North Dakota $306.26 6 5 $202,278,684 $211,746,851 4.7 $230,672,295 8.9 $226,606,268 -1.8 Indiana $304.27 7 6 $1,456,880,644 $1,664,519,024 14.3 $2,015,823,343 21.1 $2,006,714,494 -0.5 Pennsylvania $300.92 8 8 $3,572,703,412 $3,837,512,888 7.4 $3,895,811,411 1.5 $3,848,904,521 -1.2 Delaware $291.89 9 9 $217,552,043 $259,320,978 19.2 $262,438,641 1.2 $272,898,967 4.0 Massachusetts $268.89 13 $1,741,645,002 $1,746,652,894 0.3 $1,502,863,463 -14.0 $1,814,969,019 20.8 New Hampshire $257.25 11 10 $324,511,092 $317,801,107 -2.1 $356,936,305 12.3 $341,825,520 -4.2 Mississippi $254.58 12 11 $756,786,480 $788,640,228 4.2 $748,045,679 -5.1 $761,814,277 1.8 Alaska $246.70 13 33 $130,958,260 $126,926,088 -3.1 $109,824,410 -13.5 $181,744,927 65.5 Ohio $240.37 14 14 $2,454,341,021 $2,450,452,939 -0.2 $2,563,370,981 4.6 $2,786,965,428 8.7 Arkansas $222.91 12 $664,352,720 $641,411,420 -3.5 $667,625,722 4.1 $661,359,518 -0.9 Kentucky $217.00 16 15 $842,711,716 $832,336,912 -1.2 $921,734,636 10.7 $957,639,715 3.9 Maine $208.17 17 19 $225,628,586 $237,891,541 5.4 $258,192,169 8.5 $277,015,869 7.3 Louisiana $207.22 18 22 $861,079,897 $923,695,431 7.3 $882,892,618 -4.4 $963,114,626 9.1 Hawaii $203.19 19 23 $281,926,821 $280,867,064 -0.4 $262,418,045 -6.6 $287,793,558 9.7 Iowa $200.71 17 $579,119,404 $579,431,770 0.1 $621,178,560 7.2 $623,815,460 0.4 New Jersey $197.19 21 16 $1,823,551,529 $1,828,596,548 0.3 $1,840,133,277 0.6 $1,759,935,928 -4.4 Maryland $196.85 22 18 $1,145,380,412 $1,142,712,350 -0.2 $1,166,267,462 2.1 $1,174,675,454 0.7 Alabama $194.94 23 21 $920,037,327 $902,847,111 -1.9 $928,618,105 2.9 $944,140,551 1.7 Vermont $194.56 24 20 $117,665,805 $116,670,437 -0.8 $121,806,559 4.4 $121,983,664 0.1 Wisconsin $183.95 29 $914,390,660 $972,521,977 6.4 $939,100,221 -3.4 $1,059,236,756 12.8 Kansas $181.08 26 35 $441,180,030 $354,047,350 -19.7 $424,629,181 19.9 $525,009,590 23.6 Nebraska $180.76 27 24 $326,999,066 $334,682,262 2.3 $342,167,900 2.2 $340,031,830 -0.6 Michigan $179.78 28 25 $1,726,576,417 $1,769,563,738 2.5 $1,781,042,486 0.6 $1,782,636,993 0.1 Wyoming $176.73 29 27 $100,954,262 $102,017,436 1.1 $101,531,460 -0.5 $103,147,531 1.6 Missouri $176.21 28 $938,653,877 $982,937,986 4.7 $1,048,328,084 6.7 $1,068,005,677 1.9 Florida $174.60 31 26 $2,810,830,349 $2,839,666,292 1.0 $3,500,974,407 23.3 $3,472,597,367 -0.8 Tennessee $167.48 32 36 $955,101,277 $910,665,547 -4.7 $890,647,225 -2.2 $1,096,126,979 23.1 Idaho $162.92 33 37 $214,021,785 $236,244,853 10.4 $220,548,973 -6.6 $266,128,559 20.7 South Dakota $162.77 34 31 $135,051,804 $132,970,013 -1.5 $130,037,952 -2.2 $138,775,106 6.7 Montana $161.84 30 $162,086,707 $160,723,463 -0.8 $161,607,970 0.6 $165,540,894 2.4 Oklahoma $148.83 36 32 $498,177,896 $561,789,425 12.8 $581,994,265 3.6 $577,092,726 -0.8 Minnesota $143.16 37 34 $816,475,470 $781,797,797 -4.2 $800,276,281 2.4 $780,646,726 -2.5 Colorado $129.73 38 38 $626,222,510 $642,321,149 2.6 $659,410,571 2.7 $694,010,946 5.2 Georgia $127.79 39 39 $1,217,913,647 $1,355,543,910 11.3 $1,229,040,946 -9.3 $1,289,088,662 4.9 New Mexico $124.86 44 $2,701,522 $3,337,030 23.5 $221,914,192 6550.1 $260,091,378 17.2 South Carolina $120.92 41 42 $553,342,116 $531,556,194 -3.9 $569,196,129 7.1 $583,852,291 2.6 North Carolina $118.77 42 40 $1,223,405,314 $1,160,063,770 -5.2 $1,206,575,260 4.0 $1,179,920,815 -2.2 Virginia $114.08 43 45 $825,304,290 $847,679,689 2.7 $870,847,862 2.7 $948,886,864 9.0 Illinois $111.01 44 41 $1,697,844,454 $1,779,248,949 4.8 $1,572,061,927 -11.6 $1,428,479,149 -9.1 Texas $97.99 47 $2,402,042,262 $2,364,892,340 -1.5 $2,461,017,294 4.1 $2,640,412,056 7.3 Oregon $97.85 46 46 $331,367,454 $331,445,397 0.0 $386,549,973 16.6 $388,304,626 0.5 Washington $91.30 47 48 $614,400,345 $609,838,648 -0.7 $628,660,165 3.1 $644,037,493 2.4 California $84.03 48 43 $4,280,502,519 $4,555,436,357 6.4 $4,488,887,181 -1.5 $3,250,424,448 -27.6 Nevada $75.80 49 49 $191,084,172 $190,989,542 0.0 $203,010,450 6.3 $214,752,988 5.8 Arizona $66.81 50 $497,497,992 $440,882,892 -11.4 $425,010,024 -3.6 $448,951,277 5.6 Utah $64.85 51 51 $174,207,461 $170,909,468 -1.9 $183,936,372 7.6 $190,765,138 3.7 United States $172.12 n/a n/a $52,604,473,427 $53,630,347,065 2.0 $54,707,578,616 2.0 $54,832,317,760 0.2
Notes: Delaware 2012 and Michigan 2014 data were incomplete because the transition to managed care occurred during that year; state estimates were included starting the following year. Hawaii provided an estimate for calendar year 2012. This estimate was used for both FY 2012 and FY 2013. Minnesota 2013 data are estimated expenditures for calendar year 2013. Rhode Island 2014 and 2015 data for nursing facility services are estimated expenditures for the corresponding state fiscal year. Data for several states include expenditures for Medicaid Upper Payment Limit programs or provider taxes. Data do not include expenditures for managed care programs in the following states (years of missing data in parentheses): California (2012, 2014, 2015); Massachusetts (2014); New Mexico (2012 - 2013). Data are presented based on state reporting. No further explanation of trends is available for the purposes of this report.

ICF/IID Table F
State
FY 2015 Expenditures Per Resident
Rank 2015
Rank 2014
FY 2012 Expenditures
FY 2013 Expenditures
Percent Change 12-13
FY 2014 Expenditures
Percent Change 13-14
FY 2015 Expenditures
Percent Change 14-15
Dist. of Columbia $144.76 1 1 $69,494,028 $85,877,825 23.6 $97,246,324 13.2 $95,400,125 -1.9 North Dakota $133.60 2 2 $92,083,981 $95,526,833 3.7 $96,871,153 1.4 $98,852,122 2.0 Iowa $95.38 3 3 $289,897,012 $316,611,835 9.2 $299,506,075 -5.4 $296,445,052 -1.0 New York $94.43 4 6 $3,382,394,941 $2,101,358,777 -37.9 $1,538,838,155 -26.8 $1,862,066,398 21.0 Mississippi $87.91 5 4 $270,287,227 $260,372,164 -3.7 $272,203,946 4.5 $263,051,282 -3.4 Louisiana $82.49 6 5 $467,516,687 $415,341,805 -11.2 $371,811,162 -10.5 $383,417,371 3.1 Connecticut $73.69 7 8 $284,641,964 $294,694,866 3.5 $257,577,351 -12.6 $264,688,024 2.8 Massachusetts $60.22 8 46 $165,995,204 $4,527,021 -97.3 $10,433,046 130.5 $406,466,544 3796.0 Arkansas $60.19 9 10 $168,540,154 $163,191,817 -3.2 $177,477,436 8.8 $178,580,760 0.6 Ohio $60.12 10 9 $757,787,874 $746,598,979 -1.5 $729,570,799 -2.3 $697,090,131 -4.5 Maine $59.32 11 12 $74,914,810 $74,201,995 -1.0 $76,545,930 3.2 $78,944,681 3.1 New Jersey $56.97 12 7 $650,873,269 $697,128,262 7.1 $664,348,972 -4.7 $508,433,602 -23.5 Illinois $52.32 13 11 $687,193,070 $857,008,817 24.7 $766,152,750 -10.6 $673,180,795 -12.1 Pennsylvania $48.34 14 13 $580,875,839 $617,959,269 6.4 $604,880,274 -2.1 $618,319,206 2.2 Indiana $41.84 15 14 $294,063,947 $283,377,424 -3.6 $292,285,560 3.1 $275,915,169 -5.6 Texas $41.17 16 15 $1,047,598,037 $1,085,409,036 3.6 $1,123,985,599 3.6 $1,109,207,954 -1.3 West Virginia $36.55 17 18 $65,414,249 $69,460,658 6.2 $67,466,117 -2.9 $67,561,689 0.1 South Dakota $34.68 18 17 $29,593,899 $30,171,490 2.0 $30,891,316 2.4 $29,564,601 -4.3 Wyoming $34.20 19 24 $20,744,605 $19,640,307 -5.3 $17,451,654 -11.1 $19,960,138 14.4 Nebraska $32.93 20 16 $57,653,500 $87,014,433 50.9 $73,980,276 -15.0 $61,951,022 -16.3 Tennessee $32.77 21 20 $216,276,177 $242,521,283 12.1 $212,769,533 -12.3 $214,438,673 0.8 Kentucky $31.84 22 21 $159,215,363 $175,466,890 10.2 $142,907,257 -18.6 $140,520,784 -1.7 Minnesota $30.80 23 23 $164,144,639 $161,687,144 -1.5 $167,228,969 3.4 $167,948,237 0.4 Delaware $30.78 24 22 $41,391,199 $31,266,202 -24.5 $29,913,432 -4.3 $28,773,967 -3.8 Idaho $29.93 25 25 $23,064,006 $48,640,003 110.9 $47,805,696 -1.7 $48,889,856 2.3 South Carolina $28.00 26 26 $155,037,462 $140,204,579 -9.6 $138,751,670 -1.0 $135,212,895 -2.6 Virginia $27.83 27 19 $288,115,881 $302,425,620 5.0 $280,884,985 -7.1 $231,508,249 -17.6 Oklahoma $25.15 28 28 $113,227,985 $111,630,604 -1.4 $92,179,420 -17.4 $97,513,437 5.8 Wisconsin $24.94 29 27 $197,495,917 $165,041,306 -16.4 $160,841,812 -2.5 $143,625,801 -10.7 Utah $22.88 30 29 $63,278,359 $63,077,229 -0.3 $65,484,990 3.8 $67,320,611 2.8 Kansas $22.50 31 30 $64,412,398 $63,473,900 -1.5 $61,238,528 -3.5 $65,228,609 6.5 Washington $17.76 32 31 $106,110,838 $117,875,887 11.1 $130,788,658 11.0 $125,308,027 -4.2 Missouri $17.27 33 32 $363,705,266 $111,493,402 -69.3 $110,781,530 -0.6 $104,678,994 -5.5 Florida $16.80 34 34 $328,459,559 $321,883,150 -2.0 $326,678,953 1.5 $334,092,690 2.3 California $16.77 35 33 $821,839,879 $792,112,187 -3.6 $701,060,430 -11.5 $648,761,500 -7.5 New Mexico $12.62 36 35 $24,809,317 $24,977,074 0.7 $25,888,375 3.6 $26,285,597 1.5 Montana $11.34 37 36 $11,320,106 $10,297,076 -9.0 $11,119,444 8.0 $11,603,797 4.4 Rhode Island $7.52 38 37 $9,159,578 $9,870,914 7.8 $9,004,728 -8.8 $7,927,749 -12.0 Colorado $7.25 39 38 $39,137,104 $46,501,048 18.8 $43,929,131 -5.5 $38,768,636 -11.7 New Hampshire $6.69 40 47 $3,252,890 $1,841,199 -43.4 $641,458 -65.2 $8,891,427 1286.1 Hawaii $6.53 41 40 $8,824,994 $8,331,867 -5.6 $8,801,232 5.6 $9,241,744 5.0 Nevada $6.02 42 39 $17,955,488 $17,737,664 -1.2 $18,575,749 4.7 $17,047,115 -8.2 Georgia $4.59 43 43 $67,117,294 $50,453,220 -24.8 $30,132,753 -40.3 $46,292,705 53.6 Arizona $4.09 44 41 $26,844,760 $26,949,532 0.4 $29,758,592 10.4 $27,512,500 -7.5 Alaska $3.85 45 42 $2,509,407 $3,191,791 27.2 $3,055,280 -4.3 $2,838,897 -7.1 Maryland $3.28 46 45 $123,036 $57,596 -53.2 $10,653,445 18396.8 $19,595,815 83.9 Vermont $2.05 47 44 $1,211,654 $1,201,518 -0.8 $1,254,497 4.4 $1,286,725 2.6 Alabama $0.43 48 49 $10,586,376 $1,794,349 -83.1 $1,582,232 -11.8 $2,060,212 30.2 North Carolina $0.24 49 48 $444,382,868 $145,336,731 -67.3 $3,831,981 -97.4 $2,415,197 -37.0 Michigan $0.00 n/a n/a $0 $215,843 100.0 $0 -100.0 $0 0.0 Oregon $0.00 n/a n/a $0 $0 0.0 $0 0.0 $0 0.0 United States $33.79 n/a n/a $13,230,574,097 $11,503,030,421 -13.1 $10,437,068,655 -9.3 $10,764,687,112 3.1
Notes: Data do not include expenditures for managed care programs in North Carolina (2013 - 2015). Data for several states include expenditures for Medicaid Upper Payment Limit programs or provider taxes. Data are presented based on state reporting. No further explanation of trends is available for the purposes of this report.

Institution for Mental Disease Services for Individuals Age 65 or Older and/or Under Age 21
5 Percent Percent
Table G
State
FY 201Expenditures Per Resident
Rank 2015
Rank 2014
FY 2012 Expenditures
FY 2013 Expenditures
Change 12-13
FY 2014 Expenditures
Change 13-14
FY 2015 Expenditures
Percent Change 14-15
West Virginia $46.98 1 2 $83,012,012 $87,446,909 5.3 $93,886,196 7.4 $86,842,803 -7.5 Arkansas $39.26 2 1 $156,080,025 $159,102,680 1.9 $152,742,606 -4.0 $116,487,648 -23.7 Maine $38.93 3 3 $46,082,625 $62,036,076 34.6 $52,688,788 -15.1 $51,810,935 -1.7 Dist. of Columbia $35.33 4 5 $11,730,753 $7,529,148 -35.8 $18,993,413 152.3 $23,283,707 22.6 Connecticut $25.11 5 4 $73,166,005 $74,039,595 1.2 $114,193,481 54.2 $90,179,892 -21.0 Mississippi $24.88 6 7 $69,441,790 $74,201,314 6.9 $76,223,987 2.7 $74,445,064 -2.3 Oklahoma $23.61 7 8 $67,627,310 $72,160,757 6.7 $94,404,824 30.8 $91,562,560 -3.0 Alaska $23.53 8 10 $17,400,719 $16,822,847 -3.3 $16,089,153 -4.4 $17,335,895 7.7 Montana $22.84 9 11 $15,701,828 $18,089,515 15.2 $20,325,881 12.4 $23,361,699 14.9 Wyoming $22.47 10 6 $8,715,604 $13,363,341 53.3 $14,981,043 12.1 $13,116,984 -12.4 New York $22.19 11 9 $510,562,873 $479,092,847 -6.2 $452,635,982 -5.5 $437,492,879 -3.3 Massachusetts $20.65 12 12 $102,193,405 $99,263,801 -2.9 $122,526,934 23.4 $139,393,953 13.8 Minnesota $19.35 13 18 $93,207,158 $86,750,812 -6.9 $78,719,554 -9.3 $105,490,743 34.0 Nevada $19.08 14 15 $48,232,102 $52,899,600 9.7 $46,881,973 -11.4 $54,043,378 15.3 Virginia $18.07 15 16 $126,879,921 $135,288,751 6.6 $135,640,318 0.3 $150,300,783 10.8 North Dakota $17.60 16 14 $8,740,228 $7,633,039 -12.7 $12,329,639 61.5 $13,024,902 5.6 Maryland $15.86 17 13 $106,182,937 $96,345,226 -9.3 $106,430,021 10.5 $94,637,284 -11.1 Alabama $15.74 18 17 $65,570,182 $67,490,496 2.9 $71,333,341 5.7 $76,251,564 6.9 New Jersey $11.83 19 19 $105,395,811 $95,383,334 -9.5 $106,260,435 11.4 $105,568,137 -0.7 California $11.39 20 21 $191,048,730 $177,594,053 -7.0 $362,984,471 104.4 $440,448,941 21.3 Tennessee $7.79 21 26 $31,908,732 $33,892,091 6.2 $37,165,896 9.7 $50,957,217 37.1 Indiana $7.52 22 24 $56,247,812 $47,124,901 -16.2 $46,460,842 -1.4 $49,599,031 6.8 Illinois $7.47 23 22 $72,087,738 $152,154,156 111.1 $109,083,941 -28.3 $96,125,582 -11.9 New Hampshire $5.81 24 34 $7,541,582 $7,447,459 -1.2 $2,605,674 -65.0 $7,723,274 196.4 Pennsylvania $5.66 25 25 $71,131,903 $73,891,899 3.9 $79,231,430 7.2 $72,449,864 -8.6 Utah $5.27 26 23 $16,396,929 $10,382,665 -36.7 $24,479,975 135.8 $15,508,716 -36.6 South Carolina $5.02 27 20 $40,332,230 $49,853,499 23.6 $55,153,912 10.6 $24,215,677 -56.1 Washington $4.39 28 30 $25,272,474 $27,823,193 10.1 $28,929,729 4.0 $30,996,868 7.1 Iowa $4.35 29 27 $21,138,472 $18,149,216 -14.1 $17,328,609 -4.5 $13,519,037 -22.0 Rhode Island $4.26 30 29 $5,461,478 $5,619,343 2.9 $4,528,588 -19.4 $4,496,569 -0.7 Missouri $4.15 31 28 $35,671,013 $28,892,056 -19.0 $27,964,542 -3.2 $25,179,896 -10.0 South Dakota $3.29 32 31 $2,613,324 $3,225,631 23.4 $3,454,249 7.1 $2,802,664 -18.9 Michigan $2.99 33 32 $29,582,989 $11,355,844 -61.6 $35,057,544 208.7 $29,696,184 -15.3 Wisconsin $2.72 34 33 $15,015,561 $15,873,688 5.7 $16,392,873 3.3 $15,680,913 -4.3 Oregon $1.65 35 36 $1,040,029 $3,636,647 249.7 $6,929,582 90.5 $6,565,913 -5.2 Florida $1.61 36 37 $66,673,129 $48,724,722 -26.9 $31,490,664 -35.4 $32,113,763 2.0 Georgia $1.59 37 38 $28,443,076 $39,278,310 38.1 $14,911,270 -62.0 $16,076,528 7.8 Kentucky $1.53 38 43 $29,450,867 $7,514,866 -74.5 $2,833,354 -62.3 $6,757,029 138.5 Colorado $1.35 39 40 $3,759,354 $6,245,580 66.1 $5,023,582 -19.6 $7,208,347 43.5 Idaho $1.05 40 35 $1,677,678 $1,605,942 -4.3 $3,077,975 91.7 $1,722,044 -44.1 New Mexico $0.89 41 41 $4,228,269 $2,651,117 -37.3 $1,770,610 -33.2 $1,849,293 4.4 Louisiana $0.87 42 45 $14,674,472 $2,384,331 -83.8 $1,680,152 -29.5 $4,038,136 140.3 Texas $0.64 43 42 $24,703,011 $20,528,722 -16.9 $17,353,780 -15.5 $17,367,873 0.1 Arizona $0.29 44 46 $1,824,966 $2,235,619 22.5 $2,066,446 -7.6 $1,924,798 -6.9 Delaware $0.07 45 47 $727,615 $830,790 14.2 $243,394 -70.7 $63,346 -74.0 Kansas $0.03 46 44 $45,978,176 $17,738,097 -61.4 $1,235,741 -93.0 $76,464 -93.8 Nebraska $0.03 47 39 $12,893,963 $18,527,793 43.7 $2,098,738 -88.7 $48,732 -97.7 North Carolina $0.01 48 50 $101,081,867 $39,318,283 -61.1 -$126,294 -100.3 $122,169 -196.7 Vermont $0.00 49 n/a $1,156 $5,840 405.2 $0 -100.0 $2,432 100.0 Ohio $0.00 n/a 51 $458,190,226 $484,290,577 5.7 -$159,583 -100.0 $0 -100.0 Hawaii $0.00 n/a n/a $0 $0 0.0 $0 0.0 $0 0.0 United States $8.60 n/a n/a $3,132,722,109 $3,063,737,018 -2.2 $2,728,539,255 -10.9 $2,739,968,110 0.4
Notes: Data do not include services provided through managed care organizations. Data are presented based on state reporting. No further explanation of trends is available for the purposes of this report.

Mental Health Facilities – Disproportionate Share Hospital Payments Table H
State
FY 2015 Expenditures Per Resident
Rank 2015
Rank 2014
FY 2012 Expenditures
FY 2013 Expenditures
Percent Change 12-13
FY 2014 Expenditures
Percent Change 13-14
FY 2015 Expenditures
Percent Change 14-15
New Jersey $40.04 1 1 $357,370,460 $357,370,462 0.0 $357,370,460 0.0 $357,370,460 0.0 Missouri $34.63 2 2 $206,156,064 $207,234,539 0.5 $211,118,467 1.9 $209,875,764 -0.6 Maine $31.63 3 4 $41,241,661 $37,489,437 -9.1 $39,328,950 4.9 $42,093,817 7.0 Connecticut $29.39 4 5 $105,573,725 $105,573,725 0.0 $105,573,725 0.0 $105,573,724 0.0 New Hampshire $23.85 5 8 $27,609,967 $23,013,040 -16.6 $25,113,766 9.1 $31,688,938 26.2 Pennsylvania $23.16 6 6 $304,925,621 $308,882,708 1.3 $313,957,347 1.6 $296,196,274 -5.7 Washington $18.74 7 9 $125,203,524 $128,252,906 2.4 $130,216,044 1.5 $132,220,168 1.5 North Carolina $16.12 8 11 $152,718,355 $156,138,910 2.2 $157,830,493 1.1 $160,112,377 1.4 Louisiana $15.34 9 10 $101,014,133 $114,778,866 13.6 $78,763,008 -31.4 $71,319,042 -9.5 New York $15.34 10 3 $605,000,000 $605,000,000 0.0 $605,000,000 0.0 $302,500,000 -50.0 Alaska $14.83 11 7 $13,767,776 $14,125,739 2.6 $14,337,626 1.5 $10,925,271 -23.8 Michigan $11.59 12 12 $101,043,110 $98,850,757 -2.2 $125,105,674 26.6 $114,962,268 -8.1 South Carolina $10.84 13 13 $52,323,602 $52,175,304 -0.3 $49,069,197 -6.0 $52,323,601 6.6 West Virginia $10.21 14 14 $18,882,149 $18,887,659 0.0 $18,887,045 0.0 $18,869,278 -0.1 Dist. of Columbia $9.55 15 15 $6,545,135 $6,493,425 -0.8 $5,922,254 -8.8 $6,291,897 6.2 Texas $9.51 16 19 $292,513,592 $237,506,152 -18.8 $216,377,066 -8.9 $256,273,807 18.4 Maryland $9.14 17 16 $51,637,668 $52,876,971 2.4 $53,670,127 1.5 $54,528,848 1.6 Kansas $8.98 18 17 $24,495,411 $25,285,520 3.2 $25,509,276 0.9 $26,045,571 2.1 Kentucky $8.48 19 18 $35,953,201 $37,443,072 4.1 $37,443,074 0.0 $37,443,072 0.0 Ohio $8.06 20 20 $93,432,758 $93,432,758 0.0 $93,432,758 0.0 $93,432,758 0.0 Illinois $8.00 21 21 $88,946,691 $75,834,229 -14.7 $89,425,307 17.9 $102,962,153 15.1 Delaware $6.45 22 22 $5,647,971 $5,633,185 -0.3 $5,760,512 2.3 $6,026,019 4.6 Florida $5.99 23 24 $119,838,603 $93,130,348 -22.3 $95,871,943 2.9 $119,098,224 24.2 Oregon $5.03 24 23 $24,844,783 $18,941,552 -23.8 $19,975,093 5.5 $19,975,092 0.0 Arizona $4.24 25 25 $27,502,389 $28,474,900 3.5 $28,474,900 0.0 $28,474,900 0.0 Virginia $1.69 26 27 $0 $6,861,635 100.0 $9,396,945 36.9 $14,022,287 49.2 North Dakota $1.34 27 26 $988,478 $741,360 -25.0 $1,235,596 66.7 $988,478 -20.0 South Dakota $0.88 28 29 $751,299 $751,299 0.0 $751,299 0.0 $751,299 0.0 Oklahoma $0.84 29 30 $818,306 $543,449 -33.6 $3,273,248 502.3 $3,273,248 0.0 Nebraska $0.76 30 28 $1,811,338 $1,572,298 -13.2 $1,811,337 15.2 $1,438,706 -20.6 Utah $0.32 31 31 $1,871,016 $934,586 -50.0 $934,586 0.0 $934,586 0.0 Alabama $0.00 n/a 33 $3,301,620 $0 -100.0 $155,073 100.0 $0 -100.0 Arkansas $0.00 n/a 32 $819,350 $819,350 0.0 $819,350 0.0 $0 -100.0 Indiana $0.00 n/a n/a $0 $0 0.0 $0 0.0 $0 0.0 Minnesota $0.00 n/a 35 $214,512 $197,998 -7.7 $11,559 -94.2 $0 -100.0 California $0.00 36 34 $127,396 $177,063 39.0 $520,619 194.0 -$23,332 -104.5 Colorado $0.00 n/a n/a $0 $0 0.0 $0 0.0 $0 0.0 Georgia $0.00 n/a n/a $0 $0 0.0 $0 0.0 $0 0.0 Hawaii $0.00 n/a n/a $0 $0 0.0 $0 0.0 $0 0.0 Idaho $0.00 n/a n/a $0 $0 0.0 $0 0.0 $0 0.0 Iowa $0.00 n/a n/a $0 $0 0.0 $0 0.0 $0 0.0 Massachusetts $0.00 n/a n/a $0 $0 0.0 $0 0.0 $0 0.0 Mississippi $0.00 n/a n/a $0 $0 0.0 $0 0.0 $0 0.0 Montana $0.00 n/a n/a $0 $0 0.0 $0 0.0 $0 0.0 Nevada $0.00 n/a n/a $0 $0 0.0 $0 0.0 $0 0.0 New Mexico $0.00 n/a n/a $0 $0 0.0 $0 0.0 $0 0.0 Rhode Island $0.00 n/a n/a $0 $0 0.0 $0 0.0 $0 0.0 Tennessee $0.00 n/a n/a $0 $0 0.0 $0 0.0 $0 0.0 Vermont $0.00 n/a n/a $0 $0 0.0 $0 0.0 $0 0.0 Wisconsin $0.00 n/a n/a $0 $0 0.0 $0 0.0 $0 0.0 Wyoming $0.00 n/a n/a $0 $0 0.0 $0 0.0 $0 0.0 United States $8.41 n/a n/a $2,994,891,664 $2,915,425,202 -2.7 $2,922,443,724 0.2 $2,677,968,595 -8.4
Note: Data are presented based on state reporting. No further explanation of trends is available for the purposes of this report.

Institutional Managed LTSS - Unspecified Table I
State
FY 2015 Expenditures Per Resident
Rank 2015
Rank 2014
FY 2013 Expenditures
FY 2014 Expenditures
Percent Change 13-14
FY 2015 Expenditures
Percent Change 14-15
Iowa $29.41 1 2 $81,115,331 $88,981,212 9.7 $91,420,657 2.7 Illinois $27.58 2 1 $83,837,474 $478,673,945 471.0 $354,862,473 -25.9Indiana $0.65 3 5 $9,399,794 $22,104,114 135.2 $4,314,171 -80.5Alabama $0.00 n/a n/a $0 $0 0.0 $0 0.0 Alaska $0.00 n/a n/a $0 $0 0.0 $0 0.0 Arizona $0.00 n/a n/a $0 $0 0.0 $0 0.0 Arkansas $0.00 n/a n/a $0 $0 0.0 $0 0.0 California $0.00 n/a n/a $0 $0 0.0 $0 0.0 Colorado $0.00 n/a n/a $0 $0 0.0 $0 0.0 Connecticut $0.00 n/a n/a $0 $0 0.0 $0 0.0 Delaware $0.00 n/a n/a $0 $0 0.0 $0 0.0 Dist. of Columbia $0.00 n/a n/a $0 $0 0.0 $0 0.0 Florida $0.00 n/a n/a $0 $0 0.0 $0 0.0 Georgia $0.00 n/a n/a $0 $0 0.0 $0 0.0 Hawaii $0.00 n/a n/a $0 $0 0.0 $0 0.0 Idaho $0.00 n/a n/a $0 $0 0.0 $0 0.0 Kansas $0.00 n/a n/a $0 $0 0.0 $0 0.0 Kentucky $0.00 n/a n/a $0 $0 0.0 $0 0.0 Louisiana $0.00 n/a n/a $0 $0 0.0 $0 0.0 Maine $0.00 n/a n/a $0 $0 0.0 $0 0.0 Maryland $0.00 n/a n/a $0 $0 0.0 $0 0.0 Massachusetts $0.00 n/a 3 $0 $73,335,737 100.0 $0 -100.0Michigan $0.00 n/a n/a $0 $0 0.0 $0 0.0 Minnesota $0.00 n/a n/a $0 $0 0.0 $0 0.0 Mississippi $0.00 n/a n/a $0 $0 0.0 $0 0.0 Missouri $0.00 n/a n/a $0 $0 0.0 $0 0.0 Montana $0.00 n/a n/a $0 $0 0.0 $0 0.0 Nebraska $0.00 n/a n/a $0 $0 0.0 $0 0.0 Nevada $0.00 n/a n/a $0 $0 0.0 $0 0.0 New Hampshire $0.00 n/a n/a $0 $0 0.0 $0 0.0 New Jersey $0.00 n/a 4 $2,340,857 $35,635,312 1422.3 $0 -100.0New Mexico $0.00 n/a n/a $0 $0 0.0 $0 0.0 New York $0.00 n/a n/a $0 $0 0.0 $0 0.0 North Carolina $0.00 n/a n/a $0 $0 0.0 $0 0.0 North Dakota $0.00 n/a n/a $0 $0 0.0 $0 0.0 Ohio $0.00 n/a n/a $5,182,342 $0 -100.0 $0 0.0 Oklahoma $0.00 n/a n/a $0 $0 0.0 $0 0.0 Oregon $0.00 n/a n/a $0 $0 0.0 $0 0.0 Pennsylvania $0.00 n/a n/a $0 $0 0.0 $0 0.0 Rhode Island $0.00 n/a n/a $0 $0 0.0 $0 0.0 South Carolina $0.00 n/a n/a $0 $0 0.0 $0 0.0 South Dakota $0.00 n/a n/a $0 $0 0.0 $0 0.0 Tennessee $0.00 n/a n/a $0 $0 0.0 $0 0.0 Texas $0.00 n/a n/a $0 $0 0.0 $0 0.0 Utah $0.00 n/a n/a $0 $0 0.0 $0 0.0 Vermont $0.00 n/a n/a $0 $0 0.0 $0 0.0 Virginia $0.00 n/a n/a $0 $0 0.0 $0 0.0 Washington $0.00 n/a n/a $0 $0 0.0 $0 0.0 West Virginia $0.00 n/a n/a $0 $0 0.0 $0 0.0 Wisconsin $0.00 n/a n/a $0 $0 0.0 $0 0.0 Wyoming $0.00 n/a n/a $0 $0 0.0 $0 0.0 United States $1.41 n/a n/a $181,875,798 $698,730,320 284.2 $450,597,301 -35.5
Notes: Institutional MLTSS - unspecified refers to institutional LTSS provided through managed care organizations and reported on the CMS-64. The CMS-64 does not specify the type of institutional LTSS. The first year of institutional MLTSS - unspecified data was 2013. Data are presented based on state reporting. No further explanation of trends is available for the purposes of this report.

5
10
15
20
25
30
35
40
45
50
Total Home and Community-Based Services Table J
State
FY 2015 Expenditures Per Resident
Rank 2015
Rank 2014
FY 2012 Expenditures
FY 2013 Expenditures
Percent Change 12-13
FY 2014 Expenditures
Percent Change 13-14
FY 2015 Expenditures
Percent Change 14-15
New York $675.80 1 1 $12,161,532,019 $12,448,516,502 2.4 $12,855,739,733 3.3 $13,325,817,112 3.7 Massachusetts $660.21 2 5 $2,598,804,788 $2,668,609,375 2.7 $3,133,245,068 17.4 $4,456,344,977 42.2 Dist. of Columbia $646.98 3 2 $422,542,705 $474,973,194 12.4 $419,736,288 -11.6 $426,360,155 1.6 Minnesota $636.34 4 3 $2,847,184,248 $2,879,374,524 1.1 $3,113,121,679 8.1 $3,470,009,869 11.5 New Mexico $509.87 14 $324,003,888 $335,764,024 3.6 $700,734,247 108.7 $1,062,071,219 51.6 Alaska $487.06 6 6 $357,261,055 $373,804,704 4.6 $330,530,941 -11.6 $358,821,617 8.6 Oregon $482.07 7 9 $1,290,780,847 $1,272,370,891 -1.4 $1,594,181,396 25.3 $1,913,039,827 20.0 Rhode Island $475.24 8 4 $446,424,028 $480,705,336 7.7 $495,576,781 3.1 $501,134,002 1.1 Connecticut $473.94 9 8 $1,310,517,473 $1,417,453,914 8.2 $1,510,224,984 6.5 $1,702,322,658 12.7 Vermont $444.46 7 $246,889,117 $254,305,441 3.0 $270,876,309 6.5 $278,667,287 2.9 Maine $406.92 11 10 $472,641,012 $478,845,798 1.3 $519,076,787 8.4 $541,496,215 4.3 Wisconsin $395.18 12 11 $1,822,905,467 $1,993,848,053 9.4 $2,115,452,259 6.1 $2,275,598,324 7.6 West Virginia $377.79 13 12 $639,327,725 $657,497,433 2.8 $681,571,614 3.7 $698,352,306 2.5 Iowa $356.04 14 15 $673,459,518 $943,668,363 40.1 $1,023,280,782 8.4 $1,106,580,989 8.1 Arkansas $348.63 13 $802,470,083 $895,697,404 11.6 $994,282,427 11.0 $1,034,362,464 4.0 North Dakota $333.27 16 17 $184,455,161 $197,218,662 6.9 $232,292,897 17.8 $246,587,343 6.2 Pennsylvania $328.87 17 19 $3,175,002,832 $3,481,839,659 9.7 $3,793,373,035 8.9 $4,206,393,972 10.9 Missouri $319.11 18 20 $1,190,408,679 $1,595,046,042 34.0 $1,726,059,206 8.2 $1,934,093,239 12.1 New Hampshire $318.25 19 18 $359,625,582 $384,481,778 6.9 $419,129,466 9.0 $422,878,820 0.9 Ohio $315.32 16 $2,509,210,105 $2,883,573,716 14.9 $3,723,924,452 29.1 $3,655,975,075 -1.8Maryland $292.81 21 21 $1,444,187,871 $1,478,082,550 2.3 $1,651,660,693 11.7 $1,747,288,955 5.8 Washington $282.64 22 23 $1,581,918,918 $1,612,458,103 1.9 $1,770,505,963 9.8 $1,993,802,276 12.6 Delaware $267.88 23 25 $183,411,589 $194,899,473 6.3 $217,480,614 11.6 $250,454,706 15.2 Montana $262.15 24 24 $233,723,163 $239,623,025 2.5 $251,414,275 4.9 $268,142,007 6.7 Colorado $257.44 27 $917,219,289 $977,733,396 6.6 $1,200,697,755 22.8 $1,377,219,594 14.7 California $242.82 26 22 $8,378,085,493 $9,718,680,259 16.0 $10,033,652,046 3.2 $9,392,520,461 -6.4New Jersey $241.85 27 26 $1,092,548,701 $1,486,545,071 36.1 $2,038,917,236 37.2 $2,158,482,744 5.9 Wyoming $225.20 28 28 $131,941,539 $133,175,943 0.9 $132,799,260 -0.3 $131,437,765 -1.0Nebraska $221.45 29 29 $345,864,213 $371,431,130 7.4 $386,996,536 4.2 $416,579,029 7.6 Kansas $207.94 31 $622,970,545 $623,444,297 0.1 $575,285,067 -7.7 $602,892,051 4.8 Texas $205.03 31 34 $3,781,758,867 $4,452,773,576 17.7 $4,927,375,715 10.7 $5,524,409,044 12.1 Idaho $203.32 32 32 $246,825,551 $287,901,564 16.6 $310,081,469 7.7 $332,127,932 7.1 Virginia $201.38 33 33 $1,326,797,043 $1,427,670,254 7.6 $1,550,433,502 8.6 $1,674,975,520 8.0 Tennessee $193.43 34 30 $1,127,772,096 $1,206,897,650 7.0 $1,292,168,112 7.1 $1,265,928,700 -2.0South Dakota $185.20 37 $136,636,854 $141,407,384 3.5 $147,343,600 4.2 $157,893,009 7.2 Louisiana $184.86 36 35 $837,032,653 $949,198,509 13.4 $860,897,948 -9.3 $859,200,335 -0.2Kentucky $182.49 37 39 $633,610,968 $649,718,187 2.5 $763,586,593 17.5 $805,335,611 5.5 Indiana $179.77 38 41 $853,666,814 $947,758,565 11.0 $1,076,828,722 13.6 $1,185,596,539 10.1 Arizona $174.18 39 38 $1,045,284,797 $1,074,786,379 2.8 $1,152,865,607 7.3 $1,170,466,014 1.5 Illinois $173.12 40 $1,795,190,057 $2,115,921,709 17.9 $2,153,877,496 1.8 $2,227,619,181 3.4 North Carolina $172.22 41 36 $2,295,609,464 $1,932,144,453 -15.8 $1,754,988,376 -9.2 $1,710,928,019 -2.5Oklahoma $162.85 42 42 $550,669,949 $577,241,926 4.8 $594,869,550 3.1 $631,444,408 6.1 Mississippi $161.68 43 45 $413,365,802 $385,747,231 -6.7 $410,176,877 6.3 $483,810,068 18.0 Alabama $153.43 44 43 $691,403,801 $708,424,898 2.5 $709,765,693 0.2 $743,073,226 4.7 South Carolina $151.74 46 $556,713,953 $551,770,440 -0.9 $605,875,991 9.8 $732,647,057 20.9 Hawaii $141.68 46 44 $183,649,856 $189,620,093 3.3 $194,090,877 2.4 $200,673,637 3.4 Michigan $131.36 47 48 $1,013,778,428 $1,037,165,722 2.3 $1,045,008,190 0.8 $1,302,516,150 24.6 Georgia $119.97 48 47 $1,056,955,116 $1,199,878,082 13.5 $1,161,771,409 -3.2 $1,210,134,206 4.2 Nevada $116.49 49 50 $245,118,933 $248,138,972 1.2 $262,858,504 5.9 $330,022,351 25.6 Utah $98.23 51 $238,591,192 $239,628,101 0.4 $248,857,850 3.9 $288,971,217 16.1 Florida $97.64 51 49 $1,778,749,520 $1,836,515,257 3.2 $1,972,602,103 7.4 $1,941,996,895 -1.6United States $272.27 n/a n/a $69,576,499,367 $75,113,977,012 8.0 $81,108,143,980 8.0 $86,735,496,177 6.9
Notes: Delaware 2012 and Michigan 2014 data were incomplete because the transition to managed care occurred during the year; state estimates were included the following year. Data do not include expenditures for managed care programs in the following states (years of missing data in parentheses): California (2012, 2014, 2015); Massachusetts (2014); New Mexico (2012 - 2013). Case management, rehabilitative services, private duty nursing, state plan HCBS, and health homes data do not include services provided through managed care organizations. Data are presented based on state reporting. No further explanation of trends is available for the purposes of this report.

Section 1915(c) Waivers Table K
State
FY 2015 Expenditures Per Resident
Rank 2015
Rank 2014
FY 2012 Expenditures
FY 2013 Expenditures
Percent Change 12-13
FY 2014 Expenditures
Percent Change 13-14
FY 2015 Expenditures
Percent Change 14-15
Minnesota $413.43 1 1 $1,856,583,202 $1,864,305,557 0.4 $2,021,447,274 8.4 $2,254,468,793 11.5 Alaska $370.95 2 2 $234,584,787 $251,012,133 7.0 $230,727,117 -8.1 $273,281,235 18.4 Connecticut $363.74 3 3 $1,012,066,932 $1,093,383,695 8.0 $1,110,845,252 1.6 $1,306,520,035 17.6 Dist. of Columbia $338.59 4 4 $232,471,587 $182,169,504 -21.6 $184,932,163 1.5 $223,129,703 20.7 Pennsylvania $301.35 5 5 $2,807,505,700 $3,148,427,639 12.1 $3,468,609,703 10.2 $3,854,455,970 11.1 Wisconsin $283.56 6 8 $1,262,641,087 $1,354,661,342 7.3 $1,482,077,514 9.4 $1,632,839,195 10.2 New York $283.30 7 7 $5,836,867,638 $5,613,047,537 -3.8 $5,077,350,986 -9.5 $5,586,276,516 10.0 Maine $274.89 8 6 $340,607,298 $328,833,511 -3.5 $355,607,017 8.1 $365,799,589 2.9 North Dakota $256.01 9 10 $134,953,882 $147,265,474 9.1 $174,352,526 18.4 $189,425,843 8.6 West Virginia $250.28 10 9 $446,575,918 $461,827,720 3.4 $465,985,328 0.9 $462,644,223 -0.7New Hampshire $218.44 11 11 $260,580,973 $257,929,650 -1.0 $290,780,371 12.7 $290,253,941 -0.2Iowa $204.80 12 13 $499,620,619 $550,556,893 10.2 $599,540,552 8.9 $636,539,979 6.2 Ohio $199.66 13 15 $1,952,387,030 $2,039,217,864 4.4 $2,132,971,597 4.6 $2,314,893,219 8.5 Massachusetts $195.54 14 21 $986,038,527 $1,108,485,591 12.4 $1,031,598,253 -6.9 $1,319,846,317 27.9 Wyoming $194.29 15 12 $122,550,969 $121,039,216 -1.2 $117,646,477 -2.8 $113,396,311 -3.6Nebraska $185.60 16 17 $286,730,391 $308,861,922 7.7 $322,994,888 4.6 $349,136,682 8.1 Kansas $183.61 17 16 $553,740,962 $556,605,654 0.5 $518,414,508 -6.9 $532,353,521 2.7 Washington $177.73 18 14 $1,113,468,707 $1,195,986,879 7.4 $1,310,933,615 9.6 $1,253,747,483 -4.4Idaho $177.40 19 24 $167,241,112 $185,188,627 10.7 $229,609,597 24.0 $289,789,568 26.2 Kentucky $168.02 20 20 $530,582,502 $584,123,944 10.1 $698,922,837 19.7 $741,503,868 6.1 Virginia $165.90 21 19 $1,145,912,908 $1,223,038,273 6.7 $1,322,764,471 8.2 $1,379,836,374 4.3 Maryland $163.77 22 18 $942,000,660 $999,471,772 6.1 $960,361,683 -3.9 $977,273,765 1.8 South Dakota $154.46 23 23 $115,973,988 $120,783,872 4.1 $123,555,986 2.3 $131,688,522 6.6 New Mexico $154.22 24 22 $308,015,207 $319,509,992 3.7 $314,577,409 -1.5 $321,242,349 2.1 Illinois $144.86 25 29 $1,484,091,574 $1,713,500,220 15.5 $1,642,481,386 -4.1 $1,864,036,078 13.5 Colorado $141.42 26 25 $599,815,680 $631,917,118 5.4 $697,579,485 10.4 $756,536,201 8.5 Missouri $136.39 27 28 $648,484,715 $712,362,881 9.9 $773,707,918 8.6 $826,662,914 6.8 Montana $135.25 28 26 $122,286,440 $127,847,377 4.5 $133,315,787 4.3 $138,337,878 3.8 Oklahoma $133.19 29 27 $466,250,854 $479,688,193 2.9 $494,588,907 3.1 $516,447,720 4.4 Mississippi $127.61 30 34 $252,597,211 $280,659,432 11.1 $309,391,122 10.2 $381,866,428 23.4 Indiana $127.58 31 31 $617,613,456 $677,918,319 9.8 $766,785,406 13.1 $841,391,929 9.7 Louisiana $126.46 32 30 $557,500,584 $574,393,282 3.0 $562,759,284 -2.0 $587,780,127 4.4 Delaware $123.51 33 32 $113,413,931 $98,649,202 -13.0 $105,720,366 7.2 $115,475,787 9.2 Arkansas $108.11 34 35 $289,364,648 $294,604,524 1.8 $301,665,790 2.4 $320,754,981 6.3 New Jersey $108.03 35 38 $909,522,982 $733,863,916 -19.3 $825,198,921 12.4 $964,171,103 16.8 South Carolina $107.48 36 37 $453,229,403 $461,470,926 1.8 $477,502,960 3.5 $518,956,103 8.7 North Carolina $105.53 37 36 $886,251,673 $924,338,079 4.3 $1,002,879,082 8.5 $1,048,415,916 4.5 Tennessee $103.09 38 33 $579,317,911 $633,764,196 9.4 $684,172,546 8.0 $674,680,044 -1.4Georgia $97.68 39 39 $804,535,916 $860,192,673 6.9 $885,213,427 2.9 $985,286,125 11.3 Utah $85.05 40 41 $209,495,468 $212,416,264 1.4 $227,825,680 7.3 $250,200,674 9.8 Alabama $82.37 41 40 $383,882,776 $391,238,365 1.9 $395,519,915 1.1 $398,926,209 0.9 Florida $79.85 42 44 $1,206,122,391 $1,209,924,983 0.3 $1,341,865,282 10.9 $1,588,109,580 18.4 Michigan $77.90 43 45 $614,449,355 $616,440,047 0.3 $596,574,937 -3.2 $772,444,678 29.5 Hawaii $75.82 44 43 $102,542,437 $107,873,227 5.2 $106,137,406 -1.6 $107,393,586 1.2 California $70.45 45 42 $2,314,453,972 $2,540,107,911 9.7 $2,967,035,284 16.8 $2,724,900,991 -8.2Texas $47.23 46 46 $1,413,027,528 $1,362,497,344 -3.6 $1,404,455,940 3.1 $1,272,553,348 -9.4Nevada $37.75 47 47 $84,533,179 $79,987,397 -5.4 $95,294,831 19.1 $106,955,857 12.2 Oregon $18.07 48 48 $1,057,646,597 $978,850,721 -7.5 $22,869,778 -97.7 $71,716,808 213.6 Arizona $0.00 n/a n/a $0 $0 0.0 $0 0.0 $0 0.0 Rhode Island $0.00 n/a n/a $0 $0 0.0 $0 0.0 $0 0.0 Vermont $0.00 n/a n/a $0 $0 0.0 $0 0.0 $0 0.0 United States $140.11 n/a n/a $39,320,133,267 $40,720,240,858 3.6 $41,367,148,564 1.6 $44,634,344,066 7.9
Notes: Massachusetts 2013 data include expenditures for state plan home health expenditures within a managed care program. The state provided an estimate for home health and section 1915(c) waiver services. Florida 2015 data include expenditures for state plan home health and personal care expenditures within a managed care program. The state provided an estimate for personal care, home health, and section 1915(c) waiver services. Michigan 2014 data were incomplete because the transition to a managed care program occurred during that year; state estimates were included starting in 2015. Data do not include expenditures for managed care programs in Massachusetts (2014) and New Mexico (2012 - 2013). Data are presented based on state reporting. No further explanation of trends is available for the purposes of this report.

Personal Care Table L
State
FY 2015 Expenditures Per Resident
Rank 2015
Rank 2014
FY 2012 Expenditures
FY 2013 Expenditures
Percent Change 12-13
FY 2014 Expenditures
Percent Change 13-14
FY 2015 Expenditures
Percent Change 14-15
Dist. of Columbia $251.02 1 1 $139,051,742 $260,890,322 87.6 $209,730,670 -19.6 $165,423,626 -21.1New York $235.26 2 2 $3,856,888,096 $4,355,003,424 12.9 $4,514,350,533 3.7 $4,639,053,660 2.8 Massachusetts $157.11 3 3 $842,466,693 $929,611,359 10.3 $997,675,887 7.3 $1,060,508,854 6.3 Minnesota $136.75 4 6 $577,182,721 $598,505,543 3.7 $660,231,906 10.3 $745,722,646 12.9 Alaska $114.84 5 5 $122,006,265 $122,015,945 0.0 $99,133,561 -18.8 $84,601,638 -14.7Missouri $100.04 6 7 $404,124,662 $457,792,114 13.3 $523,105,307 14.3 $606,356,853 15.9 Texas $87.51 7 8 $1,787,833,362 $2,033,051,193 13.7 $2,154,782,244 6.0 $2,358,005,770 9.4 Wisconsin $81.24 8 9 $366,573,886 $435,247,898 18.7 $451,937,717 3.8 $467,782,275 3.5 Washington $62.61 9 12 $393,046,408 $336,543,256 -14.4 $374,295,449 11.2 $441,681,810 18.0 Maine $55.51 10 10 $63,057,352 $73,230,338 16.1 $77,406,295 5.7 $73,868,675 -4.6Vermont $48.67 11 13 $29,461,378 $26,141,635 -11.3 $32,807,380 25.5 $30,516,182 -7.0North Carolina $46.53 12 15 $419,390,273 $451,748,994 7.7 $479,569,951 6.2 $462,241,402 -3.6Louisiana $43.31 13 14 $199,909,785 $235,896,416 18.0 $237,389,535 0.6 $201,294,642 -15.2West Virginia $41.06 14 17 $55,074,062 $64,033,786 16.3 $70,189,541 9.6 $75,896,099 8.1 Arkansas $34.22 15 19 $86,074,621 $90,422,876 5.1 $96,232,122 6.4 $101,522,932 5.5 Michigan $32.31 16 18 $306,895,482 $318,797,449 3.9 $328,775,155 3.1 $320,394,561 -2.5Nevada $31.63 17 21 $62,856,358 $73,489,897 16.9 $84,495,959 15.0 $89,603,207 6.0 North Dakota $30.54 18 20 $19,796,301 $21,041,143 6.3 $22,766,038 8.2 $22,594,624 -0.8California $25.32 19 11 $801,232,095 $796,031,423 -0.6 $2,213,144,582 178.0 $979,368,510 -55.7Delaware $22.35 20 23 $4,684,010 $11,932,359 154.7 $16,286,928 36.5 $20,895,341 28.3 Idaho $14.00 21 16 $57,292,970 $73,381,603 28.1 $61,405,219 -16.3 $22,866,930 -62.8Nebraska $10.96 22 25 $14,378,242 $16,952,865 17.9 $19,736,009 16.4 $20,619,595 4.5 Montana $10.06 23 22 $42,065,113 $42,331,865 0.6 $26,521,271 -37.3 $10,294,283 -61.2Oregon $8.57 24 24 $37,549,763 $44,486,418 18.5 $58,147,585 30.7 $33,994,883 -41.5New Jersey $7.17 25 27 $83,412,009 $64,895,913 -22.2 $65,144,011 0.4 $63,974,258 -1.8Maryland $5.46 26 26 $41,325,521 $41,280,499 -0.1 $45,601,745 10.5 $32,557,968 -28.6Virginia $4.46 27 36 $0 $0 0.0 $2,928,483 100.0 $37,094,732 1166.7 Florida $3.91 28 29 $74,270,173 $85,590,933 15.2 $63,737,162 -25.5 $77,749,103 22.0 New Hampshire $3.37 29 28 $7,106,204 $6,835,181 -3.8 $4,576,000 -33.1 $4,482,388 -2.0Oklahoma $3.09 30 30 $11,991,353 -$2,602,849 -121.7 $11,908,001 -557.5 $11,980,137 0.6 South Carolina $2.51 31 31 $13,661,618 $12,679,352 -7.2 $9,866,323 -22.2 $12,111,459 22.8 South Dakota $1.28 32 32 $1,155,083 $864,268 -25.2 $958,735 10.9 $1,087,849 13.5 Utah $0.99 33 33 $3,151,205 $3,266,802 3.7 $2,864,074 -12.3 $2,924,554 2.1 Arizona $0.20 34 34 $5,205,225 $5,216,440 0.2 $4,420,166 -15.3 $1,329,793 -69.9Alabama $0.00 n/a n/a $0 $0 0.0 $0 0.0 $0 0.0 Colorado $0.00 n/a n/a $0 $0 0.0 $0 0.0 $0 0.0 Connecticut $0.00 n/a n/a $0 $0 0.0 $0 0.0 $0 0.0 Georgia $0.00 n/a n/a $1,983 $0 -100.0 $0 0.0 $0 0.0 Hawaii $0.00 n/a n/a $0 -$256 100.0 $0 -100.0 $0 0.0 Illinois $0.00 n/a n/a $0 $0 0.0 $0 0.0 $0 0.0 Indiana $0.00 n/a n/a $0 $0 0.0 $0 0.0 $0 0.0 Iowa $0.00 n/a n/a $0 $0 0.0 $0 0.0 $0 0.0 Kansas $0.00 n/a 35 $5,676,216 $5,589,378 -1.5 $1,611,490 -71.2 $0 -100.0Kentucky $0.00 n/a n/a $0 $0 0.0 $0 0.0 $0 0.0 Mississippi $0.00 n/a n/a $0 $0 0.0 $0 0.0 $0 0.0 New Mexico $0.00 n/a 4 $576,513 $637,067 10.5 $291,849,319 45711.4 $0 -100.0Ohio $0.00 n/a n/a $0 $0 0.0 $0 0.0 $0 0.0 Pennsylvania $0.00 n/a n/a $0 $0 0.0 $0 0.0 $0 0.0 Rhode Island $0.00 n/a n/a $0 $0 0.0 $0 0.0 $0 0.0 Tennessee $0.00 n/a n/a $0 $0 0.0 $0 0.0 $0 0.0 Wyoming $0.00 n/a n/a $0 $0 0.0 $0 0.0 $0 0.0 United States $41.69 n/a n/a $10,936,424,743 $12,092,832,849 10.6 $14,315,582,353 18.4 $13,280,401,239 -7.2
Notes: Data do not include expenditures for managed care programs in the following states (years of missing data in parentheses): California (2015); New Mexico (2012 - 2013). Arizona 2012 - 2014 data and Florida and New Mexico 2015 data do not include expenditures for state plan personal care expenditures within a managed care program. States included personal care expenditures in estimates for section 1915(c) waivers (Florida) or HCBS - unspecified (Arizona and New Mexico). Delaware 2012 data were incomplete because the transition to managed care occurred during that year; state estimates were included starting in 2013. Minnesota 2013 data are estimated expenditures for state fiscal year 2013. Data are presented based on state reporting. No further explanation of trends is available for the purposes of this report.

5
10
15
20
25
30
35
40
45
50
Home Health Table M
State
FY 2015 Expenditures Per Resident
Rank 2015
Rank 2014
FY 2012 Expenditures
FY 2013 Expenditures
Percent Change 12-13
FY 2014 Expenditures
Percent Change 13-14
FY 2015 Expenditures
Percent Change 14-15
Colorado $87.05 1 2 $201,525,483 $224,853,967 11.6 $374,378,024 66.5 $465,678,180 24.4 Connecticut $85.74 2 1 $253,091,948 $255,980,976 1.1 $267,962,131 4.7 $307,984,136 14.9 Massachusetts $84.96 3 4 $339,952,775 $246,605,661 -27.5 $359,592,764 45.8 $573,473,613 59.5 Iowa $52.51 4 5 $104,285,878 $136,482,311 30.9 $150,542,319 10.3 $163,189,285 8.4 Indiana $46.94 6 $218,816,275 $245,662,296 12.3 $281,166,110 14.5 $309,582,006 10.1 Dist. of Columbia $45.38 6 13 $19,513,342 $12,422,328 -36.3 $13,419,494 8.0 $29,903,858 122.8 New York $42.88 7 3 $1,807,652,842 $1,654,725,050 -8.5 $1,117,066,384 -32.5 $845,567,859 -24.3Ohio $39.94 8 8 $380,786,540 $440,608,974 15.7 $438,216,139 -0.5 $463,127,229 5.7 Delaware $34.70 9 7 $23,763,799 $34,702,210 46.0 $36,266,844 4.5 $32,446,209 -10.5Tennessee $31.64 9 $222,905,254 $206,433,165 -7.4 $211,710,047 2.6 $207,071,067 -2.2West Virginia $29.48 11 10 $51,825,741 $45,549,909 -12.1 $48,848,649 7.2 $54,485,063 11.5 Arkansas $24.64 12 11 $63,741,813 $65,966,511 3.5 $64,878,504 -1.6 $73,106,703 12.7 Minnesota $22.30 13 12 $117,238,215 $114,036,956 -2.7 $118,207,580 3.7 $121,584,179 2.9 Wyoming $20.73 14 14 $9,132,249 $9,361,981 2.5 $9,902,288 5.8 $12,098,634 22.2 South Dakota $15.92 18 $11,696,309 $11,442,567 -2.2 $11,417,316 -0.2 $13,576,094 18.9 Montana $14.74 16 16 $14,273,584 $15,352,918 7.6 $14,835,592 -3.4 $15,076,215 1.6 Alabama $14.29 17 19 $60,268,125 $66,231,253 9.9 $63,381,172 -4.3 $69,187,193 9.2 Wisconsin $14.13 18 17 $78,634,598 $83,253,135 5.9 $82,325,864 -1.1 $81,374,345 -1.2Vermont $12.24 19 20 $7,283,013 $7,375,354 1.3 $7,599,082 3.0 $7,675,130 1.0 North Dakota $9.27 21 $5,197,247 $7,074,499 36.1 $7,070,859 -0.1 $6,861,686 -3.0Kentucky $9.16 21 22 $51,306,079 $34,058,887 -33.6 $36,041,805 5.8 $40,409,609 12.1 Kansas $8.06 22 23 $8,780,158 $14,808,854 68.7 $23,219,118 56.8 $23,378,279 0.7 New Mexico $7.27 23 15 $3,415,047 $3,441,688 0.8 $35,304,222 925.8 $15,135,013 -57.1Nebraska $7.06 24 26 $16,812,811 $14,829,743 -11.8 $13,277,052 -10.5 $13,286,561 0.1 Texas $6.99 25 $223,576,324 $192,758,631 -13.8 $195,812,030 1.6 $188,422,264 -3.8Maine $6.21 26 35 $7,927,635 $7,570,827 -4.5 $5,631,831 -25.6 $8,259,309 46.7 California $6.03 27 28 $213,964,127 $223,013,057 4.2 $225,704,650 1.2 $233,166,029 3.3 Louisiana $5.89 28 27 $34,922,069 $32,638,679 -6.5 $29,222,056 -10.5 $27,370,260 -6.3Idaho $5.30 29 30 $4,543,716 $7,752,361 70.6 $8,131,890 4.9 $8,660,472 6.5 Georgia $5.05 34 $90,904,624 $45,433,298 -50.0 $44,556,207 -1.9 $50,933,203 14.3 Oklahoma $4.70 31 31 $20,581,227 $19,973,751 -3.0 $19,183,735 -4.0 $18,214,836 -5.1Pennsylvania $4.70 32 32 $162,877,546 $102,342,454 -37.2 $61,759,524 -39.7 $60,069,924 -2.7North Carolina $4.26 33 33 $60,752,514 $52,756,445 -13.2 $47,166,718 -10.6 $42,350,878 -10.2New Hampshire $3.96 34 29 $11,392,145 $10,613,894 -6.8 $6,683,966 -37.0 $5,264,429 -21.2Arizona $3.59 51 $818,432 $666,703 -18.5 $735,753 10.4 $24,131,796 3179.9 Virginia $3.21 36 45 $7,704,243 $5,938,977 -22.9 $5,182,429 -12.7 $26,681,284 414.8 Washington $2.85 37 36 $27,428,288 $25,459,344 -7.2 $23,135,063 -9.1 $20,110,518 -13.1South Carolina $2.83 38 37 $6,974,713 $9,750,048 39.8 $13,226,926 35.7 $13,680,165 3.4 Florida $2.33 39 24 $162,538,141 $164,110,384 1.0 $153,606,926 -6.4 $46,435,704 -69.8Utah $2.05 39 $10,246,910 $8,443,541 -17.6 $6,233,748 -26.2 $6,023,016 -3.4Hawaii $2.03 41 38 $11,184,683 $11,179,771 0.0 $3,729,258 -66.6 $2,878,095 -22.8Alaska $1.27 42 41 $670,003 $776,626 15.9 $670,263 -13.7 $938,744 40.1 Rhode Island $1.21 43 40 $1,862,935 $1,968,440 5.7 $1,794,361 -8.8 $1,275,985 -28.9Missouri $0.89 44 42 $6,256,273 $6,246,898 -0.1 $5,347,214 -14.4 $5,402,168 1.0 Michigan $0.72 48 $3,362,906 $3,797,940 12.9 $3,832,651 0.9 $7,120,364 85.8 Maryland $0.65 46 46 $2,967,282 $2,964,587 -0.1 $3,004,144 1.3 $3,891,832 29.5 Nevada $0.52 47 44 $11,047,128 $4,441,944 -59.8 $1,754,215 -60.5 $1,480,760 -15.6Mississippi $0.51 48 47 $2,615,277 $1,892,077 -27.7 $1,453,111 -23.2 $1,515,164 4.3 Illinois $0.47 49 43 $3,250,806 $4,752,767 46.2 $9,181,011 93.2 $6,061,737 -34.0Oregon $0.14 50 $557,039 $510,620 -8.3 $529,556 3.7 $540,259 2.0 New Jersey $0.13 51 49 $4,403,940 $2,379,163 -46.0 $1,635,716 -31.2 $1,137,197 -30.5United States $14.93 n/a n/a $5,167,230,051 $4,901,394,420 -5.1 $4,665,534,311 -4.8 $4,757,274,538 2.0
Notes: Delaware 2012 data were incomplete because the transition to managed care occurred during that year; state estimates were included starting in 2013. Hawaii provided an estimate for calendar year 2012. This estimate was used for both FY 2012 and FY 2013. Data for several states do not include expenditures for state plan home health expenditures within a managed care program because states included home health expenditures in estimates for HCBS - unspecified (Arizona 2012 - 2014, California 2013, and New Mexico 2015) or section 1915(c) waivers (Florida 2015 and Massachusetts 2013). Minnesota 2013 data are estimated expenditures for state fiscal year 2013. Data are presented based on state reporting. No further explanation of trends is available for the purposes of this report.

Community First Choice Table N
State
FY 2015 Expenditures Per Resident
Rank 2015
Rank 2014
FY 2012 Expenditures
FY 2013 Expenditures
Percent Change 12-13
FY 2014 Expenditures
Percent Change 13-14
FY 2015 Expenditures
Percent Change 14-15
Oregon $393.01 1 1 $0 $94,726,637 100.0 $1,286,602,157 1258.2 $1,559,628,252 21.2 California $105.24 2 2 $4,236,540,960 $4,558,133,064 7.6 $3,156,120,633 -30.8 $4,070,620,070 29.0 New York $58.90 3 n/a $0 $0 0.0 $0 0.0 $1,161,516,682 100.0 Montana $40.09 4 3 $0 $0 0.0 $18,131,543 100.0 $41,006,390 126.2 Washington $28.96 5 n/a $0 $0 0.0 $0 0.0 $204,296,557 100.0 Maryland $28.37 6 4 $0 $0 0.0 $94,140,240 100.0 $169,309,951 79.8 Texas $12.83 7 n/a $0 $0 0.0 $0 0.0 $345,811,927 100.0 Connecticut $0.80 8 n/a $0 $0 0.0 $0 0.0 $2,857,753 100.0 New Hampshire $0.00 n/a n/a $0 $0 0.0 $0 0.0 $0 0.0 Alabama $0.00 n/a n/a $0 $0 0.0 $0 0.0 $0 0.0 Alaska $0.00 n/a n/a $0 $0 0.0 $0 0.0 $0 0.0 Arizona $0.00 n/a n/a $0 $0 0.0 $0 0.0 $0 0.0 Arkansas $0.00 n/a n/a $0 $0 0.0 $0 0.0 $0 0.0 Colorado $0.00 n/a n/a $0 $0 0.0 $0 0.0 $0 0.0 Delaware $0.00 n/a n/a $0 $0 0.0 $0 0.0 $0 0.0 Dist. of Columbia $0.00 n/a n/a $0 $0 0.0 $0 0.0 $0 0.0 Florida $0.00 n/a n/a $0 $0 0.0 $0 0.0 $0 0.0 Georgia $0.00 n/a n/a $0 $0 0.0 $0 0.0 $0 0.0 Hawaii $0.00 n/a n/a $0 $0 0.0 $0 0.0 $0 0.0 Idaho $0.00 n/a n/a $0 $0 0.0 $0 0.0 $0 0.0 Illinois $0.00 n/a n/a $0 $0 0.0 $0 0.0 $0 0.0 Indiana $0.00 n/a n/a $0 $0 0.0 $0 0.0 $0 0.0 Iowa $0.00 n/a n/a $0 $0 0.0 $0 0.0 $0 0.0 Kansas $0.00 n/a n/a $0 $0 0.0 $0 0.0 $0 0.0 Kentucky $0.00 n/a n/a $0 $0 0.0 $0 0.0 $0 0.0 Louisiana $0.00 n/a n/a $0 $0 0.0 $0 0.0 $0 0.0 Maine $0.00 n/a n/a $0 $0 0.0 $0 0.0 $0 0.0 Massachusetts $0.00 n/a n/a $0 $0 0.0 $0 0.0 $0 0.0 Michigan $0.00 n/a n/a $0 $0 0.0 $0 0.0 $0 0.0 Minnesota $0.00 n/a n/a $0 $0 0.0 $0 0.0 $0 0.0 Mississippi $0.00 n/a n/a $0 $0 0.0 $0 0.0 $0 0.0 Missouri $0.00 n/a n/a $0 $0 0.0 $0 0.0 $0 0.0 Nebraska $0.00 n/a n/a $0 $0 0.0 $0 0.0 $0 0.0 Nevada $0.00 n/a n/a $0 $0 0.0 $0 0.0 $0 0.0 New Jersey $0.00 n/a n/a $0 $0 0.0 $0 0.0 $0 0.0 New Mexico $0.00 n/a n/a $0 $0 0.0 $0 0.0 $0 0.0 North Carolina $0.00 n/a n/a $0 $0 0.0 $0 0.0 $0 0.0 North Dakota $0.00 n/a n/a $0 $0 0.0 $0 0.0 $0 0.0 Ohio $0.00 n/a n/a $0 $0 0.0 $0 0.0 $0 0.0 Oklahoma $0.00 n/a n/a $0 $0 0.0 $0 0.0 $0 0.0 Pennsylvania $0.00 n/a n/a $0 $0 0.0 $0 0.0 $0 0.0 Rhode Island $0.00 n/a n/a $0 $0 0.0 $0 0.0 $0 0.0 South Carolina $0.00 n/a n/a $0 $0 0.0 $0 0.0 $0 0.0 South Dakota $0.00 n/a n/a $0 $0 0.0 $0 0.0 $0 0.0 Tennessee $0.00 n/a n/a $0 $0 0.0 $0 0.0 $0 0.0 Utah $0.00 n/a n/a $0 $0 0.0 $0 0.0 $0 0.0 Vermont $0.00 n/a n/a $0 $0 0.0 $0 0.0 $0 0.0 Virginia $0.00 n/a n/a $0 $0 0.0 $0 0.0 $0 0.0 West Virginia $0.00 n/a n/a $0 $0 0.0 $0 0.0 $0 0.0 Wisconsin $0.00 n/a n/a $0 $0 0.0 $0 0.0 $0 0.0 Wyoming $0.00 n/a n/a $0 $0 0.0 $0 0.0 $0 0.0 United States $23.72 n/a n/a $4,236,540,960 $4,652,859,701 9.8 $4,554,994,573 -2.1 $7,555,047,582 65.9
Notes: Data do not include expenditures for a managed care program in California (2015). Data are presented based on state reporting. No further explanation of trends is available for the purposes of this report.

Case Management Table O
State
FY 2015 Expenditures Per Resident
Rank 2015
Rank 2014
FY 2012 Expenditures
FY 2013 Expenditures
Percent Change 12-13
FY 2014 Expenditures
Percent Change 13-14
FY 2015 Expenditures
Percent Change 14-15
Minnesota $40.67 1 1 $199,908,880 $201,920,861 1.0 $201,357,930 -0.3 $221,804,466 10.2 Maine $35.21 2 2 $40,392,669 $42,263,391 4.6 $44,215,856 4.6 $46,852,959 6.0 Montana $32.08 3 3 $27,278,859 $26,797,651 -1.8 $30,749,090 14.7 $32,817,770 6.7 Oregon $20.04 4 10 $88,961,602 $65,499,165 -26.4 $59,373,272 -9.4 $79,508,567 33.9 Tennessee $18.66 5 5 $107,415,447 $122,056,922 13.6 $140,499,916 15.1 $122,122,853 -13.1Iowa $18.27 6 8 $40,133,380 $45,256,670 12.8 $49,238,236 8.8 $56,796,708 15.4 Virginia $17.04 7 6 $130,156,003 $134,161,785 3.1 $136,254,148 1.6 $141,742,500 4.0 California $15.08 8 7 $522,685,022 $552,365,046 5.7 $621,371,145 12.5 $583,323,097 -6.1Connecticut $15.08 9 4 $28,021,285 $46,024,199 64.2 $104,972,632 128.1 $54,162,749 -48.4Oklahoma $14.95 10 15 $44,900,325 $72,010,505 60.4 $50,805,484 -29.4 $57,964,089 14.1 Nebraska $14.90 11 13 $26,548,782 $27,971,305 5.4 $26,248,690 -6.2 $28,037,720 6.8 New Hampshire $14.20 12 9 $59,637 $17,790,849 29731.9 $20,667,200 16.2 $18,865,337 -8.7Nevada $13.48 13 11 $48,724,018 $49,131,256 0.8 $41,189,524 -16.2 $38,181,589 -7.3Missouri $12.66 14 17 $62,071,521 $68,846,235 10.9 $69,528,766 1.0 $76,728,089 10.4 Massachusetts $12.54 15 14 $79,273,972 -$60,947,856 -176.9 $91,391,533 -250.0 $84,635,532 -7.4New York $11.71 16 16 $388,037,326 $292,302,802 -24.7 $252,560,431 -13.6 $230,914,020 -8.6North Dakota $11.59 17 12 $9,226,154 $8,419,415 -8.7 $10,538,430 25.2 $8,574,035 -18.6Maryland $10.83 18 37 $8,533,234 $8,090,868 -5.2 $12,710,349 57.1 $64,611,350 408.3 Alabama $10.41 19 18 $63,407,224 $56,238,006 -11.3 $50,674,550 -9.9 $50,416,030 -0.5Rhode Island $9.05 20 19 $7,641,505 $8,108,537 6.1 $10,516,733 29.7 $9,540,886 -9.3Mississippi $9.00 21 20 $48,583,503 $29,553,047 -39.2 $27,754,232 -6.1 $26,931,644 -3.0Ohio $6.53 22 23 $68,409,408 $74,639,845 9.1 $73,801,802 -1.1 $75,687,074 2.6 Wyoming $6.03 23 24 $258,321 $2,390,033 825.2 $3,693,884 54.6 $3,521,722 -4.7South Carolina $5.52 24 21 $37,663,607 $19,954,852 -47.0 $41,520,747 108.1 $26,645,989 -35.8Wisconsin $4.98 25 25 $53,773,922 $56,935,743 5.9 $33,614,020 -41.0 $28,689,461 -14.7Colorado $4.87 26 28 $20,523,300 $20,493,281 -0.1 $22,128,504 8.0 $26,063,318 17.8 Kentucky $4.34 27 26 $44,267,277 $27,348,536 -38.2 $23,611,152 -13.7 $19,156,052 -18.9Idaho $3.96 28 27 $17,140,380 $18,062,903 5.4 $6,902,266 -61.8 $6,475,194 -6.2Florida $3.63 29 22 $104,316,282 $143,006,271 37.1 $166,143,561 16.2 $72,231,339 -56.5Texas $3.30 30 30 $88,774,755 $91,394,519 3.0 $92,066,692 0.7 $88,837,451 -3.5Pennsylvania $3.10 31 31 $42,743,579 $42,795,135 0.1 $43,676,112 2.1 $39,684,185 -9.1New Jersey $3.09 32 32 $23,910,348 $23,666,911 -1.0 $26,888,369 13.6 $27,588,690 2.6 Georgia $2.65 33 29 $82,092,269 $49,701,181 -39.5 $40,199,713 -19.1 $26,752,179 -33.5Illinois $2.59 34 35 $35,979,332 $34,217,864 -4.9 $31,707,455 -7.3 $33,267,533 4.9 Washington $1.84 35 38 $13,372,530 $12,033,547 -10.0 $11,814,537 -1.8 $12,952,829 9.6 West Virginia $1.62 36 39 $3,033,489 $2,636,422 -13.1 $2,798,945 6.2 $2,990,929 6.9 Arkansas $1.41 37 41 $2,522,319 $3,445,998 36.6 $3,749,582 8.8 $4,192,129 11.8 North Carolina $1.37 38 36 $88,069,505 $36,809,436 -58.2 $22,214,181 -39.7 $13,614,169 -38.7Louisiana $1.32 39 40 $22,985,322 $15,570,467 -32.3 $5,863,393 -62.3 $6,130,855 4.6 Michigan $1.00 40 34 $19,986,435 $22,340,366 11.8 $26,601,424 19.1 $9,879,250 -62.9Kansas $0.92 41 33 $30,148,251 $22,588,203 -25.1 $8,690,120 -61.5 $2,672,060 -69.3Indiana $0.89 42 43 $4,622,780 $4,955,062 7.2 $5,294,745 6.9 $5,864,476 10.8 Hawaii $0.83 43 42 $1,198,487 $1,432,370 19.5 $1,351,027 -5.7 $1,180,053 -12.7Vermont $0.10 44 44 $45,103 $89,171 97.7 $88,382 -0.9 $61,595 -30.3New Mexico $0.01 45 45 $35,906 $37,948 5.7 $23,429 -38.3 $13,757 -41.3Utah $0.00 46 46 $3,488 $6,980 100.1 $4,296 -38.5 $1,573 -63.4Alaska $0.00 n/a n/a $0 $0 0.0 $0 0.0 $0 0.0 Arizona $0.00 n/a n/a $0 $0 0.0 $0 0.0 $0 0.0 Delaware $0.00 n/a n/a $0 $0 0.0 $0 0.0 $0 0.0 Dist. of Columbia $0.00 n/a n/a $0 $0 0.0 $0 0.0 $0 0.0 South Dakota $0.00 n/a n/a $0 $0 0.0 $0 0.0 $0 0.0 United States $8.06 n/a n/a $2,777,836,743 $2,540,413,703 -8.5 $2,747,066,485 8.1 $2,568,685,852 -6.5
Notes: Data do not include services provided through managed care organizations. Data are presented based on state reporting. No further explanation of trends is available for the purposes of this report.

Rehabilitative Services (non-school based) Table P
State
FY 2015 Expenditures Per Resident
Rank 2015
Rank 2014
FY 2012 Expenditures
FY 2013 Expenditures
Percent Change 12-13
FY 2014 Expenditures
Percent Change 13-14
FY 2015 Expenditures
Percent Change 14-15
Arkansas $161.84 1 1 $312,915,884 $391,879,401 25.2 $479,506,162 22.4 $480,159,556 0.1 Rhode Island $141.72 2 2 $132,820,640 $134,507,148 1.3 $165,233,006 22.8 $149,439,992 -9.6Maryland $63.31 3 3 $333,405,307 $309,623,409 -7.1 $415,712,861 34.3 $377,782,102 -9.1Ohio $55.50 4 4 $0 $140,493,306 100.0 $587,638,007 318.3 $643,544,125 9.5 Massachusetts $52.40 5 7 $156,567,225 $318,567,615 103.5 $251,121,344 -21.2 $353,684,197 40.8 Missouri $52.14 6 6 $115,015 $260,484,117 226378.4 $262,239,167 0.7 $316,034,923 20.5 West Virginia $49.61 7 5 $78,140,992 $77,318,219 -1.1 $86,070,194 11.3 $91,709,302 6.6 Alabama $37.93 8 9 $172,709,637 $165,738,608 -4.0 $165,737,064 0.0 $183,692,443 10.8 New Hampshire $29.40 9 8 $72,720,712 $82,063,462 12.8 $48,648,870 -40.7 $39,065,130 -19.7South Carolina $27.64 10 21 $25,961,233 $26,144,961 0.7 $36,898,174 41.1 $133,440,954 261.6 Nevada $24.67 11 22 $22,929,898 $23,305,033 1.6 $20,640,663 -11.4 $69,893,594 238.6 Montana $24.32 12 10 $23,769,900 $22,904,113 -3.6 $23,288,425 1.7 $24,874,174 6.8 Mississippi $20.35 13 11 $104,560,433 $65,401,277 -37.5 $61,838,151 -5.4 $60,893,801 -1.5Illinois $15.57 14 13 $228,062,466 $275,892,710 21.0 $222,676,240 -19.3 $200,303,729 -10.0Delaware $14.26 15 16 $11,976,545 $11,819,427 -1.3 $13,052,456 10.4 $13,331,255 2.1 North Dakota $13.78 16 15 $9,502,046 $8,140,522 -14.3 $10,930,444 34.3 $10,194,014 -6.7Georgia $13.75 17 12 $57,727,476 $225,473,267 290.6 $177,495,955 -21.3 $138,709,294 -21.9South Dakota $9.75 18 18 $7,811,474 $7,666,139 -1.9 $7,644,284 -0.3 $8,310,286 8.7 Utah $9.51 19 23 $12,924,551 $13,456,775 4.1 $10,230,336 -24.0 $27,969,440 173.4 Dist. of Columbia $8.50 20 14 $29,325,120 $17,840,608 -39.2 $10,304,465 -42.2 $5,602,060 -45.6Oregon $8.34 21 20 $77,078,353 $40,152,664 -47.9 $34,288,137 -14.6 $33,099,353 -3.5Maine $8.07 22 17 $10,304,168 $12,623,958 22.5 $12,658,675 0.3 $10,740,155 -15.2New Jersey $2.01 23 25 $12,142,474 $16,492,446 35.8 $17,629,857 6.9 $17,930,043 1.7 Texas $1.91 24 24 $120,057,358 $100,100,365 -16.6 $89,451,053 -10.6 $51,341,406 -42.6Arizona $1.36 25 29 $6,923,234 $6,185,306 -10.7 $7,407,346 19.8 $9,148,345 23.5 Wisconsin $1.06 26 28 $7,535,325 $7,193,265 -4.5 $6,928,755 -3.7 $6,124,357 -11.6North Carolina $1.02 27 19 $700,651,928 $299,810,047 -57.2 $86,376,964 -71.2 $10,118,618 -88.3Indiana $0.88 28 27 $6,909,752 $7,563,306 9.5 $8,184,952 8.2 $5,791,785 -29.2California $0.37 29 26 $10,961,292 $9,372,618 -14.5 $59,275,550 532.4 $14,330,600 -75.8Vermont $0.17 30 32 $39,696 $50,049 26.1 $108,490 116.8 $107,852 -0.6Kentucky $0.16 31 38 $7,939 $752 -90.5 $3,435 356.8 $720,170 20865.6 Pennsylvania $0.14 32 33 $1,974,888 $2,030,946 2.8 $1,938,004 -4.6 $1,775,968 -8.4Louisiana $0.13 33 31 $1,112,772 $715,002 -35.7 $804,324 12.5 $608,397 -24.4Kansas $0.07 34 30 $8,597,709 $3,708,846 -56.9 $721,085 -80.6 $188,552 -73.9Hawaii $0.05 35 34 $12,279 $564 -95.4 $26,707 4635.3 $68,551 156.7 Michigan $0.01 36 35 $360,420 $245,567 -31.9 $127,383 -48.1 $140,905 10.6 Iowa $0.00 37 37 $764,555 $55,612 -92.7 $14,912 -73.2 $13,323 -10.7New Mexico $0.00 38 36 $37,004 $38,654 4.5 $18,122 -53.1 $6,889 -62.0New York $0.00 39 n/a $17,836 $214 -98.8 $0 -100.0 $153 100.0 Minnesota $0.00 n/a n/a $0 $57,312 100.0 $0 -100.0 $0 0.0 Alaska $0.00 n/a n/a $0 $0 0.0 $0 0.0 $0 0.0 Colorado $0.00 n/a n/a $0 $0 0.0 $0 0.0 $0 0.0 Connecticut $0.00 n/a n/a $0 $0 0.0 $0 0.0 $0 0.0 Florida $0.00 n/a n/a $0 $0 0.0 $0 0.0 $0 0.0 Idaho $0.00 n/a n/a $0 $0 0.0 $0 0.0 $0 0.0 Nebraska $0.00 n/a n/a $0 $0 0.0 $0 0.0 $0 0.0 Oklahoma $0.00 n/a n/a $0 $0 0.0 $0 0.0 $0 0.0 Tennessee $0.00 n/a n/a $0 $0 0.0 $0 0.0 $0 0.0 Virginia $0.00 n/a n/a $0 $0 0.0 $0 0.0 $0 0.0 Washington $0.00 n/a n/a $0 $0 0.0 $0 0.0 $0 0.0 Wyoming $0.00 n/a n/a $0 $0 0.0 $0 0.0 $0 0.0 United States $10.96 n/a n/a $2,759,435,536 $3,085,117,610 11.8 $3,382,870,019 9.7 $3,490,889,793 3.2
Notes: Data do not include services provided through managed care organizations. Data are presented based on state reporting. No further explanation of trends is available for the purposes of this report.

HCBS - Unspecified Table Q
State
FY 2015 Expenditures Per Resident
Rank 2015
Rank 2014
FY 2012 Expenditures
FY 2013 Expenditures
Percent Change 12-13
FY 2014 Expenditures
Percent Change 13-14
FY 2015 Expenditures
Percent Change 14-15
Vermont $379.55 1 1 $204,049,249 $216,400,395 6.1 $228,781,372 5.7 $237,968,832 4.0 New Mexico $342.63 2 14 $0 $0 0.0 $46,853,589 100.0 $713,711,476 1423.3 Rhode Island $316.74 3 2 $277,000,000 $299,000,000 7.9 $312,000,000 4.3 $334,000,000 7.1 Arizona $169.03 4 3 $1,032,337,906 $1,062,717,930 2.9 $1,140,302,342 7.3 $1,135,856,080 -0.4Massachusetts $134.08 5 9 $80,275,904 $0 -100.0 $261,016,062 100.0 $905,011,431 246.7 New Jersey $113.15 6 4 $0 $555,874,456 100.0 $995,928,745 79.2 $1,009,838,706 1.4 Hawaii $61.90 7 6 $67,442,912 $67,442,912 0.0 $81,234,954 20.4 $87,678,482 7.9 Iowa $57.84 8 7 $0 $106,981,343 100.0 $174,954,746 63.5 $179,782,628 2.8 Delaware $56.79 9 8 $24,993,169 $34,640,762 38.6 $39,240,140 13.3 $53,097,934 35.3 New Hampshire $44.42 10 12 $0 $0 0.0 $40,371,724 100.0 $59,022,410 46.2 Texas $42.36 11 11 $82,944,882 $581,032,618 600.5 $923,687,366 59.0 $1,141,368,780 23.6 Tennessee $36.66 12 10 $200,907,127 $228,595,035 13.8 $235,855,408 3.2 $239,950,683 1.7 Michigan $10.28 13 n/a $0 $0 0.0 $0 0.0 $101,957,983 100.0 Illinois $6.79 14 15 $0 $26,750,175 100.0 $194,155,822 625.8 $87,341,740 -55.0New York $3.64 15 5 $0 $49,812,991 100.0 $1,249,658,167 2408.7 $71,685,542 -94.3Louisiana $3.53 16 18 $0 $70,635,791 100.0 $5,842,884 -91.7 $16,413,994 180.9 California $2.85 17 16 $133,617 $253,928,846 189942.3 $268,798,488 5.9 $110,175,419 -59.0Pennsylvania $0.43 18 19 $3,506,624 $4,766,268 35.9 $5,578,116 17.0 $5,562,201 -0.3Indiana $0.29 19 17 $0 $4,417,951 100.0 $9,787,712 121.5 $1,897,080 -80.6Virginia $0.13 20 20 $0 $0 0.0 $1,920,754 100.0 $1,076,547 -44.0Alabama $0.00 n/a n/a $0 $0 0.0 $0 0.0 $0 0.0 Alaska $0.00 n/a n/a $0 $0 0.0 $0 0.0 $0 0.0 Arkansas $0.00 n/a n/a $0 $0 0.0 $0 0.0 $0 0.0 Colorado $0.00 n/a n/a $0 $0 0.0 $0 0.0 $0 0.0 Connecticut $0.00 n/a n/a $0 $0 0.0 $0 0.0 $0 0.0 Dist. of Columbia $0.00 n/a n/a $0 $0 0.0 $0 0.0 $0 0.0 Florida $0.00 n/a n/a $0 $0 0.0 $0 0.0 $0 0.0 Georgia $0.00 n/a n/a $0 $0 0.0 $0 0.0 $0 0.0 Idaho $0.00 n/a n/a $0 $0 0.0 $0 0.0 $0 0.0 Kansas $0.00 n/a n/a $0 $0 0.0 $0 0.0 $0 0.0 Kentucky $0.00 n/a n/a $0 $0 0.0 $0 0.0 $0 0.0 Maine $0.00 n/a n/a $0 $0 0.0 $0 0.0 $0 0.0 Maryland $0.00 n/a n/a $0 $0 0.0 $0 0.0 $0 0.0 Minnesota $0.00 n/a n/a $0 $0 0.0 $0 0.0 $0 0.0 Mississippi $0.00 n/a n/a $0 $0 0.0 $0 0.0 $0 0.0 Missouri $0.00 n/a n/a $0 $0 0.0 $0 0.0 $0 0.0 Montana $0.00 n/a n/a $0 $0 0.0 $0 0.0 $0 0.0 Nebraska $0.00 n/a n/a $0 $0 0.0 $0 0.0 $0 0.0 Nevada $0.00 n/a n/a $0 $0 0.0 $0 0.0 $0 0.0 North Carolina $0.00 n/a n/a $0 $0 0.0 $0 0.0 $0 0.0 North Dakota $0.00 n/a n/a $0 $0 0.0 $0 0.0 $0 0.0 Ohio $0.00 n/a 13 $0 $26,543,658 100.0 $309,637,903 1066.5 $0 -100.0Oklahoma $0.00 n/a n/a $0 $0 0.0 $0 0.0 $0 0.0 Oregon $0.00 n/a n/a $0 $0 0.0 $0 0.0 $0 0.0 South Carolina $0.00 n/a n/a $0 $0 0.0 $0 0.0 $0 0.0 South Dakota $0.00 n/a n/a $0 $0 0.0 $0 0.0 $0 0.0 Utah $0.00 n/a n/a $0 $0 0.0 $0 0.0 $0 0.0 Washington $0.00 n/a 21 $63,397 $0 -100.0 $199,662 100.0 $0 -100.0West Virginia $0.00 n/a n/a $0 $0 0.0 $0 0.0 $0 0.0 Wisconsin $0.00 n/a n/a $0 $0 0.0 $0 0.0 $0 0.0 Wyoming $0.00 n/a n/a $0 $0 0.0 $0 0.0 $0 0.0 United States $20.38 n/a n/a $1,973,654,787 $3,589,541,131 81.9 $6,525,805,956 81.8 $6,493,397,948 -0.5
Notes: HCBS - unspecified refers to HCBS provided through managed care organizations and fee-for-service HCBS provided in 1115 demonstrations that were not authorized under another state plan or waiver authority. Arizona 2012 - 2014 data, California 2013 data, and New Mexico 2015 data include expenditures for state plan personal care and home health expenditures within managed care programs. States provided estimates for all non-institutional HCBS, which is used in this table. Delaware 2012 data were incomplete because the transition to managed care occurred during that year; state estimates were included starting in 2013. Hawaii provided an estimate for calendar year 2012. This estimate was used for both FY 2012 and FY 2013. Rhode Island data are for state fiscal years. Data do not include expenditures for a managed care program in California (2012, 2014, 2015). Data are presented based on state reporting. No further explanation of trends is available for the purposes of this report.

Program of All-Inclusive Care for the Elderly Table R
State
FY 2015 Expenditures Per Resident
Rank 2015
Rank 2014
FY 2012 Expenditures
FY 2013 Expenditures
Percent Change 12-13
FY 2014 Expenditures
Percent Change 13-14
FY 2015 Expenditures
Percent Change 14-15
Colorado $23.17 1 1 $92,509,538 $98,056,171 6.0 $103,681,434 5.7 $123,955,089 19.6 Massachusetts $20.98 2 2 $110,005,286 $116,965,844 6.3 $129,176,068 10.4 $141,646,074 9.7 Pennsylvania $17.29 3 4 $149,136,637 $167,642,837 12.4 $194,215,480 15.9 $221,089,262 13.8 New York $15.18 4 3 $236,132,342 $283,239,312 19.9 $330,288,623 16.6 $299,355,425 -9.4Oregon $11.61 5 5 $29,018,628 $31,939,638 10.1 $39,067,449 22.3 $46,055,838 17.9 Delaware $8.97 6 11 $0 $333,966 100.0 $4,490,848 1244.7 $8,388,529 86.8 North Dakota $8.76 7 6 $3,192,118 $3,687,704 15.5 $4,321,976 17.2 $6,481,366 50.0 Virginia $6.89 8 7 $30,026,671 $36,349,943 21.1 $48,121,184 32.4 $57,323,907 19.1 New Mexico $5.68 9 8 $11,556,837 $11,738,681 1.6 $11,873,948 1.2 $11,832,530 -0.3California $5.63 10 9 $170,761,037 $171,804,006 0.6 $194,383,993 13.1 $217,759,638 12.0 North Carolina $5.03 11 14 $12,304,147 $21,590,714 75.5 $31,688,995 46.8 $50,001,030 57.8 New Jersey $4.91 12 10 $30,395,969 $39,273,430 29.2 $44,055,745 12.2 $43,803,101 -0.6Michigan $4.80 13 13 $25,678,432 $28,761,048 12.0 $36,633,938 27.4 $47,615,559 30.0 Kansas $4.37 14 12 $7,519,717 $8,098,801 7.7 $14,029,992 73.2 $12,656,040 -9.8Wyoming $4.15 15 17 $0 $384,713 100.0 $1,556,611 304.6 $2,421,098 55.5 Iowa $3.22 16 16 $4,703,460 $6,969,021 48.2 $8,663,854 24.3 $10,005,176 15.5 South Carolina $2.68 17 15 $12,155,354 $12,074,593 -0.7 $13,427,420 11.2 $12,916,303 -3.8Nebraska $2.37 18 23 $0 $516,102 100.0 $2,891,265 460.2 $4,462,467 54.3 Louisiana $2.34 19 18 $11,167,431 $10,285,753 -7.9 $10,338,460 0.5 $10,896,209 5.4 Arkansas $2.31 20 19 $3,889,642 $5,405,993 39.0 $6,355,149 17.6 $6,847,209 7.7 Washington $1.88 21 21 $11,527,330 $11,215,448 -2.7 $13,038,202 16.3 $13,278,837 1.8 Tennessee $1.61 22 22 $11,425,770 $10,836,577 -5.2 $11,031,241 1.8 $10,531,828 -4.5Florida $1.54 23 26 $14,721,563 $20,974,041 42.5 $23,244,020 10.8 $30,631,912 31.8 Oklahoma $1.51 24 28 $3,191,700 $4,026,118 26.1 $4,188,177 4.0 $5,859,363 39.9 Alabama $1.40 25 25 $1,032,300 $4,125,113 299.6 $6,119,891 48.4 $6,801,420 11.1 Texas $1.40 26 24 $34,967,494 $35,681,056 2.0 $36,811,803 3.2 $37,634,651 2.2 Missouri $1.18 27 27 $6,228,521 $6,776,334 8.8 $6,759,291 -0.3 $7,124,634 5.4 Ohio $0.91 28 20 $22,605,111 $17,457,400 -22.8 $24,518,414 40.4 $10,498,486 -57.2Maryland $0.86 29 29 $6,126,115 $6,101,805 -0.4 $5,973,026 -2.1 $5,124,605 -14.2Indiana $0.04 30 n/a $0 $0 0.0 $0 0.0 $262,825 100.0 Vermont $0.00 n/a n/a $5,736,135 $2,880,241 -49.8 $0 -100.0 $0 0.0 Alaska $0.00 n/a n/a $0 $0 0.0 $0 0.0 $0 0.0 Arizona $0.00 n/a n/a $0 $0 0.0 $0 0.0 $0 0.0 Connecticut $0.00 n/a n/a $0 $0 0.0 $0 0.0 $0 0.0 Dist. of Columbia $0.00 n/a n/a $0 $0 0.0 $0 0.0 $0 0.0 Georgia $0.00 n/a n/a $0 $0 0.0 $0 0.0 $0 0.0 Hawaii $0.00 n/a n/a $0 $0 0.0 $0 0.0 $0 0.0 Idaho $0.00 n/a n/a $0 $0 0.0 $0 0.0 $0 0.0 Illinois $0.00 n/a n/a $0 $0 0.0 $0 0.0 $0 0.0 Kentucky $0.00 n/a n/a $0 $0 0.0 $0 0.0 $0 0.0 Maine $0.00 n/a n/a $0 $0 0.0 $0 0.0 $0 0.0 Minnesota $0.00 n/a n/a $0 $0 0.0 $0 0.0 $0 0.0 Mississippi $0.00 n/a n/a $0 $0 0.0 $0 0.0 $0 0.0 Montana $0.00 n/a n/a $0 $0 0.0 $0 0.0 $0 0.0 Nevada $0.00 n/a n/a $0 $0 0.0 $0 0.0 $0 0.0 New Hampshire $0.00 n/a n/a $0 $0 0.0 $0 0.0 $0 0.0 Rhode Island $0.00 n/a n/a $0 $0 0.0 $0 0.0 $0 0.0 South Dakota $0.00 n/a n/a $0 $0 0.0 $0 0.0 $0 0.0 Utah $0.00 n/a n/a $0 $0 0.0 $0 0.0 $0 0.0 West Virginia $0.00 n/a n/a $0 $0 0.0 $0 0.0 $0 0.0 Wisconsin $0.00 n/a n/a $0 $0 0.0 $0 0.0 $0 0.0 United States $4.59 n/a n/a $1,057,715,285 $1,175,192,403 11.1 $1,360,946,497 15.8 $1,463,260,411 7.5
Note: Data are presented based on state reporting. No further explanation of trends is available for the purposes of this report.

Private Duty Nursing Table S
State
FY 2015 Expenditures Per Resident
Rank 2015
Rank 2014
FY 2012 Expenditures
FY 2013 Expenditures
Percent Change 12-13
FY 2014 Expenditures
Percent Change 13-14
FY 2015 Expenditures
Percent Change 14-15
Minnesota $22.21 1 1 $96,271,230 $100,548,295 4.4 $111,452,701 10.8 $121,094,296 8.7 Maryland $16.39 2 2 $88,656,252 $93,334,012 5.3 $96,610,580 3.5 $97,778,395 1.2 Maine $13.81 3 3 $10,351,890 $11,310,121 9.3 $13,026,589 15.2 $18,371,476 41.0 Missouri $9.47 4 4 $40,152,749 $49,206,499 22.5 $52,562,293 6.8 $57,366,955 9.1 North Carolina $8.29 5 5 $71,749,914 $73,583,466 2.6 $83,885,995 14.0 $82,306,874 -1.9 Wisconsin $7.25 6 7 $45,693,394 $45,621,177 -0.2 $43,824,176 -3.9 $41,734,759 -4.8 Ohio $5.45 7 8 $60,200,590 $65,198,185 8.3 $66,093,517 1.4 $63,191,731 -4.4 Nevada $5.09 8 10 $9,878,241 $12,054,992 22.0 $11,457,799 -5.0 $14,424,214 25.9 Montana $4.24 9 11 $4,049,267 $4,308,224 6.4 $4,159,487 -3.5 $4,336,753 4.3 West Virginia $4.08 10 12 $4,677,523 $5,715,266 22.2 $6,786,548 18.7 $7,546,660 11.2 New Hampshire $3.75 11 9 $6,138,941 $7,771,237 26.6 $5,634,735 -27.5 $4,977,710 -11.7 Florida $3.26 12 6 $152,671,772 $143,696,753 -5.9 $160,386,008 11.6 $64,848,667 -59.6 Michigan $3.05 13 13 $27,821,560 $31,034,276 11.5 $33,253,214 7.1 $30,269,492 -9.0 South Carolina $3.01 14 16 $7,068,025 $9,650,295 36.5 $13,175,648 36.5 $14,554,210 10.5 Arkansas $2.88 15 15 $9,501,732 $9,156,451 -3.6 $9,617,937 5.0 $8,538,024 -11.2 Illinois $2.50 16 14 $43,046,981 $57,630,652 33.9 $43,197,356 -25.0 $32,153,275 -25.6 Mississippi $2.45 17 20 $4,778,972 $5,105,233 6.8 $5,219,631 2.2 $7,340,520 40.6 Virginia $2.31 18 17 $4,712,940 $18,164,375 285.4 $21,385,328 17.7 $19,211,460 -10.2 Washington $2.19 19 18 $3,326,075 $14,265,541 328.9 $14,760,586 3.5 $15,416,044 4.4 Delaware $1.59 20 19 $4,004,661 $2,112,582 -47.2 $1,730,750 -18.1 $1,490,500 -13.9 Alabama $1.06 21 21 $5,706,374 $5,588,842 -2.1 $4,903,823 -12.3 $5,153,932 5.1 Massachusetts $0.64 22 51 $1,341 $12,569 837.3 -$13,939 -210.9 $4,330,569 -31168.0 Utah $0.63 23 22 $2,769,570 $2,037,739 -26.4 $1,699,716 -16.6 $1,851,960 9.0 North Dakota $0.43 24 50 $0 $0 0.0 -$53 100.0 $317,338 -598850.9 New Jersey $0.18 25 24 $1,399,112 $1,007,425 -28.0 $1,488,894 47.8 $1,614,656 8.4 New Mexico $0.06 26 25 $367,374 $359,994 -2.0 $234,209 -34.9 $129,205 -44.8 Kentucky $0.04 27 n/a $0 $0 0.0 $0 0.0 $181,465 100.0 Iowa $0.00 28 23 $0 $0 0.0 $595,202 100.0 -$1,523 -100.3 Alaska $0.00 n/a n/a $0 $0 0.0 $0 0.0 $0 0.0 Arizona $0.00 n/a n/a $0 $0 0.0 $0 0.0 $0 0.0 California $0.00 n/a n/a $0 $0 0.0 $0 0.0 $0 0.0 Colorado $0.00 n/a n/a $0 $0 0.0 $0 0.0 $0 0.0 Connecticut $0.00 n/a n/a $0 $0 0.0 $0 0.0 $0 0.0 Dist. of Columbia $0.00 n/a n/a $0 $0 0.0 $0 0.0 $0 0.0 Georgia $0.00 n/a n/a $0 $0 0.0 $0 0.0 $0 0.0 Hawaii $0.00 n/a n/a $0 $0 0.0 $0 0.0 $0 0.0 Idaho $0.00 n/a n/a $0 $0 0.0 $0 0.0 $0 0.0 Indiana $0.00 n/a n/a $0 $0 0.0 $0 0.0 $0 0.0 Kansas $0.00 n/a n/a $0 $0 0.0 $0 0.0 $0 0.0 Louisiana $0.00 n/a n/a $0 $0 0.0 $0 0.0 $0 0.0 Nebraska $0.00 n/a n/a $0 $0 0.0 $0 0.0 $0 0.0 New York $0.00 n/a n/a $0 $0 0.0 $0 0.0 $0 0.0 Oklahoma $0.00 n/a n/a $0 $0 0.0 $0 0.0 $0 0.0 Oregon $0.00 n/a n/a $0 $0 0.0 $0 0.0 $0 0.0 Pennsylvania $0.00 n/a n/a $0 $0 0.0 $0 0.0 $0 0.0 Rhode Island $0.00 n/a n/a $0 $0 0.0 $0 0.0 $0 0.0 South Dakota $0.00 n/a n/a $0 $0 0.0 $0 0.0 $0 0.0 Tennessee $0.00 n/a n/a $0 $0 0.0 $0 0.0 $0 0.0 Texas $0.00 n/a n/a $0 $0 0.0 $0 0.0 $0 0.0 Vermont $0.00 n/a n/a $0 $0 0.0 $0 0.0 $0 0.0 Wyoming $0.00 n/a n/a $0 $0 0.0 $0 0.0 $0 0.0 United States $2.26 n/a n/a $704,996,480 $768,474,201 9.0 $807,128,730 5.0 $720,529,617 -10.7
Notes: Data do not include services provided through managed care organizations. Data are presented based on state reporting. No further explanation of trends is available for the purposes of this report.

State Plan HCBS (Section 1915(i)) Table T
State
FY 2015 Expenditures Per Resident
Rank 2015
Rank 2014
FY 2012 Expenditures
FY 2013 Expenditures
Percent Change 12-13
FY 2014 Expenditures
Percent Change 13-14
FY 2015 Expenditures
Percent Change 14-15
Oregon $18.82 1 1 $17,963 -$3,460,547 -19364.9 $85,247,442 -2563.4 $74,690,012 -12.4 California $10.66 2 2 $11,187,735 $533,828,329 4671.5 $287,258,490 -46.2 $412,260,552 43.5 Nevada $2.59 3 3 $5,149,969 $5,439,980 5.6 $6,716,183 23.5 $7,329,954 9.1 Wisconsin $1.10 4 4 $3,458,850 $3,659,624 5.8 $4,202,492 14.8 $6,361,564 51.4 Indiana $0.74 5 8 $0 $0 0.0 $298,328 100.0 $4,912,222 1546.6 Colorado $0.56 6 6 $2,845,288 $2,369,363 -16.7 $2,168,623 -8.5 $3,012,084 38.9 Iowa $0.47 7 5 $18,591,409 $85,922,630 362.2 $1,308,890 -98.5 $1,461,695 11.7 Montana $0.10 8 7 $0 $80,877 100.0 $325,727 302.7 $102,889 -68.4 Florida $0.06 9 9 $0 $0 0.0 $317,585 100.0 $1,138,980 258.6 Louisiana $0.00 10 10 $0 $0 0.0 $4,595 100.0 $4,655 1.3 Alabama $0.00 n/a n/a $0 $0 0.0 $0 0.0 $0 0.0 Alaska $0.00 n/a n/a $0 $0 0.0 $0 0.0 $0 0.0 Arizona $0.00 n/a n/a $0 $0 0.0 $0 0.0 $0 0.0 Arkansas $0.00 n/a n/a $0 $0 0.0 $0 0.0 $0 0.0 Connecticut $0.00 n/a n/a $0 $0 0.0 $0 0.0 $0 0.0 Delaware $0.00 n/a n/a $0 $0 0.0 $0 0.0 $0 0.0 Dist. of Columbia $0.00 n/a n/a $0 $0 0.0 $0 0.0 $0 0.0 Georgia $0.00 n/a n/a $0 $0 0.0 $0 0.0 $0 0.0 Hawaii $0.00 n/a n/a $0 $0 0.0 $0 0.0 $0 0.0 Idaho $0.00 n/a n/a $0 $0 0.0 $0 0.0 $0 0.0 Illinois $0.00 n/a n/a $0 $0 0.0 $0 0.0 $0 0.0 Kansas $0.00 n/a n/a $0 $0 0.0 $0 0.0 $0 0.0 Kentucky $0.00 n/a n/a $0 $0 0.0 $0 0.0 $0 0.0 Maine $0.00 n/a n/a $0 $0 0.0 $0 0.0 $0 0.0 Maryland $0.00 n/a n/a $0 $0 0.0 $0 0.0 $0 0.0 Massachusetts $0.00 n/a n/a $0 $0 0.0 $0 0.0 $0 0.0 Michigan $0.00 n/a n/a $0 $0 0.0 $0 0.0 $0 0.0 Minnesota $0.00 n/a n/a $0 $0 0.0 $0 0.0 $0 0.0 Mississippi $0.00 n/a n/a $0 $0 0.0 $0 0.0 $0 0.0 Missouri $0.00 n/a n/a $0 $0 0.0 $0 0.0 $0 0.0 Nebraska $0.00 n/a n/a $0 $0 0.0 $0 0.0 $0 0.0 New Hampshire $0.00 n/a n/a $0 $0 0.0 $0 0.0 $0 0.0 New Jersey $0.00 n/a n/a $0 $0 0.0 $0 0.0 $0 0.0 New Mexico $0.00 n/a n/a $0 $0 0.0 $0 0.0 $0 0.0 New York $0.00 n/a n/a $0 $0 0.0 $0 0.0 $0 0.0 North Carolina $0.00 n/a n/a $0 $0 0.0 $0 0.0 $0 0.0 North Dakota $0.00 n/a n/a $0 $0 0.0 $0 0.0 $0 0.0 Ohio $0.00 n/a n/a $0 $0 0.0 $0 0.0 $0 0.0 Oklahoma $0.00 n/a n/a $0 $0 0.0 $0 0.0 $0 0.0 Pennsylvania $0.00 n/a n/a $0 $0 0.0 $0 0.0 $0 0.0 Rhode Island $0.00 n/a n/a $0 $0 0.0 $0 0.0 $0 0.0 South Carolina $0.00 n/a n/a $0 $0 0.0 $0 0.0 $0 0.0 South Dakota $0.00 n/a n/a $0 $0 0.0 $0 0.0 $0 0.0 Tennessee $0.00 n/a n/a $0 $0 0.0 $0 0.0 $0 0.0 Texas $0.00 n/a n/a $0 $0 0.0 $0 0.0 $0 0.0 Utah $0.00 n/a n/a $0 $0 0.0 $0 0.0 $0 0.0 Vermont $0.00 n/a n/a $0 $0 0.0 $0 0.0 $0 0.0 Virginia $0.00 n/a n/a $0 $0 0.0 $0 0.0 $0 0.0 Washington $0.00 n/a n/a $0 $0 0.0 $0 0.0 $0 0.0 West Virginia $0.00 n/a n/a $0 $0 0.0 $0 0.0 $0 0.0 Wyoming $0.00 n/a n/a $0 $0 0.0 $0 0.0 $0 0.0 United States $1.60 n/a n/a $41,251,214 $627,840,256 1422.0 $387,848,355 -38.2 $511,274,607 31.8
Notes: Data do not include services provided through managed care organizations. Data are presented based on state reporting. No further explanation of trends is available for the purposes of this report.

Self-Directed Personal Assistance Services (Section 1915(j)) as an Alternative to Section 1915(c) Waivers Table U
State
FY 2015 Expenditures Per Resident
Rank 2015
Rank 2014
FY 2012 Expenditures
FY 2013 Expenditures
Percent Change 12-13
FY 2014 Expenditures
Percent Change 13-14
FY 2015 Expenditures
Percent Change 14-15
Oregon $3.48 1 2 $0 $1,380,050 100.0 $3,435,083 148.9 $13,813,865 302.1 Florida $3.06 2 1 $64,109,198 $69,211,892 8.0 $63,301,559 -8.5 $60,851,610 -3.9 New Jersey $0.95 3 n/a $0 $984,156 100.0 $0 -100.0 $8,498,017 100.0 Maryland $0.00 n/a n/a $0 $0 0.0 $0 0.0 $0 0.0 Massachusetts $0.00 n/a n/a $0 $0 0.0 $0 0.0 $0 0.0 Alabama $0.00 n/a n/a $0 $0 0.0 $0 0.0 $0 0.0 Alaska $0.00 n/a n/a $0 $0 0.0 $0 0.0 $0 0.0 Arizona $0.00 n/a n/a $0 $0 0.0 $0 0.0 $0 0.0 Arkansas $0.00 n/a n/a $0 $0 0.0 $0 0.0 $0 0.0 California $0.00 n/a n/a $0 $0 0.0 $0 0.0 $0 0.0 Colorado $0.00 n/a n/a $0 $0 0.0 $0 0.0 $0 0.0 Connecticut $0.00 n/a n/a $0 $0 0.0 $0 0.0 $0 0.0 Delaware $0.00 n/a n/a $0 $0 0.0 $0 0.0 $0 0.0 Dist. of Columbia $0.00 n/a n/a $0 $0 0.0 $0 0.0 $0 0.0 Georgia $0.00 n/a n/a $0 $0 0.0 $0 0.0 $0 0.0 Hawaii $0.00 n/a n/a $0 $0 0.0 $0 0.0 $0 0.0 Idaho $0.00 n/a n/a $0 $0 0.0 $0 0.0 $0 0.0 Illinois $0.00 n/a n/a $0 $0 0.0 $0 0.0 $0 0.0 Indiana $0.00 n/a n/a $0 $0 0.0 $0 0.0 $0 0.0 Iowa $0.00 n/a n/a $0 $0 0.0 $0 0.0 $0 0.0 Kansas $0.00 n/a n/a $0 $0 0.0 $0 0.0 $0 0.0 Kentucky $0.00 n/a n/a $0 $0 0.0 $0 0.0 $0 0.0 Louisiana $0.00 n/a n/a $0 $0 0.0 $0 0.0 $0 0.0 Maine $0.00 n/a n/a $0 $0 0.0 $0 0.0 $0 0.0 Michigan $0.00 n/a n/a $0 $0 0.0 $0 0.0 $0 0.0 Minnesota $0.00 n/a n/a $0 $0 0.0 $0 0.0 $0 0.0 Mississippi $0.00 n/a n/a $0 $0 0.0 $0 0.0 $0 0.0 Missouri $0.00 n/a n/a $0 $0 0.0 $0 0.0 $0 0.0 Montana $0.00 n/a n/a $0 $0 0.0 $0 0.0 $0 0.0 Nebraska $0.00 n/a n/a $0 $0 0.0 $0 0.0 $0 0.0 Nevada $0.00 n/a n/a $0 $0 0.0 $0 0.0 $0 0.0 New Hampshire $0.00 n/a n/a $0 $0 0.0 $0 0.0 $0 0.0 New Mexico $0.00 n/a n/a $0 $0 0.0 $0 0.0 $0 0.0 New York $0.00 n/a n/a $0 $0 0.0 $0 0.0 $0 0.0 North Carolina $0.00 n/a n/a $0 $0 0.0 $0 0.0 $0 0.0 North Dakota $0.00 n/a n/a $0 $0 0.0 $0 0.0 $0 0.0 Ohio $0.00 n/a n/a $0 $0 0.0 $0 0.0 $0 0.0 Oklahoma $0.00 n/a n/a $0 $0 0.0 $0 0.0 $0 0.0 Pennsylvania $0.00 n/a n/a $0 $0 0.0 $0 0.0 $0 0.0 Rhode Island $0.00 n/a n/a $0 $0 0.0 $0 0.0 $0 0.0 South Carolina $0.00 n/a n/a $0 $0 0.0 $0 0.0 $0 0.0 South Dakota $0.00 n/a n/a $0 $0 0.0 $0 0.0 $0 0.0 Tennessee $0.00 n/a n/a $0 $0 0.0 $0 0.0 $0 0.0 Texas $0.00 n/a n/a $0 $0 0.0 $0 0.0 $0 0.0 Utah $0.00 n/a n/a $0 $0 0.0 $0 0.0 $0 0.0 Vermont $0.00 n/a n/a $0 $0 0.0 $0 0.0 $0 0.0 Virginia $0.00 n/a n/a $0 $0 0.0 $0 0.0 $0 0.0 Washington $0.00 n/a n/a $0 $0 0.0 $0 0.0 $0 0.0 West Virginia $0.00 n/a n/a $0 $0 0.0 $0 0.0 $0 0.0 Wisconsin $0.00 n/a n/a $0 $0 0.0 $0 0.0 $0 0.0 Wyoming $0.00 n/a n/a $0 $0 0.0 $0 0.0 $0 0.0 United States $0.26 n/a n/a $64,109,198 $71,576,098 11.6 $66,736,642 -6.8 $83,163,492 24.6
Note: Data are presented based on state reporting. No further explanation of trends is available for the purposes of this report.

Self-Directed Personal Assistance Services (Section 1915(j)) as an Alternative to Personal Care Table V
State
FY 2015 Expenditures Per Resident
Rank 2015
Rank 2014
FY 2012 Expenditures
FY 2013 Expenditures
Percent Change 12-13
FY 2014 Expenditures
Percent Change 13-14
FY 2015 Expenditures
Percent Change 14-15
Arkansas $10.37 1 1 $27,406,280 $27,802,151 1.4 $26,591,298 -4.4 $30,762,971 15.7 California $0.40 2 4 $80,806,631 $46,990,894 -41.8 $8,596,057 -81.7 $15,326,022 78.3 Texas $0.21 3 3 $2,853,481 $5,306,142 86.0 $6,390,777 20.4 $5,786,243 -9.5 New Jersey $0.15 4 2 $21,517,849 $37,332,961 73.5 $39,449,363 5.7 $1,359,630 -96.6 Alabama $0.00 n/a n/a $0 $0 0.0 $0 0.0 $0 0.0 Delaware $0.00 n/a n/a $0 $0 0.0 $0 0.0 $0 0.0 Hawaii $0.00 n/a n/a $0 $0 0.0 $0 0.0 $0 0.0 Idaho $0.00 n/a n/a $0 $0 0.0 $0 0.0 $0 0.0 Maryland $0.00 n/a n/a $0 $0 0.0 $0 0.0 $0 0.0 Minnesota $0.00 n/a n/a $0 $0 0.0 $0 0.0 $0 0.0 Montana $0.00 n/a n/a $0 $0 0.0 $0 0.0 $0 0.0 Nebraska $0.00 n/a n/a $0 $0 0.0 $0 0.0 $0 0.0 New Mexico $0.00 n/a n/a $0 $0 0.0 $0 0.0 $0 0.0 North Dakota $0.00 n/a n/a $0 $0 0.0 $0 0.0 $0 0.0 Oklahoma $0.00 n/a n/a $0 $0 0.0 $0 0.0 $0 0.0 South Carolina $0.00 n/a n/a $0 $0 0.0 $0 0.0 $0 0.0 Vermont $0.00 n/a n/a $0 $0 0.0 $0 0.0 $0 0.0 Washington $0.00 n/a n/a $0 $0 0.0 $0 0.0 $0 0.0 Wisconsin $0.00 n/a 5 $0 $0 0.0 $858 100.0 $0 -100.0 Oregon $0.00 20 n/a $172,727 $1,685,633 875.9 $0 -100.0 -$8,010 100.0 Alaska $0.00 n/a n/a $0 $0 0.0 $0 0.0 $0 0.0 Arizona $0.00 n/a n/a $0 $0 0.0 $0 0.0 $0 0.0 Colorado $0.00 n/a n/a $0 $0 0.0 $0 0.0 $0 0.0 Connecticut $0.00 n/a n/a $0 $0 0.0 $0 0.0 $0 0.0 Dist. of Columbia $0.00 n/a n/a $0 $0 0.0 $0 0.0 $0 0.0 Florida $0.00 n/a n/a $0 $0 0.0 $0 0.0 $0 0.0 Georgia $0.00 n/a n/a $0 $0 0.0 $0 0.0 $0 0.0 Illinois $0.00 n/a n/a $0 $0 0.0 $0 0.0 $0 0.0 Indiana $0.00 n/a n/a $0 $0 0.0 $0 0.0 $0 0.0 Iowa $0.00 n/a n/a $0 $0 0.0 $0 0.0 $0 0.0 Kansas $0.00 n/a n/a $0 $0 0.0 $0 0.0 $0 0.0 Kentucky $0.00 n/a n/a $0 $0 0.0 $0 0.0 $0 0.0 Louisiana $0.00 n/a n/a $0 $0 0.0 $0 0.0 $0 0.0 Maine $0.00 n/a n/a $0 $0 0.0 $0 0.0 $0 0.0 Massachusetts $0.00 n/a n/a $0 $0 0.0 $0 0.0 $0 0.0 Michigan $0.00 n/a n/a $0 $0 0.0 $0 0.0 $0 0.0 Mississippi $0.00 n/a n/a $0 $0 0.0 $0 0.0 $0 0.0 Missouri $0.00 n/a n/a $0 $0 0.0 $0 0.0 $0 0.0 Nevada $0.00 n/a n/a $0 $0 0.0 $0 0.0 $0 0.0 New Hampshire $0.00 n/a n/a $0 $0 0.0 $0 0.0 $0 0.0 New York $0.00 n/a n/a $0 $0 0.0 $0 0.0 $0 0.0 North Carolina $0.00 n/a n/a $0 $0 0.0 $0 0.0 $0 0.0 Ohio $0.00 n/a n/a $0 $0 0.0 $0 0.0 $0 0.0 Pennsylvania $0.00 n/a n/a $0 $0 0.0 $0 0.0 $0 0.0 Rhode Island $0.00 n/a n/a $0 $0 0.0 $0 0.0 $0 0.0 South Dakota $0.00 n/a n/a $0 $0 0.0 $0 0.0 $0 0.0 Tennessee $0.00 n/a n/a $0 $0 0.0 $0 0.0 $0 0.0 Utah $0.00 n/a n/a $0 $0 0.0 $0 0.0 $0 0.0 Virginia $0.00 n/a n/a $0 $0 0.0 $0 0.0 $0 0.0 West Virginia $0.00 n/a n/a $0 $0 0.0 $0 0.0 $0 0.0 Wyoming $0.00 n/a n/a $0 $0 0.0 $0 0.0 $0 0.0 United States $0.17 n/a n/a $132,756,968 $119,117,781 -10.3 $81,028,353 -32.0 $53,226,856 -34.3
Note: Data are presented based on state reporting. No further explanation of trends is available for the purposes of this report.

Health Homes Table W
State
FY 2015 Expenditures Per Resident
Rank 2015
Rank 2014
FY 2012 Expenditures
FY 2013 Expenditures
Percent Change 12-13
FY 2014 Expenditures
Percent Change 13-14
FY 2015 Expenditures
Percent Change 14-15
New York $23.97 1 1 $11,767,759 $178,765,959 1419.1 $292,350,240 63.5 $472,619,404 61.7 Iowa $15.21 2 2 $9,191 $6,589,659 71596.9 $31,437,033 377.1 $47,279,025 50.4 Maine $12.22 3 3 $0 $2,885,832 100.0 $9,745,330 237.7 $16,259,026 66.8 Kansas $8.60 4 51 $0 $0 0.0 -$444,570 100.0 $24,935,895 -5709.0 Alabama $5.48 5 4 $4,397,365 $19,264,711 338.1 $23,041,180 19.6 $26,516,633 15.1 Missouri $5.04 6 6 $17,083,299 $22,045,331 29.0 $26,900,983 22.0 $30,554,641 13.6 Rhode Island $4.56 7 5 $26,898,255 $36,348,836 35.1 $4,757,206 -86.9 $4,808,227 1.1 Ohio $3.23 8 8 $0 $39,996,016 100.0 $43,758,127 9.4 $37,486,844 -14.3 South Dakota $3.01 9 7 $0 $650,538 100.0 $3,537,761 443.8 $2,563,451 -27.5 Oklahoma $2.31 10 n/a $0 $0 0.0 $0 0.0 $8,963,577 100.0 Idaho $0.98 11 10 $0 $1,152,152 100.0 $1,732,705 50.4 $1,607,831 -7.2 Washington $0.98 12 11 $0 $9,864 100.0 $1,574,514 15862.2 $6,880,717 337.0 Maryland $0.46 13 12 $0 $0 0.0 $708,722 100.0 $2,724,521 284.4 West Virginia $0.20 14 n/a $0 $0 0.0 $0 0.0 $371,191 100.0 Wisconsin $0.06 15 13 $0 $155,351 100.0 $221,481 42.6 $330,024 49.0 Michigan $0.05 16 n/a $0 $0 0.0 $0 0.0 $495,942 100.0 North Carolina $0.00 n/a n/a $54,661,419 $69,974,727 28.0 $0 -100.0 $0 0.0 Oregon $0.00 n/a 9 -$130,081 $16,523,852 -12802.7 $4,620,937 -72.0 $0 -100.0 Alaska $0.00 n/a n/a $0 $0 0.0 $0 0.0 $0 0.0 Arizona $0.00 n/a n/a $0 $0 0.0 $0 0.0 $0 0.0 Arkansas $0.00 n/a n/a $0 $0 0.0 $0 0.0 $0 0.0 California $0.00 n/a n/a $0 $0 0.0 $0 0.0 $0 0.0 Colorado $0.00 n/a n/a $0 $0 0.0 $0 0.0 $0 0.0 Connecticut $0.00 n/a n/a $0 $0 0.0 $0 0.0 $0 0.0 Delaware $0.00 n/a n/a $0 $0 0.0 $0 0.0 $0 0.0 Dist. of Columbia $0.00 n/a n/a $0 $0 0.0 $0 0.0 $0 0.0 Florida $0.00 n/a n/a $0 $0 0.0 $0 0.0 $0 0.0 Georgia $0.00 n/a n/a $0 $0 0.0 $0 0.0 $0 0.0 Hawaii $0.00 n/a n/a $0 $0 0.0 $0 0.0 $0 0.0 Illinois $0.00 n/a n/a $0 $0 0.0 $0 0.0 $0 0.0 Indiana $0.00 n/a n/a $0 $0 0.0 $0 0.0 $0 0.0 Kentucky $0.00 n/a n/a $0 $0 0.0 $0 0.0 $0 0.0 Louisiana $0.00 n/a n/a $0 $0 0.0 $0 0.0 $0 0.0 Massachusetts $0.00 n/a n/a $0 $0 0.0 $0 0.0 $0 0.0 Minnesota $0.00 n/a n/a $0 $0 0.0 $0 0.0 $0 0.0 Mississippi $0.00 n/a n/a $0 $0 0.0 $0 0.0 $0 0.0 Montana $0.00 n/a n/a $0 $0 0.0 $0 0.0 $0 0.0 Nebraska $0.00 n/a n/a $0 $0 0.0 $0 0.0 $0 0.0 Nevada $0.00 n/a n/a $0 $0 0.0 $0 0.0 $0 0.0 New Hampshire $0.00 n/a n/a $0 $0 0.0 $0 0.0 $0 0.0 New Jersey $0.00 n/a n/a $0 $0 0.0 $0 0.0 $0 0.0 New Mexico $0.00 n/a n/a $0 $0 0.0 $0 0.0 $0 0.0 North Dakota $0.00 n/a n/a $0 $0 0.0 $0 0.0 $0 0.0 Pennsylvania $0.00 n/a n/a $0 $0 0.0 $0 0.0 $0 0.0 South Carolina $0.00 n/a n/a $0 $0 0.0 $0 0.0 $0 0.0 Tennessee $0.00 n/a n/a $0 $0 0.0 $0 0.0 $0 0.0 Texas $0.00 n/a n/a $0 $0 0.0 $0 0.0 $0 0.0 Utah $0.00 n/a n/a $0 $0 0.0 $0 0.0 $0 0.0 Vermont $0.00 n/a n/a $0 $0 0.0 $0 0.0 $0 0.0 Virginia $0.00 n/a n/a $0 $0 0.0 $0 0.0 $0 0.0 Wyoming $0.00 n/a n/a $0 $0 0.0 $0 0.0 $0 0.0 United States $2.15 n/a n/a $114,687,207 $394,362,828 243.9 $443,941,649 12.6 $684,396,949 54.2
Notes: Data do not include services provided through managed care organizations. Data are presented based on state reporting. No further explanation of trends is available for the purposes of this report.

Money Follows the Person Demonstration Table X
State
FY 2015 Expenditures Per Resident
Rank 2015
Rank 2014
FY 2012 Expenditures
FY 2013 Expenditures
Percent Change 12-13
FY 2014 Expenditures
Percent Change 13-14
FY 2015 Expenditures
Percent Change 14-15
Connecticut $8.57 1 1 $17,337,308 $22,065,044 27.3 $26,444,969 19.9 $30,797,985 16.5 Delaware $5.70 2 34 $575,474 $708,965 23.2 $692,282 -2.4 $5,329,151 669.8 Ohio $4.10 3 2 $24,821,426 $39,418,468 58.8 $47,288,946 20.0 $47,546,367 0.5 Vermont $3.73 4 9 $274,543 $1,368,596 398.5 $1,491,603 9.0 $2,337,696 56.7 Iowa $3.70 5 10 $5,351,026 $4,854,224 -9.3 $6,985,038 43.9 $11,514,693 64.8 Washington $3.61 6 6 $19,686,183 $16,944,224 -13.9 $20,754,335 22.5 $25,437,481 22.6 Dist. of Columbia $3.49 7 11 $2,180,914 $1,650,432 -24.3 $1,349,496 -18.2 $2,300,908 70.5 Oklahoma $3.10 8 3 $3,754,490 $4,146,208 10.4 $14,195,246 242.4 $12,014,686 -15.4 North Dakota $2.89 9 4 $2,587,413 $1,589,905 -38.6 $2,312,677 45.5 $2,138,437 -7.5 Arkansas $2.86 10 13 $7,053,144 $7,013,499 -0.6 $5,685,883 -18.9 $8,477,959 49.1 Maryland $2.72 11 7 $21,173,500 $17,215,598 -18.7 $16,837,343 -2.2 $16,234,466 -3.6 Indiana $2.41 12 33 $5,704,551 $7,241,631 26.9 $5,311,469 -26.7 $15,894,216 199.2 Kansas $2.31 13 5 $8,507,532 $12,044,561 41.6 $9,043,324 -24.9 $6,707,704 -25.8 New Jersey $2.08 14 8 $5,844,018 $10,774,294 84.4 $21,497,615 99.5 $18,567,343 -13.6 Rhode Island $1.96 15 24 $200,693 $772,375 284.9 $1,275,475 65.1 $2,068,912 62.2 Massachusetts $1.96 16 16 $4,223,065 $9,308,592 120.4 $11,687,096 25.6 $13,208,390 13.0 Louisiana $1.87 17 14 $9,434,690 $9,063,119 -3.9 $8,673,417 -4.3 $8,701,196 0.3 Pennsylvania $1.86 18 21 $7,257,858 $13,834,380 90.6 $17,596,096 27.2 $23,756,462 35.0 Wisconsin $1.80 19 15 $4,594,405 $7,120,518 55.0 $10,319,382 44.9 $10,362,344 0.4 Tennessee $1.77 20 22 $5,800,587 $5,211,755 -10.2 $8,898,954 70.7 $11,572,225 30.0 Mississippi $1.76 21 17 $230,406 $3,136,165 1261.1 $4,520,630 44.1 $5,262,511 16.4 Idaho $1.67 22 20 $607,373 $2,363,918 289.2 $2,299,792 -2.7 $2,727,937 18.6 West Virginia $1.47 23 36 $0 $416,111 100.0 $892,409 114.5 $2,708,839 203.5 Virginia $1.44 24 18 $8,284,278 $10,016,901 20.9 $11,876,705 18.6 $12,008,716 1.1 Missouri $1.30 25 29 $5,891,924 $11,285,633 91.5 $5,908,267 -47.6 $7,862,062 33.1 Texas $1.29 26 30 $27,723,683 $50,951,708 83.8 $23,917,810 -53.1 $34,647,204 44.9 Montana $1.27 27 41 $0 $0 0.0 $87,353 100.0 $1,295,655 1383.2 Michigan $1.23 28 12 $15,223,838 $15,749,029 3.4 $19,209,488 22.0 $12,197,416 -36.5 Hawaii $1.04 29 25 $1,269,058 $1,691,505 33.3 $1,611,525 -4.7 $1,474,870 -8.5 Maine $1.01 30 35 $0 $127,820 100.0 $785,194 514.3 $1,345,026 71.3 Minnesota $0.98 31 43 $0 $0 0.0 $424,288 100.0 $5,335,489 1157.5 New York $0.95 32 27 $24,168,180 $21,619,213 -10.5 $22,114,369 2.3 $18,827,851 -14.9 Georgia $0.84 33 19 $21,692,848 $19,077,663 -12.1 $14,306,107 -25.0 $8,453,405 -40.9 California $0.81 34 31 $15,359,005 $33,105,065 115.5 $31,963,174 -3.4 $31,289,533 -2.1 South Dakota $0.78 35 38 $0 $0 0.0 $229,518 100.0 $666,807 190.5 Kentucky $0.76 36 26 $7,447,171 $4,186,068 -43.8 $5,007,364 19.6 $3,364,447 -32.8 Nevada $0.76 37 37 $142 $288,473 203050.0 $1,309,330 353.9 $2,153,176 64.4 New Hampshire $0.71 38 23 $1,626,970 $1,477,505 -9.2 $1,766,600 19.6 $947,475 -46.4 Nebraska $0.55 39 28 $1,393,987 $2,299,193 64.9 $1,848,632 -19.6 $1,036,004 -44.0 Alabama $0.49 40 42 $0 $0 0.0 $388,098 100.0 $2,379,366 513.1 Colorado $0.37 41 39 $0 $43,496 100.0 $761,685 1651.2 $1,974,722 159.3 Illinois $0.35 42 32 $758,898 $3,177,321 318.7 $10,478,226 229.8 $4,455,089 -57.5 North Carolina $0.19 43 40 $1,778,091 $1,532,545 -13.8 $1,206,490 -21.3 $1,879,132 55.8 South Carolina $0.07 44 44 $0 $45,413 100.0 $257,793 467.7 $341,874 32.6 Oregon $0.00 n/a n/a -$91,744 $76,040 -182.9 $0 -100.0 $0 0.0 Alaska $0.00 n/a n/a $0 $0 0.0 $0 0.0 $0 0.0 Arizona $0.00 n/a n/a $0 $0 0.0 $0 0.0 $0 0.0 Florida $0.00 n/a n/a $0 $0 0.0 $0 0.0 $0 0.0 New Mexico $0.00 n/a n/a $0 $0 0.0 $0 0.0 $0 0.0 Utah $0.00 n/a n/a $0 $0 0.0 $0 0.0 $0 0.0 Wyoming $0.00 n/a n/a $0 $0 0.0 $0 0.0 $0 0.0 United States $1.38 n/a n/a $289,726,928 $375,013,173 29.4 $401,511,493 7.1 $439,603,227 9.5
Note: Data are presented based on state reporting. No further explanation of trends is available for the purposes of this report.

5
10
15
20
25 30
35
40
45
50
Total Long-Term Services and Supports Table Y
State
FY 2015 Expenditures Per Resident
Rank 2015
Rank 2014
FY 2012 Expenditures
FY 2013 Expenditures
Percent Change 12-13
FY 2014 Expenditures
Percent Change 13-14
FY 2015 Expenditures
Percent Change 14-15
Dist. of Columbia $1,189.85 1 1 $726,838,009 $801,640,157 10.3 $787,749,875 -1.7 $784,119,833 -0.5 New York $1,156.80 2 2 $23,935,113,886 $22,899,106,922 -4.3 $22,396,565,482 -2.2 $22,810,465,797 1.8 Massachusetts $1,009.97 3 8 $4,608,638,399 $4,519,053,091 -1.9 $4,842,404,248 7.2 $6,817,174,493 40.8 Connecticut $935.63 4 3 $3,031,392,246 $3,142,614,252 3.7 $3,204,812,792 2.0 $3,360,650,473 4.9 Rhode Island $829.94 4 $784,390,871 $830,717,546 5.9 $856,644,739 3.1 $875,152,673 2.2 Minnesota $829.64 6 7 $3,921,226,027 $3,909,808,275 -0.3 $4,159,358,042 6.4 $4,524,095,575 8.8 West Virginia $799.68 7 6 $1,340,674,742 $1,372,553,203 2.4 $1,428,750,055 4.1 $1,478,217,322 3.5 North Dakota $792.07 8 5 $488,546,532 $512,866,745 5.0 $573,401,580 11.8 $586,059,113 2.2 Alaska $775.98 9 13 $521,897,217 $534,871,169 2.5 $473,837,410 -11.4 $571,666,607 20.6 Maine $744.98 9 $860,508,694 $890,464,847 3.5 $945,832,624 6.2 $991,361,517 4.8 Pennsylvania $706.95 11 10 $7,704,639,607 $8,320,086,423 8.0 $8,687,253,497 4.4 $9,042,263,837 4.1 Iowa $685.89 12 12 $1,563,614,406 $1,938,976,515 24.0 $2,050,275,238 5.7 $2,131,781,195 4.0 Arkansas $671.00 13 11 $1,792,262,332 $1,860,222,671 3.8 $1,992,947,541 7.1 $1,990,790,390 -0.1 New Mexico $648.24 14 27 $355,742,996 $366,729,245 3.1 $950,307,424 159.1 $1,350,297,487 42.1 Vermont $641.07 14 $365,767,732 $372,183,236 1.8 $393,937,365 5.8 $401,940,108 2.0 Ohio $623.88 16 15 $6,272,961,984 $6,663,531,311 6.2 $7,110,139,407 6.7 $7,233,463,392 1.7 New Hampshire $611.86 17 16 $722,541,113 $734,584,583 1.7 $804,426,669 9.5 $813,007,979 1.1 Wisconsin $606.79 18 18 $2,949,807,605 $3,147,285,024 6.7 $3,231,787,165 2.7 $3,494,141,794 8.1 Delaware $597.06 19 19 $448,730,417 $491,950,628 9.6 $515,836,593 4.9 $558,217,005 8.2 Oregon $586.61 22 $1,648,033,113 $1,626,394,487 -1.3 $2,007,636,044 23.4 $2,327,885,458 16.0 Missouri $551.37 21 21 $2,734,594,899 $2,925,604,025 7.0 $3,124,251,829 6.8 $3,341,833,570 7.0 New Jersey $547.88 22 17 $4,029,739,770 $4,467,364,534 10.9 $5,042,665,692 12.9 $4,889,790,871 -3.0 Indiana $534.04 23 20 $2,660,859,217 $2,952,179,708 10.9 $3,453,502,581 17.0 $3,522,139,404 2.0 Mississippi $529.05 24 24 $1,509,881,299 $1,508,960,937 -0.1 $1,506,650,489 -0.2 $1,583,120,691 5.1 Maryland $517.94 23 $2,747,511,924 $2,770,074,693 0.8 $2,988,681,748 7.9 $3,090,726,356 3.4 Louisiana $490.78 26 25 $2,281,317,842 $2,405,398,942 5.4 $2,196,044,888 -8.7 $2,281,089,510 3.9 Wyoming $458.61 27 26 $262,356,010 $268,197,027 2.2 $266,763,417 -0.5 $267,662,418 0.3 Montana $458.17 28 28 $422,831,804 $428,733,079 1.4 $444,467,570 3.7 $468,648,397 5.4 Kentucky $441.35 29 30 $1,700,942,115 $1,702,479,927 0.1 $1,868,504,914 9.8 $1,947,696,211 4.2 Nebraska $435.93 29 $745,222,080 $813,227,916 9.1 $807,054,787 -0.8 $820,049,319 1.6 Kansas $420.52 31 34 $1,199,036,560 $1,083,989,164 -9.6 $1,087,897,793 0.4 $1,219,252,285 12.1 Washington $414.84 32 33 $2,452,906,099 $2,496,248,737 1.8 $2,689,100,559 7.7 $2,926,364,832 8.8 Tennessee $401.46 33 35 $2,331,058,282 $2,393,976,571 2.7 $2,432,750,766 1.6 $2,627,451,569 8.0 Idaho $397.22 34 38 $485,589,020 $574,392,362 18.3 $581,514,113 1.2 $648,868,391 11.6 Colorado $395.77 37 $1,586,338,257 $1,672,801,173 5.5 $1,909,061,039 14.1 $2,117,207,523 10.9 South Dakota $386.82 36 36 $304,647,180 $308,525,817 1.3 $312,478,416 1.3 $329,786,679 5.5 Illinois $379.50 37 32 $4,341,262,010 $5,064,005,334 16.6 $5,169,275,366 2.1 $4,883,229,333 -5.5 Alabama $364.54 38 40 $1,690,899,306 $1,680,556,854 -0.6 $1,711,454,444 1.8 $1,765,525,553 3.2 Virginia $363.06 39 41 $2,567,097,135 $2,719,925,949 6.0 $2,847,203,612 4.7 $3,019,693,703 6.1 Oklahoma $361.29 39 $1,230,521,446 $1,323,366,161 7.5 $1,366,721,307 3.3 $1,400,886,379 2.5 California $355.01 41 31 $13,671,604,017 $15,243,999,919 11.5 $15,587,104,747 2.3 $13,732,132,018 -11.9 Texas $354.34 42 43 $7,548,615,769 $8,161,109,826 8.1 $8,746,109,454 7.2 $9,547,670,734 9.2 Hawaii $351.40 43 42 $474,401,671 $478,819,024 0.9 $465,310,154 -2.8 $497,708,939 7.0 Michigan $325.72 44 46 $2,870,980,944 $2,917,151,904 1.6 $2,986,213,894 2.4 $3,229,811,595 8.2 South Carolina $316.51 47 $1,357,749,363 $1,325,560,016 -2.4 $1,418,046,899 7.0 $1,528,251,521 7.8 North Carolina $307.37 46 44 $4,217,197,868 $3,433,002,147 -18.6 $3,123,099,816 -9.0 $3,053,498,577 -2.2 Florida $296.65 47 45 $5,104,551,160 $5,139,919,769 0.7 $5,927,618,070 15.3 $5,899,898,939 -0.5 Georgia $253.94 48 49 $2,370,429,133 $2,645,153,522 11.6 $2,435,856,378 -7.9 $2,561,592,101 5.2 Arizona $249.60 49 48 $1,598,954,904 $1,573,329,322 -1.6 $1,638,175,569 4.1 $1,677,329,489 2.4 Nevada $217.39 50 $502,390,695 $509,765,778 1.5 $531,326,676 4.2 $615,865,832 15.9 Utah $191.55 51 51 $494,344,957 $484,932,049 -1.9 $523,693,773 8.0 $563,500,268 7.6 United States $496.61 n/a n/a $141,539,160,664 $146,408,392,516 3.4 $152,602,504,550 4.2 $158,201,035,055 3.7
Notes: Delaware 2012 and Michigan 2014 data were incomplete because the transition to managed care occurred during the year; state estimates were included the following year. Hawaii provided an estimate for managed care expenditures for calendar year 2012. This estimate was used for both FY 2012 and FY 2013. Data do not include expenditures for managed care programs in the following states (years of missing data in parentheses): California (2012, 2014, 2015); Massachusetts (2014); New Mexico (2010 - 2013); North Carolina (2013 - 2015). Data for several states include expenditures for Medicaid Upper Payment Limit programs or provider taxes. IMD services for people under age 21 or age 65 and older, case management, rehabilitative services, private duty nursing, state plan HCBS, and health homes data do not include services provided through managed care organizations. Data are presented based on state reporting. No further explanation of trends is available for the purposes of this report.
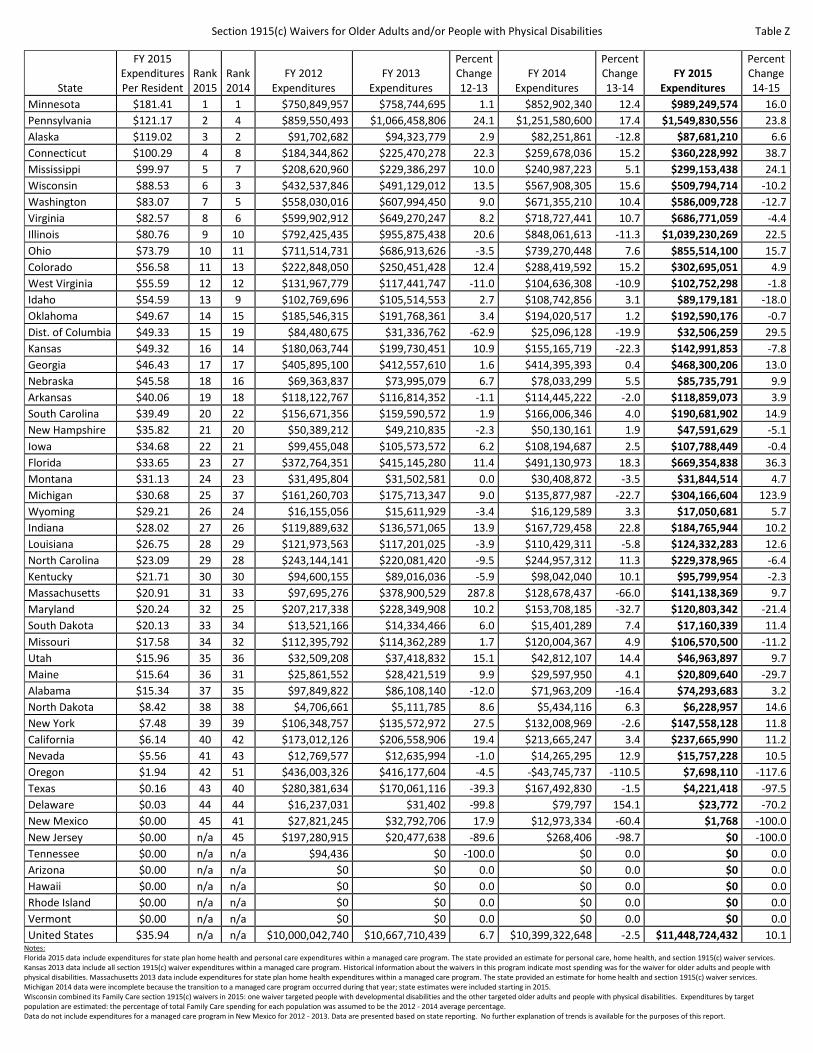
Section 1915(c) Waivers for Older Adults and/or People with Physical Disabilities
Percent
Table Z
State
FY 2015 Expenditures Per Resident
Rank 2015
Rank 2014
FY 2012 Expenditures
Percent FY 2013
Expenditures Change 12-13
FY 2014 Expenditures
Change 13-14
FY 2015 Expenditures
Percent Change 14-15
Minnesota $181.41 1 1 $750,849,957 $758,744,695 1.1 $852,902,340 12.4 $989,249,574 16.0 Pennsylvania $121.17 2 4 $859,550,493 $1,066,458,806 24.1 $1,251,580,600 17.4 $1,549,830,556 23.8 Alaska $119.02 3 2 $91,702,682 $94,323,779 2.9 $82,251,861 -12.8 $87,681,210 6.6 Connecticut $100.29 4 8 $184,344,862 $225,470,278 22.3 $259,678,036 15.2 $360,228,992 38.7 Mississippi $99.97 5 7 $208,620,960 $229,386,297 10.0 $240,987,223 5.1 $299,153,438 24.1 Wisconsin $88.53 6 3 $432,537,846 $491,129,012 13.5 $567,908,305 15.6 $509,794,714 -10.2 Washington $83.07 7 5 $558,030,016 $607,994,450 9.0 $671,355,210 10.4 $586,009,728 -12.7 Virginia $82.57 8 6 $599,902,912 $649,270,247 8.2 $718,727,441 10.7 $686,771,059 -4.4 Illinois $80.76 9 10 $792,425,435 $955,875,438 20.6 $848,061,613 -11.3 $1,039,230,269 22.5 Ohio $73.79 10 11 $711,514,731 $686,913,626 -3.5 $739,270,448 7.6 $855,514,100 15.7 Colorado $56.58 11 13 $222,848,050 $250,451,428 12.4 $288,419,592 15.2 $302,695,051 4.9 West Virginia $55.59 12 12 $131,967,779 $117,441,747 -11.0 $104,636,308 -10.9 $102,752,298 -1.8 Idaho $54.59 13 9 $102,769,696 $105,514,553 2.7 $108,742,856 3.1 $89,179,181 -18.0 Oklahoma $49.67 14 15 $185,546,315 $191,768,361 3.4 $194,020,517 1.2 $192,590,176 -0.7 Dist. of Columbia $49.33 15 19 $84,480,675 $31,336,762 -62.9 $25,096,128 -19.9 $32,506,259 29.5 Kansas $49.32 16 14 $180,063,744 $199,730,451 10.9 $155,165,719 -22.3 $142,991,853 -7.8 Georgia $46.43 17 17 $405,895,100 $412,557,610 1.6 $414,395,393 0.4 $468,300,206 13.0 Nebraska $45.58 18 16 $69,363,837 $73,995,079 6.7 $78,033,299 5.5 $85,735,791 9.9 Arkansas $40.06 19 18 $118,122,767 $116,814,352 -1.1 $114,445,222 -2.0 $118,859,073 3.9 South Carolina $39.49 20 22 $156,671,356 $159,590,572 1.9 $166,006,346 4.0 $190,681,902 14.9 New Hampshire $35.82 21 20 $50,389,212 $49,210,835 -2.3 $50,130,161 1.9 $47,591,629 -5.1 Iowa $34.68 22 21 $99,455,048 $105,573,572 6.2 $108,194,687 2.5 $107,788,449 -0.4 Florida $33.65 23 27 $372,764,351 $415,145,280 11.4 $491,130,973 18.3 $669,354,838 36.3 Montana $31.13 24 23 $31,495,804 $31,502,581 0.0 $30,408,872 -3.5 $31,844,514 4.7 Michigan $30.68 25 37 $161,260,703 $175,713,347 9.0 $135,877,987 -22.7 $304,166,604 123.9 Wyoming $29.21 26 24 $16,155,056 $15,611,929 -3.4 $16,129,589 3.3 $17,050,681 5.7 Indiana $28.02 27 26 $119,889,632 $136,571,065 13.9 $167,729,458 22.8 $184,765,944 10.2 Louisiana $26.75 28 29 $121,973,563 $117,201,025 -3.9 $110,429,311 -5.8 $124,332,283 12.6 North Carolina $23.09 29 28 $243,144,141 $220,081,420 -9.5 $244,957,312 11.3 $229,378,965 -6.4 Kentucky $21.71 30 30 $94,600,155 $89,016,036 -5.9 $98,042,040 10.1 $95,799,954 -2.3 Massachusetts $20.91 31 33 $97,695,276 $378,900,529 287.8 $128,678,437 -66.0 $141,138,369 9.7 Maryland $20.24 32 25 $207,217,338 $228,349,908 10.2 $153,708,185 -32.7 $120,803,342 -21.4 South Dakota $20.13 33 34 $13,521,166 $14,334,466 6.0 $15,401,289 7.4 $17,160,339 11.4 Missouri $17.58 34 32 $112,395,792 $114,362,289 1.7 $120,004,367 4.9 $106,570,500 -11.2 Utah $15.96 35 36 $32,509,208 $37,418,832 15.1 $42,812,107 14.4 $46,963,897 9.7 Maine $15.64 36 31 $25,861,552 $28,421,519 9.9 $29,597,950 4.1 $20,809,640 -29.7 Alabama $15.34 37 35 $97,849,822 $86,108,140 -12.0 $71,963,209 -16.4 $74,293,683 3.2 North Dakota $8.42 38 38 $4,706,661 $5,111,785 8.6 $5,434,116 6.3 $6,228,957 14.6 New York $7.48 39 39 $106,348,757 $135,572,972 27.5 $132,008,969 -2.6 $147,558,128 11.8 California $6.14 40 42 $173,012,126 $206,558,906 19.4 $213,665,247 3.4 $237,665,990 11.2 Nevada $5.56 41 43 $12,769,577 $12,635,994 -1.0 $14,265,295 12.9 $15,757,228 10.5 Oregon $1.94 42 51 $436,003,326 $416,177,604 -4.5 -$43,745,737 -110.5 $7,698,110 -117.6 Texas $0.16 43 40 $280,381,634 $170,061,116 -39.3 $167,492,830 -1.5 $4,221,418 -97.5 Delaware $0.03 44 44 $16,237,031 $31,402 -99.8 $79,797 154.1 $23,772 -70.2 New Mexico $0.00 45 41 $27,821,245 $32,792,706 17.9 $12,973,334 -60.4 $1,768 -100.0 New Jersey $0.00 n/a 45 $197,280,915 $20,477,638 -89.6 $268,406 -98.7 $0 -100.0 Tennessee $0.00 n/a n/a $94,436 $0 -100.0 $0 0.0 $0 0.0 Arizona $0.00 n/a n/a $0 $0 0.0 $0 0.0 $0 0.0 Hawaii $0.00 n/a n/a $0 $0 0.0 $0 0.0 $0 0.0 Rhode Island $0.00 n/a n/a $0 $0 0.0 $0 0.0 $0 0.0 Vermont $0.00 n/a n/a $0 $0 0.0 $0 0.0 $0 0.0 United States $35.94 n/a n/a $10,000,042,740 $10,667,710,439 6.7 $10,399,322,648 -2.5 $11,448,724,432 10.1
Notes: Florida 2015 data include expenditures for state plan home health and personal care expenditures within a managed care program. The state provided an estimate for personal care, home health, and section 1915(c) waiver services. Kansas 2013 data include all section 1915(c) waiver expenditures within a managed care program. Historical information about the waivers in this program indicate most spending was for the waiver for older adults and people with physical disabilities. Massachusetts 2013 data include expenditures for state plan home health expenditures within a managed care program. The state provided an estimate for home health and section 1915(c) waiver services. Michigan 2014 data were incomplete because the transition to a managed care program occurred during that year; state estimates were included starting in 2015. Wisconsin combined its Family Care section 1915(c) waivers in 2015: one waiver targeted people with developmental disabilities and the other targeted older adults and people with physical disabilities. Expenditures by target population are estimated: the percentage of total Family Care spending for each population was assumed to be the 2012 - 2014 average percentage. Data do not include expenditures for a managed care program in New Mexico for 2012 - 2013. Data are presented based on state reporting. No further explanation of trends is available for the purposes of this report.

Section 1915(c) Waivers for People with Developmental Disabilities Table AA
State
FY 2015 Expenditures Per Resident
Rank 2015
Rank 2014
FY 2012 Expenditures
FY 2013 Expenditures
Percent Change 12-13
FY 2014 Expenditures
Percent Change 13-14
FY 2015 Expenditures
Percent Change 14-15
Dist. of Columbia $289.26 1 1 $147,990,912 $150,832,742 1.9 $159,836,035 6.0 $190,623,444 19.3 New York $260.39 2 3 $5,528,422,271 $5,249,751,999 -5.0 $4,651,002,053 -11.4 $5,134,410,358 10.4 Maine $256.32 3 2 $314,745,746 $300,411,992 -4.6 $326,009,067 8.5 $341,086,831 4.6 North Dakota $247.45 4 4 $130,206,373 $142,124,660 9.2 $168,827,063 18.8 $183,089,110 8.4 Connecticut $247.07 5 5 $785,044,561 $824,078,961 5.0 $800,043,681 -2.9 $887,429,537 10.9 Alaska $233.90 6 8 $130,684,746 $145,575,600 11.4 $138,732,700 -4.7 $172,316,184 24.2 Minnesota $214.03 7 6 $1,011,259,906 $1,012,625,529 0.1 $1,073,057,567 6.0 $1,167,146,296 8.8 West Virginia $194.14 8 7 $314,608,139 $344,117,623 9.4 $360,653,048 4.8 $358,871,525 -0.5 Wisconsin $191.10 9 12 $799,525,662 $839,909,557 5.1 $893,411,596 6.4 $1,100,418,505 23.2 Pennsylvania $175.54 10 9 $1,900,072,492 $2,032,373,916 7.0 $2,165,344,528 6.5 $2,245,283,582 3.7 Massachusetts $171.77 11 16 $875,813,582 $715,841,922 -18.3 $883,274,710 23.4 $1,159,456,123 31.3 New Hampshire $166.53 12 10 $192,710,530 $190,540,468 -1.1 $218,395,825 14.6 $221,280,243 1.3 Iowa $157.06 13 13 $366,249,764 $405,268,679 10.7 $450,264,326 11.1 $488,151,475 8.4 New Mexico $153.43 14 14 $278,164,586 $284,776,332 2.4 $299,937,055 5.3 $319,596,089 6.6 Wyoming $152.77 15 11 $98,412,406 $97,063,957 -1.4 $93,737,647 -3.4 $89,162,571 -4.9 Maryland $141.93 16 15 $725,955,053 $764,038,854 5.2 $798,703,018 4.5 $846,912,850 6.0 Nebraska $139.66 17 17 $216,715,025 $234,178,219 8.1 $244,300,494 4.3 $262,720,243 7.5 Kentucky $137.00 18 19 $402,371,219 $459,959,093 14.3 $561,074,059 22.0 $604,607,397 7.8 South Dakota $134.33 19 18 $102,452,822 $106,449,406 3.9 $108,154,697 1.6 $114,528,183 5.9 Ohio $125.87 20 20 $1,240,872,299 $1,352,304,238 9.0 $1,393,701,149 3.1 $1,459,379,119 4.7 Delaware $123.48 21 21 $95,764,236 $98,589,240 2.9 $105,640,569 7.2 $115,452,015 9.3 Idaho $122.81 22 32 $64,471,416 $79,674,074 23.6 $120,866,741 51.7 $200,610,387 66.0 Missouri $118.48 23 22 $534,547,609 $596,110,675 11.5 $651,979,161 9.4 $718,069,181 10.1 New Jersey $108.03 24 27 $683,117,117 $708,497,828 3.7 $824,873,688 16.4 $964,162,506 16.9 Tennessee $103.09 25 23 $579,223,475 $633,764,196 9.4 $684,172,546 8.0 $674,680,044 -1.4 Montana $100.59 26 25 $87,667,546 $93,295,395 6.4 $99,600,755 6.8 $102,885,623 3.3 Kansas $100.09 27 24 $334,013,246 $342,562,454 2.6 $287,113,722 -16.2 $290,211,020 1.1 Louisiana $99.71 28 26 $435,527,021 $457,192,257 5.0 $452,329,973 -1.1 $463,447,844 2.5 Indiana $98.80 29 29 $493,194,553 $536,181,524 8.7 $593,843,004 10.8 $651,582,645 9.7 Washington $94.66 30 28 $555,438,691 $587,992,429 5.9 $639,578,405 8.8 $667,737,755 4.4 Virginia $83.33 31 33 $545,745,930 $573,768,026 5.1 $604,037,030 5.3 $693,065,315 14.7 Oklahoma $82.21 32 30 $279,095,654 $285,186,722 2.2 $296,824,531 4.1 $318,763,879 7.4 Hawaii $75.82 33 31 $102,542,437 $107,873,227 5.2 $106,137,406 -1.6 $107,393,586 1.2 Colorado $75.20 34 35 $337,800,712 $338,547,178 0.2 $362,221,051 7.0 $402,286,214 11.1 North Carolina $72.59 35 36 $585,801,363 $632,936,555 8.0 $671,027,306 6.0 $721,138,737 7.5 Arkansas $68.05 36 39 $171,241,881 $177,790,172 3.8 $187,220,568 5.3 $201,895,908 7.8 Alabama $66.93 37 37 $285,165,628 $304,528,668 6.8 $323,043,902 6.1 $324,170,318 0.3 South Carolina $66.63 38 38 $291,243,055 $296,638,016 1.9 $306,608,883 3.4 $321,698,712 4.9 Utah $66.53 39 40 $170,345,947 $167,951,055 -1.4 $177,774,989 5.8 $195,721,042 10.1 California $64.02 40 34 $2,128,887,905 $2,321,241,017 9.0 $2,733,411,406 17.8 $2,476,504,637 -9.4 Illinois $59.09 41 41 $585,671,554 $666,461,811 13.8 $713,397,252 7.0 $760,328,087 6.6 Georgia $51.01 42 42 $383,235,630 $435,653,875 13.7 $465,842,812 6.9 $514,585,534 10.5 Michigan $46.67 43 43 $448,407,211 $435,370,176 -2.9 $454,892,987 4.5 $462,773,999 1.7 Florida $45.01 44 45 $822,613,761 $782,607,113 -4.9 $811,796,568 3.7 $895,233,924 10.3 Texas $43.57 45 44 $1,047,524,169 $1,096,082,999 4.6 $1,139,022,413 3.9 $1,174,087,176 3.1 Nevada $32.19 46 46 $71,763,602 $67,351,403 -6.1 $81,029,536 20.3 $91,198,629 12.5 Mississippi $27.64 47 47 $43,976,251 $51,273,135 16.6 $68,403,899 33.4 $82,712,990 20.9 Oregon $15.61 48 48 $620,381,745 $561,058,306 -9.6 $64,445,600 -88.5 $61,951,558 -3.9 Arizona $0.00 n/a n/a $0 $0 0.0 $0 0.0 $0 0.0 Rhode Island $0.00 n/a n/a $0 $0 0.0 $0 0.0 $0 0.0 Vermont $0.00 n/a n/a $0 $0 0.0 $0 0.0 $0 0.0 United States $100.45 n/a n/a $28,346,687,439 $29,088,403,273 2.6 $29,815,597,021 2.5 $32,000,818,930 7.3
Notes: Wisconsin combined its Family Care section 1915(c) waivers in 2015: one waiver targeted people with developmental disabilities and the other targeted older adults and people with physical disabilities. Expenditures by target population are estimated: the percentage of total Family Care spending for each population was assumed to be the 2012 - 2014 average percentage. Data are presented based on state reporting. No further explanation of trends is available for the purposes of this report.

Section 1915(c) Waivers for Behavioral Health Services Table AB
State
FY 2015 Expenditures Per Resident
Rank 2015
Rank 2014
FY 2012 Expenditures
FY 2013 Expenditures
Percent Change 12-13
FY 2014 Expenditures
Percent Change 13-14
FY 2015 Expenditures
Percent Change 14-15
New York $6.91 1 1 $74,818,738 $78,942,201 5.5 $134,653,690 70.6 $136,206,467 1.2 Colorado $6.48 2 2 $26,208,834 $29,165,559 11.3 $32,164,647 10.3 $34,646,806 7.7 Wisconsin $3.84 3 5 $25,028,289 $17,684,244 -29.3 $16,204,269 -8.4 $22,094,086 36.3 Montana $3.53 4 3 $3,123,090 $3,049,401 -2.4 $3,306,160 8.4 $3,607,741 9.1 Connecticut $2.53 5 6 $2,045,125 $3,752,535 83.5 $6,495,143 73.1 $9,097,679 40.1 Iowa $2.39 6 4 $7,796,671 $9,260,595 18.8 $9,066,178 -2.1 $7,420,652 -18.2 Wyoming $1.01 7 7 $912,587 $631,863 -30.8 $582,941 -7.7 $591,258 1.4 Massachusetts $0.82 8 10 $0 $0 0.0 $609,793 100.0 $5,566,192 812.8 Michigan $0.56 9 8 $4,781,441 $5,356,524 12.0 $5,803,963 8.4 $5,504,075 -5.2 Texas $0.23 10 9 $148,858 $143,149 -3.8 $3,402,268 2276.7 $6,167,273 81.3 Kansas $0.02 11 11 -$28,618 $64,137 -324.1 $64,427 0.5 $58,774 -8.8 Alabama $0.00 n/a n/a $0 $0 0.0 $0 0.0 $0 0.0 Alaska $0.00 n/a n/a $0 $0 0.0 $0 0.0 $0 0.0 Arizona $0.00 n/a n/a $0 $0 0.0 $0 0.0 $0 0.0 Arkansas $0.00 n/a n/a $0 $0 0.0 $0 0.0 $0 0.0 California $0.00 n/a n/a $0 $0 0.0 $0 0.0 $0 0.0 Delaware $0.00 n/a n/a $0 $0 0.0 $0 0.0 $0 0.0 Dist. of Columbia $0.00 n/a n/a $0 $0 0.0 $0 0.0 $0 0.0 Florida $0.00 n/a n/a $0 $0 0.0 $0 0.0 $0 0.0 Georgia $0.00 n/a n/a $0 $0 0.0 $0 0.0 $0 0.0 Hawaii $0.00 n/a n/a $0 $0 0.0 $0 0.0 $0 0.0 Idaho $0.00 n/a n/a $0 $0 0.0 $0 0.0 $0 0.0 Illinois $0.00 n/a n/a $0 $0 0.0 $0 0.0 $0 0.0 Indiana $0.00 n/a n/a $0 $0 0.0 $0 0.0 $0 0.0 Kentucky $0.00 n/a n/a $0 $0 0.0 $0 0.0 $0 0.0 Louisiana $0.00 n/a n/a $0 $0 0.0 $0 0.0 $0 0.0 Maine $0.00 n/a n/a $0 $0 0.0 $0 0.0 $0 0.0 Maryland $0.00 n/a n/a $0 $0 0.0 $0 0.0 $0 0.0 Minnesota $0.00 n/a n/a $0 $0 0.0 $0 0.0 $0 0.0 Mississippi $0.00 n/a n/a $0 $0 0.0 $0 0.0 $0 0.0 Missouri $0.00 n/a n/a $0 $0 0.0 $0 0.0 $0 0.0 Nebraska $0.00 n/a n/a $0 $0 0.0 $0 0.0 $0 0.0 Nevada $0.00 n/a n/a $0 $0 0.0 $0 0.0 $0 0.0 New Hampshire $0.00 n/a n/a $0 $0 0.0 $0 0.0 $0 0.0 New Jersey $0.00 n/a n/a $0 $0 0.0 $0 0.0 $0 0.0 New Mexico $0.00 n/a n/a $0 $0 0.0 $0 0.0 $0 0.0 North Carolina $0.00 n/a n/a $0 $0 0.0 $0 0.0 $0 0.0 North Dakota $0.00 n/a n/a $0 $0 0.0 $0 0.0 $0 0.0 Ohio $0.00 n/a n/a $0 $0 0.0 $0 0.0 $0 0.0 Oklahoma $0.00 n/a n/a $0 $0 0.0 $0 0.0 $0 0.0 Oregon $0.00 n/a n/a $0 $0 0.0 $0 0.0 $0 0.0 Pennsylvania $0.00 n/a n/a $0 $0 0.0 $0 0.0 $0 0.0 Rhode Island $0.00 n/a n/a $0 $0 0.0 $0 0.0 $0 0.0 South Carolina $0.00 n/a n/a $0 $0 0.0 $0 0.0 $0 0.0 South Dakota $0.00 n/a n/a $0 $0 0.0 $0 0.0 $0 0.0 Tennessee $0.00 n/a n/a $0 $0 0.0 $0 0.0 $0 0.0 Utah $0.00 n/a n/a $0 $0 0.0 $0 0.0 $0 0.0 Vermont $0.00 n/a n/a $0 $0 0.0 $0 0.0 $0 0.0 Virginia $0.00 n/a n/a $0 $0 0.0 $0 0.0 $0 0.0 Washington $0.00 n/a n/a $0 $0 0.0 $0 0.0 $0 0.0 West Virginia $0.00 n/a n/a $0 $0 0.0 $0 0.0 $0 0.0 United States $0.73 n/a n/a $144,835,015 $148,050,208 2.2 $212,353,479 43.4 $230,961,003 8.8
Notes: Kansas 2013 through 2015 data do not include section 1915(c) waiver expenditures within a managed care program. Data are presented based on state reporting. No further explanation of trends is available for the purposes of this report.

Section 1915(c) Waivers for Other Populations Table AC
State
FY 2015 Expenditures Per Resident
Rank 2015
Rank 2014
FY 2012 Expenditures
FY 2013 Expenditures
Percent Change 12-13
FY 2014 Expenditures
Percent Change 13-14
FY 2015 Expenditures
Percent Change 14-15
Kansas $34.18 1 1 $39,692,590 $14,248,612 -64.1 $76,070,640 433.9 $99,091,874 30.3 Alaska $18.03 2 4 $12,197,359 $11,112,754 -8.9 $9,742,556 -12.3 $13,283,841 36.3 Minnesota $17.98 3 2 $94,473,339 $92,935,333 -1.6 $95,487,367 2.7 $98,072,923 2.7 New Hampshire $16.09 4 3 $17,481,231 $18,178,347 4.0 $22,254,385 22.4 $21,382,069 -3.9 Connecticut $13.85 5 5 $40,632,384 $40,081,921 -1.4 $44,628,392 11.3 $49,763,827 11.5 Wyoming $11.29 6 6 $7,070,920 $7,731,467 9.3 $7,196,300 -6.9 $6,591,801 -8.4 Iowa $10.68 7 7 $26,119,136 $30,454,047 16.6 $32,015,361 5.1 $33,179,403 3.6 North Carolina $9.85 8 9 $57,306,169 $71,320,104 24.5 $86,894,464 21.8 $97,898,214 12.7 Kentucky $9.31 9 8 $33,611,128 $35,148,815 4.6 $39,806,738 13.3 $41,096,517 3.2 New York $8.53 10 10 $127,277,872 $148,780,365 16.9 $159,686,274 7.3 $168,101,563 5.3 Illinois $5.01 11 11 $105,994,585 $91,162,971 -14.0 $81,022,521 -11.1 $64,477,722 -20.4 Pennsylvania $4.64 12 12 $47,882,715 $49,594,917 3.6 $51,684,575 4.2 $59,341,832 14.8 Texas $3.27 13 13 $84,972,867 $96,210,080 13.2 $94,538,429 -1.7 $88,077,481 -6.8 Colorado $3.16 14 15 $12,958,084 $13,752,953 6.1 $14,774,195 7.4 $16,908,130 14.4 Maine $2.93 15 n/a $0 $0 0.0 $0 0.0 $3,903,118 100.0 Utah $2.55 16 16 $6,640,313 $7,046,377 6.1 $7,238,584 2.7 $7,515,735 3.8 Massachusetts $2.03 17 14 $12,529,669 $13,743,140 9.7 $19,035,313 38.5 $13,685,633 -28.1 Maryland $1.60 18 18 $8,828,269 $7,083,010 -19.8 $7,950,480 12.2 $9,557,573 20.2 South Carolina $1.36 19 19 $5,314,992 $5,242,338 -1.4 $4,887,731 -6.8 $6,575,489 34.5 Oklahoma $1.31 20 20 $1,608,885 $2,733,110 69.9 $3,743,859 37.0 $5,093,665 36.1 Florida $1.18 21 17 $10,744,279 $12,172,590 13.3 $38,937,741 219.9 $23,520,818 -39.6 New Mexico $0.79 22 21 $2,029,376 $1,940,954 -4.4 $1,667,020 -14.1 $1,644,492 -1.4 Indiana $0.76 23 22 $4,529,271 $5,165,730 14.1 $5,212,944 0.9 $5,043,340 -3.3 West Virginia $0.55 24 27 $0 $268,350 100.0 $695,972 159.4 $1,020,400 46.6 Oregon $0.52 25 24 $1,261,526 $1,614,811 28.0 $2,169,915 34.4 $2,067,140 -4.7 Nebraska $0.36 26 28 $651,529 $688,624 5.7 $661,095 -4.0 $680,648 3.0 Missouri $0.33 27 29 $1,541,314 $1,889,917 22.6 $1,724,390 -8.8 $2,023,233 17.3 California $0.28 28 25 $12,553,941 $12,307,988 -2.0 $19,958,631 62.2 $10,730,364 -46.2 Georgia $0.24 29 26 $15,405,186 $11,981,188 -22.2 $4,975,222 -58.5 $2,400,385 -51.8 North Dakota $0.15 30 30 $40,848 $29,029 -28.9 $91,347 214.7 $107,776 18.0 Alabama $0.10 31 31 $867,326 $601,557 -30.6 $512,804 -14.8 $462,208 -9.9 Wisconsin $0.09 32 23 $5,549,290 $5,938,529 7.0 $4,553,344 -23.3 $531,890 -88.3 New Jersey $0.00 33 32 $29,124,950 $4,888,450 -83.2 $56,827 -98.8 $8,597 -84.9 Arkansas $0.00 n/a n/a $0 $0 0.0 $0 0.0 $0 0.0 Delaware $0.00 n/a n/a $1,412,664 $28,560 -98.0 $0 -100.0 $0 0.0 Dist. of Columbia $0.00 n/a n/a $0 $0 0.0 $0 0.0 $0 0.0 Hawaii $0.00 n/a n/a $0 $0 0.0 $0 0.0 $0 0.0 Idaho $0.00 n/a n/a $0 $0 0.0 $0 0.0 $0 0.0 Louisiana $0.00 n/a n/a $0 $0 0.0 $0 0.0 $0 0.0 Michigan $0.00 n/a n/a $0 $0 0.0 $0 0.0 $0 0.0 Mississippi $0.00 n/a n/a $0 $0 0.0 $0 0.0 $0 0.0 Montana $0.00 n/a n/a $0 $0 0.0 $0 0.0 $0 0.0 Nevada $0.00 n/a n/a $0 $0 0.0 $0 0.0 $0 0.0 Ohio $0.00 n/a n/a $0 $0 0.0 $0 0.0 $0 0.0 South Dakota $0.00 n/a n/a $0 $0 0.0 $0 0.0 $0 0.0 Tennessee $0.00 n/a n/a $0 $0 0.0 $0 0.0 $0 0.0 Virginia $0.00 n/a n/a $264,066 $0 -100.0 $0 0.0 $0 0.0 Washington $0.00 n/a n/a $0 $0 0.0 $0 0.0 $0 0.0 Arizona $0.00 n/a n/a $0 $0 0.0 $0 0.0 $0 0.0 Rhode Island $0.00 n/a n/a $0 $0 0.0 $0 0.0 $0 0.0 Vermont $0.00 n/a n/a $0 $0 0.0 $0 0.0 $0 0.0 United States $2.99 n/a n/a $828,568,073 $816,076,938 -1.5 $939,875,416 15.2 $953,839,701 1.5
Notes: Kansas 2013 data do not include section 1915(c) waiver expenditures within a managed care program. Kansas 2014 and 2015 section 1915(c) data for other populations includes section 1915(c) waiver expenditures for behavioral health services within a managed care program. Data are presented based on state reporting. No further explanation of trends is available for the purposes of this report.

HCBS – Unspecified for Older Adults and/or People with Physical Disabilities Table AD
State
FY 2015 Expenditures Per Resident
Rank 2015
Rank 2014
FY 2012 Expenditures
FY 2013 Expenditures
Percent Change 12-13
FY 2014 Expenditures
Percent Change 13-14
FY 2015 Expenditures
Percent Change 14-15
New Mexico $342.63 1 8 $0 $0 0.0 $46,853,589 100.0 $713,711,476 1423.3 Vermont $103.59 2 1 $52,583,882 $56,119,524 6.7 $60,518,396 7.8 $64,950,916 7.3 Rhode Island $101.00 3 2 $73,000,000 $90,000,000 23.3 $96,000,000 6.7 $106,500,000 10.9 Massachusetts $86.55 4 6 $80,275,904 $0 -100.0 $261,016,062 100.0 $584,222,927 123.8 Hawaii $61.90 5 3 $67,442,912 $67,442,912 0.0 $81,234,954 20.4 $87,678,482 7.9 Delaware $56.79 6 5 $24,993,169 $34,640,762 38.6 $39,240,140 13.3 $53,097,934 35.3 Arizona $51.22 7 4 $350,197,720 $345,703,433 -1.3 $356,807,032 3.2 $344,166,060 -3.5 Tennessee $36.66 8 7 $200,907,127 $228,595,035 13.8 $235,855,408 3.2 $239,950,683 1.7 New Jersey $35.76 9 9 $0 $198,602,042 100.0 $196,751,674 -0.9 $319,161,188 62.2 Texas $22.90 10 10 $82,944,882 $410,484,324 394.9 $490,436,357 19.5 $616,947,000 25.8 Michigan $10.28 11 n/a $0 $0 0.0 $0 0.0 $101,957,983 100.0 New York $3.64 12 11 $0 $49,812,991 100.0 $64,465,573 29.4 $71,685,542 11.2 Virginia $0.13 13 12 $0 $0 0.0 $1,920,754 100.0 $1,076,547 -44.0 Alabama $0.00 n/a n/a $0 $0 0.0 $0 0.0 $0 0.0 Alaska $0.00 n/a n/a $0 $0 0.0 $0 0.0 $0 0.0 Arkansas $0.00 n/a n/a $0 $0 0.0 $0 0.0 $0 0.0 California $0.00 n/a n/a $0 $14,939,958 100.0 $0 -100.0 $0 0.0 Colorado $0.00 n/a n/a $0 $0 0.0 $0 0.0 $0 0.0 Connecticut $0.00 n/a n/a $0 $0 0.0 $0 0.0 $0 0.0 Dist. of Columbia $0.00 n/a n/a $0 $0 0.0 $0 0.0 $0 0.0 Florida $0.00 n/a n/a $0 $0 0.0 $0 0.0 $0 0.0 Georgia $0.00 n/a n/a $0 $0 0.0 $0 0.0 $0 0.0 Idaho $0.00 n/a n/a $0 $0 0.0 $0 0.0 $0 0.0 Illinois $0.00 n/a n/a $0 $0 0.0 $0 0.0 $0 0.0 Indiana $0.00 n/a n/a $0 $0 0.0 $0 0.0 $0 0.0 Iowa $0.00 n/a n/a $0 $0 0.0 $0 0.0 $0 0.0 Kansas $0.00 n/a n/a $0 $0 0.0 $0 0.0 $0 0.0 Kentucky $0.00 n/a n/a $0 $0 0.0 $0 0.0 $0 0.0 Louisiana $0.00 n/a n/a $0 $0 0.0 $0 0.0 $0 0.0 Maine $0.00 n/a n/a $0 $0 0.0 $0 0.0 $0 0.0 Maryland $0.00 n/a n/a $0 $0 0.0 $0 0.0 $0 0.0 Minnesota $0.00 n/a n/a $0 $0 0.0 $0 0.0 $0 0.0 Mississippi $0.00 n/a n/a $0 $0 0.0 $0 0.0 $0 0.0 Missouri $0.00 n/a n/a $0 $0 0.0 $0 0.0 $0 0.0 Montana $0.00 n/a n/a $0 $0 0.0 $0 0.0 $0 0.0 Nebraska $0.00 n/a n/a $0 $0 0.0 $0 0.0 $0 0.0 Nevada $0.00 n/a n/a $0 $0 0.0 $0 0.0 $0 0.0 New Hampshire $0.00 n/a n/a $0 $0 0.0 $0 0.0 $0 0.0 North Carolina $0.00 n/a n/a $0 $0 0.0 $0 0.0 $0 0.0 North Dakota $0.00 n/a n/a $0 $0 0.0 $0 0.0 $0 0.0 Ohio $0.00 n/a n/a $0 $0 0.0 $0 0.0 $0 0.0 Oklahoma $0.00 n/a n/a $0 $0 0.0 $0 0.0 $0 0.0 Oregon $0.00 n/a n/a $0 $0 0.0 $0 0.0 $0 0.0 Pennsylvania $0.00 n/a n/a $0 $0 0.0 $0 0.0 $0 0.0 South Carolina $0.00 n/a n/a $0 $0 0.0 $0 0.0 $0 0.0 South Dakota $0.00 n/a n/a $0 $0 0.0 $0 0.0 $0 0.0 Utah $0.00 n/a n/a $0 $0 0.0 $0 0.0 $0 0.0 Washington $0.00 n/a 13 $63,397 $0 -100.0 $199,662 100.0 $0 -100.0 West Virginia $0.00 n/a n/a $0 $0 0.0 $0 0.0 $0 0.0 Wisconsin $0.00 n/a n/a $0 $0 0.0 $0 0.0 $0 0.0 Wyoming $0.00 n/a n/a $0 $0 0.0 $0 0.0 $0 0.0 United States $10.38 n/a n/a $932,408,993 $1,496,340,981 60.5 $1,931,299,601 29.1 $3,305,106,738 71.1
Notes: HCBS - unspecified refers to home and community-based services provided through managed care organizations and fee-for-service HCBS provided in 1115 demonstrations that were not authorized under another state plan or waiver authority. Data do not include expenditures for a managed care program in California (2012, 2014, 2015). Arizona 2012 - 2014 data, California 2013 data, and New Mexico 2015 data include expenditures for state plan personal care and home health expenditures within managed care programs. States provided estimates for all non-institutional HCBS, which is used in this table. Hawaii provided an estimate for calendar year 2012. This estimate was used for both FY 2012 and FY 2013. Rhode Island provided data for state fiscal years. Data are presented based on state reporting. No further explanation of trends is available for the purposes of this report.

HCBS – Unspecified for People with Developmental Disabilities Table AE
State
FY 2015 Expenditures Per Resident
Rank 2015
Rank 2014
FY 2012 Expenditures
FY 2013 Expenditures
Percent Change 12-13
FY 2014 Expenditures
Percent Change 13-14
FY 2015 Expenditures
Percent Change 14-15
Vermont $263.81 1 1 $143,683,111 $152,550,654 6.2 $160,081,847 4.9 $165,404,352 3.3 Rhode Island $215.75 2 2 $204,000,000 $209,000,000 2.5 $218,000,000 4.3 $227,500,000 4.4 Arizona $117.81 3 3 $682,140,186 $717,014,497 5.1 $783,495,309 9.3 $791,690,020 1.0 Pennsylvania $0.43 4 4 $3,506,624 $4,766,268 35.9 $5,578,116 17.0 $5,562,201 -0.3 Alabama $0.00 n/a n/a $0 $0 0.0 $0 0.0 $0 0.0 Alaska $0.00 n/a n/a $0 $0 0.0 $0 0.0 $0 0.0 Arkansas $0.00 n/a n/a $0 $0 0.0 $0 0.0 $0 0.0 California $0.00 n/a n/a $0 $0 0.0 $0 0.0 $0 0.0 Colorado $0.00 n/a n/a $0 $0 0.0 $0 0.0 $0 0.0 Connecticut $0.00 n/a n/a $0 $0 0.0 $0 0.0 $0 0.0 Delaware $0.00 n/a n/a $0 $0 0.0 $0 0.0 $0 0.0 Dist. of Columbia $0.00 n/a n/a $0 $0 0.0 $0 0.0 $0 0.0 Florida $0.00 n/a n/a $0 $0 0.0 $0 0.0 $0 0.0 Georgia $0.00 n/a n/a $0 $0 0.0 $0 0.0 $0 0.0 Hawaii $0.00 n/a n/a $0 $0 0.0 $0 0.0 $0 0.0 Idaho $0.00 n/a n/a $0 $0 0.0 $0 0.0 $0 0.0 Illinois $0.00 n/a n/a $0 $0 0.0 $0 0.0 $0 0.0 Indiana $0.00 n/a n/a $0 $0 0.0 $0 0.0 $0 0.0 Iowa $0.00 n/a n/a $0 $0 0.0 $0 0.0 $0 0.0 Kansas $0.00 n/a n/a $0 $0 0.0 $0 0.0 $0 0.0 Kentucky $0.00 n/a n/a $0 $0 0.0 $0 0.0 $0 0.0 Louisiana $0.00 n/a n/a $0 $0 0.0 $0 0.0 $0 0.0 Maine $0.00 n/a n/a $0 $0 0.0 $0 0.0 $0 0.0 Maryland $0.00 n/a n/a $0 $0 0.0 $0 0.0 $0 0.0 Massachusetts $0.00 n/a n/a $0 $0 0.0 $0 0.0 $0 0.0 Michigan $0.00 n/a n/a $0 $0 0.0 $0 0.0 $0 0.0 Minnesota $0.00 n/a n/a $0 $0 0.0 $0 0.0 $0 0.0 Mississippi $0.00 n/a n/a $0 $0 0.0 $0 0.0 $0 0.0 Missouri $0.00 n/a n/a $0 $0 0.0 $0 0.0 $0 0.0 Montana $0.00 n/a n/a $0 $0 0.0 $0 0.0 $0 0.0 Nebraska $0.00 n/a n/a $0 $0 0.0 $0 0.0 $0 0.0 Nevada $0.00 n/a n/a $0 $0 0.0 $0 0.0 $0 0.0 New Hampshire $0.00 n/a n/a $0 $0 0.0 $0 0.0 $0 0.0 New Jersey $0.00 n/a n/a $0 $0 0.0 $0 0.0 $0 0.0 New Mexico $0.00 n/a n/a $0 $0 0.0 $0 0.0 $0 0.0 New York $0.00 n/a n/a $0 $0 0.0 $0 0.0 $0 0.0 North Carolina $0.00 n/a n/a $0 $0 0.0 $0 0.0 $0 0.0 North Dakota $0.00 n/a n/a $0 $0 0.0 $0 0.0 $0 0.0 Ohio $0.00 n/a n/a $0 $0 0.0 $0 0.0 $0 0.0 Oklahoma $0.00 n/a n/a $0 $0 0.0 $0 0.0 $0 0.0 Oregon $0.00 n/a n/a $0 $0 0.0 $0 0.0 $0 0.0 South Carolina $0.00 n/a n/a $0 $0 0.0 $0 0.0 $0 0.0 South Dakota $0.00 n/a n/a $0 $0 0.0 $0 0.0 $0 0.0 Tennessee $0.00 n/a n/a $0 $0 0.0 $0 0.0 $0 0.0 Texas $0.00 n/a n/a $0 $0 0.0 $0 0.0 $0 0.0 Utah $0.00 n/a n/a $0 $0 0.0 $0 0.0 $0 0.0 Virginia $0.00 n/a n/a $0 $0 0.0 $0 0.0 $0 0.0 Washington $0.00 n/a n/a $0 $0 0.0 $0 0.0 $0 0.0 West Virginia $0.00 n/a n/a $0 $0 0.0 $0 0.0 $0 0.0 Wisconsin $0.00 n/a n/a $0 $0 0.0 $0 0.0 $0 0.0 Wyoming $0.00 n/a n/a $0 $0 0.0 $0 0.0 $0 0.0 United States $3.74 n/a n/a $1,033,329,921 $1,083,331,419 4.8 $1,167,155,272 7.7 $1,190,156,573 2.0
Notes: HCBS - unspecified refers to home and community-based services provided through managed care organizations and fee-for-service HCBS provided in 1115 demonstrations that were not authorized under another state plan or waiver authority. Rhode Island provided data are for state fiscal years. Data are presented based on state reporting. No further explanation of trends is available for the purposes of this report.

HCBS – Unspecified for Other Populations Table AF
State
FY 2015 Expenditures Per Resident
Rank 2015
Rank 2014
FY 2012 Expenditures
FY 2013 Expenditures
Percent Change 12-13
FY 2014 Expenditures
Percent Change 13-14
FY 2015 Expenditures
Percent Change 14-15
New Jersey $77.39 1 1 $0 $357,272,414 100.0 $799,177,071 123.7 $690,677,518 -13.6 Iowa $57.84 2 3 $0 $106,981,343 100.0 $174,954,746 63.5 $179,782,628 2.8 Massachusetts $47.52 3 n/a $0 $0 0.0 $0 0.0 $320,788,504 100.0 New Hampshire $44.42 4 4 $0 $0 0.0 $40,371,724 100.0 $59,022,410 46.2 Texas $19.46 5 6 $0 $170,548,294 100.0 $433,251,009 154.0 $524,421,780 21.0 Vermont $12.14 6 8 $7,782,256 $7,730,217 -0.7 $8,181,129 5.8 $7,613,564 -6.9 Illinois $6.79 7 7 $0 $26,750,175 100.0 $194,155,822 625.8 $87,341,740 -55.0 Louisiana $3.53 8 11 $0 $70,635,791 100.0 $5,842,884 -91.7 $16,413,994 180.9 California $2.85 9 9 $133,617 $238,988,888 178761.1 $268,798,488 12.5 $110,175,419 -59.0 Indiana $0.29 10 10 $0 $4,417,951 100.0 $9,787,712 121.5 $1,897,080 -80.6 Alabama $0.00 n/a n/a $0 $0 0.0 $0 0.0 $0 0.0 Alaska $0.00 n/a n/a $0 $0 0.0 $0 0.0 $0 0.0 Arizona $0.00 n/a n/a $0 $0 0.0 $0 0.0 $0 0.0 Arkansas $0.00 n/a n/a $0 $0 0.0 $0 0.0 $0 0.0 Colorado $0.00 n/a n/a $0 $0 0.0 $0 0.0 $0 0.0 Connecticut $0.00 n/a n/a $0 $0 0.0 $0 0.0 $0 0.0 Delaware $0.00 n/a n/a $0 $0 0.0 $0 0.0 $0 0.0 Dist. of Columbia $0.00 n/a n/a $0 $0 0.0 $0 0.0 $0 0.0 Florida $0.00 n/a n/a $0 $0 0.0 $0 0.0 $0 0.0 Georgia $0.00 n/a n/a $0 $0 0.0 $0 0.0 $0 0.0 Hawaii $0.00 n/a n/a $0 $0 0.0 $0 0.0 $0 0.0 Idaho $0.00 n/a n/a $0 $0 0.0 $0 0.0 $0 0.0 Kansas $0.00 n/a n/a $0 $0 0.0 $0 0.0 $0 0.0 Kentucky $0.00 n/a n/a $0 $0 0.0 $0 0.0 $0 0.0 Maine $0.00 n/a n/a $0 $0 0.0 $0 0.0 $0 0.0 Maryland $0.00 n/a n/a $0 $0 0.0 $0 0.0 $0 0.0 Michigan $0.00 n/a n/a $0 $0 0.0 $0 0.0 $0 0.0 Minnesota $0.00 n/a n/a $0 $0 0.0 $0 0.0 $0 0.0 Mississippi $0.00 n/a n/a $0 $0 0.0 $0 0.0 $0 0.0 Missouri $0.00 n/a n/a $0 $0 0.0 $0 0.0 $0 0.0 Montana $0.00 n/a n/a $0 $0 0.0 $0 0.0 $0 0.0 Nebraska $0.00 n/a n/a $0 $0 0.0 $0 0.0 $0 0.0 Nevada $0.00 n/a n/a $0 $0 0.0 $0 0.0 $0 0.0 New Mexico $0.00 n/a n/a $0 $0 0.0 $0 0.0 $0 0.0 New York $0.00 n/a 2 $0 $0 0.0 $1,185,192,594 100.0 $0 -100.0 North Carolina $0.00 n/a n/a $0 $0 0.0 $0 0.0 $0 0.0 North Dakota $0.00 n/a n/a $0 $0 0.0 $0 0.0 $0 0.0 Ohio $0.00 n/a 5 $0 $26,543,658 100.0 $309,637,903 1066.5 $0 -100.0 Oklahoma $0.00 n/a n/a $0 $0 0.0 $0 0.0 $0 0.0 Oregon $0.00 n/a n/a $0 $0 0.0 $0 0.0 $0 0.0 Pennsylvania $0.00 n/a n/a $0 $0 0.0 $0 0.0 $0 0.0 Rhode Island $0.00 n/a 51 $0 $0 0.0 -$2,000,000 100.0 $0 -100.0 South Carolina $0.00 n/a n/a $0 $0 0.0 $0 0.0 $0 0.0 South Dakota $0.00 n/a n/a $0 $0 0.0 $0 0.0 $0 0.0 Tennessee $0.00 n/a n/a $0 $0 0.0 $0 0.0 $0 0.0 Utah $0.00 n/a n/a $0 $0 0.0 $0 0.0 $0 0.0 Virginia $0.00 n/a n/a $0 $0 0.0 $0 0.0 $0 0.0 Washington $0.00 n/a n/a $0 $0 0.0 $0 0.0 $0 0.0 West Virginia $0.00 n/a n/a $0 $0 0.0 $0 0.0 $0 0.0 Wisconsin $0.00 n/a n/a $0 $0 0.0 $0 0.0 $0 0.0 Wyoming $0.00 n/a n/a $0 $0 0.0 $0 0.0 $0 0.0 United States $6.27 n/a n/a $7,915,873 $1,009,868,731 12657.5 $3,427,351,083 239.4 $1,998,134,637 -41.7
Notes: HCBS - unspecified refers to home and community-based services provided through managed care organizations and fee-for-service HCBS provided in 1115 demonstrations that were not authorized under another state plan or waiver authority. Rhode Island provided data for state fiscal years. Data are presented based on state reporting. No further explanation of trends is available for the purposes of this report.

State Plan HCBS (Section 1915(i)) for Older Adults and People with Physical Disabilities Table AG
State
FY 2015 Expenditures Per Resident
Rank 2015
Rank 2014
FY 2012 Expenditures
FY 2013 Expenditures
Percent Change 12-13
FY 2014 Expenditures
Percent Change 13-14
FY 2015 Expenditures
Percent Change 14-15
Colorado $0.56 1 1 $2,845,288 $2,369,363 -16.7 $2,168,623 -8.5 $3,012,084 38.9 Alabama $0.00 n/a n/a $0 $0 0.0 $0 0.0 $0 0.0 Alaska $0.00 n/a n/a $0 $0 0.0 $0 0.0 $0 0.0 Arizona $0.00 n/a n/a $0 $0 0.0 $0 0.0 $0 0.0 Arkansas $0.00 n/a n/a $0 $0 0.0 $0 0.0 $0 0.0 California $0.00 n/a n/a $0 $0 0.0 $0 0.0 $0 0.0 Connecticut $0.00 n/a n/a $0 $0 0.0 $0 0.0 $0 0.0 Delaware $0.00 n/a n/a $0 $0 0.0 $0 0.0 $0 0.0 Dist. of Columbia $0.00 n/a n/a $0 $0 0.0 $0 0.0 $0 0.0 Florida $0.00 n/a n/a $0 $0 0.0 $0 0.0 $0 0.0 Georgia $0.00 n/a n/a $0 $0 0.0 $0 0.0 $0 0.0 Hawaii $0.00 n/a n/a $0 $0 0.0 $0 0.0 $0 0.0 Idaho $0.00 n/a n/a $0 $0 0.0 $0 0.0 $0 0.0 Illinois $0.00 n/a n/a $0 $0 0.0 $0 0.0 $0 0.0 Indiana $0.00 n/a n/a $0 $0 0.0 $0 0.0 $0 0.0 Iowa $0.00 n/a n/a $0 $0 0.0 $0 0.0 $0 0.0 Kansas $0.00 n/a n/a $0 $0 0.0 $0 0.0 $0 0.0 Kentucky $0.00 n/a n/a $0 $0 0.0 $0 0.0 $0 0.0 Louisiana $0.00 n/a n/a $0 $0 0.0 $0 0.0 $0 0.0 Maine $0.00 n/a n/a $0 $0 0.0 $0 0.0 $0 0.0 Maryland $0.00 n/a n/a $0 $0 0.0 $0 0.0 $0 0.0 Massachusetts $0.00 n/a n/a $0 $0 0.0 $0 0.0 $0 0.0 Michigan $0.00 n/a n/a $0 $0 0.0 $0 0.0 $0 0.0 Minnesota $0.00 n/a n/a $0 $0 0.0 $0 0.0 $0 0.0 Mississippi $0.00 n/a n/a $0 $0 0.0 $0 0.0 $0 0.0 Missouri $0.00 n/a n/a $0 $0 0.0 $0 0.0 $0 0.0 Montana $0.00 n/a n/a $0 $0 0.0 $0 0.0 $0 0.0 Nebraska $0.00 n/a n/a $0 $0 0.0 $0 0.0 $0 0.0 Nevada $0.00 n/a n/a $0 $0 0.0 $0 0.0 $0 0.0 New Hampshire $0.00 n/a n/a $0 $0 0.0 $0 0.0 $0 0.0 New Jersey $0.00 n/a n/a $0 $0 0.0 $0 0.0 $0 0.0 New Mexico $0.00 n/a n/a $0 $0 0.0 $0 0.0 $0 0.0 New York $0.00 n/a n/a $0 $0 0.0 $0 0.0 $0 0.0 North Carolina $0.00 n/a n/a $0 $0 0.0 $0 0.0 $0 0.0 North Dakota $0.00 n/a n/a $0 $0 0.0 $0 0.0 $0 0.0 Ohio $0.00 n/a n/a $0 $0 0.0 $0 0.0 $0 0.0 Oklahoma $0.00 n/a n/a $0 $0 0.0 $0 0.0 $0 0.0 Oregon $0.00 n/a n/a $0 $0 0.0 $0 0.0 $0 0.0 Pennsylvania $0.00 n/a n/a $0 $0 0.0 $0 0.0 $0 0.0 Rhode Island $0.00 n/a n/a $0 $0 0.0 $0 0.0 $0 0.0 South Carolina $0.00 n/a n/a $0 $0 0.0 $0 0.0 $0 0.0 South Dakota $0.00 n/a n/a $0 $0 0.0 $0 0.0 $0 0.0 Tennessee $0.00 n/a n/a $0 $0 0.0 $0 0.0 $0 0.0 Texas $0.00 n/a n/a $0 $0 0.0 $0 0.0 $0 0.0 Utah $0.00 n/a n/a $0 $0 0.0 $0 0.0 $0 0.0 Vermont $0.00 n/a n/a $0 $0 0.0 $0 0.0 $0 0.0 Virginia $0.00 n/a n/a $0 $0 0.0 $0 0.0 $0 0.0 Washington $0.00 n/a n/a $0 $0 0.0 $0 0.0 $0 0.0 West Virginia $0.00 n/a n/a $0 $0 0.0 $0 0.0 $0 0.0 Wisconsin $0.00 n/a n/a $0 $0 0.0 $0 0.0 $0 0.0 Wyoming $0.00 n/a n/a $0 $0 0.0 $0 0.0 $0 0.0 United States $0.01 n/a n/a $2,845,288 $2,369,363 -16.7 $2,168,623 -8.5 $3,012,084 38.9
Notes: Data do not include services provided through managed care organizations. Data are presented based on state reporting. No further explanation of trends is available for the purposes of this report.

State Plan HCBS (Section 1915(i)) for People with Developmental Disabilities Table AH
State
FY 2015 Expenditures Per Resident
Rank 2015
Rank 2014
FY 2012 Expenditures
FY 2013 Expenditures
Percent Change 12-13
FY 2014 Expenditures
Percent Change 13-14
FY 2015 Expenditures
Percent Change 14-15
California $10.66 1 1 $11,187,735 $533,828,329 4671.5 $287,258,490 -46.2 $412,260,552 43.5 Alabama $0.00 n/a n/a $0 $0 0.0 $0 0.0 $0 0.0
Alaska $0.00 n/a n/a $0 $0 0.0 $0 0.0 $0 0.0 Arizona $0.00 n/a n/a $0 $0 0.0 $0 0.0 $0 0.0 Arkansas $0.00 n/a n/a $0 $0 0.0 $0 0.0 $0 0.0 Colorado $0.00 n/a n/a $0 $0 0.0 $0 0.0 $0 0.0 Connecticut $0.00 n/a n/a $0 $0 0.0 $0 0.0 $0 0.0 Delaware $0.00 n/a n/a $0 $0 0.0 $0 0.0 $0 0.0 Dist. of Columbia $0.00 n/a n/a $0 $0 0.0 $0 0.0 $0 0.0 Florida $0.00 n/a n/a $0 $0 0.0 $0 0.0 $0 0.0 Georgia $0.00 n/a n/a $0 $0 0.0 $0 0.0 $0 0.0 Hawaii $0.00 n/a n/a $0 $0 0.0 $0 0.0 $0 0.0 Idaho $0.00 n/a n/a $0 $0 0.0 $0 0.0 $0 0.0 Illinois $0.00 n/a n/a $0 $0 0.0 $0 0.0 $0 0.0 Indiana $0.00 n/a n/a $0 $0 0.0 $0 0.0 $0 0.0 Iowa $0.00 n/a n/a $0 $0 0.0 $0 0.0 $0 0.0 Kansas $0.00 n/a n/a $0 $0 0.0 $0 0.0 $0 0.0 Kentucky $0.00 n/a n/a $0 $0 0.0 $0 0.0 $0 0.0 Louisiana $0.00 n/a n/a $0 $0 0.0 $0 0.0 $0 0.0 Maine $0.00 n/a n/a $0 $0 0.0 $0 0.0 $0 0.0 Maryland $0.00 n/a n/a $0 $0 0.0 $0 0.0 $0 0.0 Massachusetts $0.00 n/a n/a $0 $0 0.0 $0 0.0 $0 0.0 Michigan $0.00 n/a n/a $0 $0 0.0 $0 0.0 $0 0.0 Minnesota $0.00 n/a n/a $0 $0 0.0 $0 0.0 $0 0.0 Mississippi $0.00 n/a n/a $0 $0 0.0 $0 0.0 $0 0.0 Missouri $0.00 n/a n/a $0 $0 0.0 $0 0.0 $0 0.0 Montana $0.00 n/a n/a $0 $0 0.0 $0 0.0 $0 0.0 Nebraska $0.00 n/a n/a $0 $0 0.0 $0 0.0 $0 0.0 Nevada $0.00 n/a n/a $0 $0 0.0 $0 0.0 $0 0.0 New Hampshire $0.00 n/a n/a $0 $0 0.0 $0 0.0 $0 0.0 New Jersey $0.00 n/a n/a $0 $0 0.0 $0 0.0 $0 0.0 New Mexico $0.00 n/a n/a $0 $0 0.0 $0 0.0 $0 0.0 New York $0.00 n/a n/a $0 $0 0.0 $0 0.0 $0 0.0 North Carolina $0.00 n/a n/a $0 $0 0.0 $0 0.0 $0 0.0 North Dakota $0.00 n/a n/a $0 $0 0.0 $0 0.0 $0 0.0 Ohio $0.00 n/a n/a $0 $0 0.0 $0 0.0 $0 0.0 Oklahoma $0.00 n/a n/a $0 $0 0.0 $0 0.0 $0 0.0 Oregon $0.00 n/a n/a $0 $0 0.0 $0 0.0 $0 0.0 Pennsylvania $0.00 n/a n/a $0 $0 0.0 $0 0.0 $0 0.0 Rhode Island $0.00 n/a n/a $0 $0 0.0 $0 0.0 $0 0.0 South Carolina $0.00 n/a n/a $0 $0 0.0 $0 0.0 $0 0.0 South Dakota $0.00 n/a n/a $0 $0 0.0 $0 0.0 $0 0.0 Tennessee $0.00 n/a n/a $0 $0 0.0 $0 0.0 $0 0.0 Texas $0.00 n/a n/a $0 $0 0.0 $0 0.0 $0 0.0 Utah $0.00 n/a n/a $0 $0 0.0 $0 0.0 $0 0.0 Vermont $0.00 n/a n/a $0 $0 0.0 $0 0.0 $0 0.0 Virginia $0.00 n/a n/a $0 $0 0.0 $0 0.0 $0 0.0 Washington $0.00 n/a n/a $0 $0 0.0 $0 0.0 $0 0.0 West Virginia $0.00 n/a n/a $0 $0 0.0 $0 0.0 $0 0.0 Wisconsin $0.00 n/a n/a $0 $0 0.0 $0 0.0 $0 0.0 Wyoming $0.00 n/a n/a $0 $0 0.0 $0 0.0 $0 0.0 United States $1.29 n/a n/a $11,187,735 $533,828,329 4671.5 $287,258,490 -46.2 $412,260,552 43.5
Notes: Data do not include services provided through managed care organizations. Data are presented based on state reporting. No further explanation of trends is available for the purposes of this report.

State Plan HCBS (Section 1915(i)) for Behavioral Health Services Table AI
State
FY 2015 Expenditures Per Resident
Rank 2015
Rank 2014
FY 2012 Expenditures
FY 2013 Expenditures
Percent Change 12-13
FY 2014 Expenditures
Percent Change 13-14
FY 2015 Expenditures
Percent Change 14-15
Oregon $18.82 1 1 $17,963 -$3,460,547 -19364.9 $85,247,442 -2563.4 $74,690,012 -12.4 Nevada $2.59 2 2 $5,149,969 $5,439,980 5.6 $6,716,183 23.5 $7,329,954 9.1 Wisconsin $1.10 3 3 $3,458,850 $3,659,624 5.8 $4,202,492 14.8 $6,361,564 51.4 Indiana $0.74 4 6 $0 $0 0.0 $298,328 100.0 $4,912,222 1546.6 Iowa $0.47 5 4 $18,591,409 $85,922,630 362.2 $1,308,890 -98.5 $1,461,695 11.7 Montana $0.10 6 5 $0 $80,877 100.0 $325,727 302.7 $102,889 -68.4 Florida $0.06 7 7 $0 $0 0.0 $317,585 100.0 $1,138,980 258.6 Louisiana $0.00 8 8 $0 $0 0.0 $4,595 100.0 $4,655 1.3 Alabama $0.00 n/a n/a $0 $0 0.0 $0 0.0 $0 0.0 Alaska $0.00 n/a n/a $0 $0 0.0 $0 0.0 $0 0.0 Arizona $0.00 n/a n/a $0 $0 0.0 $0 0.0 $0 0.0 Arkansas $0.00 n/a n/a $0 $0 0.0 $0 0.0 $0 0.0 California $0.00 n/a n/a $0 $0 0.0 $0 0.0 $0 0.0 Colorado $0.00 n/a n/a $0 $0 0.0 $0 0.0 $0 0.0 Connecticut $0.00 n/a n/a $0 $0 0.0 $0 0.0 $0 0.0 Delaware $0.00 n/a n/a $0 $0 0.0 $0 0.0 $0 0.0 Dist. of Columbia $0.00 n/a n/a $0 $0 0.0 $0 0.0 $0 0.0 Georgia $0.00 n/a n/a $0 $0 0.0 $0 0.0 $0 0.0 Hawaii $0.00 n/a n/a $0 $0 0.0 $0 0.0 $0 0.0 Idaho $0.00 n/a n/a $0 $0 0.0 $0 0.0 $0 0.0 Illinois $0.00 n/a n/a $0 $0 0.0 $0 0.0 $0 0.0 Kansas $0.00 n/a n/a $0 $0 0.0 $0 0.0 $0 0.0 Kentucky $0.00 n/a n/a $0 $0 0.0 $0 0.0 $0 0.0 Maine $0.00 n/a n/a $0 $0 0.0 $0 0.0 $0 0.0 Maryland $0.00 n/a n/a $0 $0 0.0 $0 0.0 $0 0.0 Massachusetts $0.00 n/a n/a $0 $0 0.0 $0 0.0 $0 0.0 Michigan $0.00 n/a n/a $0 $0 0.0 $0 0.0 $0 0.0 Minnesota $0.00 n/a n/a $0 $0 0.0 $0 0.0 $0 0.0 Mississippi $0.00 n/a n/a $0 $0 0.0 $0 0.0 $0 0.0 Missouri $0.00 n/a n/a $0 $0 0.0 $0 0.0 $0 0.0 Nebraska $0.00 n/a n/a $0 $0 0.0 $0 0.0 $0 0.0 New Hampshire $0.00 n/a n/a $0 $0 0.0 $0 0.0 $0 0.0 New Jersey $0.00 n/a n/a $0 $0 0.0 $0 0.0 $0 0.0 New Mexico $0.00 n/a n/a $0 $0 0.0 $0 0.0 $0 0.0 New York $0.00 n/a n/a $0 $0 0.0 $0 0.0 $0 0.0 North Carolina $0.00 n/a n/a $0 $0 0.0 $0 0.0 $0 0.0 North Dakota $0.00 n/a n/a $0 $0 0.0 $0 0.0 $0 0.0 Ohio $0.00 n/a n/a $0 $0 0.0 $0 0.0 $0 0.0 Oklahoma $0.00 n/a n/a $0 $0 0.0 $0 0.0 $0 0.0 Pennsylvania $0.00 n/a n/a $0 $0 0.0 $0 0.0 $0 0.0 Rhode Island $0.00 n/a n/a $0 $0 0.0 $0 0.0 $0 0.0 South Carolina $0.00 n/a n/a $0 $0 0.0 $0 0.0 $0 0.0 South Dakota $0.00 n/a n/a $0 $0 0.0 $0 0.0 $0 0.0 Tennessee $0.00 n/a n/a $0 $0 0.0 $0 0.0 $0 0.0 Texas $0.00 n/a n/a $0 $0 0.0 $0 0.0 $0 0.0 Utah $0.00 n/a n/a $0 $0 0.0 $0 0.0 $0 0.0 Vermont $0.00 n/a n/a $0 $0 0.0 $0 0.0 $0 0.0 Virginia $0.00 n/a n/a $0 $0 0.0 $0 0.0 $0 0.0 Washington $0.00 n/a n/a $0 $0 0.0 $0 0.0 $0 0.0 West Virginia $0.00 n/a n/a $0 $0 0.0 $0 0.0 $0 0.0 Wyoming $0.00 n/a n/a $0 $0 0.0 $0 0.0 $0 0.0 United States $0.30 n/a n/a $27,218,191 $91,642,564 236.7 $98,421,242 7.4 $96,001,971 -2.5
Notes: Data do not include services provided through managed care organizations. Data are presented based on state reporting. No further explanation of trends is available for the purposes of this report.

Health Homes for Older Adults and/or People with Physical Disabilities Table AJ
State
FY 2015 Expenditures Per Resident
Rank 2015
Rank 2014
FY 2012 Expenditures
FY 2013 Expenditures
Percent Change 12-13
FY 2014 Expenditures
Percent Change 13-14
FY 2015 Expenditures
Percent Change 14-15
North Carolina $0.00 n/a n/a $54,661,419 $69,974,727 28.0 $0 -100.0 $0 0.0 Alabama $0.00 n/a n/a $0 $0 0.0 $0 0.0 $0 0.0 Alaska $0.00 n/a n/a $0 $0 0.0 $0 0.0 $0 0.0 Arizona $0.00 n/a n/a $0 $0 0.0 $0 0.0 $0 0.0 Arkansas $0.00 n/a n/a $0 $0 0.0 $0 0.0 $0 0.0 California $0.00 n/a n/a $0 $0 0.0 $0 0.0 $0 0.0 Colorado $0.00 n/a n/a $0 $0 0.0 $0 0.0 $0 0.0 Connecticut $0.00 n/a n/a $0 $0 0.0 $0 0.0 $0 0.0 Delaware $0.00 n/a n/a $0 $0 0.0 $0 0.0 $0 0.0 Dist. of Columbia $0.00 n/a n/a $0 $0 0.0 $0 0.0 $0 0.0 Florida $0.00 n/a n/a $0 $0 0.0 $0 0.0 $0 0.0 Georgia $0.00 n/a n/a $0 $0 0.0 $0 0.0 $0 0.0 Hawaii $0.00 n/a n/a $0 $0 0.0 $0 0.0 $0 0.0 Idaho $0.00 n/a n/a $0 $0 0.0 $0 0.0 $0 0.0 Illinois $0.00 n/a n/a $0 $0 0.0 $0 0.0 $0 0.0 Indiana $0.00 n/a n/a $0 $0 0.0 $0 0.0 $0 0.0 Iowa $0.00 n/a n/a $0 $0 0.0 $0 0.0 $0 0.0 Kansas $0.00 n/a n/a $0 $0 0.0 $0 0.0 $0 0.0 Kentucky $0.00 n/a n/a $0 $0 0.0 $0 0.0 $0 0.0 Louisiana $0.00 n/a n/a $0 $0 0.0 $0 0.0 $0 0.0 Maine $0.00 n/a n/a $0 $0 0.0 $0 0.0 $0 0.0 Maryland $0.00 n/a n/a $0 $0 0.0 $0 0.0 $0 0.0 Massachusetts $0.00 n/a n/a $0 $0 0.0 $0 0.0 $0 0.0 Michigan $0.00 n/a n/a $0 $0 0.0 $0 0.0 $0 0.0 Minnesota $0.00 n/a n/a $0 $0 0.0 $0 0.0 $0 0.0 Mississippi $0.00 n/a n/a $0 $0 0.0 $0 0.0 $0 0.0 Missouri $0.00 n/a n/a $0 $0 0.0 $0 0.0 $0 0.0 Montana $0.00 n/a n/a $0 $0 0.0 $0 0.0 $0 0.0 Nebraska $0.00 n/a n/a $0 $0 0.0 $0 0.0 $0 0.0 Nevada $0.00 n/a n/a $0 $0 0.0 $0 0.0 $0 0.0 New Hampshire $0.00 n/a n/a $0 $0 0.0 $0 0.0 $0 0.0 New Jersey $0.00 n/a n/a $0 $0 0.0 $0 0.0 $0 0.0 New Mexico $0.00 n/a n/a $0 $0 0.0 $0 0.0 $0 0.0 New York $0.00 n/a n/a $0 $0 0.0 $0 0.0 $0 0.0 North Dakota $0.00 n/a n/a $0 $0 0.0 $0 0.0 $0 0.0 Ohio $0.00 n/a n/a $0 $0 0.0 $0 0.0 $0 0.0 Oklahoma $0.00 n/a n/a $0 $0 0.0 $0 0.0 $0 0.0 Oregon $0.00 n/a n/a $0 $0 0.0 $0 0.0 $0 0.0 Pennsylvania $0.00 n/a n/a $0 $0 0.0 $0 0.0 $0 0.0 Rhode Island $0.00 n/a n/a $0 $0 0.0 $0 0.0 $0 0.0 South Carolina $0.00 n/a n/a $0 $0 0.0 $0 0.0 $0 0.0 South Dakota $0.00 n/a n/a $0 $0 0.0 $0 0.0 $0 0.0 Tennessee $0.00 n/a n/a $0 $0 0.0 $0 0.0 $0 0.0 Texas $0.00 n/a n/a $0 $0 0.0 $0 0.0 $0 0.0 Utah $0.00 n/a n/a $0 $0 0.0 $0 0.0 $0 0.0 Vermont $0.00 n/a n/a $0 $0 0.0 $0 0.0 $0 0.0 Virginia $0.00 n/a n/a $0 $0 0.0 $0 0.0 $0 0.0 Washington $0.00 n/a n/a $0 $0 0.0 $0 0.0 $0 0.0 West Virginia $0.00 n/a n/a $0 $0 0.0 $0 0.0 $0 0.0 Wisconsin $0.00 n/a n/a $0 $0 0.0 $0 0.0 $0 0.0 Wyoming $0.00 n/a n/a $0 $0 0.0 $0 0.0 $0 0.0 United States $0.00 n/a n/a $54,661,419 $69,974,727 28.0 $0 -100.0 $0 0.0
Notes: Data do not include services provided through managed care organizations. Data are presented based on state reporting. No further explanation of trends is available for the purposes of this report.

Health Homes for Behavioral Health Services Table AK
State
FY 2015 Expenditures Per Resident
Rank 2015
Rank 2014
FY 2012 Expenditures
FY 2013 Expenditures
Percent Change 12-13
FY 2014 Expenditures
Percent Change 13-14
FY 2015 Expenditures
Percent Change 14-15
Iowa $11.49 1 2 $0 $0 0.0 $11,469,573 100.0 $35,713,104 211.4 Kansas $8.60 2 51 $0 $0 0.0 -$444,570 100.0 $24,935,895 -5709.0 Maine $5.18 3 n/a $0 $0 0.0 $0 0.0 $6,891,008 100.0 Missouri $3.25 4 3 $11,026,403 $13,573,193 23.1 $17,191,288 26.7 $19,687,711 14.5 Ohio $3.23 5 1 $0 $39,996,016 100.0 $43,758,127 9.4 $37,486,844 -14.3 Oklahoma $2.31 6 n/a $0 $0 0.0 $0 0.0 $8,963,577 100.0 Maryland $0.46 7 4 $0 $0 0.0 $708,722 100.0 $2,724,521 284.4 West Virginia $0.20 8 n/a $0 $0 0.0 $0 0.0 $371,191 100.0 Michigan $0.05 9 n/a $0 $0 0.0 $0 0.0 $495,942 100.0 Rhode Island $0.00 n/a n/a $26,898,255 $36,348,836 35.1 $0 -100.0 $0 0.0 Alabama $0.00 n/a n/a $0 $0 0.0 $0 0.0 $0 0.0 Alaska $0.00 n/a n/a $0 $0 0.0 $0 0.0 $0 0.0 Arizona $0.00 n/a n/a $0 $0 0.0 $0 0.0 $0 0.0 Arkansas $0.00 n/a n/a $0 $0 0.0 $0 0.0 $0 0.0 California $0.00 n/a n/a $0 $0 0.0 $0 0.0 $0 0.0 Colorado $0.00 n/a n/a $0 $0 0.0 $0 0.0 $0 0.0 Connecticut $0.00 n/a n/a $0 $0 0.0 $0 0.0 $0 0.0 Delaware $0.00 n/a n/a $0 $0 0.0 $0 0.0 $0 0.0 Dist. of Columbia $0.00 n/a n/a $0 $0 0.0 $0 0.0 $0 0.0 Florida $0.00 n/a n/a $0 $0 0.0 $0 0.0 $0 0.0 Georgia $0.00 n/a n/a $0 $0 0.0 $0 0.0 $0 0.0 Hawaii $0.00 n/a n/a $0 $0 0.0 $0 0.0 $0 0.0 Idaho $0.00 n/a n/a $0 $0 0.0 $0 0.0 $0 0.0 Illinois $0.00 n/a n/a $0 $0 0.0 $0 0.0 $0 0.0 Indiana $0.00 n/a n/a $0 $0 0.0 $0 0.0 $0 0.0 Kentucky $0.00 n/a n/a $0 $0 0.0 $0 0.0 $0 0.0 Louisiana $0.00 n/a n/a $0 $0 0.0 $0 0.0 $0 0.0 Massachusetts $0.00 n/a n/a $0 $0 0.0 $0 0.0 $0 0.0 Minnesota $0.00 n/a n/a $0 $0 0.0 $0 0.0 $0 0.0 Mississippi $0.00 n/a n/a $0 $0 0.0 $0 0.0 $0 0.0 Montana $0.00 n/a n/a $0 $0 0.0 $0 0.0 $0 0.0 Nebraska $0.00 n/a n/a $0 $0 0.0 $0 0.0 $0 0.0 Nevada $0.00 n/a n/a $0 $0 0.0 $0 0.0 $0 0.0 New Hampshire $0.00 n/a n/a $0 $0 0.0 $0 0.0 $0 0.0 New Jersey $0.00 n/a n/a $0 $0 0.0 $0 0.0 $0 0.0 New Mexico $0.00 n/a n/a $0 $0 0.0 $0 0.0 $0 0.0 New York $0.00 n/a n/a $0 $0 0.0 $0 0.0 $0 0.0 North Carolina $0.00 n/a n/a $0 $0 0.0 $0 0.0 $0 0.0 North Dakota $0.00 n/a n/a $0 $0 0.0 $0 0.0 $0 0.0 Oregon $0.00 n/a n/a $0 $0 0.0 $0 0.0 $0 0.0 Pennsylvania $0.00 n/a n/a $0 $0 0.0 $0 0.0 $0 0.0 South Carolina $0.00 n/a n/a $0 $0 0.0 $0 0.0 $0 0.0 South Dakota $0.00 n/a n/a $0 $0 0.0 $0 0.0 $0 0.0 Tennessee $0.00 n/a n/a $0 $0 0.0 $0 0.0 $0 0.0 Texas $0.00 n/a n/a $0 $0 0.0 $0 0.0 $0 0.0 Utah $0.00 n/a n/a $0 $0 0.0 $0 0.0 $0 0.0 Vermont $0.00 n/a n/a $0 $0 0.0 $0 0.0 $0 0.0 Virginia $0.00 n/a n/a $0 $0 0.0 $0 0.0 $0 0.0 Washington $0.00 n/a n/a $0 $0 0.0 $0 0.0 $0 0.0 Wisconsin $0.00 n/a n/a $0 $0 0.0 $0 0.0 $0 0.0 Wyoming $0.00 n/a n/a $0 $0 0.0 $0 0.0 $0 0.0 United States $0.43 n/a n/a $37,924,658 $89,918,045 137.1 $72,683,140 -19.2 $137,269,793 88.9
Notes: Data do not include services provided through managed care organizations. Data are presented based on state reporting. No further explanation of trends is available for the purposes of this report.

Health Homes for Other Populations or Multiple Populations Table AL
State
FY 2015 Expenditures Per Resident
Rank 2015
Rank 2014
FY 2012 Expenditures
FY 2013 Expenditures
Percent Change 12-13
FY 2014 Expenditures
Percent Change 13-14
FY 2015 Expenditures
Percent Change 14-15
New York $23.97 1 1 $11,767,759 $178,765,959 1419.1 $292,350,240 63.5 $472,619,404 61.7 Maine $7.04 2 2 $0 $2,885,832 100.0 $9,745,330 237.7 $9,368,018 -3.9 Alabama $5.48 3 4 $4,397,365 $19,264,711 338.1 $23,041,180 19.6 $26,516,633 15.1 Rhode Island $4.56 4 5 $0 $0 0.0 $4,757,206 100.0 $4,808,227 1.1 Iowa $3.72 5 3 $9,191 $6,589,659 71596.9 $19,967,460 203.0 $11,565,921 -42.1 South Dakota $3.01 6 6 $0 $650,538 100.0 $3,537,761 443.8 $2,563,451 -27.5 Missouri $1.79 7 7 $6,056,896 $8,472,138 39.9 $9,709,695 14.6 $10,866,930 11.9 Idaho $0.98 8 9 $0 $1,152,152 100.0 $1,732,705 50.4 $1,607,831 -7.2 Washington $0.98 9 10 $0 $9,864 100.0 $1,574,514 15862.2 $6,880,717 337.0 Wisconsin $0.06 10 11 $0 $155,351 100.0 $221,481 42.6 $330,024 49.0 Oregon $0.00 n/a 8 -$130,081 $16,523,852 -12802.7 $4,620,937 -72.0 $0 -100.0 Alaska $0.00 n/a n/a $0 $0 0.0 $0 0.0 $0 0.0 Arizona $0.00 n/a n/a $0 $0 0.0 $0 0.0 $0 0.0 Arkansas $0.00 n/a n/a $0 $0 0.0 $0 0.0 $0 0.0 California $0.00 n/a n/a $0 $0 0.0 $0 0.0 $0 0.0 Colorado $0.00 n/a n/a $0 $0 0.0 $0 0.0 $0 0.0 Connecticut $0.00 n/a n/a $0 $0 0.0 $0 0.0 $0 0.0 Delaware $0.00 n/a n/a $0 $0 0.0 $0 0.0 $0 0.0 Dist. of Columbia $0.00 n/a n/a $0 $0 0.0 $0 0.0 $0 0.0 Florida $0.00 n/a n/a $0 $0 0.0 $0 0.0 $0 0.0 Georgia $0.00 n/a n/a $0 $0 0.0 $0 0.0 $0 0.0 Hawaii $0.00 n/a n/a $0 $0 0.0 $0 0.0 $0 0.0 Illinois $0.00 n/a n/a $0 $0 0.0 $0 0.0 $0 0.0 Indiana $0.00 n/a n/a $0 $0 0.0 $0 0.0 $0 0.0 Kansas $0.00 n/a n/a $0 $0 0.0 $0 0.0 $0 0.0 Kentucky $0.00 n/a n/a $0 $0 0.0 $0 0.0 $0 0.0 Louisiana $0.00 n/a n/a $0 $0 0.0 $0 0.0 $0 0.0 Maryland $0.00 n/a n/a $0 $0 0.0 $0 0.0 $0 0.0 Massachusetts $0.00 n/a n/a $0 $0 0.0 $0 0.0 $0 0.0 Michigan $0.00 n/a n/a $0 $0 0.0 $0 0.0 $0 0.0 Minnesota $0.00 n/a n/a $0 $0 0.0 $0 0.0 $0 0.0 Mississippi $0.00 n/a n/a $0 $0 0.0 $0 0.0 $0 0.0 Montana $0.00 n/a n/a $0 $0 0.0 $0 0.0 $0 0.0 Nebraska $0.00 n/a n/a $0 $0 0.0 $0 0.0 $0 0.0 Nevada $0.00 n/a n/a $0 $0 0.0 $0 0.0 $0 0.0 New Hampshire $0.00 n/a n/a $0 $0 0.0 $0 0.0 $0 0.0 New Jersey $0.00 n/a n/a $0 $0 0.0 $0 0.0 $0 0.0 New Mexico $0.00 n/a n/a $0 $0 0.0 $0 0.0 $0 0.0 North Carolina $0.00 n/a n/a $0 $0 0.0 $0 0.0 $0 0.0 North Dakota $0.00 n/a n/a $0 $0 0.0 $0 0.0 $0 0.0 Ohio $0.00 n/a n/a $0 $0 0.0 $0 0.0 $0 0.0 Oklahoma $0.00 n/a n/a $0 $0 0.0 $0 0.0 $0 0.0 Pennsylvania $0.00 n/a n/a $0 $0 0.0 $0 0.0 $0 0.0 South Carolina $0.00 n/a n/a $0 $0 0.0 $0 0.0 $0 0.0 Tennessee $0.00 n/a n/a $0 $0 0.0 $0 0.0 $0 0.0 Texas $0.00 n/a n/a $0 $0 0.0 $0 0.0 $0 0.0 Utah $0.00 n/a n/a $0 $0 0.0 $0 0.0 $0 0.0 Vermont $0.00 n/a n/a $0 $0 0.0 $0 0.0 $0 0.0 Virginia $0.00 n/a n/a $0 $0 0.0 $0 0.0 $0 0.0 West Virginia $0.00 n/a n/a $0 $0 0.0 $0 0.0 $0 0.0 Wyoming $0.00 n/a n/a $0 $0 0.0 $0 0.0 $0 0.0 United States $1.72 n/a n/a $22,101,130 $234,470,056 960.9 $371,258,509 58.3 $547,127,156 47.4
Notes: Data do not include services provided through managed care organizations. Data are presented based on state reporting. No further explanation of trends is available for the purposes of this report.

ICF/IID - Public Table AM
State
FY 2015 Expenditures Per Resident
Rank 2015
Rank 2014
FY 2012 Expenditures
FY 2013 Expenditures
Percent Change 12-13
FY 2014 Expenditures
Percent Change 13-14
FY 2015 Expenditures
Percent Change 14-15
Mississippi $70.80 1 1 $220,470,620 $209,726,696 -4.9 $221,201,808 5.5 $211,864,398 -4.2 Massachusetts $60.22 2 39 $165,995,204 $4,527,021 -97.3 $10,433,046 130.5 $406,466,544 3796.0 New Jersey $55.70 3 2 $638,993,352 $686,514,965 7.4 $652,624,819 -4.9 $497,159,282 -23.8 Connecticut $54.61 4 3 $214,755,990 $226,039,587 5.3 $188,419,774 -16.6 $196,137,966 4.1 Arkansas $51.74 5 4 $145,157,278 $139,178,913 -4.1 $152,769,374 9.8 $153,503,274 0.5 Iowa $41.78 6 5 $121,389,773 $146,952,770 21.1 $128,198,054 -12.8 $129,860,555 1.3 South Dakota $34.68 7 6 $29,593,899 $30,171,490 2.0 $30,891,316 2.4 $29,564,601 -4.3 Wyoming $34.20 8 10 $20,744,605 $19,640,307 -5.3 $17,451,654 -11.1 $19,960,138 14.4 North Dakota $31.94 9 7 $23,227,105 $22,093,643 -4.9 $23,739,292 7.4 $23,632,590 -0.4 Texas $31.17 10 8 $759,008,853 $810,770,928 6.8 $850,093,255 4.8 $839,913,265 -1.2 South Carolina $28.00 11 11 $155,037,462 $140,204,579 -9.6 $138,751,670 -1.0 $135,212,895 -2.6 Illinois $27.28 12 9 $404,522,943 $387,529,955 -4.2 $401,205,845 3.5 $350,985,505 -12.5 Louisiana $26.44 13 12 $236,714,343 $138,706,337 -41.4 $130,230,961 -6.1 $122,882,865 -5.6 Kentucky $24.91 14 14 $130,611,577 $147,550,212 13.0 $114,119,972 -22.7 $109,941,459 -3.7 Pennsylvania $24.68 15 15 $288,744,897 $293,612,555 1.7 $296,978,127 1.1 $315,677,733 6.3 Wisconsin $24.64 16 13 $178,878,985 $148,546,772 -17.0 $149,834,808 0.9 $141,881,178 -5.3 Kansas $22.48 17 20 $51,770,146 $59,471,397 14.9 $61,232,884 3.0 $65,172,371 6.4 Delaware $19.92 18 19 $33,715,693 $21,927,516 -35.0 $20,209,147 -7.8 $18,619,533 -7.9 New York $17.69 19 17 $2,302,619,635 $921,582,940 -60.0 $445,457,655 -51.7 $348,772,437 -21.7 Washington $16.89 20 21 $100,339,159 $111,920,925 11.5 $124,630,705 11.4 $119,124,842 -4.4 Missouri $16.28 21 22 $116,824,338 $106,015,542 -9.3 $104,924,519 -1.0 $98,664,491 -6.0 Virginia $15.74 22 16 $212,446,783 $218,507,789 2.9 $191,727,385 -12.3 $130,938,444 -31.7 Tennessee $15.72 23 23 $100,139,751 $128,883,401 28.7 $102,010,044 -20.9 $102,860,161 0.8 Nebraska $15.44 24 18 $33,850,894 $49,228,520 45.4 $42,193,718 -14.3 $29,044,654 -31.2 Ohio $13.75 25 24 $194,005,279 $186,536,671 -3.8 $175,562,566 -5.9 $159,457,673 -9.2 Montana $11.34 26 26 $11,218,733 $10,242,297 -8.7 $11,047,364 7.9 $11,603,797 5.0 Utah $11.29 27 25 $30,747,767 $31,489,359 2.4 $32,957,647 4.7 $33,210,402 0.8 Oklahoma $9.42 28 27 $55,362,595 $52,381,143 -5.4 $32,712,449 -37.5 $36,528,359 11.7 Colorado $6.43 29 28 $36,486,258 $40,865,551 12.0 $40,592,082 -0.7 $34,388,378 -15.3 California $6.10 30 29 $440,226,561 $386,365,125 -12.2 $276,599,713 -28.4 $236,024,896 -14.7 Idaho $4.95 31 30 $10,475,899 $11,995,802 14.5 $8,887,723 -25.9 $8,087,067 -9.0 Arizona $4.09 32 31 $26,844,760 $26,949,532 0.4 $29,758,592 10.4 $27,512,500 -7.5 Florida $4.04 33 33 $84,858,393 $46,877,727 -44.8 $68,510,726 46.1 $80,317,557 17.2 Georgia $3.90 34 35 $60,646,958 $43,426,627 -28.4 $23,272,105 -46.4 $39,315,848 68.9 Nevada $3.49 35 32 $9,914,605 $9,989,461 0.8 $10,944,109 9.6 $9,888,090 -9.6 Maryland $3.28 36 37 $123,036 $59,375 -51.7 $10,653,445 17842.6 $19,595,815 83.9 Rhode Island $2.22 37 34 $2,489,747 $5,321,259 113.7 $3,330,464 -37.4 $2,336,454 -29.8 Vermont $2.05 38 36 $1,211,654 $1,201,518 -0.8 $1,254,497 4.4 $1,286,725 2.6 Minnesota $1.66 39 38 $9,664,984 $9,824,178 1.6 $9,441,160 -3.9 $9,036,227 -4.3 Maine $1.30 40 40 $1,722,234 $1,636,980 -5.0 $1,501,011 -8.3 $1,732,635 15.4 New Mexico $0.41 41 41 $781,353 $782,441 0.1 $1,039,709 32.9 $851,927 -18.1 Alabama $0.08 42 n/a $8,073,583 -$39,330 -100.5 $0 -100.0 $405,000 100.0 Alaska $0.00 n/a n/a $0 $0 0.0 $0 0.0 $0 0.0 Dist. of Columbia $0.00 n/a n/a $0 $0 0.0 $0 0.0 $0 0.0 Hawaii $0.00 n/a n/a $0 $0 0.0 $0 0.0 $0 0.0 Indiana $0.00 n/a n/a $58,267 $0 -100.0 $0 0.0 $0 0.0 Michigan $0.00 n/a n/a $0 $215,843 100.0 $0 -100.0 $0 0.0 New Hampshire $0.00 n/a n/a $3,252,890 $1,841,199 -43.4 $0 -100.0 $0 0.0 North Carolina $0.00 n/a 42 $210,143,021 $73,362,117 -65.1 $2,773,483 -96.2 $0 -100.0 Oregon $0.00 n/a n/a $0 $0 0.0 $0 0.0 $0 0.0 West Virginia $0.00 n/a n/a $0 $0 0.0 $0 0.0 $0 0.0 United States $16.67 n/a n/a $7,883,861,862 $6,110,629,635 -22.5 $5,340,168,677 -12.6 $5,309,420,531 -0.6
Notes: Data do not include expenditures for managed care programs in North Carolina (2013 - 2015). Data for several states include expenditures for Medicaid Upper Payment Limit programs or provider taxes. Data are presented based on state reporting. No further explanation of trends is available for the purposes of this report.
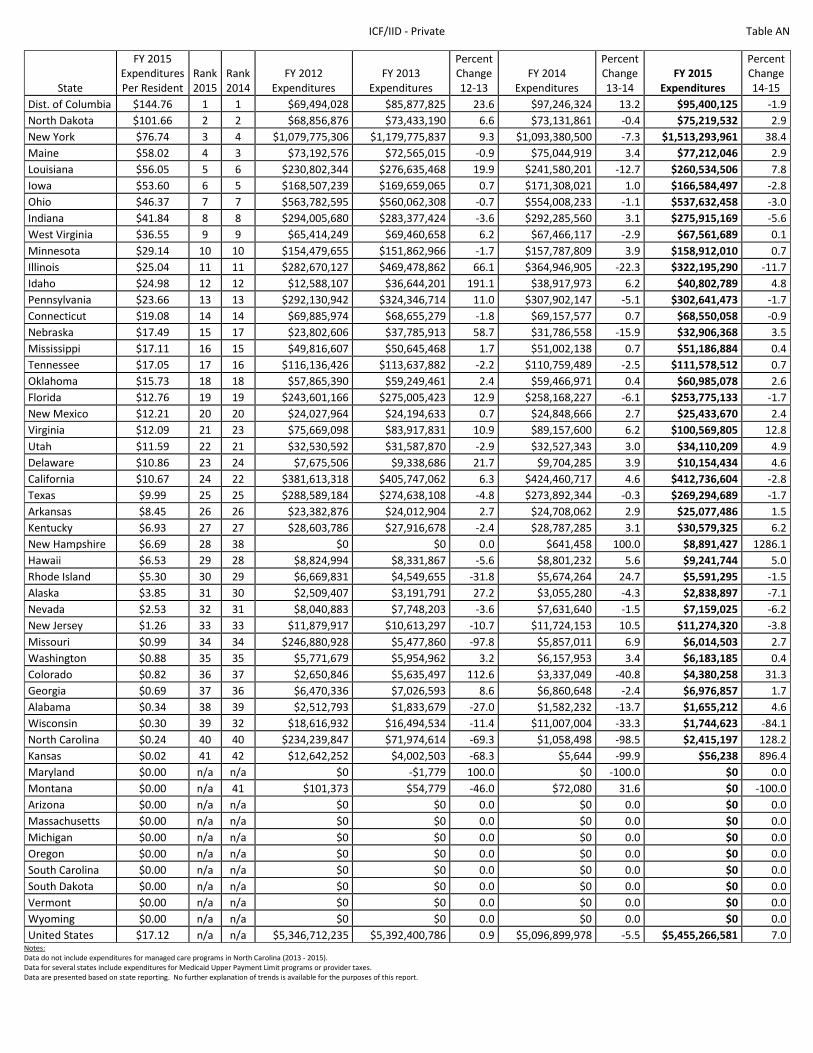
ICF/IID - Private Table AN
State
FY 2015 Expenditures Per Resident
Rank 2015
Rank 2014
FY 2012 Expenditures
FY 2013 Expenditures
Percent Change 12-13
FY 2014 Expenditures
Percent Change 13-14
FY 2015 Expenditures
Percent Change 14-15
Dist. of Columbia $144.76 1 1 $69,494,028 $85,877,825 23.6 $97,246,324 13.2 $95,400,125 -1.9 North Dakota $101.66 2 2 $68,856,876 $73,433,190 6.6 $73,131,861 -0.4 $75,219,532 2.9 New York $76.74 3 4 $1,079,775,306 $1,179,775,837 9.3 $1,093,380,500 -7.3 $1,513,293,961 38.4 Maine $58.02 4 3 $73,192,576 $72,565,015 -0.9 $75,044,919 3.4 $77,212,046 2.9 Louisiana $56.05 5 6 $230,802,344 $276,635,468 19.9 $241,580,201 -12.7 $260,534,506 7.8 Iowa $53.60 6 5 $168,507,239 $169,659,065 0.7 $171,308,021 1.0 $166,584,497 -2.8 Ohio $46.37 7 7 $563,782,595 $560,062,308 -0.7 $554,008,233 -1.1 $537,632,458 -3.0 Indiana $41.84 8 8 $294,005,680 $283,377,424 -3.6 $292,285,560 3.1 $275,915,169 -5.6 West Virginia $36.55 9 9 $65,414,249 $69,460,658 6.2 $67,466,117 -2.9 $67,561,689 0.1 Minnesota $29.14 10 10 $154,479,655 $151,862,966 -1.7 $157,787,809 3.9 $158,912,010 0.7 Illinois $25.04 11 11 $282,670,127 $469,478,862 66.1 $364,946,905 -22.3 $322,195,290 -11.7 Idaho $24.98 12 12 $12,588,107 $36,644,201 191.1 $38,917,973 6.2 $40,802,789 4.8 Pennsylvania $23.66 13 13 $292,130,942 $324,346,714 11.0 $307,902,147 -5.1 $302,641,473 -1.7 Connecticut $19.08 14 14 $69,885,974 $68,655,279 -1.8 $69,157,577 0.7 $68,550,058 -0.9 Nebraska $17.49 15 17 $23,802,606 $37,785,913 58.7 $31,786,558 -15.9 $32,906,368 3.5 Mississippi $17.11 16 15 $49,816,607 $50,645,468 1.7 $51,002,138 0.7 $51,186,884 0.4 Tennessee $17.05 17 16 $116,136,426 $113,637,882 -2.2 $110,759,489 -2.5 $111,578,512 0.7 Oklahoma $15.73 18 18 $57,865,390 $59,249,461 2.4 $59,466,971 0.4 $60,985,078 2.6 Florida $12.76 19 19 $243,601,166 $275,005,423 12.9 $258,168,227 -6.1 $253,775,133 -1.7 New Mexico $12.21 20 20 $24,027,964 $24,194,633 0.7 $24,848,666 2.7 $25,433,670 2.4 Virginia $12.09 21 23 $75,669,098 $83,917,831 10.9 $89,157,600 6.2 $100,569,805 12.8 Utah $11.59 22 21 $32,530,592 $31,587,870 -2.9 $32,527,343 3.0 $34,110,209 4.9 Delaware $10.86 23 24 $7,675,506 $9,338,686 21.7 $9,704,285 3.9 $10,154,434 4.6 California $10.67 24 22 $381,613,318 $405,747,062 6.3 $424,460,717 4.6 $412,736,604 -2.8 Texas $9.99 25 25 $288,589,184 $274,638,108 -4.8 $273,892,344 -0.3 $269,294,689 -1.7 Arkansas $8.45 26 26 $23,382,876 $24,012,904 2.7 $24,708,062 2.9 $25,077,486 1.5 Kentucky $6.93 27 27 $28,603,786 $27,916,678 -2.4 $28,787,285 3.1 $30,579,325 6.2 New Hampshire $6.69 28 38 $0 $0 0.0 $641,458 100.0 $8,891,427 1286.1 Hawaii $6.53 29 28 $8,824,994 $8,331,867 -5.6 $8,801,232 5.6 $9,241,744 5.0 Rhode Island $5.30 30 29 $6,669,831 $4,549,655 -31.8 $5,674,264 24.7 $5,591,295 -1.5 Alaska $3.85 31 30 $2,509,407 $3,191,791 27.2 $3,055,280 -4.3 $2,838,897 -7.1 Nevada $2.53 32 31 $8,040,883 $7,748,203 -3.6 $7,631,640 -1.5 $7,159,025 -6.2 New Jersey $1.26 33 33 $11,879,917 $10,613,297 -10.7 $11,724,153 10.5 $11,274,320 -3.8 Missouri $0.99 34 34 $246,880,928 $5,477,860 -97.8 $5,857,011 6.9 $6,014,503 2.7 Washington $0.88 35 35 $5,771,679 $5,954,962 3.2 $6,157,953 3.4 $6,183,185 0.4 Colorado $0.82 36 37 $2,650,846 $5,635,497 112.6 $3,337,049 -40.8 $4,380,258 31.3 Georgia $0.69 37 36 $6,470,336 $7,026,593 8.6 $6,860,648 -2.4 $6,976,857 1.7 Alabama $0.34 38 39 $2,512,793 $1,833,679 -27.0 $1,582,232 -13.7 $1,655,212 4.6 Wisconsin $0.30 39 32 $18,616,932 $16,494,534 -11.4 $11,007,004 -33.3 $1,744,623 -84.1 North Carolina $0.24 40 40 $234,239,847 $71,974,614 -69.3 $1,058,498 -98.5 $2,415,197 128.2 Kansas $0.02 41 42 $12,642,252 $4,002,503 -68.3 $5,644 -99.9 $56,238 896.4 Maryland $0.00 n/a n/a $0 -$1,779 100.0 $0 -100.0 $0 0.0 Montana $0.00 n/a 41 $101,373 $54,779 -46.0 $72,080 31.6 $0 -100.0 Arizona $0.00 n/a n/a $0 $0 0.0 $0 0.0 $0 0.0 Massachusetts $0.00 n/a n/a $0 $0 0.0 $0 0.0 $0 0.0 Michigan $0.00 n/a n/a $0 $0 0.0 $0 0.0 $0 0.0 Oregon $0.00 n/a n/a $0 $0 0.0 $0 0.0 $0 0.0 South Carolina $0.00 n/a n/a $0 $0 0.0 $0 0.0 $0 0.0 South Dakota $0.00 n/a n/a $0 $0 0.0 $0 0.0 $0 0.0 Vermont $0.00 n/a n/a $0 $0 0.0 $0 0.0 $0 0.0 Wyoming $0.00 n/a n/a $0 $0 0.0 $0 0.0 $0 0.0 United States $17.12 n/a n/a $5,346,712,235 $5,392,400,786 0.9 $5,096,899,978 -5.5 $5,455,266,581 7.0
Notes: Data do not include expenditures for managed care programs in North Carolina (2013 - 2015). Data for several states include expenditures for Medicaid Upper Payment Limit programs or provider taxes. Data are presented based on state reporting. No further explanation of trends is available for the purposes of this report.

5
10
15
20
25
30
35
40
45
50
Total Medicaid Expenditures – States Rank Order Table AO
State
FY 2015 Expenditures Per Resident
Rank 2015
Rank 2014
FY 2012 Expenditures
FY 2013 Expenditures
Percent Change 12-13
FY 2014 Expenditures
Percent Change 13-14
FY 2015 Expenditures
Percent Change 14-15
Dist. of Columbia $3,782.79 1 1 $2,113,235,604 $2,283,153,373 8.0 $2,378,006,520 4.2 $2,492,875,863 4.8 New York $3,023.63 2 2 $54,018,106,254 $54,040,149,631 0.0 $55,117,522,487 2.0 $59,621,474,558 8.2 Vermont $2,603.44 3 3 $1,388,919,441 $1,445,881,374 4.1 $1,535,217,667 6.2 $1,632,312,261 6.3 Rhode Island $2,461.19 4 4 $1,851,740,520 $1,945,057,475 5.0 $2,458,071,339 26.4 $2,595,271,558 5.6 Massachusetts $2,388.06 5 $12,657,854,983 $12,815,751,537 1.2 $14,593,485,515 13.9 $16,119,196,444 10.5 New Mexico $2,377.63 6 6 $3,340,811,555 $3,274,464,853 -2.0 $4,274,784,112 30.5 $4,952,666,769 15.9 Connecticut $2,158.20 7 7 $6,665,838,357 $6,766,535,062 1.5 $7,296,153,783 7.8 $7,751,987,299 6.2 Kentucky $2,137.75 8 13 $5,715,038,994 $5,845,811,687 2.3 $7,833,548,163 34.0 $9,433,993,329 20.4 Alaska $2,124.02 9 14 $1,351,112,877 $1,345,045,986 -0.4 $1,302,979,034 -3.1 $1,564,778,066 20.1 California $2,061.26 16 $52,656,477,798 $59,914,428,634 13.8 $64,285,568,899 7.3 $79,731,144,725 24.0 Oregon $2,057.31 11 15 $4,630,832,956 $5,141,662,499 11.0 $6,737,695,155 31.0 $8,164,164,213 21.2 Minnesota $2,008.61 12 10 $8,920,910,028 $8,919,853,473 0.0 $10,020,786,305 12.3 $10,953,158,789 9.3 West Virginia $1,989.18 13 12 $2,793,155,591 $3,019,007,710 8.1 $3,358,867,161 11.3 $3,677,031,945 9.5 Delaware $1,974.42 14 8 $1,506,278,561 $1,563,725,796 3.8 $1,718,635,936 9.9 $1,845,979,080 7.4 Maine $1,951.21 9 $2,340,722,056 $2,889,071,389 23.4 $2,460,834,485 -14.8 $2,596,509,373 5.5 Arkansas $1,866.32 16 18 $4,190,511,392 $4,203,226,120 0.3 $4,867,029,421 15.8 $5,537,200,521 13.8 Pennsylvania $1,829.60 17 11 $20,286,481,399 $21,181,113,829 4.4 $23,613,413,952 11.5 $23,401,623,491 -0.9 Ohio $1,790.22 18 17 $16,522,203,567 $16,598,321,129 0.5 $19,393,389,821 16.8 $20,756,491,730 7.0 Mississippi $1,739.32 19 19 $4,465,935,437 $4,736,403,877 6.1 $4,884,142,318 3.1 $5,204,753,503 6.6 Louisiana $1,675.32 21 $7,629,641,274 $7,075,779,933 -7.3 $7,168,123,756 1.3 $7,786,691,193 8.6 Michigan $1,618.43 21 28 $12,170,083,640 $12,352,386,939 1.5 $13,456,874,346 8.9 $16,047,998,915 19.3 New Jersey $1,614.02 22 24 $10,595,226,441 $10,692,984,472 0.9 $12,604,053,353 17.9 $14,405,135,592 14.3 Maryland $1,606.11 23 20 $7,579,399,491 $7,801,194,610 2.9 $9,352,302,117 19.9 $9,584,147,753 2.5 Missouri $1,593.31 24 22 $8,515,587,137 $8,837,905,408 3.8 $8,972,646,288 1.5 $9,656,952,532 7.6 Arizona $1,565.18 27 $8,228,228,293 $8,658,472,418 5.2 $9,163,994,502 5.8 $10,518,023,254 14.8 Washington $1,532.50 26 29 $7,569,696,927 $8,020,152,575 6.0 $9,307,367,915 16.0 $10,810,563,949 16.2 North Dakota $1,494.31 27 30 $746,706,868 $789,862,597 5.8 $959,975,230 21.5 $1,105,648,269 15.2 Iowa $1,459.48 28 31 $3,478,924,376 $3,721,015,408 7.0 $4,053,523,269 8.9 $4,536,093,796 11.9 Hawaii $1,420.58 29 25 $1,506,618,138 $1,645,545,430 9.2 $1,951,331,283 18.6 $2,012,035,896 3.1 Indiana $1,404.93 26 $7,737,604,465 $7,951,234,790 2.8 $9,103,489,415 14.5 $9,265,812,216 1.8 Wisconsin $1,389.22 31 33 $6,825,756,806 $7,158,368,459 4.9 $7,392,029,747 3.3 $7,999,631,053 8.2 Tennessee $1,386.19 32 23 $8,929,438,248 $8,619,235,404 -3.5 $9,299,619,031 7.9 $9,072,117,646 -2.4 Colorado $1,368.16 33 38 $4,672,048,439 $5,100,413,568 9.2 $5,955,208,766 16.8 $7,319,166,775 22.9 Illinois $1,348.79 34 32 $13,072,865,775 $15,749,406,206 20.5 $16,640,782,945 5.7 $17,355,620,134 4.3 New Hampshire $1,297.78 41 $1,221,515,448 $1,204,274,022 -1.4 $1,386,185,581 15.1 $1,724,417,722 24.4 Texas $1,294.70 36 35 $29,703,172,868 $30,505,857,320 2.7 $33,232,161,492 8.9 $34,885,244,075 5.0 Oklahoma $1,287.47 37 34 $4,654,117,095 $4,808,515,126 3.3 $4,948,306,400 2.9 $4,992,161,302 0.9 North Carolina $1,281.85 38 36 $12,513,041,952 $11,989,979,443 -4.2 $12,348,890,055 3.0 $12,734,419,848 3.1 South Carolina $1,253.17 39 37 $4,792,403,503 $4,949,056,058 3.3 $5,496,508,714 11.1 $6,050,859,531 10.1 Montana $1,125.42 39 $963,923,541 $1,007,885,833 4.6 $1,088,467,612 8.0 $1,151,150,342 5.8 Alabama $1,105.17 41 40 $4,894,500,814 $5,032,612,086 2.8 $5,168,579,944 2.7 $5,352,583,936 3.6 Idaho $1,103.82 42 43 $1,437,675,796 $1,688,758,313 17.5 $1,685,092,876 -0.2 $1,803,119,059 7.0 Nevada $1,081.35 43 50 $1,730,802,213 $1,798,734,564 3.9 $2,327,940,250 29.4 $3,063,479,987 31.6 Kansas $1,049.89 44 45 $2,678,534,991 $2,559,305,369 -4.5 $2,819,994,777 10.2 $3,044,002,639 7.9 Florida $1,044.58 42 $18,021,631,444 $18,616,423,410 3.3 $20,473,727,346 10.0 $20,775,344,737 1.5 Nebraska $1,001.66 46 44 $1,731,564,838 $1,843,597,981 6.5 $1,830,410,451 -0.7 $1,884,258,567 2.9 South Dakota $970.65 47 49 $749,264,081 $766,441,148 2.3 $756,994,934 -1.2 $827,540,746 9.3 Virginia $965.48 48 48 $6,886,178,858 $7,314,244,050 6.2 $7,731,122,892 5.7 $8,030,220,829 3.9 Georgia $956.10 49 47 $8,735,471,630 $8,970,593,295 2.7 $9,395,281,716 4.7 $9,644,444,017 2.7 Wyoming $937.34 46 $545,524,234 $560,188,308 2.7 $562,372,512 0.4 $547,072,421 -2.7 Utah $771.22 51 51 $1,892,256,465 $2,143,820,954 13.3 $2,057,159,773 -4.0 $2,268,816,289 10.3 United States $1,645.79 n/a n/a $419,825,573,459 $437,862,910,931 4.3 $476,820,651,361 8.9 $524,287,388,537 10.0
Note: Data are presented based on state reporting. No further explanation of trends is available for the purposes of this report.

Total Medicaid Expenditures – States Alphabetical Order Table AP
State
FY 2015 Expenditures Per Resident
Rank 2015
Rank 2014
FY 2012 Expenditures
FY 2013 Expenditures
Percent Change 12-13
FY 2014 Expenditures
Percent Change 13-14
FY 2015 Expenditures
Percent Change 14-15
Alabama $1,105.17 41 40 $4,894,500,814 $5,032,612,086 2.8 $5,168,579,944 2.7 $5,352,583,936 3.6 Alaska $2,124.02 9 14 $1,351,112,877 $1,345,045,986 -0.4 $1,302,979,034 -3.1 $1,564,778,066 20.1 Arizona $1,565.18 25 27 $8,228,228,293 $8,658,472,418 5.2 $9,163,994,502 5.8 $10,518,023,254 14.8 Arkansas $1,866.32 16 18 $4,190,511,392 $4,203,226,120 0.3 $4,867,029,421 15.8 $5,537,200,521 13.8 California $2,061.26 10 16 $52,656,477,798 $59,914,428,634 13.8 $64,285,568,899 7.3 $79,731,144,725 24.0 Colorado $1,368.16 33 38 $4,672,048,439 $5,100,413,568 9.2 $5,955,208,766 16.8 $7,319,166,775 22.9 Connecticut $2,158.20 7 7 $6,665,838,357 $6,766,535,062 1.5 $7,296,153,783 7.8 $7,751,987,299 6.2 Delaware $1,974.42 14 8 $1,506,278,561 $1,563,725,796 3.8 $1,718,635,936 9.9 $1,845,979,080 7.4 Dist. of Columbia $3,782.79 1 1 $2,113,235,604 $2,283,153,373 8.0 $2,378,006,520 4.2 $2,492,875,863 4.8 Florida $1,044.58 45 42 $18,021,631,444 $18,616,423,410 3.3 $20,473,727,346 10.0 $20,775,344,737 1.5 Georgia $956.10 49 47 $8,735,471,630 $8,970,593,295 2.7 $9,395,281,716 4.7 $9,644,444,017 2.7 Hawaii $1,420.58 29 25 $1,506,618,138 $1,645,545,430 9.2 $1,951,331,283 18.6 $2,012,035,896 3.1 Idaho $1,103.82 42 43 $1,437,675,796 $1,688,758,313 17.5 $1,685,092,876 -0.2 $1,803,119,059 7.0 Illinois $1,348.79 34 32 $13,072,865,775 $15,749,406,206 20.5 $16,640,782,945 5.7 $17,355,620,134 4.3 Indiana $1,404.93 30 26 $7,737,604,465 $7,951,234,790 2.8 $9,103,489,415 14.5 $9,265,812,216 1.8 Iowa $1,459.48 28 31 $3,478,924,376 $3,721,015,408 7.0 $4,053,523,269 8.9 $4,536,093,796 11.9 Kansas $1,049.89 44 45 $2,678,534,991 $2,559,305,369 -4.5 $2,819,994,777 10.2 $3,044,002,639 7.9 Kentucky $2,137.75 8 13 $5,715,038,994 $5,845,811,687 2.3 $7,833,548,163 34.0 $9,433,993,329 20.4 Louisiana $1,675.32 20 21 $7,629,641,274 $7,075,779,933 -7.3 $7,168,123,756 1.3 $7,786,691,193 8.6 Maine $1,951.21 15 9 $2,340,722,056 $2,889,071,389 23.4 $2,460,834,485 -14.8 $2,596,509,373 5.5 Maryland $1,606.11 23 20 $7,579,399,491 $7,801,194,610 2.9 $9,352,302,117 19.9 $9,584,147,753 2.5 Massachusetts $2,388.06 5 5 $12,657,854,983 $12,815,751,537 1.2 $14,593,485,515 13.9 $16,119,196,444 10.5 Michigan $1,618.43 21 28 $12,170,083,640 $12,352,386,939 1.5 $13,456,874,346 8.9 $16,047,998,915 19.3 Minnesota $2,008.61 12 10 $8,920,910,028 $8,919,853,473 0.0 $10,020,786,305 12.3 $10,953,158,789 9.3 Mississippi $1,739.32 19 19 $4,465,935,437 $4,736,403,877 6.1 $4,884,142,318 3.1 $5,204,753,503 6.6 Missouri $1,593.31 24 22 $8,515,587,137 $8,837,905,408 3.8 $8,972,646,288 1.5 $9,656,952,532 7.6 Montana $1,125.42 40 39 $963,923,541 $1,007,885,833 4.6 $1,088,467,612 8.0 $1,151,150,342 5.8 Nebraska $1,001.66 46 44 $1,731,564,838 $1,843,597,981 6.5 $1,830,410,451 -0.7 $1,884,258,567 2.9 Nevada $1,081.35 43 50 $1,730,802,213 $1,798,734,564 3.9 $2,327,940,250 29.4 $3,063,479,987 31.6 New Hampshire $1,297.78 35 41 $1,221,515,448 $1,204,274,022 -1.4 $1,386,185,581 15.1 $1,724,417,722 24.4 New Jersey $1,614.02 22 24 $10,595,226,441 $10,692,984,472 0.9 $12,604,053,353 17.9 $14,405,135,592 14.3 New Mexico $2,377.63 6 6 $3,340,811,555 $3,274,464,853 -2.0 $4,274,784,112 30.5 $4,952,666,769 15.9 New York $3,023.63 2 2 $54,018,106,254 $54,040,149,631 0.0 $55,117,522,487 2.0 $59,621,474,558 8.2 North Carolina $1,281.85 38 36 $12,513,041,952 $11,989,979,443 -4.2 $12,348,890,055 3.0 $12,734,419,848 3.1 North Dakota $1,494.31 27 30 $746,706,868 $789,862,597 5.8 $959,975,230 21.5 $1,105,648,269 15.2 Ohio $1,790.22 18 17 $16,522,203,567 $16,598,321,129 0.5 $19,393,389,821 16.8 $20,756,491,730 7.0 Oklahoma $1,287.47 37 34 $4,654,117,095 $4,808,515,126 3.3 $4,948,306,400 2.9 $4,992,161,302 0.9 Oregon $2,057.31 11 15 $4,630,832,956 $5,141,662,499 11.0 $6,737,695,155 31.0 $8,164,164,213 21.2 Pennsylvania $1,829.60 17 11 $20,286,481,399 $21,181,113,829 4.4 $23,613,413,952 11.5 $23,401,623,491 -0.9 Rhode Island $2,461.19 4 4 $1,851,740,520 $1,945,057,475 5.0 $2,458,071,339 26.4 $2,595,271,558 5.6 South Carolina $1,253.17 39 37 $4,792,403,503 $4,949,056,058 3.3 $5,496,508,714 11.1 $6,050,859,531 10.1 South Dakota $970.65 47 49 $749,264,081 $766,441,148 2.3 $756,994,934 -1.2 $827,540,746 9.3 Tennessee $1,386.19 32 23 $8,929,438,248 $8,619,235,404 -3.5 $9,299,619,031 7.9 $9,072,117,646 -2.4 Texas $1,294.70 36 35 $29,703,172,868 $30,505,857,320 2.7 $33,232,161,492 8.9 $34,885,244,075 5.0 Utah $771.22 51 51 $1,892,256,465 $2,143,820,954 13.3 $2,057,159,773 -4.0 $2,268,816,289 10.3 Vermont $2,603.44 3 3 $1,388,919,441 $1,445,881,374 4.1 $1,535,217,667 6.2 $1,632,312,261 6.3 Virginia $965.48 48 48 $6,886,178,858 $7,314,244,050 6.2 $7,731,122,892 5.7 $8,030,220,829 3.9 Washington $1,532.50 26 29 $7,569,696,927 $8,020,152,575 6.0 $9,307,367,915 16.0 $10,810,563,949 16.2 West Virginia $1,989.18 13 12 $2,793,155,591 $3,019,007,710 8.1 $3,358,867,161 11.3 $3,677,031,945 9.5 Wisconsin $1,389.22 31 33 $6,825,756,806 $7,158,368,459 4.9 $7,392,029,747 3.3 $7,999,631,053 8.2 Wyoming $937.34 50 46 $545,524,234 $560,188,308 2.7 $562,372,512 0.4 $547,072,421 -2.7 United States $1,645.79 n/a n/a $419,825,573,459 $437,862,910,931 4.3 $476,820,651,361 8.9 $524,287,388,537 10.0
Note: Data are presented based on state reporting. No further explanation of trends is available for the purposes of this report.

Balancing Incentive Program Table AQ
State FY 2012
Expenditures FY 2013
Expenditures
Percent Change 12-13
FY 2014 Expenditures
Percent Change 13-14
FY 2015 Expenditures
Percent Change 14-15
Arkansas $0 $8,640,769 100.0 $15,847,504 83.4 $16,101,958 1.6 Connecticut $0 $20,347,618 100.0 $28,400,361 39.6 $33,786,564 19.0 Georgia $5,866,786 $23,719,424 304.3 $22,978,550 -3.1 $24,020,166 4.5 Illinois $0 $6,803,650 100.0 $39,546,645 481.3 $41,966,424 6.1 Indiana $0 $19,063,814 100.0 $21,616,531 13.4 $5,632,599 -73.9 Iowa $4,358,090 $18,663,577 328.3 $20,276,262 8.6 $21,360,279 5.3 Kentucky $0 $0 0.0 $11,317,319 100.0 $15,974,670 41.2 Louisiana $0 $16,674,078 100.0 $10,740,335 -35.6 $4,260,782 -60.3 Maine $0 $2,398,946 100.0 $10,380,637 332.7 $10,881,158 4.8 Maryland $14,187,982 $27,247,193 92.0 $33,387,028 22.5 $31,858,312 -4.6 Massachusetts $0 $0 0.0 $38,505,417 100.0 $93,735,899 143.4 Mississippi $5,328,857 $19,803,769 271.6 $20,501,365 3.5 $21,728,758 6.0 Missouri $6,230,259 $31,702,997 408.9 $34,274,564 8.1 $38,344,419 11.9 Nevada $0 $0 0.0 $2,523,988 100.0 $5,146,952 103.9 New Hampshire $3,818,237 $7,593,159 98.9 $7,374,815 -2.9 $9,559,054 29.6 New Jersey $0 $20,279,688 100.0 $39,458,915 94.6 $40,847,152 3.5 New York $0 $116,582,539 100.0 $189,627,131 62.7 $251,365,497 32.6 Ohio $0 $12,487,376 100.0 $79,117,079 533.6 $89,681,577 13.4 Pennsylvania $0 $0 0.0 $20,693,736 100.0 $83,501,519 303.5 Texas $0 $82,774,190 100.0 $101,851,275 23.0 $106,879,038 4.9 Alabama $0 $0 0.0 $0 0.0 $0 0.0 Alaska $0 $0 0.0 $0 0.0 $0 0.0 Arizona $0 $0 0.0 $0 0.0 $0 0.0 California $0 $0 0.0 $0 0.0 $0 0.0 Colorado $0 $0 0.0 $0 0.0 $0 0.0 Delaware $0 $0 0.0 $0 0.0 $0 0.0 Dist. of Columbia $0 $0 0.0 $0 0.0 $0 0.0 Florida $0 $0 0.0 $0 0.0 $0 0.0 Hawaii $0 $0 0.0 $0 0.0 $0 0.0 Idaho $0 $0 0.0 $0 0.0 $0 0.0 Kansas $0 $0 0.0 $0 0.0 $0 0.0 Michigan $0 $0 0.0 $0 0.0 $0 0.0 Minnesota $0 $0 0.0 $0 0.0 $0 0.0 Montana $0 $0 0.0 $0 0.0 $0 0.0 Nebraska $0 $0 0.0 $0 0.0 $0 0.0 New Mexico $0 $0 0.0 $0 0.0 $0 0.0 North Carolina $0 $0 0.0 $0 0.0 $0 0.0 North Dakota $0 $0 0.0 $0 0.0 $0 0.0 Oklahoma $0 $0 0.0 $0 0.0 $0 0.0 Oregon $0 $0 0.0 $0 0.0 $0 0.0 Rhode Island $0 $0 0.0 $0 0.0 $0 0.0 South Carolina $0 $0 0.0 $0 0.0 $0 0.0 South Dakota $0 $0 0.0 $0 0.0 $0 0.0 Tennessee $0 $0 0.0 $0 0.0 $0 0.0 Utah $0 $0 0.0 $0 0.0 $0 0.0 Vermont $0 $0 0.0 $0 0.0 $0 0.0 Virginia $0 $0 0.0 $0 0.0 $0 0.0 Washington $0 $0 0.0 $0 0.0 $0 0.0 West Virginia $0 $0 0.0 $0 0.0 $0 0.0 Wisconsin $0 $0 0.0 $0 0.0 $0 0.0 Wyoming $0 $0 0.0 $0 0.0 $0 0.0 United States $39,790,211 $434,782,787 992.7 $748,419,457 72.1 $946,632,777 26.5
Notes: This table includes only enhanced federal payments to states for HCBS. These enhanced federal payments are in addition to the federal share of expenditures for these services. No state received payments for an entire year in FY 2012. Payments were made for only one or two quarters, based on the date the state applied for the program and the date CMS approved the state’s application. Payments in this table are based on the year federal enhanced payments were made, which can differ from the year the state incurred HCBS expenditures if the state submits prior period adjustments.

Percentage of Long-Term Services and Supports for HCBS Table AR
State Rank 2015
Rank 2014 FY 2012 FY 2013 FY 2014 FY 2015
Oregon 1 1 78.3% 78.2% 79.4% 82.2% New Mexico 2 3 n/a n/a 73.7% 78.7% Minnesota 3 2 72.6% 73.6% 74.8% 76.7% Arizona 4 4 65.4% 68.3% 70.4% 69.8% Vermont 5 6 67.5% 68.3% 68.8% 69.3% Washington 6 7 64.5% 64.6% 65.8% 68.1% Massachusetts 7 9 56.4% 59.1% 64.7% 65.4% Wisconsin 8 8 61.8% 63.4% 65.5% 65.1% Colorado 9 11 57.8% 58.4% 62.9% 65.0% Alaska 10 5 68.5% 69.9% 69.8% 62.8% New York 11 13 50.8% 54.4% 57.4% 58.4% Missouri 12 17 43.5% 54.5% 55.2% 57.9% Texas 13 15 50.1% 54.6% 56.3% 57.9% Rhode Island 14 12 56.9% 57.9% 57.9% 57.3% Montana 15 14 55.3% 55.9% 56.6% 57.2% Maryland 16 16 52.6% 53.4% 55.3% 56.5% Virginia 17 19 51.7% 52.5% 54.5% 55.5% Maine 18 18 54.9% 53.8% 54.9% 54.6% Dist. of Columbia 19 21 58.1% 59.3% 53.3% 54.4% Nevada 20 29 48.8% 48.7% 49.5% 53.6% New Hampshire 21 25 49.8% 52.3% 52.1% 52.0% Arkansas 22 27 44.8% 48.2% 49.9% 52.0% Iowa 23 26 43.1% 48.7% 49.9% 51.9% Utah 24 33 48.3% 49.4% 47.5% 51.3% Idaho 25 20 50.8% 50.1% 53.3% 51.2% Nebraska 26 30 46.4% 45.7% 48.0% 50.8% Connecticut 27 35 43.2% 45.1% 47.1% 50.7% Ohio 28 24 40.0% 43.3% 52.4% 50.5% Kansas 29 23 52.0% 57.5% 52.9% 49.4% Wyoming 30 28 50.3% 49.7% 49.8% 49.1% Tennessee 31 22 48.4% 50.4% 53.1% 48.2% South Carolina 32 38 41.0% 41.6% 42.7% 47.9% South Dakota 33 34 44.9% 45.8% 47.2% 47.9% West Virginia 34 31 47.7% 47.9% 47.7% 47.2% Georgia 35 32 44.6% 45.4% 47.7% 47.2% Pennsylvania 36 36 41.2% 41.8% 43.7% 46.5% Illinois 37 41 41.4% 41.8% 41.7% 45.6% Oklahoma 38 37 44.8% 43.6% 43.5% 45.1% Delaware 39 39 40.9% 39.6% 42.2% 44.9% New Jersey 40 45 27.1% 33.3% 40.4% 44.1% Alabama 41 42 40.9% 42.2% 41.5% 42.1% North Dakota 42 44 37.8% 38.5% 40.5% 42.1% Kentucky 43 43 37.3% 38.2% 40.9% 41.3% Michigan 44 47 35.3% 35.6% 35.0% 40.3% Hawaii 45 40 38.7% 39.6% 41.7% 40.3% Louisiana 46 46 36.7% 39.5% 39.2% 37.7% Indiana 47 49 32.1% 32.1% 31.2% 33.7% Florida 48 48 34.8% 35.7% 33.3% 32.9% Mississippi 49 50 27.4% 25.6% 27.2% 30.6% California n/a 10 61.3% 63.8% 64.4% n/a North Carolina n/a n/a 54.4% n/a n/a n/a United States n/a n/a 49.2% 51.3% 53.1% 54.8%
Notes: Percent HCBS is not calculated for California (2015), New Mexico (2012 - 2013), and North Carolina (2013-2015) because significant data are missing. Data exclude expenditures for managed care programs in the following states (years of missing data in parentheses): California (2012, 2014, 2015); Massachusetts (2014); New Mexico (2012 - 2013); North Carolina (2013 - 2015). Data for several states include expenditures for Medicaid Upper Payment Limit programs or provider taxes. IMD services for people under age 21 or age 65 and older, case management, rehabilitative services, private duty nursing, state plan HCBS, and health homes data do not include services provided through managed care organizations. Data are presented based on state reporting. No further explanation of trends is available for the purposes of this report.

Percentage of Long-Term Services and Supports for HCBS: Services for Older Adults and People with Physical Disabilities
Table AS
State Rank 2015
Rank 2014 FY 2012 FY 2013 FY 2014 FY 2015
Oregon 1 1 60.3% 64.1% 77.7% 81.1% New Mexico 2 3 n/a n/a 64.3% 74.0% Minnesota 3 2 65.4% 66.8% 68.5% 71.7% Washington 4 4 61.8% 62.0% 63.6% 66.5% Massachusetts 5 7 45.8% 48.9% 55.5% 58.0% Texas 6 8 50.1% 54.6% 55.4% 57.4% Colorado 7 10 45.4% 47.3% 53.8% 56.3% New York 8 13 45.2% 47.1% 47.0% 51.0% Wisconsin 9 9 50.2% 52.0% 55.0% 51.0% Dist. of Columbia 10 11 52.9% 57.3% 50.2% 49.5% Alaska 11 5 62.1% 63.1% 62.4% 48.8% Virginia 12 12 43.8% 45.6% 47.8% 46.6% Vermont 13 15 44.7% 44.2% 45.3% 45.8% Arizona 14 14 41.7% 44.4% 46.0% 45.2% Illinois 15 20 33.1% 36.4% 36.4% 43.0% North Carolina 16 17 41.3% 43.4% 42.4% 42.3% Missouri 17 18 37.7% 39.2% 40.3% 42.3% Montana 18 19 36.2% 36.8% 36.8% 38.3% Nevada 19 21 33.6% 35.0% 35.5% 36.1% Connecticut 20 28 25.8% 27.8% 30.2% 35.9% Arkansas 21 25 31.7% 33.0% 32.3% 33.9% Ohio 22 23 32.4% 33.1% 33.1% 33.3% Pennsylvania 23 32 24.7% 25.8% 27.9% 32.2% Michigan 24 40 23.3% 24.0% 23.2% 31.3% Idaho 25 16 43.5% 44.1% 44.7% 31.2% Iowa 26 29 26.5% 30.1% 30.1% 31.1% Maine 27 24 32.2% 33.6% 32.7% 30.5% Delaware 28 34 25.3% 24.4% 27.2% 29.9% South Carolina 29 33 26.2% 27.7% 27.5% 29.5% Tennessee 30 22 31.3% 32.9% 34.0% 29.4% Mississippi 31 38 22.2% 23.1% 24.9% 28.8% Georgia 32 35 29.0% 25.3% 27.2% 28.7% West Virginia 33 30 31.3% 30.1% 28.9% 28.4% Oklahoma 34 31 30.8% 27.5% 28.3% 28.4% Louisiana 35 27 29.9% 30.0% 30.5% 27.4% Maryland 36 36 23.2% 24.6% 25.5% 26.8% Nebraska 37 37 23.5% 24.1% 25.0% 26.7% Kansas 38 26 31.4% 39.2% 31.4% 25.4% Hawaii 39 39 21.8% 21.9% 24.5% 23.9% Wyoming 40 44 20.0% 19.9% 21.4% 23.4% Utah 41 41 21.8% 23.0% 22.6% 23.2% Rhode Island 42 42 18.8% 21.6% 22.0% 23.0% Florida 43 43 23.0% 24.0% 21.4% 21.5% New Jersey 44 47 15.7% 16.6% 15.9% 20.0% Indiana 45 45 18.9% 18.7% 18.2% 19.8% South Dakota 46 46 16.3% 16.7% 17.6% 18.7% North Dakota 47 49 14.0% 14.8% 14.6% 15.8% New Hampshire 48 48 18.8% 19.0% 15.8% 15.4% Alabama 49 50 15.2% 15.2% 13.6% 14.1% Kentucky 50 51 14.8% 12.9% 12.7% 12.5% California n/a 6 57.0% 56.9% 57.3% n/a United States n/a n/a 38.8% 40.2% 41.1% 43.8%
Notes: Percent HCBS is not calculated for California (2015) and New Mexico (2012 - 2013) because significant data are missing. Data exclude expenditures for managed care programs in the following states (years of missing data in parentheses): California (2012, 2014, 2015); Massachusetts (2014); New Mexico (2012 - 2013). Wisconsin combined its Family Care section 1915(c) waivers in 2015: one waiver targeted people with developmental disabilities and the other targeted older adults and people with physical disabilities. Expenditures by target population are estimated: the percentage of total Family Care spending for each population was assumed to be the 2012 - 2014 average percentage. Data for private duty nursing do not include services provided through managed care organizations. Data for several states include expenditures for Medicaid Upper Payment Limit programs or provider taxes. Data are presented based on state reporting. No further explanation of trends is available for the purposes of this report.

Percentage of Long-Term Services and Supports for HCBS: Services for People with Developmental Disabilities
Table AT
State Rank 2015
Rank 2014 FY 2012 FY 2013 FY 2014 FY 2015
Michigan 1 1 100.0% 100.0% 100.0% 100.0% Oregon 2 2 100.0% 100.0% 100.0% 100.0% Alabama 3 4 96.4% 99.4% 99.5% 99.4% Vermont 4 5 99.2% 99.2% 99.2% 99.2% Alaska 5 8 98.1% 97.9% 97.8% 98.4% Maryland 6 7 100.0% 100.0% 98.7% 97.7% Arizona 7 9 96.2% 96.4% 96.3% 96.6% Rhode Island 8 10 95.7% 95.5% 96.0% 96.6% New Hampshire 9 3 98.3% 99.0% 99.7% 96.1% New Mexico 10 13 91.8% 91.9% 92.1% 92.4% Hawaii 11 12 92.1% 92.8% 92.3% 92.1% Georgia 12 11 85.1% 89.6% 93.9% 91.7% Colorado 13 15 89.6% 87.9% 89.2% 91.2% Montana 14 14 88.6% 90.1% 90.0% 89.9% Wisconsin 15 18 80.2% 83.6% 84.7% 88.5% Minnesota 16 16 86.0% 86.2% 86.5% 87.4% Missouri 17 17 59.5% 84.2% 85.5% 87.3% Nevada 18 23 80.0% 79.2% 81.4% 84.3% Washington 19 21 84.0% 83.3% 83.0% 84.2% West Virginia 20 20 82.8% 83.2% 84.2% 84.2% Wyoming 21 19 82.6% 83.2% 84.3% 81.7% California 22 24 72.3% 78.3% 81.2% 81.7% Kansas 23 22 83.8% 84.4% 82.4% 81.6% Maine 24 25 80.8% 80.2% 81.0% 81.2% Kentucky 25 26 71.6% 72.4% 79.7% 81.1% Nebraska 26 30 79.0% 72.9% 76.8% 80.9% Idaho 27 36 73.7% 62.1% 71.7% 80.4% Delaware 28 28 69.8% 75.9% 77.9% 80.0% South Dakota 29 29 77.6% 77.9% 77.8% 79.5% Pennsylvania 30 27 76.6% 76.7% 78.2% 78.4% Connecticut 31 33 73.4% 73.7% 75.6% 77.0% Oklahoma 32 31 71.1% 71.9% 76.3% 76.6% Tennessee 33 32 72.8% 72.3% 76.3% 75.9% Virginia 34 39 65.4% 65.5% 68.3% 75.0% Utah 35 35 72.9% 72.7% 73.1% 74.4% Massachusetts 36 6 84.1% 99.4% 98.8% 74.0% New York 37 34 62.0% 71.4% 75.1% 73.4% Florida 38 37 71.5% 70.9% 71.3% 72.8% South Carolina 39 38 65.3% 67.9% 68.8% 70.4% Indiana 40 40 62.6% 65.4% 67.0% 70.3% Ohio 41 41 62.1% 64.4% 65.6% 67.7% Dist. of Columbia 42 43 68.0% 63.7% 62.2% 66.6% New Jersey 43 45 51.2% 50.4% 55.4% 65.5% North Dakota 44 42 58.6% 59.8% 63.5% 64.9% Iowa 45 44 55.8% 56.1% 60.1% 62.2% Louisiana 46 46 48.2% 52.4% 54.9% 54.7% Arkansas 47 47 50.4% 52.1% 51.3% 53.1% Illinois 48 49 46.0% 43.7% 48.2% 53.0% Texas 49 48 50.0% 50.2% 50.3% 51.4% Mississippi 50 50 14.0% 16.5% 20.1% 23.9% North Carolina n/a n/a 56.9% n/a n/a n/a United States n/a n/a 69.0% 72.7% 75.0% 75.7%
Notes: Percent HCBS is not calculated for North Carolina (2013 - 2015) because significant data from a managed care program are missing. Wisconsin combined its Family Care section 1915(c) waivers in 2015: one waiver targeted people with developmental disabilities and the other targeted older adults and people with physical disabilities. Expenditures by target population are estimated: the percentage of total Family Care spending for each population was assumed to be the 2012 - 2014 average percentage. Data for several states include expenditures for Medicaid Upper Payment Limit programs or provider taxes. Data are presented based on state reporting. No further explanation of trends is available for the purposes of this report.

Percentage of Long-Term Services and Supports for HCBS: Behavioral Health Services
Table AU
State Rank 2015
Rank 2014 FY 2012 FY 2013 FY 2014 FY 2015
Hawaii 1 1 100.0% 100.0% 100.0% 100.0% Vermont 2 2 97.2% 89.6% 100.0% 97.8% Rhode Island 3 3 96.7% 96.8% 97.3% 97.1% Georgia 4 4 67.0% 85.2% 92.3% 89.6% Ohio 5 5 0.0% 23.8% 87.1% 87.9% Colorado 6 6 87.5% 82.4% 86.5% 82.8% Arkansas 7 8 66.6% 71.0% 75.7% 80.5% Oregon 8 7 74.9% 61.9% 81.6% 80.2% Iowa 9 17 56.2% 84.0% 55.8% 76.7% Massachusetts 10 12 60.5% 76.2% 67.3% 72.0% Maryland 11 9 67.9% 67.5% 72.2% 71.8% Alabama 12 10 71.5% 71.1% 69.9% 70.7% South Dakota 13 13 69.9% 65.8% 64.5% 70.0% Wisconsin 14 15 70.6% 64.3% 62.5% 68.8% Delaware 15 11 65.3% 64.6% 68.5% 68.6% South Carolina 16 28 21.9% 20.4% 26.1% 63.5% Utah 17 26 41.4% 54.3% 28.7% 63.0% Nevada 18 23 36.8% 35.2% 36.8% 58.8% Missouri 19 18 4.4% 53.7% 53.9% 58.8% Montana 20 16 63.1% 59.0% 57.0% 55.0% Illinois 21 19 58.6% 54.8% 52.9% 50.2% New Hampshire 22 14 67.4% 72.9% 63.7% 49.8% Kansas 23 38 10.8% 8.1% 1.3% 49.1% West Virginia 24 22 43.4% 42.1% 43.3% 46.6% Mississippi 25 20 60.1% 46.8% 44.8% 45.0% North Dakota 26 21 49.4% 49.3% 44.6% 42.1% Arizona 27 29 19.1% 16.8% 19.5% 23.1% Indiana 28 30 10.9% 13.8% 15.4% 17.8% Texas 29 27 27.5% 28.0% 28.4% 17.4% Dist. of Columbia 30 25 61.6% 56.0% 29.3% 15.9% Maine 31 32 10.6% 11.3% 12.1% 15.8% New York 32 33 6.3% 6.8% 11.3% 15.5% Oklahoma 33 48 0.0% 0.0% 0.0% 8.6% North Carolina 34 24 73.4% 60.5% 35.4% 5.9% Connecticut 35 37 1.1% 2.0% 2.9% 4.4% Wyoming 36 34 9.5% 4.5% 3.7% 4.3% Michigan 37 36 3.8% 4.8% 3.6% 4.1% New Jersey 38 35 2.6% 3.5% 3.7% 3.7% California 39 31 5.4% 5.0% 14.0% 3.2% Kentucky 40 43 0.0% 0.0% 0.0% 1.6% Louisiana 41 40 1.0% 0.6% 1.0% 0.8% Florida 42 42 0.0% 0.0% 0.2% 0.7% Pennsylvania 43 41 0.5% 0.5% 0.5% 0.5% New Mexico 44 39 0.9% 1.4% 1.0% 0.4% Alaska 45 44 0.0% 0.0% 0.0% 0.0% Idaho 46 45 0.0% 0.0% 0.0% 0.0% Minnesota 47 46 0.0% 0.1% 0.0% 0.0% Nebraska 48 47 0.0% 0.0% 0.0% 0.0% Tennessee 49 49 0.0% 0.0% 0.0% 0.0% Virginia 50 50 0.0% 0.0% 0.0% 0.0% Washington 51 51 0.0% 0.0% 0.0% 0.0% United States n/a n/a 32.6% 36.4% 40.0% 42.2%
Notes: Data for IMD services for people under age 21 or age 65 and older, rehabilitative services, state plan HCBS, and health homes do not include expenditures provided through managed care organizations. Data for several states include expenditures for Medicaid Upper Payment Limit programs or provider taxes. Data are presented based on state reporting. No further explanation of trends is available for the purposes of this report.

5
10
15
20
25
30
35
40
45
50
Inpatient Hospital Table AV
State
FY 2015 Expenditures Per Resident
Rank 2015
Rank 2014
FY 2012 Expenditures
FY 2013 Expenditures
Percent Change 12-13
FY 2014 Expenditures
Percent Change 13-14
FY 2015 Expenditures
Percent Change 14-15
Dist. of Columbia $420.01 1 2 $342,867,202 $277,098,241 -19.2 $256,380,640 -7.5 $276,787,139 8.0 Mississippi $412.87 2 1 $1,091,787,057 $1,206,129,072 10.5 $1,187,038,728 -1.6 $1,235,458,068 4.1 Oklahoma $338.62 3 4 $1,278,095,761 $1,220,652,987 -4.5 $1,374,008,871 12.6 $1,313,013,953 -4.4 California $336.39 4 8 $8,960,670,444 $11,696,347,178 30.5 $9,808,036,683 -16.1 $13,011,952,922 32.7 Missouri $335.02 6 $1,782,503,253 $1,927,820,701 8.2 $1,826,749,929 -5.2 $2,030,561,015 11.2 Illinois $302.58 6 3 $3,818,661,543 $5,084,252,059 33.1 $4,808,579,216 -5.4 $3,893,426,672 -19.0 North Carolina $296.75 7 7 $3,253,834,101 $2,845,906,319 -12.5 $2,701,127,853 -5.1 $2,947,983,318 9.1 Connecticut $293.29 8 5 $850,764,245 $956,783,580 12.5 $1,121,972,963 17.3 $1,053,466,201 -6.1 Colorado $276.36 9 15 $992,634,802 $1,058,791,180 6.7 $1,138,940,272 7.6 $1,478,405,509 29.8 Maine $268.86 11 $284,951,390 $341,629,381 19.9 $307,705,679 -9.9 $357,779,902 16.3 Arkansas $262.76 11 9 $711,033,083 $731,913,951 2.9 $740,555,744 1.2 $779,577,914 5.3 Alaska $260.54 12 14 $167,299,656 $173,696,671 3.8 $164,614,416 -5.2 $191,942,778 16.6 New York $245.85 13 10 $6,078,415,711 $5,288,701,137 -13.0 $4,693,385,308 -11.3 $4,847,865,405 3.3 Alabama $243.17 14 13 $945,361,781 $1,030,543,986 9.0 $1,091,203,433 5.9 $1,177,738,037 7.9 West Virginia $228.39 18 $283,769,348 $321,135,581 13.2 $358,100,471 11.5 $422,178,071 17.9 Iowa $219.54 16 21 $557,268,912 $549,443,204 -1.4 $567,125,635 3.2 $682,328,122 20.3 Massachusetts $204.47 17 12 $1,208,780,622 $1,084,606,668 -10.3 $1,516,758,019 39.8 $1,380,167,867 -9.0 Montana $195.22 18 16 $164,482,797 $182,595,903 11.0 $200,908,534 10.0 $199,682,216 -0.6 Rhode Island $180.27 19 20 $184,986,822 $190,995,688 3.2 $195,075,241 2.1 $190,091,405 -2.6 Idaho $173.07 17 $199,200,019 $306,494,921 53.9 $314,544,541 2.6 $282,715,666 -10.1 Texas $159.59 21 23 $5,293,936,405 $4,894,702,110 -7.5 $4,380,917,959 -10.5 $4,300,053,174 -1.8 South Dakota $157.97 22 27 $133,868,567 $130,312,911 -2.7 $128,023,241 -1.8 $134,679,123 5.2 Wyoming $156.68 23 24 $96,127,650 $99,319,785 3.3 $95,891,271 -3.5 $91,442,534 -4.6 Florida $153.97 24 19 $3,697,119,897 $3,833,035,439 3.7 $3,713,348,049 -3.1 $3,062,356,976 -17.5 North Dakota $152.61 25 $100,291,690 $110,437,599 10.1 $114,136,200 3.3 $112,917,359 -1.1 Georgia $126.87 26 30 $1,329,763,006 $1,319,182,873 -0.8 $1,326,599,168 0.6 $1,279,792,631 -3.5 Maryland $126.21 27 28 $741,311,577 $721,860,486 -2.6 $856,934,058 18.7 $753,108,821 -12.1 Nevada $123.83 28 34 $248,320,543 $259,072,383 4.3 $280,448,830 8.3 $350,821,050 25.1 Louisiana $118.13 29 26 $998,894,061 $1,046,452,851 4.8 $715,506,679 -31.6 $549,037,473 -23.3 Oregon $114.28 38 $311,531,829 $293,369,234 -5.8 $341,789,821 16.5 $453,517,989 32.7 New Mexico $112.74 31 31 $300,871,268 $199,753,818 -33.6 $265,014,847 32.7 $234,840,876 -11.4 South Carolina $111.31 32 33 $534,235,719 $555,661,008 4.0 $484,214,668 -12.9 $537,431,470 11.0 Indiana $111.10 33 22 $1,155,414,050 $1,138,213,965 -1.5 $1,164,685,424 2.3 $732,700,095 -37.1 Tennessee $108.05 34 29 $1,229,041,865 $1,007,265,865 -18.0 $927,867,102 -7.9 $707,178,677 -23.8 Michigan $107.25 36 $1,156,546,951 $1,074,132,983 -7.1 $909,840,173 -15.3 $1,063,498,537 16.9 Ohio $100.99 36 32 $1,313,403,895 $1,358,944,735 3.5 $1,391,875,063 2.4 $1,170,876,819 -15.9 Wisconsin $93.99 37 37 $443,090,665 $501,424,954 13.2 $514,360,852 2.6 $541,231,355 5.2 New Jersey $92.98 38 41 $693,519,095 $659,903,374 -4.8 $725,228,925 9.9 $829,806,395 14.4 Utah $87.98 39 43 $481,236,744 $364,905,363 -24.2 $225,780,321 -38.1 $258,828,005 14.6 Minnesota $87.28 40 $475,715,159 $425,214,968 -10.6 $452,751,387 6.5 $475,953,602 5.1 Virginia $81.41 41 39 $723,028,797 $742,189,079 2.7 $697,079,037 -6.1 $677,097,541 -2.9 Washington $77.29 42 35 $807,835,471 $625,299,029 -22.6 $648,605,702 3.7 $545,232,054 -15.9 Arizona $62.84 43 42 $651,470,541 $849,500,045 30.4 $530,103,577 -37.6 $422,272,863 -20.3 Pennsylvania $59.97 44 44 $1,001,844,598 $940,285,371 -6.1 $882,104,937 -6.2 $767,029,872 -13.0 Hawaii $47.69 46 $59,848,555 $42,455,432 -29.1 $75,789,032 78.5 $67,542,896 -10.9 Nebraska $43.40 46 45 $172,449,513 $129,705,203 -24.8 $117,772,687 -9.2 $81,649,107 -30.7 Delaware $43.25 47 50 $43,429,139 $32,547,388 -25.1 $30,306,380 -6.9 $40,437,513 33.4 Kentucky $35.80 48 47 $365,493,073 $191,838,278 -47.5 $214,580,140 11.9 $158,004,158 -26.4 New Hampshire $34.71 49 49 $55,093,182 $59,642,164 8.3 $48,361,232 -18.9 $46,116,670 -4.6 Kansas $32.27 48 $300,527,853 $227,700,640 -24.2 $114,106,799 -49.9 $93,561,323 -18.0 Vermont $9.82 51 51 $4,901,512 $5,660,185 15.5 $5,468,934 -3.4 $6,157,291 12.6 United States $183.00 n/a n/a $58,077,531,419 $60,315,527,926 3.9 $56,752,304,671 -5.9 $58,298,296,429 2.7
Notes: Data for several states include expenditures for Medicaid Upper Payment Limit programs or provider taxes. Data do not include services provided through managed care organizations. Data are presented based on state reporting. No further explanation of trends is available for the purposes of this report.

Inpatient Hospital – Disproportionate Share Hospital Payments Table AW
State
FY 2015 Expenditures Per Resident
Rank 2015
Rank 2014
FY 2012 Expenditures
FY 2013 Expenditures
Percent Change 12-13
FY 2014 Expenditures
Percent Change 13-14
FY 2015 Expenditures
Percent Change 14-15
Louisiana $217.10 1 1 $951,320,977 $799,014,626 -16.0 $978,210,517 22.4 $1,009,067,363 3.2 New York $143.03 2 2 $2,684,738,690 $2,766,915,423 3.1 $2,820,956,293 2.0 $2,820,339,071 0.0 Rhode Island $133.29 3 3 $127,714,099 $129,846,057 1.7 $138,322,435 6.5 $140,548,917 1.6 Alabama $99.72 4 5 $455,610,463 $470,923,104 3.4 $481,227,717 2.2 $482,949,270 0.4 South Carolina $90.20 5 6 $404,834,259 $404,997,905 0.0 $446,318,217 10.2 $435,532,911 -2.4 New Jersey $88.48 6 4 $916,872,246 $948,078,958 3.4 $889,361,743 -6.2 $789,697,196 -11.2 Missouri $77.92 7 7 $519,482,225 $497,596,930 -4.2 $518,318,715 4.2 $472,241,829 -8.9 Mississippi $75.04 8 9 $210,532,157 $217,999,554 3.5 $222,637,569 2.1 $224,546,417 0.9 California $61.35 9 11 $2,248,794,926 $2,300,909,193 2.3 $2,336,159,878 1.5 $2,373,238,549 1.6 Vermont $59.73 10 12 $37,448,781 $37,448,781 0.0 $37,448,781 0.0 $37,448,781 0.0 Texas $54.42 11 13 $1,283,524,261 $1,455,350,779 13.4 $1,440,048,606 -1.1 $1,466,315,805 1.8 New Hampshire $51.42 12 10 $48,735,473 $53,889,190 10.6 $92,198,091 71.1 $68,328,279 -25.9 Georgia $43.13 13 17 $415,994,420 $430,297,499 3.4 $434,724,612 1.0 $435,016,070 0.1 Kentucky $42.42 14 18 $171,255,668 $178,507,204 4.2 $184,006,473 3.1 $187,195,800 1.7 Dist. of Columbia $39.18 15 8 $57,392,232 $50,820,765 -11.5 $49,333,829 -2.9 $25,817,328 -47.7 Indiana $36.86 16 14 $225,781,663 $307,084,230 36.0 $339,906,383 10.7 $243,079,967 -28.5 Colorado $36.73 17 19 $189,455,472 $194,191,855 2.5 $197,297,032 1.6 $196,484,792 -0.4 Pennsylvania $36.67 18 16 $661,404,037 $557,117,335 -15.8 $654,498,134 17.5 $469,028,225 -28.3 Washington $32.58 19 20 $244,071,106 $230,367,521 -5.6 $231,580,860 0.5 $229,802,417 -0.8 North Carolina $31.43 20 21 $310,064,539 $313,110,021 1.0 $314,472,441 0.4 $312,258,326 -0.7 West Virginia $29.06 21 22 $56,579,382 $56,546,478 -0.1 $55,524,660 -1.8 $53,721,215 -3.2 Michigan $28.62 22 23 $304,205,212 $297,369,191 -2.2 $286,755,320 -3.6 $283,752,692 -1.0 Illinois $27.92 23 24 $356,940,861 $376,142,596 5.4 $363,467,858 -3.4 $359,240,501 -1.2 Nevada $27.48 24 25 $84,441,948 $81,344,707 -3.7 $78,168,396 -3.9 $77,864,272 -0.4 Nebraska $19.66 25 26 $39,626,737 $43,752,578 10.4 $39,403,948 -9.9 $36,988,367 -6.1 Montana $18.25 26 30 $17,086,812 $17,703,206 3.6 $18,070,718 2.1 $18,663,052 3.3 Kansas $18.24 27 29 $49,733,107 $51,337,265 3.2 $51,785,302 0.9 $52,880,400 2.1 Arizona $17.14 28 28 $126,566,651 $133,341,294 5.4 $131,818,900 -1.1 $115,185,300 -12.6 Virginia $16.58 29 27 $197,105,347 $163,677,107 -17.0 $171,088,863 4.5 $137,921,373 -19.4 Iowa $16.28 30 32 $50,451,929 $54,606,370 8.2 $46,228,144 -15.3 $50,609,920 9.5 Arkansas $15.17 31 31 $60,456,385 $48,760,641 -19.3 $48,767,111 0.0 $45,000,000 -7.7 Idaho $14.92 32 33 $21,459,922 $23,708,980 10.5 $23,931,411 0.9 $24,364,308 1.8 New Mexico $13.46 33 34 $29,862,122 $25,164,146 -15.7 $29,812,189 18.5 $28,027,242 -6.0 Tennessee $12.48 34 n/a $102,252,438 $80,296,386 -21.5 $0 -100.0 $81,704,800 100.0 Alaska $12.16 35 38 $6,091,683 $7,580,735 24.4 $8,777,233 15.8 $8,954,763 2.0 Florida $12.05 36 37 $245,644,494 $241,879,289 -1.5 $240,214,814 -0.7 $239,699,117 -0.2 Oklahoma $10.38 37 40 $44,063,701 $41,216,201 -6.5 $40,701,864 -1.2 $40,244,528 -1.1 Delaware $9.00 38 41 $7,000,000 $5,241,484 -25.1 $8,442,828 61.1 $8,413,630 -0.3 Connecticut $8.96 39 35 $300,914,487 $163,734,828 -45.6 $50,042,321 -69.4 $32,173,742 -35.7 Minnesota $8.89 40 43 $43,814,438 $45,981,321 4.9 $43,578,754 -5.2 $48,503,742 11.3 Maryland $8.71 41 44 $35,005,205 $32,635,945 -6.8 $47,227,358 44.7 $51,995,264 10.1 Utah $8.51 42 39 $30,730,788 $27,052,310 -12.0 $30,812,726 13.9 $25,037,239 -18.7 Wisconsin $5.64 43 42 $92,412 $1,482,494 1504.2 $49,951,559 3269.4 $32,467,447 -35.0 Oregon $5.22 44 36 $49,308,374 $57,229,834 16.1 $51,257,068 -10.4 $20,720,083 -59.6 North Dakota $2.17 45 45 $175,046 $524,571 199.7 $866,958 65.3 $1,606,409 85.3 South Dakota $0.98 46 46 $0 $689,852 100.0 $891,105 29.2 $833,084 -6.5 Wyoming $0.83 47 47 $462,055 $442,873 -4.2 $451,075 1.9 $482,748 7.0 Hawaii $0.00 n/a n/a $5,688,596 $19,282,684 239.0 $0 -100.0 $0 0.0 Ohio $0.00 n/a 15 $555,825,441 $577,927,514 4.0 $593,695,230 2.7 $0 -100.0 Maine $0.00 n/a n/a $0 $0 0.0 $0 0.0 $0 0.0 Massachusetts $0.00 n/a n/a $0 $0 0.0 $0 0.0 $0 0.0 United States $44.88 n/a n/a $14,986,613,267 $15,021,119,810 0.2 $15,318,762,039 2.0 $14,295,992,551 -6.7
Note: Data are presented based on state reporting. No further explanation of trends is available for the purposes of this report.

Medicaid Managed Care Premiums Table AX
State
FY 2015 Expenditures Per Resident
Rank 2015
Rank 2014
FY 2012 Expenditures
FY 2013 Expenditures
Percent Change 12-13
FY 2014 Expenditures
Percent Change 13-14
FY 2015 Expenditures
Percent Change 14-15
New Mexico $1,888.09 1 1 $2,279,297,996 $2,402,636,040 5.4 $3,265,326,079 35.9 $3,932,944,554 20.4 Delaware $1,573.91 2 2 $902,619,630 $1,130,089,254 25.2 $1,203,780,416 6.5 $1,471,522,649 22.2 Kentucky $1,444.75 3 8 $2,568,051,841 $3,003,462,497 17.0 $4,753,430,733 58.3 $6,375,748,193 34.1 New York $1,422.57 4 4 $16,289,779,945 $19,085,419,229 17.2 $22,925,770,152 20.1 $28,050,903,716 22.4 Rhode Island $1,337.36 5 6 $532,701,230 $582,260,705 9.3 $1,179,887,941 102.6 $1,410,223,139 19.5 Dist. of Columbia $1,326.75 6 3 $597,848,106 $700,830,874 17.2 $769,263,795 9.8 $874,332,506 13.7 Arizona $1,290.57 7 7 $6,395,383,976 $6,499,376,926 1.6 $7,262,812,959 11.7 $8,672,597,245 19.4 Oregon $1,185.20 8 11 $2,103,847,948 $2,378,028,425 13.0 $3,671,714,421 54.4 $4,703,330,178 28.1 Hawaii $1,182.72 9 5 $1,174,203,025 $1,320,059,471 12.4 $1,579,546,331 19.7 $1,675,150,399 6.1 Michigan $962.38 10 16 $6,247,800,797 $6,071,334,737 -2.8 $7,288,351,961 20.0 $9,542,737,004 30.9 Minnesota $960.48 11 12 $3,649,184,132 $3,816,774,306 4.6 $4,519,064,328 18.4 $5,237,621,654 15.9 Ohio $928.66 12 13 $6,455,780,409 $5,994,989,212 -7.1 $9,053,754,745 51.0 $10,767,313,928 18.9 Pennsylvania $928.28 13 10 $8,958,475,572 $10,053,033,044 12.2 $11,966,555,552 19.0 $11,873,193,124 -0.8 California $925.06 14 20 $13,192,139,281 $15,228,562,629 15.4 $22,102,323,767 45.1 $35,782,202,243 61.9 Tennessee $924.98 15 9 $5,575,123,135 $5,503,755,525 -1.3 $6,093,369,274 10.7 $6,053,698,328 -0.7 Kansas $904.54 16 15 $650,073,179 $1,251,661,532 92.5 $2,193,361,922 75.2 $2,622,600,552 19.6 Massachusetts $847.96 17 14 $3,642,007,370 $3,616,559,956 -0.7 $5,238,178,771 44.8 $5,723,649,323 9.3 New Jersey $832.37 18 19 $3,550,614,462 $3,575,815,644 0.7 $5,267,579,921 47.3 $7,428,939,449 41.0 Washington $717.98 19 17 $2,121,768,765 $2,782,104,651 31.1 $5,015,371,067 80.3 $5,064,799,912 1.0 Maryland $669.83 20 18 $2,818,940,305 $2,983,446,819 5.8 $3,864,320,635 29.5 $3,997,094,330 3.4 Louisiana $643.05 21 25 $855,275,488 $1,215,786,917 42.2 $1,507,962,381 24.0 $2,988,801,386 98.2 Florida $622.57 22 24 $3,277,208,723 $3,370,590,046 2.8 $7,451,286,867 121.1 $12,382,184,582 66.2 Wisconsin $606.47 23 21 $2,827,418,073 $3,028,304,077 7.1 $3,146,936,575 3.9 $3,492,275,670 11.0 Texas $584.41 24 22 $9,923,268,884 $12,050,965,266 21.4 $12,962,925,056 7.6 $15,746,828,663 21.5 South Carolina $524.27 25 23 $1,294,366,414 $1,408,593,605 8.8 $2,067,578,421 46.8 $2,531,378,976 22.4 New Hampshire $503.30 26 35 $0 $93,130 100.0 $243,248,551 261092.5 $668,760,581 174.9 Nevada $437.20 27 34 $338,293,680 $353,082,230 4.4 $695,201,802 96.9 $1,238,604,846 78.2 Indiana $408.76 28 30 $1,754,300,103 $1,537,499,767 -12.4 $1,948,544,344 26.7 $2,695,887,047 38.4 Illinois $401.52 29 38 $480,322,560 $1,135,721,847 136.4 $2,073,192,985 82.5 $5,166,603,333 149.2 Mississippi $358.98 30 32 $233,548,768 $607,271,637 160.0 $762,702,887 25.6 $1,074,223,104 40.8 Utah $356.78 31 26 $384,718,848 $860,621,881 123.7 $939,336,074 9.1 $1,049,602,150 11.7 Virginia $345.05 32 31 $1,772,831,657 $2,028,866,120 14.4 $2,370,933,021 16.9 $2,869,931,932 21.0 Nebraska $339.78 33 28 $288,659,966 $440,177,338 52.5 $566,651,894 28.7 $639,173,230 12.8 Georgia $329.06 34 27 $2,587,280,808 $2,637,492,119 1.9 $3,157,975,300 19.7 $3,319,322,288 5.1 West Virginia $324.28 35 29 $340,344,421 $440,140,429 29.3 $550,782,783 25.1 $599,432,404 8.8 North Dakota $310.96 36 41 $357,230 $176,845 -50.5 $84,879,146 47896.4 $230,077,968 171.1 Arkansas $281.00 37 39 $0 $134,431 100.0 $367,107,775 272982.7 $833,709,188 127.1 North Carolina $266.64 38 33 $445,112,695 $1,721,011,739 286.6 $2,493,493,195 44.9 $2,648,874,944 6.2 Iowa $209.73 39 37 $207,714,425 $296,891,153 42.9 $558,993,061 88.3 $651,841,800 16.6 Missouri $188.90 40 36 $1,092,358,444 $1,049,355,154 -3.9 $1,093,471,242 4.2 $1,144,935,161 4.7 Colorado $172.96 41 40 $457,558,259 $488,722,599 6.8 $645,945,658 32.2 $925,294,300 43.2 Idaho $119.76 42 42 $34,414,500 $50,806,856 47.6 $161,068,404 217.0 $195,626,504 21.5 Oklahoma $26.91 43 43 $148,937,892 $186,705,706 25.4 $129,716,182 -30.5 $104,346,673 -19.6 Alabama $16.58 44 44 $13,492,536 $22,606,440 67.5 $89,367,305 295.3 $80,288,794 -10.2 Alaska $0.63 45 46 $210,095 $303,352 44.4 $369,742 21.9 $464,504 25.6 Montana $0.58 46 45 $1,304,285 $1,239,169 -5.0 $7,922,035 539.3 $593,200 -92.5 Wyoming $0.03 47 48 $19,454 $28,065 44.3 $8,478 -69.8 $16,405 93.5 Connecticut $0.02 48 47 $365,093,927 $3,004,562 -99.2 $91,277 -97.0 $66,582 -27.1 Vermont $0.01 49 51 $7,761 -$332,271 -4381.3 -$166,976 -49.7 $7,331 -104.4 Maine $0.00 n/a n/a $0 $0 0.0 $0 0.0 $0 0.0 South Dakota $0.00 n/a n/a $0 $0 0.0 $0 0.0 $0 0.0 United States $704.85 n/a n/a $118,830,061,000 $132,916,061,685 11.9 $175,291,290,235 31.9 $224,539,755,972 28.1
Note: Data are presented based on state reporting. No further explanation of trends is available for the purposes of this report.

5
10
15
20
25
30
35
40
45
50
Drugs Table AY
State
FY 2015 Expenditures Per Resident
Rank 2015
Rank 2014
FY 2012 Expenditures
FY 2013 Expenditures
Percent Change 12-13
FY 2014 Expenditures
Percent Change 13-14
FY 2015 Expenditures
Percent Change 14-15
Connecticut $171.66 1 1 $330,947,390 $305,887,694 -7.6 $466,244,069 52.4 $616,597,923 32.2 Dist. of Columbia $144.95 2 2 $61,811,982 $62,062,953 0.4 $78,576,217 26.6 $95,520,022 21.6 Missouri $119.33 3 4 $628,881,996 $624,377,826 -0.7 $630,555,759 1.0 $723,221,077 14.7 West Virginia $101.87 4 5 $120,723,186 $102,847,073 -14.8 $157,111,719 52.8 $188,317,286 19.9 Oklahoma $94.67 6 $294,565,415 $296,974,414 0.8 $294,748,986 -0.7 $367,093,837 24.5 North Carolina $74.27 6 9 $697,741,264 $654,881,189 -6.1 $634,119,268 -3.2 $737,817,317 16.4 Maine $72.49 7 12 $66,749,445 $56,559,378 -15.3 $74,769,080 32.2 $96,462,951 29.0 Wisconsin $71.76 8 13 $308,232,636 $303,006,730 -1.7 $318,504,716 5.1 $413,204,946 29.7 Tennessee $64.77 9 7 $386,081,714 $289,742,796 -25.0 $485,275,929 67.5 $423,894,045 -12.6 Alabama $60.44 10 $308,059,413 $291,883,097 -5.3 $295,390,792 1.2 $292,721,544 -0.9 Iowa $56.86 11 21 $121,709,118 $107,193,123 -11.9 $123,474,753 15.2 $176,733,973 43.1 Arkansas $54.75 12 11 $153,195,480 $159,244,145 3.9 $175,277,172 10.1 $162,451,047 -7.3 South Dakota $52.70 13 37 $25,453,933 $26,862,846 5.5 $6,995,681 -74.0 $44,928,225 542.2 Montana $51.05 14 20 $34,298,235 $31,390,217 -8.5 $40,783,748 29.9 $52,220,277 28.0 Massachusetts $50.30 15 $112,080,243 $240,897,666 114.9 $344,587,621 43.0 $339,537,573 -1.5 Alaska $48.53 16 19 $36,534,186 $25,105,970 -31.3 $32,136,958 28.0 $35,755,836 11.3 Colorado $47.68 17 16 $145,300,053 $165,886,731 14.2 $261,856,659 57.9 $255,081,672 -2.6 Nebraska $44.52 18 28 $86,587,246 $73,420,879 -15.2 $58,523,678 -20.3 $83,754,172 43.1 Nevada $43.92 19 24 $65,471,720 $54,604,329 -16.6 $97,905,333 79.3 $124,424,039 27.1 Idaho $42.52 23 $49,213,181 $58,000,785 17.9 $61,200,140 5.5 $69,450,040 13.5 Maryland $39.80 21 17 $174,421,780 $161,288,764 -7.5 $294,340,751 82.5 $237,491,220 -19.3 Wyoming $39.44 22 27 $17,337,734 $18,562,254 7.1 $18,365,556 -1.1 $23,016,029 25.3 Michigan $39.37 23 29 $277,970,410 $262,712,235 -5.5 $284,350,493 8.2 $390,380,458 37.3 Georgia $37.80 24 30 $264,708,097 $209,746,435 -20.8 $277,583,699 32.3 $381,312,939 37.4 Indiana $37.28 14 $355,606,547 $354,601,027 -0.3 $340,695,514 -3.9 $245,867,340 -27.8 California $35.68 26 26 $1,013,681,753 $744,250,342 -26.6 $1,304,832,786 75.3 $1,380,111,813 5.8 Mississippi $34.68 27 18 $194,291,483 $125,024,319 -35.7 $146,639,066 17.3 $103,777,324 -29.2 North Dakota $31.99 28 25 $22,669,145 $22,776,148 0.5 $25,228,184 10.8 $23,670,449 -6.2 Utah $24.52 29 33 $108,748,344 $46,817,871 -56.9 $53,601,027 14.5 $72,136,179 34.6 Washington $24.37 36 $172,659,753 $42,419,718 -75.4 $64,787,828 52.7 $171,919,586 165.4 Illinois $22.74 31 22 $748,442,185 $348,662,090 -53.4 $489,406,865 40.4 $292,671,860 -40.2 Oregon $20.94 32 34 $65,160,506 $67,379,251 3.4 $67,287,103 -0.1 $83,116,428 23.5 Ohio $10.74 33 40 -$1,407,474 $149,518,727 -10723.2 $58,740,537 -60.7 $124,490,050 111.9 South Carolina $10.06 34 45 $102,420,311 $73,801,875 -27.9 $4,836,527 -93.4 $48,596,745 904.8 Louisiana $9.51 8 $789,552,209 $232,658,741 -70.5 $336,290,792 44.5 $44,211,112 -86.9 Kentucky $8.84 36 38 -$41,293,815 $34,253,842 -183.0 $36,395,333 6.3 $39,028,919 7.2 Texas $8.55 37 35 $299,245,788 $289,213,793 -3.4 $318,335,337 10.1 $230,311,801 -27.7 New Mexico $3.75 38 48 $13,955,359 -$93,478,274 -769.8 -$13,898,056 -85.1 $7,802,848 -156.1 Virginia $3.29 39 39 $73,173,719 $81,132,609 10.9 $42,089,895 -48.1 $27,390,196 -34.9 New Jersey $3.25 42 $17,547,155 $66,785,037 280.6 $19,450,861 -70.9 $29,048,875 49.3 Minnesota $2.94 41 31 $103,650,700 $102,822,184 -0.8 $117,926,270 14.7 $16,019,435 -86.4 Pennsylvania $1.85 42 44 $191,346,615 -$36,821,263 -119.2 $13,660,912 -137.1 $23,622,039 72.9 Rhode Island $1.59 43 41 $567,658 $1,019,685 79.6 $2,736,189 168.3 $1,673,986 -38.8 Arizona $1.28 44 46 $4,794,636 $4,494,089 -6.3 $4,592,628 2.2 $8,584,224 86.9 Hawaii $0.93 43 $1,659,644 -$272,499 -116.4 $2,803,962 -1129.0 $1,318,570 -53.0 Kansas -$0.39 46 47 $71,581,034 -$16,365,048 -122.9 -$1,429,993 -91.3 -$1,128,465 -21.1 Florida -$2.41 47 32 $655,008,185 $567,464,374 -13.4 $418,648,513 -26.2 -$47,882,089 -111.4 New Hampshire -$2.50 48 49 $37,431,256 $33,412,211 -10.7 -$9,804,329 -129.3 -$3,327,593 -66.1 Delaware -$54.99 49 3 $67,765,190 $63,556,811 -6.2 $107,501,632 69.1 -$51,409,357 -147.8 New York -$77.86 50 -$922,251,653 $314,692,337 -134.1 -$492,371,862 -256.5 -$1,535,202,248 211.8 Vermont -$149.03 51 51 -$68,776,661 -$66,903,954 -2.7 -$74,074,384 10.7 -$93,438,283 26.1 United States $23.78 n/a n/a $8,845,305,429 $8,136,055,572 -8.0 $8,897,587,914 9.4 $7,574,370,192 -14.9
Notes: Data do not include services provided through managed care organizations. Data are presented based on state reporting. No further explanation of trends is available for the purposes of this report.

Managed Care Institutional LTSS Expenditures Table AZ
State
FY 2015 Expenditures Per Resident
Rank 2015
Rank 2014
FY 2012 Expenditures
FY 2013 Expenditures
Percent Change 12-13
FY 2014 Expenditures
Percent Change 13-14
FY 2015 Expenditures
Percent Change 14-15
Delaware $291.01 1 1 $116,697,492 $258,963,523 121.9 $261,527,340 1.0 $272,080,224 4.0 Hawaii $203.11 2 2 $280,427,236 $280,427,236 0.0 $261,842,354 -6.6 $287,679,005 9.9 Kansas $184.68 3 3 $0 $217,963,623 100.0 $433,730,981 99.0 $535,461,765 23.5 Tennessee $166.51 4 4 $946,059,079 $902,633,112 -4.6 $881,828,445 -2.3 $1,089,761,293 23.6 Florida $150.23 5 5 $14,330,557 $4,857,005 -66.1 $2,119,420,675 43536.4 $2,987,829,480 41.0 New Mexico $124.70 6 6 $0 $0 0.0 $216,347,798 100.0 $259,745,451 20.1 Ohio $91.45 7 9 $0 $5,182,342 100.0 $377,717,499 7188.5 $1,060,305,729 180.7 Arizona $64.32 8 7 $488,997,567 $430,524,104 -12.0 $413,739,494 -3.9 $432,211,327 4.5 Massachusetts $44.29 9 12 $217,568,728 $266,156,026 22.3 $73,335,737 -72.4 $298,937,277 307.6 Texas $41.24 10 18 $54,903,375 $5,870,122 -89.3 $5,291,332 -9.9 $1,111,078,179 20898.1 Iowa $29.41 11 10 $0 $81,115,331 100.0 $88,981,212 9.7 $91,420,657 2.7 Illinois $27.58 12 8 $0 $83,837,474 100.0 $478,673,945 471.0 $354,862,473 -25.9 Wisconsin $26.82 13 11 $117,193,893 $132,844,159 13.4 $143,614,815 8.1 $154,442,769 7.5 Virginia $20.45 14 17 $0 $0 0.0 $13,425,860 100.0 $170,063,658 1166.7 New York $14.71 15 13 $81,902,764 $119,201,916 45.5 $174,666,085 46.5 $290,107,198 66.1 New Jersey $10.98 16 15 $0 $2,340,857 100.0 $35,635,312 1422.3 $97,990,828 175.0 Minnesota $8.77 17 14 $40,144,878 $32,845,281 -18.2 $43,165,068 31.4 $47,808,983 10.8 Indiana $0.65 18 16 $0 $9,399,794 100.0 $22,104,114 135.2 $4,314,171 -80.5 Alabama $0.00 n/a n/a $0 $0 0.0 $0 0.0 $0 0.0 Alaska $0.00 n/a n/a $0 $0 0.0 $0 0.0 $0 0.0 Arkansas $0.00 n/a n/a $0 $0 0.0 $0 0.0 $0 0.0 California $0.00 n/a n/a $0 $5,736,505 100.0 $0 -100.0 $0 0.0 Colorado $0.00 n/a n/a $0 $0 0.0 $0 0.0 $0 0.0 Connecticut $0.00 n/a n/a $0 $0 0.0 $0 0.0 $0 0.0 Dist. of Columbia $0.00 n/a n/a $0 $0 0.0 $0 0.0 $0 0.0 Georgia $0.00 n/a n/a $0 $0 0.0 $0 0.0 $0 0.0 Idaho $0.00 n/a n/a $0 $0 0.0 $0 0.0 $0 0.0 Kentucky $0.00 n/a n/a $0 $0 0.0 $0 0.0 $0 0.0 Louisiana $0.00 n/a n/a $0 $0 0.0 $0 0.0 $0 0.0 Maine $0.00 n/a n/a $0 $0 0.0 $0 0.0 $0 0.0 Maryland $0.00 n/a n/a $0 $0 0.0 $0 0.0 $0 0.0 Michigan $0.00 n/a n/a $0 $0 0.0 $0 0.0 $0 0.0 Mississippi $0.00 n/a n/a $0 $0 0.0 $0 0.0 $0 0.0 Missouri $0.00 n/a n/a $0 $0 0.0 $0 0.0 $0 0.0 Montana $0.00 n/a n/a $0 $0 0.0 $0 0.0 $0 0.0 Nebraska $0.00 n/a n/a $0 $0 0.0 $0 0.0 $0 0.0 Nevada $0.00 n/a n/a $0 $0 0.0 $0 0.0 $0 0.0 New Hampshire $0.00 n/a n/a $0 $0 0.0 $0 0.0 $0 0.0 North Carolina $0.00 n/a n/a $0 $0 0.0 $0 0.0 $0 0.0 North Dakota $0.00 n/a n/a $0 $0 0.0 $0 0.0 $0 0.0 Oklahoma $0.00 n/a n/a $0 $0 0.0 $0 0.0 $0 0.0 Oregon $0.00 n/a n/a $0 $0 0.0 $0 0.0 $0 0.0 Pennsylvania $0.00 n/a n/a $0 $0 0.0 $0 0.0 $0 0.0 Rhode Island $0.00 n/a n/a $0 $0 0.0 $0 0.0 $0 0.0 South Carolina $0.00 n/a n/a $0 $0 0.0 $0 0.0 $0 0.0 South Dakota $0.00 n/a n/a $0 $0 0.0 $0 0.0 $0 0.0 Utah $0.00 n/a n/a $0 $0 0.0 $0 0.0 $0 0.0 Vermont $0.00 n/a n/a $0 $0 0.0 $0 0.0 $0 0.0 Washington $0.00 n/a n/a $3,583 $0 -100.0 $0 0.0 $0 0.0 West Virginia $0.00 n/a n/a $0 $0 0.0 $0 0.0 $0 0.0 Wyoming $0.00 n/a n/a $0 $0 0.0 $0 0.0 $0 0.0 United States $29.97 n/a n/a $2,358,229,152 $2,839,898,410 20.4 $6,045,048,066 112.9 $9,546,100,467 57.9
Notes: Managed care institutional LTSS includes nursing facilities, ICF/IID, and unspecified institutional LTSS provided through managed care organizations and reported on the CMS-64. Delaware 2012 and Michigan 2014 data were incomplete because the transition to managed care occurred during the year; state estimates were included the following year. Hawaii provided an estimate for nursing facility services for calendar year 2012. This estimate was used for both FY 2012 and FY 2013. Minnesota 2013 data for nursing facility services are estimated expenditures for calendar year 2013. Data for several states include expenditures for Medicaid Upper Payment Limit programs or provider taxes. Data are presented based on state reporting. No further explanation of trends is available for the purposes of this report. Data do not include expenditures for managed care programs in the following states (years of missing data in parentheses): California (2012, 2014, 2015); Massachusetts (2014); New Mexico (2012 - 2013); North Carolina (2013 - 2015). Data do not include IMD services for people under age 21 or age 65 and older provided through managed care organizations.

Managed Care Nursing Facility Expenditures Table BA
State
FY 2015 Expenditures Per Resident
Rank 2015
Rank 2014
FY 2012 Expenditures
FY 2013 Expenditures
Percent Change 12-13
FY 2014 Expenditures
Percent Change 13-14
FY 2015 Expenditures
Percent Change 14-15
Delaware $291.01 1 1 $116,697,492 $258,963,523 121.9 $261,527,340 1.0 $272,080,224 4.0 Hawaii $203.11 2 2 $280,427,236 $280,427,236 0.0 $261,842,354 -6.6 $287,679,005 9.9 Kansas $179.36 3 3 $0 $209,667,119 100.0 $419,949,209 100.3 $520,014,935 23.8 Tennessee $166.51 4 4 $946,059,079 $902,633,112 -4.6 $881,828,445 -2.3 $1,089,761,293 23.6 Florida $150.23 5 5 $14,330,557 $4,857,005 -66.1 $2,119,420,675 43536.4 $2,987,829,480 41.0 New Mexico $124.70 6 6 $0 $0 0.0 $216,347,798 100.0 $259,745,451 20.1 Ohio $91.45 7 8 $0 $0 0.0 $377,717,499 100.0 $1,060,305,729 180.7 Arizona $60.22 8 7 $462,152,807 $403,574,572 -12.7 $383,980,902 -4.9 $404,698,827 5.4 Massachusetts $44.29 9 n/a $217,568,728 $266,156,026 22.3 $0 -100.0 $298,937,277 100.0 Texas $41.24 10 13 $54,903,375 $5,870,122 -89.3 $5,291,332 -9.9 $1,111,078,179 20898.1 Wisconsin $22.86 11 9 $102,798,893 $116,808,435 13.6 $120,321,890 3.0 $131,661,001 9.4 Virginia $20.45 12 12 $0 $0 0.0 $13,425,860 100.0 $170,063,658 1166.7 New York $14.71 13 10 $81,902,764 $119,201,916 45.5 $174,666,085 46.5 $290,107,198 66.1 New Jersey $10.98 14 n/a $0 $0 0.0 $0 0.0 $97,990,828 100.0 Minnesota $8.77 15 11 $40,144,878 $32,845,281 -18.2 $43,165,068 31.4 $47,808,983 10.8 Alabama $0.00 n/a n/a $0 $0 0.0 $0 0.0 $0 0.0 Alaska $0.00 n/a n/a $0 $0 0.0 $0 0.0 $0 0.0 Arkansas $0.00 n/a n/a $0 $0 0.0 $0 0.0 $0 0.0 California $0.00 n/a n/a $0 $5,736,505 100.0 $0 -100.0 $0 0.0 Colorado $0.00 n/a n/a $0 $0 0.0 $0 0.0 $0 0.0 Connecticut $0.00 n/a n/a $0 $0 0.0 $0 0.0 $0 0.0 Dist. of Columbia $0.00 n/a n/a $0 $0 0.0 $0 0.0 $0 0.0 Georgia $0.00 n/a n/a $0 $0 0.0 $0 0.0 $0 0.0 Idaho $0.00 n/a n/a $0 $0 0.0 $0 0.0 $0 0.0 Illinois $0.00 n/a n/a $0 $0 0.0 $0 0.0 $0 0.0 Indiana $0.00 n/a n/a $0 $0 0.0 $0 0.0 $0 0.0 Iowa $0.00 n/a n/a $0 $0 0.0 $0 0.0 $0 0.0 Kentucky $0.00 n/a n/a $0 $0 0.0 $0 0.0 $0 0.0 Louisiana $0.00 n/a n/a $0 $0 0.0 $0 0.0 $0 0.0 Maine $0.00 n/a n/a $0 $0 0.0 $0 0.0 $0 0.0 Maryland $0.00 n/a n/a $0 $0 0.0 $0 0.0 $0 0.0 Michigan $0.00 n/a n/a $0 $0 0.0 $0 0.0 $0 0.0 Mississippi $0.00 n/a n/a $0 $0 0.0 $0 0.0 $0 0.0 Missouri $0.00 n/a n/a $0 $0 0.0 $0 0.0 $0 0.0 Montana $0.00 n/a n/a $0 $0 0.0 $0 0.0 $0 0.0 Nebraska $0.00 n/a n/a $0 $0 0.0 $0 0.0 $0 0.0 Nevada $0.00 n/a n/a $0 $0 0.0 $0 0.0 $0 0.0 New Hampshire $0.00 n/a n/a $0 $0 0.0 $0 0.0 $0 0.0 North Carolina $0.00 n/a n/a $0 $0 0.0 $0 0.0 $0 0.0 North Dakota $0.00 n/a n/a $0 $0 0.0 $0 0.0 $0 0.0 Oklahoma $0.00 n/a n/a $0 $0 0.0 $0 0.0 $0 0.0 Oregon $0.00 n/a n/a $0 $0 0.0 $0 0.0 $0 0.0 Pennsylvania $0.00 n/a n/a $0 $0 0.0 $0 0.0 $0 0.0 Rhode Island $0.00 n/a n/a $0 $0 0.0 $0 0.0 $0 0.0 South Carolina $0.00 n/a n/a $0 $0 0.0 $0 0.0 $0 0.0 South Dakota $0.00 n/a n/a $0 $0 0.0 $0 0.0 $0 0.0 Utah $0.00 n/a n/a $0 $0 0.0 $0 0.0 $0 0.0 Vermont $0.00 n/a n/a $0 $0 0.0 $0 0.0 $0 0.0 Washington $0.00 n/a n/a $3,583 $0 -100.0 $0 0.0 $0 0.0 West Virginia $0.00 n/a n/a $0 $0 0.0 $0 0.0 $0 0.0 Wyoming $0.00 n/a n/a $0 $0 0.0 $0 0.0 $0 0.0 United States $28.35 n/a n/a $2,316,989,392 $2,606,740,852 12.5 $5,279,484,457 102.5 $9,029,762,068 71.0
Notes: Delaware 2012 data were incomplete because the transition to managed care occurred during that year; state estimates were included starting in 2013. Hawaii provided an estimate for calendar year 2012. This estimate was used for both FY 2012 and FY 2013. Minnesota 2013 data are estimated expenditures for calendar year 2013. Data for several states include expenditures for Medicaid Upper Payment Limit programs or provider taxes. Data do not include expenditures for managed care programs in the following states (years of missing data in parentheses): California (2012, 2014, 2015); Massachusetts (2014); New Mexico (2012 - 2013). Data are presented based on state reporting. No further explanation of trends is available for the purposes of this report.

Managed Care ICF/IID Expenditures Table BB
State
FY 2015 Expenditures Per Resident
Rank 2015
Rank 2014
FY 2012 Expenditures
FY 2013 Expenditures
Percent Change 12-13
FY 2014 Expenditures
Percent Change 13-14
FY 2015 Expenditures
Percent Change 14-15
Kansas $5.33 1 1 $0 $8,296,504 100.0 $13,781,772 66.1 $15,446,830 12.1 Arizona $4.09 2 2 $26,844,760 $26,949,532 0.4 $29,758,592 10.4 $27,512,500 -7.5 Wisconsin $3.96 3 3 $14,395,000 $16,035,724 11.4 $23,292,925 45.3 $22,781,768 -2.2 Alabama $0.00 n/a n/a $0 $0 0.0 $0 0.0 $0 0.0 Alaska $0.00 n/a n/a $0 $0 0.0 $0 0.0 $0 0.0 Arkansas $0.00 n/a n/a $0 $0 0.0 $0 0.0 $0 0.0 California $0.00 n/a n/a $0 $0 0.0 $0 0.0 $0 0.0 Colorado $0.00 n/a n/a $0 $0 0.0 $0 0.0 $0 0.0 Connecticut $0.00 n/a n/a $0 $0 0.0 $0 0.0 $0 0.0 Delaware $0.00 n/a n/a $0 $0 0.0 $0 0.0 $0 0.0 Dist. of Columbia $0.00 n/a n/a $0 $0 0.0 $0 0.0 $0 0.0 Florida $0.00 n/a n/a $0 $0 0.0 $0 0.0 $0 0.0 Georgia $0.00 n/a n/a $0 $0 0.0 $0 0.0 $0 0.0 Hawaii $0.00 n/a n/a $0 $0 0.0 $0 0.0 $0 0.0 Idaho $0.00 n/a n/a $0 $0 0.0 $0 0.0 $0 0.0 Illinois $0.00 n/a n/a $0 $0 0.0 $0 0.0 $0 0.0 Indiana $0.00 n/a n/a $0 $0 0.0 $0 0.0 $0 0.0 Iowa $0.00 n/a n/a $0 $0 0.0 $0 0.0 $0 0.0 Kentucky $0.00 n/a n/a $0 $0 0.0 $0 0.0 $0 0.0 Louisiana $0.00 n/a n/a $0 $0 0.0 $0 0.0 $0 0.0 Maine $0.00 n/a n/a $0 $0 0.0 $0 0.0 $0 0.0 Maryland $0.00 n/a n/a $0 $0 0.0 $0 0.0 $0 0.0 Massachusetts $0.00 n/a n/a $0 $0 0.0 $0 0.0 $0 0.0 Michigan $0.00 n/a n/a $0 $0 0.0 $0 0.0 $0 0.0 Minnesota $0.00 n/a n/a $0 $0 0.0 $0 0.0 $0 0.0 Mississippi $0.00 n/a n/a $0 $0 0.0 $0 0.0 $0 0.0 Missouri $0.00 n/a n/a $0 $0 0.0 $0 0.0 $0 0.0 Montana $0.00 n/a n/a $0 $0 0.0 $0 0.0 $0 0.0 Nebraska $0.00 n/a n/a $0 $0 0.0 $0 0.0 $0 0.0 Nevada $0.00 n/a n/a $0 $0 0.0 $0 0.0 $0 0.0 New Hampshire $0.00 n/a n/a $0 $0 0.0 $0 0.0 $0 0.0 New Jersey $0.00 n/a n/a $0 $0 0.0 $0 0.0 $0 0.0 New Mexico $0.00 n/a n/a $0 $0 0.0 $0 0.0 $0 0.0 New York $0.00 n/a n/a $0 $0 0.0 $0 0.0 $0 0.0 North Carolina $0.00 n/a n/a $0 $0 0.0 $0 0.0 $0 0.0 North Dakota $0.00 n/a n/a $0 $0 0.0 $0 0.0 $0 0.0 Ohio $0.00 n/a n/a $0 $0 0.0 $0 0.0 $0 0.0 Oklahoma $0.00 n/a n/a $0 $0 0.0 $0 0.0 $0 0.0 Oregon $0.00 n/a n/a $0 $0 0.0 $0 0.0 $0 0.0 Pennsylvania $0.00 n/a n/a $0 $0 0.0 $0 0.0 $0 0.0 Rhode Island $0.00 n/a n/a $0 $0 0.0 $0 0.0 $0 0.0 South Carolina $0.00 n/a n/a $0 $0 0.0 $0 0.0 $0 0.0 South Dakota $0.00 n/a n/a $0 $0 0.0 $0 0.0 $0 0.0 Tennessee $0.00 n/a n/a $0 $0 0.0 $0 0.0 $0 0.0 Texas $0.00 n/a n/a $0 $0 0.0 $0 0.0 $0 0.0 Utah $0.00 n/a n/a $0 $0 0.0 $0 0.0 $0 0.0 Vermont $0.00 n/a n/a $0 $0 0.0 $0 0.0 $0 0.0 Virginia $0.00 n/a n/a $0 $0 0.0 $0 0.0 $0 0.0 Washington $0.00 n/a n/a $0 $0 0.0 $0 0.0 $0 0.0 West Virginia $0.00 n/a n/a $0 $0 0.0 $0 0.0 $0 0.0 Wyoming $0.00 n/a n/a $0 $0 0.0 $0 0.0 $0 0.0 United States $0.21 n/a n/a $41,239,760 $51,281,760 24.4 $66,833,289 30.3 $65,741,098 -1.6
Notes: Data do not include expenditures for managed care programs in North Carolina (2013 - 2015). Data for several states include expenditures for Medicaid Upper Payment Limit programs or provider taxes. Data are presented based on state reporting. No further explanation of trends is available for the purposes of this report.

Managed Care Institutional LTSS Expenditures - Unspecified Table BC
State
FY 2015 Expenditures Per Resident
Rank 2015
Rank 2014
FY 2013 Expenditures
FY 2014 Expenditures
Percent Change 13-14
FY 2015 Expenditures
Percent Change 14-15
Iowa $29.41 1 2 $81,115,331 $88,981,212 $10 $91,420,657 2.7 Illinois $27.58 2 1 $83,837,474 $478,673,945 $471 $354,862,473 -25.9 Indiana $0.65 3 5 $9,399,794 $22,104,114 $135 $4,314,171 -80.5 Alabama $0.00 n/a n/a $0 $0 $0 $0 0.0 Alaska $0.00 n/a n/a $0 $0 $0 $0 0.0 Arizona $0.00 n/a n/a $0 $0 $0 $0 0.0 Arkansas $0.00 n/a n/a $0 $0 $0 $0 0.0 California $0.00 n/a n/a $0 $0 $0 $0 0.0 Colorado $0.00 n/a n/a $0 $0 $0 $0 0.0 Connecticut $0.00 n/a n/a $0 $0 $0 $0 0.0 Delaware $0.00 n/a n/a $0 $0 $0 $0 0.0 Dist. of Columbia $0.00 n/a n/a $0 $0 $0 $0 0.0 Florida $0.00 n/a n/a $0 $0 $0 $0 0.0 Georgia $0.00 n/a n/a $0 $0 $0 $0 0.0 Hawaii $0.00 n/a n/a $0 $0 $0 $0 0.0 Idaho $0.00 n/a n/a $0 $0 $0 $0 0.0 Kansas $0.00 n/a n/a $0 $0 $0 $0 0.0 Kentucky $0.00 n/a n/a $0 $0 $0 $0 0.0 Louisiana $0.00 n/a n/a $0 $0 $0 $0 0.0 Maine $0.00 n/a n/a $0 $0 $0 $0 0.0 Maryland $0.00 n/a n/a $0 $0 $0 $0 0.0 Massachusetts $0.00 n/a 3 $0 $73,335,737 $100 $0 -100.0 Michigan $0.00 n/a n/a $0 $0 $0 $0 0.0 Minnesota $0.00 n/a n/a $0 $0 $0 $0 0.0 Mississippi $0.00 n/a n/a $0 $0 $0 $0 0.0 Missouri $0.00 n/a n/a $0 $0 $0 $0 0.0 Montana $0.00 n/a n/a $0 $0 $0 $0 0.0 Nebraska $0.00 n/a n/a $0 $0 $0 $0 0.0 Nevada $0.00 n/a n/a $0 $0 $0 $0 0.0 New Hampshire $0.00 n/a n/a $0 $0 $0 $0 0.0 New Jersey $0.00 n/a 4 $2,340,857 $35,635,312 $1,422 $0 -100.0 New Mexico $0.00 n/a n/a $0 $0 $0 $0 0.0 New York $0.00 n/a n/a $0 $0 $0 $0 0.0 North Carolina $0.00 n/a n/a $0 $0 $0 $0 0.0 North Dakota $0.00 n/a n/a $0 $0 $0 $0 0.0 Ohio $0.00 n/a n/a $5,182,342 $0 -$100 $0 0.0 Oklahoma $0.00 n/a n/a $0 $0 $0 $0 0.0 Oregon $0.00 n/a n/a $0 $0 $0 $0 0.0 Pennsylvania $0.00 n/a n/a $0 $0 $0 $0 0.0 Rhode Island $0.00 n/a n/a $0 $0 $0 $0 0.0 South Carolina $0.00 n/a n/a $0 $0 $0 $0 0.0 South Dakota $0.00 n/a n/a $0 $0 $0 $0 0.0 Tennessee $0.00 n/a n/a $0 $0 $0 $0 0.0 Texas $0.00 n/a n/a $0 $0 $0 $0 0.0 Utah $0.00 n/a n/a $0 $0 $0 $0 0.0 Vermont $0.00 n/a n/a $0 $0 $0 $0 0.0 Virginia $0.00 n/a n/a $0 $0 $0 $0 0.0 Washington $0.00 n/a n/a $0 $0 $0 $0 0.0 West Virginia $0.00 n/a n/a $0 $0 $0 $0 0.0 Wisconsin $0.00 n/a n/a $0 $0 $0 $0 0.0 Wyoming $0.00 n/a n/a $0 $0 $0 $0 0.0 United States $1.41 n/a n/a $181,875,798 $698,730,320 $284 $450,597,301 -35.5
Notes: Institutional MLTSS - unspecified refers to institutional LTSS provided through managed care organizations and reported on the CMS-64. The CMS-64 does not specify the type of institutional LTSS. The first year of institutional MLTSS - unspecified data was 2013. Data are presented based on state reporting. No further explanation of trends is available for the purposes of this report.

Managed Care HCBS Expenditures Table BD
State
FY 2015 Expenditures Per Resident
Rank 2015
Rank 2014
FY 2012 Expenditures
FY 2013 Expenditures
Percent Change 12-13
FY 2014 Expenditures
Percent Change 13-14
FY 2015 Expenditures
Percent Change 14-15
New Mexico $348.31 1 3 $11,556,837 $11,738,681 1.6 $376,799,642 3109.9 $725,544,006 92.6 New York $248.15 2 1 $1,900,729,980 $3,604,602,648 89.6 $5,951,668,905 65.1 $4,893,169,594 -17.8 Wisconsin $207.42 3 2 $1,011,114,505 $1,063,939,612 5.2 $1,122,136,204 5.5 $1,194,409,622 6.4 Kansas $195.91 4 5 $7,519,717 $160,734,296 2037.5 $416,704,510 159.3 $568,008,566 36.3 Arizona $172.58 5 4 $1,032,337,906 $1,062,717,930 2.9 $1,140,302,342 7.3 $1,159,768,129 1.7 Massachusetts $155.06 6 14 $331,641,175 $382,546,654 15.3 $390,192,130 2.0 $1,046,657,505 168.2 Delaware $120.69 7 6 $46,410,696 $79,457,389 71.2 $94,320,812 18.7 $112,835,096 19.6 New Jersey $113.41 8 8 $30,395,969 $374,749,251 1132.9 $784,190,072 109.3 $1,012,199,366 29.1 Texas $104.22 9 7 $1,090,189,233 $1,945,070,466 78.4 $2,362,981,004 21.5 $2,808,156,027 18.8 Michigan $91.01 10 15 $455,164,599 $447,112,384 -1.8 $476,300,446 6.5 $902,458,968 89.5 Minnesota $89.56 11 9 $387,848,487 $382,697,172 -1.3 $412,953,643 7.9 $488,365,466 18.3 North Carolina $77.62 12 10 $150,517,677 $503,698,667 234.6 $702,527,809 39.5 $771,132,010 9.8 Tennessee $69.91 13 11 $435,238,151 $445,864,777 2.4 $458,596,696 2.9 $457,553,578 -0.2 Hawaii $63.94 14 12 $78,622,683 $78,622,683 0.0 $84,964,212 8.1 $90,556,577 6.6 Iowa $61.06 15 13 $4,703,460 $113,950,364 2322.7 $183,618,600 61.1 $189,787,804 3.4 Ohio $54.80 16 16 $22,605,111 $44,001,058 94.7 $472,546,001 973.9 $635,336,460 34.4 New Hampshire $44.42 17 17 $0 $0 0.0 $40,371,724 100.0 $59,022,410 46.2 Florida $34.53 18 18 $254,312,001 $280,099,857 10.1 $469,359,150 67.6 $686,757,559 46.3 Illinois $25.42 19 21 $0 $26,750,175 100.0 $194,155,822 625.8 $327,149,200 68.5 Colorado $23.17 20 19 $92,509,538 $98,056,171 6.0 $103,681,434 5.7 $123,955,089 19.6 Pennsylvania $17.72 21 20 $152,643,261 $172,409,105 12.9 $199,793,596 15.9 $226,651,463 13.4 Virginia $14.28 22 24 $30,026,671 $36,349,943 21.1 $52,972,849 45.7 $118,779,358 124.2 Oregon $11.61 23 23 $29,018,628 $31,939,638 10.1 $39,067,449 22.3 $46,055,838 17.9 North Dakota $8.76 24 25 $3,192,118 $3,687,704 15.5 $4,321,976 17.2 $6,481,366 50.0 California $8.48 25 22 $170,894,654 $425,732,852 149.1 $463,182,481 8.8 $327,935,057 -29.2 Louisiana $5.88 26 26 $11,167,431 $80,921,544 624.6 $16,181,344 -80.0 $27,310,203 68.8 Wyoming $4.15 27 28 $0 $384,713 100.0 $1,556,611 304.6 $2,421,098 55.5 South Carolina $2.68 28 27 $12,155,354 $12,074,593 -0.7 $13,427,420 11.2 $12,916,303 -3.8 Nebraska $2.37 29 31 $0 $516,102 100.0 $2,891,265 460.2 $4,462,467 54.3 Arkansas $2.31 30 29 $3,889,642 $5,405,993 39.0 $6,355,149 17.6 $6,847,209 7.7 Washington $1.88 31 30 $18,185,848 $18,219,391 0.2 $14,082,016 -22.7 $13,278,837 -5.7 Oklahoma $1.51 32 35 $3,191,700 $4,026,118 26.1 $4,188,177 4.0 $5,859,363 39.9 Alabama $1.40 33 33 $1,032,300 $4,125,113 299.6 $6,119,891 48.4 $6,801,420 11.1 Missouri $1.18 34 34 $6,228,521 $6,776,334 8.8 $6,759,291 -0.3 $7,124,634 5.4 Maryland $0.86 35 36 $6,126,115 $6,101,805 -0.4 $5,973,026 -2.1 $5,124,605 -14.2 Indiana $0.33 36 32 $0 $4,417,951 100.0 $9,787,712 121.5 $2,159,905 -77.9 Alaska $0.00 n/a n/a $0 $0 0.0 $0 0.0 $0 0.0 Connecticut $0.00 n/a n/a $0 $0 0.0 $0 0.0 $0 0.0 Dist. of Columbia $0.00 n/a n/a $0 $0 0.0 $0 0.0 $0 0.0 Georgia $0.00 n/a n/a $0 $0 0.0 $0 0.0 $0 0.0 Idaho $0.00 n/a n/a $0 $0 0.0 $0 0.0 $0 0.0 Kentucky $0.00 n/a n/a $0 $0 0.0 $0 0.0 $0 0.0 Maine $0.00 n/a n/a $0 $0 0.0 $0 0.0 $0 0.0 Mississippi $0.00 n/a n/a $0 $0 0.0 $0 0.0 $0 0.0 Montana $0.00 n/a n/a $0 $0 0.0 $0 0.0 $0 0.0 Nevada $0.00 n/a n/a $0 $0 0.0 $0 0.0 $0 0.0 Rhode Island $0.00 n/a n/a $0 $0 0.0 $0 0.0 $0 0.0 South Dakota $0.00 n/a n/a $0 $0 0.0 $0 0.0 $0 0.0 Utah $0.00 n/a n/a $0 $0 0.0 $0 0.0 $0 0.0 Vermont $0.00 n/a n/a $5,736,135 $2,880,241 -49.8 $0 -100.0 $0 0.0 West Virginia $0.00 n/a n/a $0 $0 0.0 $0 0.0 $0 0.0 United States $59.87 n/a n/a $7,796,906,103 $11,922,379,375 52.9 $17,085,031,411 43.3 $19,073,032,158 11.6
Notes: Managed care HCBS includes section 1915(c) waivers, personal care, home health, PACE, and services similar to 1915(c) waivers provided through managed care organizations that were not authorized under another state plan or waiver authority. Delaware 2012 and Michigan 2014 data were incomplete because the transition to managed care occurred during the year; state estimates were included the following year. Data do not include expenditures for managed care programs in the following states (years of missing data in parentheses): California (2012, 2014, 2015); Massachusetts (2014); New Mexico (2012 - 2013). Case management, rehabilitative services, private duty nursing, state plan HCBS, and health homes data do not include services provided through managed care organizations. Data are presented based on state reporting. No further explanation of trends is available for the purposes of this report.

Managed Care 1915(c) Waiver Expenditures Table BE
State
FY 2015 Expenditures Per Resident
Rank 2015
Rank 2014
FY 2012 Expenditures
FY 2013 Expenditures
Percent Change 12-13
FY 2014 Expenditures
Percent Change 13-14
FY 2015 Expenditures
Percent Change 14-15
Kansas $183.49 1 2 $0 $140,984,102 100.0 $379,482,473 169.2 $531,991,763 40.2 Wisconsin $173.34 2 1 $824,976,806 $874,835,330 6.0 $933,400,179 6.7 $998,147,066 6.9 Michigan $75.93 3 4 $429,486,167 $418,351,336 -2.6 $439,666,508 5.1 $752,885,426 71.2 North Carolina $72.59 4 3 $138,213,530 $482,107,953 248.8 $670,838,814 39.1 $721,130,980 7.5 Minnesota $53.31 5 5 $216,266,233 $205,563,582 -4.9 $230,238,594 12.0 $290,695,948 26.3 Ohio $39.95 6 7 $0 $0 0.0 $93,666,788 100.0 $463,222,195 394.5 Florida $32.99 7 6 $216,529,169 $230,712,192 6.6 $446,115,130 93.4 $656,125,647 47.1 Illinois $18.64 8 n/a $0 $0 0.0 $0 0.0 $239,807,460 100.0 Alabama $0.00 n/a n/a $0 $0 0.0 $0 0.0 $0 0.0 Alaska $0.00 n/a n/a $0 $0 0.0 $0 0.0 $0 0.0 Arizona $0.00 n/a n/a $0 $0 0.0 $0 0.0 $0 0.0 Arkansas $0.00 n/a n/a $0 $0 0.0 $0 0.0 $0 0.0 California $0.00 n/a n/a $0 $0 0.0 $0 0.0 $0 0.0 Colorado $0.00 n/a n/a $0 $0 0.0 $0 0.0 $0 0.0 Connecticut $0.00 n/a n/a $0 $0 0.0 $0 0.0 $0 0.0 Delaware $0.00 n/a n/a $0 $0 0.0 $0 0.0 $0 0.0 Dist. of Columbia $0.00 n/a n/a $0 $0 0.0 $0 0.0 $0 0.0 Georgia $0.00 n/a n/a $0 $0 0.0 $0 0.0 $0 0.0 Hawaii $0.00 n/a n/a $0 $0 0.0 $0 0.0 $0 0.0 Idaho $0.00 n/a n/a $0 $0 0.0 $0 0.0 $0 0.0 Indiana $0.00 n/a n/a $0 $0 0.0 $0 0.0 $0 0.0 Iowa $0.00 n/a n/a $0 $0 0.0 $0 0.0 $0 0.0 Kentucky $0.00 n/a n/a $0 $0 0.0 $0 0.0 $0 0.0 Louisiana $0.00 n/a n/a $0 $0 0.0 $0 0.0 $0 0.0 Maine $0.00 n/a n/a $0 $0 0.0 $0 0.0 $0 0.0 Maryland $0.00 n/a n/a $0 $0 0.0 $0 0.0 $0 0.0 Massachusetts $0.00 n/a n/a $0 $265,580,810 100.0 $0 -100.0 $0 0.0 Mississippi $0.00 n/a n/a $0 $0 0.0 $0 0.0 $0 0.0 Missouri $0.00 n/a n/a $0 $0 0.0 $0 0.0 $0 0.0 Montana $0.00 n/a n/a $0 $0 0.0 $0 0.0 $0 0.0 Nebraska $0.00 n/a n/a $0 $0 0.0 $0 0.0 $0 0.0 Nevada $0.00 n/a n/a $0 $0 0.0 $0 0.0 $0 0.0 New Hampshire $0.00 n/a n/a $0 $0 0.0 $0 0.0 $0 0.0 New Jersey $0.00 n/a n/a $0 $0 0.0 $0 0.0 $0 0.0 New Mexico $0.00 n/a n/a $0 $0 0.0 $0 0.0 $0 0.0 New York $0.00 n/a n/a $0 $0 0.0 $0 0.0 $0 0.0 North Dakota $0.00 n/a n/a $0 $0 0.0 $0 0.0 $0 0.0 Oklahoma $0.00 n/a n/a $0 $0 0.0 $0 0.0 $0 0.0 Oregon $0.00 n/a n/a $0 $0 0.0 $0 0.0 $0 0.0 Pennsylvania $0.00 n/a n/a $0 $0 0.0 $0 0.0 $0 0.0 Rhode Island $0.00 n/a n/a $0 $0 0.0 $0 0.0 $0 0.0 South Carolina $0.00 n/a n/a $0 $0 0.0 $0 0.0 $0 0.0 South Dakota $0.00 n/a n/a $0 $0 0.0 $0 0.0 $0 0.0 Tennessee $0.00 n/a n/a $0 $0 0.0 $0 0.0 $0 0.0 Texas $0.00 n/a n/a $31,272,919 $0 -100.0 $0 0.0 $0 0.0 Utah $0.00 n/a n/a $0 $0 0.0 $0 0.0 $0 0.0 Vermont $0.00 n/a n/a $0 $0 0.0 $0 0.0 $0 0.0 Virginia $0.00 n/a n/a $0 $0 0.0 $0 0.0 $0 0.0 Washington $0.00 n/a n/a $0 $3,060,251 100.0 $0 -100.0 $0 0.0 West Virginia $0.00 n/a n/a $0 $0 0.0 $0 0.0 $0 0.0 Wyoming $0.00 n/a n/a $0 $0 0.0 $0 0.0 $0 0.0 United States $14.61 n/a n/a $1,856,744,824 $2,621,195,556 41.2 $3,193,408,486 21.8 $4,654,006,485 45.7
Notes: Massachusetts 2013 data include expenditures for state plan home health expenditures within a managed care program. The state provided an estimate for home health and section 1915(c) waiver services. Florida 2015 data include expenditures for state plan home health and personal care expenditures within a managed care program. The state provided an estimate for personal care, home health, and section 1915(c) waiver services. Michigan 2014 data were incomplete because the transition to a managed care program occurred during that year; state estimates were included starting in 2015. Data do not include expenditures for managed care programs in Massachusetts (2014) and New Mexico (2012 - 2013). Data are presented based on state reporting. No further explanation of trends is available for the purposes of this report.

Managed Care Personal Care Expenditures Table BF
State
FY 2015 Expenditures Per Resident
Rank 2015
Rank 2014
FY 2012 Expenditures
FY 2013 Expenditures
Percent Change 12-13
FY 2014 Expenditures
Percent Change 13-14
FY 2015 Expenditures
Percent Change 14-15
New York $211.94 1 1 $1,326,271,182 $2,704,017,373 103.9 $3,876,291,018 43.4 $4,179,057,818 7.8 Texas $60.46 2 3 $941,003,938 $1,328,356,792 41.2 $1,402,481,835 5.6 $1,629,152,596 16.2 Wisconsin $31.70 3 4 $169,010,002 $174,151,134 3.0 $175,215,464 0.6 $182,532,412 4.2 Minnesota $30.77 4 5 $137,214,192 $142,628,644 3.9 $151,776,391 6.4 $167,767,986 10.5 Delaware $22.35 5 6 $4,684,010 $11,932,359 154.7 $16,286,928 36.5 $20,895,341 28.3 Virginia $4.46 6 7 $0 $0 0.0 $2,928,483 100.0 $37,094,732 1166.7 Arizona $0.07 7 n/a $0 $0 0.0 $0 0.0 $483,044 100.0 Alabama $0.00 n/a n/a $0 $0 0.0 $0 0.0 $0 0.0 Alaska $0.00 n/a n/a $0 $0 0.0 $0 0.0 $0 0.0 Arkansas $0.00 n/a n/a $0 $0 0.0 $0 0.0 $0 0.0 California $0.00 n/a n/a $0 $0 0.0 $0 0.0 $0 0.0 Colorado $0.00 n/a n/a $0 $0 0.0 $0 0.0 $0 0.0 Connecticut $0.00 n/a n/a $0 $0 0.0 $0 0.0 $0 0.0 Dist. of Columbia $0.00 n/a n/a $0 $0 0.0 $0 0.0 $0 0.0 Florida $0.00 n/a n/a $22,961,513 $28,365,729 23.5 $0 -100.0 $0 0.0 Georgia $0.00 n/a n/a $0 $0 0.0 $0 0.0 $0 0.0 Hawaii $0.00 n/a n/a $0 $0 0.0 $0 0.0 $0 0.0 Idaho $0.00 n/a n/a $0 $0 0.0 $0 0.0 $0 0.0 Illinois $0.00 n/a n/a $0 $0 0.0 $0 0.0 $0 0.0 Indiana $0.00 n/a n/a $0 $0 0.0 $0 0.0 $0 0.0 Iowa $0.00 n/a n/a $0 $0 0.0 $0 0.0 $0 0.0 Kansas $0.00 n/a n/a $0 $18,450 100.0 $0 -100.0 $0 0.0 Kentucky $0.00 n/a n/a $0 $0 0.0 $0 0.0 $0 0.0 Louisiana $0.00 n/a n/a $0 $0 0.0 $0 0.0 $0 0.0 Maine $0.00 n/a n/a $0 $0 0.0 $0 0.0 $0 0.0 Maryland $0.00 n/a n/a $0 $0 0.0 $0 0.0 $0 0.0 Massachusetts $0.00 n/a n/a $0 $0 0.0 $0 0.0 $0 0.0 Michigan $0.00 n/a n/a $0 $0 0.0 $0 0.0 $0 0.0 Mississippi $0.00 n/a n/a $0 $0 0.0 $0 0.0 $0 0.0 Missouri $0.00 n/a n/a $0 $0 0.0 $0 0.0 $0 0.0 Montana $0.00 n/a n/a $0 $0 0.0 $0 0.0 $0 0.0 Nebraska $0.00 n/a n/a $0 $0 0.0 $0 0.0 $0 0.0 Nevada $0.00 n/a n/a $0 $0 0.0 $0 0.0 $0 0.0 New Hampshire $0.00 n/a n/a $0 $0 0.0 $0 0.0 $0 0.0 New Jersey $0.00 n/a n/a $0 $0 0.0 $0 0.0 $0 0.0 New Mexico $0.00 n/a 2 $0 $0 0.0 $291,695,034 100.0 $0 -100.0 North Carolina $0.00 n/a n/a $0 $0 0.0 $0 0.0 $0 0.0 North Dakota $0.00 n/a n/a $0 $0 0.0 $0 0.0 $0 0.0 Ohio $0.00 n/a n/a $0 $0 0.0 $0 0.0 $0 0.0 Oklahoma $0.00 n/a n/a $0 $0 0.0 $0 0.0 $0 0.0 Oregon $0.00 n/a n/a $0 $0 0.0 $0 0.0 $0 0.0 Pennsylvania $0.00 n/a n/a $0 $0 0.0 $0 0.0 $0 0.0 Rhode Island $0.00 n/a n/a $0 $0 0.0 $0 0.0 $0 0.0 South Carolina $0.00 n/a n/a $0 $0 0.0 $0 0.0 $0 0.0 South Dakota $0.00 n/a n/a $0 $0 0.0 $0 0.0 $0 0.0 Tennessee $0.00 n/a n/a $0 $0 0.0 $0 0.0 $0 0.0 Utah $0.00 n/a n/a $0 $0 0.0 $0 0.0 $0 0.0 Vermont $0.00 n/a n/a $0 $0 0.0 $0 0.0 $0 0.0 Washington $0.00 n/a 8 $6,595,121 $3,943,692 -40.2 $844,152 -78.6 $0 -100.0 West Virginia $0.00 n/a n/a $0 $0 0.0 $0 0.0 $0 0.0 Wyoming $0.00 n/a n/a $0 $0 0.0 $0 0.0 $0 0.0 United States $19.52 n/a n/a $2,607,739,958 $4,393,414,173 68.5 $5,917,519,305 34.7 $6,216,983,929 5.1
Notes: Data do not include expenditures for managed care programs in California (2015) and New Mexico (2012 - 2013). Florida and New Mexico 2015 data do not include expenditures for state plan personal care expenditures within a managed care program. States included personal care expenditures in its estimate for section 1915(c) waivers (Florida) or HCBS - unspecified (New Mexico). Delaware 2012 data were incomplete because the transition to managed care occurred during that year; state estimates were included starting in 2013. Minnesota 2013 data are estimated expenditures for state fiscal year 2013. Data are presented based on state reporting. No further explanation of trends is available for the purposes of this report.

Managed Care Home Health Expenditures Table BG
State
FY 2015 Expenditures Per Resident
Rank 2015
Rank 2014
FY 2012 Expenditures
FY 2013 Expenditures
Percent Change 12-13
FY 2014 Expenditures
Percent Change 13-14
FY 2015 Expenditures
Percent Change 14-15
Delaware $32.57 1 1 $16,733,517 $32,550,302 94.5 $34,302,896 5.4 $30,453,292 -11.2 Tennessee $31.64 2 2 $222,905,254 $206,433,165 -7.4 $211,710,047 2.6 $207,071,067 -2.2 New York $17.40 3 3 $338,326,456 $567,532,972 67.7 $495,431,097 -12.7 $343,070,809 -30.8 Ohio $13.94 4 7 $0 $0 0.0 $44,722,896 100.0 $161,615,779 261.4 Kansas $8.06 5 5 $0 $11,632,943 100.0 $23,192,045 99.4 $23,360,763 0.7 Minnesota $5.48 6 6 $34,368,062 $34,504,946 0.4 $30,938,658 -10.3 $29,901,532 -3.4 Arizona $3.49 7 n/a $0 $0 0.0 $0 0.0 $23,429,005 100.0 Virginia $2.80 8 10 $0 $0 0.0 $2,428 100.0 $23,284,172 958885.7 Wisconsin $2.38 9 9 $17,127,697 $14,953,148 -12.7 $13,520,561 -9.6 $13,730,144 1.6 Hawaii $2.03 10 8 $11,179,771 $11,179,771 0.0 $3,729,258 -66.6 $2,878,095 -22.8 Alabama $0.00 n/a n/a $0 $0 0.0 $0 0.0 $0 0.0 Alaska $0.00 n/a n/a $0 $0 0.0 $0 0.0 $0 0.0 Arkansas $0.00 n/a n/a $0 $0 0.0 $0 0.0 $0 0.0 California $0.00 n/a n/a $0 $0 0.0 $0 0.0 $0 0.0 Colorado $0.00 n/a n/a $0 $0 0.0 $0 0.0 $0 0.0 Connecticut $0.00 n/a n/a $0 $0 0.0 $0 0.0 $0 0.0 Dist. of Columbia $0.00 n/a n/a $0 $0 0.0 $0 0.0 $0 0.0 Florida $0.00 n/a n/a $99,756 $47,895 -52.0 $0 -100.0 $0 0.0 Georgia $0.00 n/a n/a $0 $0 0.0 $0 0.0 $0 0.0 Idaho $0.00 n/a n/a $0 $0 0.0 $0 0.0 $0 0.0 Illinois $0.00 n/a n/a $0 $0 0.0 $0 0.0 $0 0.0 Indiana $0.00 n/a n/a $0 $0 0.0 $0 0.0 $0 0.0 Iowa $0.00 n/a n/a $0 $0 0.0 $0 0.0 $0 0.0 Kentucky $0.00 n/a n/a $0 $0 0.0 $0 0.0 $0 0.0 Louisiana $0.00 n/a n/a $0 $0 0.0 $0 0.0 $0 0.0 Maine $0.00 n/a n/a $0 $0 0.0 $0 0.0 $0 0.0 Maryland $0.00 n/a n/a $0 $0 0.0 $0 0.0 $0 0.0 Massachusetts $0.00 n/a n/a $141,359,985 $0 -100.0 $0 0.0 $0 0.0 Michigan $0.00 n/a n/a $0 $0 0.0 $0 0.0 $0 0.0 Mississippi $0.00 n/a n/a $0 $0 0.0 $0 0.0 $0 0.0 Missouri $0.00 n/a n/a $0 $0 0.0 $0 0.0 $0 0.0 Montana $0.00 n/a n/a $0 $0 0.0 $0 0.0 $0 0.0 Nebraska $0.00 n/a n/a $0 $0 0.0 $0 0.0 $0 0.0 Nevada $0.00 n/a n/a $0 $0 0.0 $0 0.0 $0 0.0 New Hampshire $0.00 n/a n/a $0 $0 0.0 $0 0.0 $0 0.0 New Jersey $0.00 n/a n/a $0 $0 0.0 $0 0.0 $0 0.0 New Mexico $0.00 n/a 4 $0 $0 0.0 $26,377,071 100.0 $0 -100.0 North Carolina $0.00 n/a n/a $0 $0 0.0 $0 0.0 $0 0.0 North Dakota $0.00 n/a n/a $0 $0 0.0 $0 0.0 $0 0.0 Oklahoma $0.00 n/a n/a $0 $0 0.0 $0 0.0 $0 0.0 Oregon $0.00 n/a n/a $0 $0 0.0 $0 0.0 $0 0.0 Pennsylvania $0.00 n/a n/a $0 $0 0.0 $0 0.0 $0 0.0 Rhode Island $0.00 n/a n/a $0 $0 0.0 $0 0.0 $0 0.0 South Carolina $0.00 n/a n/a $0 $0 0.0 $0 0.0 $0 0.0 South Dakota $0.00 n/a n/a $0 $0 0.0 $0 0.0 $0 0.0 Texas $0.00 n/a n/a $0 $0 0.0 $0 0.0 $0 0.0 Utah $0.00 n/a n/a $0 $0 0.0 $0 0.0 $0 0.0 Vermont $0.00 n/a n/a $0 $0 0.0 $0 0.0 $0 0.0 Washington $0.00 n/a n/a $0 $0 0.0 $0 0.0 $0 0.0 West Virginia $0.00 n/a n/a $0 $0 0.0 $0 0.0 $0 0.0 Wyoming $0.00 n/a n/a $0 $0 0.0 $0 0.0 $0 0.0 United States $2.70 n/a n/a $782,100,498 $878,835,142 12.4 $883,926,957 0.6 $858,794,658 -2.8
Notes: Delaware 2012 data were incomplete because the transition to managed care occurred during that year; state estimates were included starting in 2013. Hawaii provided an estimate for calendar year 2012. This estimate was used for both FY 2012 and FY 2013. Data for several states do not include expenditures for state plan home health expenditures within a managed care program because states included home health expenditures in estimates for HCBS - unspecified (Arizona 2012 - 2014, California 2013, and New Mexico 2015) or section 1915(c) waivers (Florida 2015 and Massachusetts 2013). Minnesota 2013 data are estimated expenditures for state fiscal year 2013. Data are presented based on state reporting. No further explanation of trends is available for the purposes of this report.

Managed Care HCBS - Unspecified Table BH
State
FY 2015 Expenditures Per Resident
Rank 2015
Rank 2014
FY 2012 Expenditures
FY 2013 Expenditures
Percent Change 12-13
FY 2014 Expenditures
Percent Change 13-14
FY 2015 Expenditures
Percent Change 14-15
New Mexico $342.63 1 12 $0 $0 0.0 $46,853,589 100.0 $713,711,476 1423.3 Arizona $169.03 2 1 $1,032,337,906 $1,062,717,930 2.9 $1,140,302,342 7.3 $1,135,856,080 -0.4 Massachusetts $134.08 3 7 $80,275,904 $0 -100.0 $261,016,062 100.0 $905,011,431 246.7 New Jersey $108.50 4 2 $0 $335,475,821 100.0 $740,134,327 120.6 $968,396,265 30.8 Hawaii $61.90 5 4 $67,442,912 $67,442,912 0.0 $81,234,954 20.4 $87,678,482 7.9 Iowa $57.84 6 5 $0 $106,981,343 100.0 $174,954,746 63.5 $179,782,628 2.8 Delaware $56.79 7 6 $24,993,169 $34,640,762 38.6 $39,240,140 13.3 $53,097,934 35.3 New Hampshire $44.42 8 10 $0 $0 0.0 $40,371,724 100.0 $59,022,410 46.2 Texas $42.36 9 9 $82,944,882 $581,032,618 600.5 $923,687,366 59.0 $1,141,368,780 23.6 Tennessee $36.66 10 8 $200,907,127 $228,595,035 13.8 $235,855,408 3.2 $239,950,683 1.7 Michigan $10.28 11 n/a $0 $0 0.0 $0 0.0 $101,957,983 100.0 Illinois $6.79 12 13 $0 $26,750,175 100.0 $194,155,822 625.8 $87,341,740 -55.0 New York $3.64 13 3 $0 $49,812,991 100.0 $1,249,658,167 2408.7 $71,685,542 -94.3 Louisiana $3.53 14 16 $0 $70,635,791 100.0 $5,842,884 -91.7 $16,413,994 180.9 California $2.85 15 14 $133,617 $253,928,846 189942.3 $268,798,488 5.9 $110,175,419 -59.0 Pennsylvania $0.43 16 17 $3,506,624 $4,766,268 35.9 $5,578,116 17.0 $5,562,201 -0.3 Indiana $0.29 17 15 $0 $4,417,951 100.0 $9,787,712 121.5 $1,897,080 -80.6 Virginia $0.13 18 18 $0 $0 0.0 $1,920,754 100.0 $1,076,547 -44.0 Alabama $0.00 n/a n/a $0 $0 0.0 $0 0.0 $0 0.0 Alaska $0.00 n/a n/a $0 $0 0.0 $0 0.0 $0 0.0 Arkansas $0.00 n/a n/a $0 $0 0.0 $0 0.0 $0 0.0 Colorado $0.00 n/a n/a $0 $0 0.0 $0 0.0 $0 0.0 Connecticut $0.00 n/a n/a $0 $0 0.0 $0 0.0 $0 0.0 Dist. of Columbia $0.00 n/a n/a $0 $0 0.0 $0 0.0 $0 0.0 Florida $0.00 n/a n/a $0 $0 0.0 $0 0.0 $0 0.0 Georgia $0.00 n/a n/a $0 $0 0.0 $0 0.0 $0 0.0 Idaho $0.00 n/a n/a $0 $0 0.0 $0 0.0 $0 0.0 Kansas $0.00 n/a n/a $0 $0 0.0 $0 0.0 $0 0.0 Kentucky $0.00 n/a n/a $0 $0 0.0 $0 0.0 $0 0.0 Maine $0.00 n/a n/a $0 $0 0.0 $0 0.0 $0 0.0 Maryland $0.00 n/a n/a $0 $0 0.0 $0 0.0 $0 0.0 Minnesota $0.00 n/a n/a $0 $0 0.0 $0 0.0 $0 0.0 Mississippi $0.00 n/a n/a $0 $0 0.0 $0 0.0 $0 0.0 Missouri $0.00 n/a n/a $0 $0 0.0 $0 0.0 $0 0.0 Montana $0.00 n/a n/a $0 $0 0.0 $0 0.0 $0 0.0 Nebraska $0.00 n/a n/a $0 $0 0.0 $0 0.0 $0 0.0 Nevada $0.00 n/a n/a $0 $0 0.0 $0 0.0 $0 0.0 North Carolina $0.00 n/a n/a $0 $0 0.0 $0 0.0 $0 0.0 North Dakota $0.00 n/a n/a $0 $0 0.0 $0 0.0 $0 0.0 Ohio $0.00 n/a 11 $0 $26,543,658 100.0 $309,637,903 1066.5 $0 -100.0 Oklahoma $0.00 n/a n/a $0 $0 0.0 $0 0.0 $0 0.0 Oregon $0.00 n/a n/a $0 $0 0.0 $0 0.0 $0 0.0 Rhode Island $0.00 n/a n/a $0 $0 0.0 $0 0.0 $0 0.0 South Carolina $0.00 n/a n/a $0 $0 0.0 $0 0.0 $0 0.0 South Dakota $0.00 n/a n/a $0 $0 0.0 $0 0.0 $0 0.0 Utah $0.00 n/a n/a $0 $0 0.0 $0 0.0 $0 0.0 Vermont $0.00 n/a n/a $0 $0 0.0 $0 0.0 $0 0.0 Washington $0.00 n/a 19 $63,397 $0 -100.0 $199,662 100.0 $0 -100.0 West Virginia $0.00 n/a n/a $0 $0 0.0 $0 0.0 $0 0.0 Wisconsin $0.00 n/a n/a $0 $0 0.0 $0 0.0 $0 0.0 Wyoming $0.00 n/a n/a $0 $0 0.0 $0 0.0 $0 0.0 United States $18.46 n/a n/a $1,492,605,538 $2,853,742,101 91.2 $5,729,230,166 100.8 $5,879,986,675 2.6
Notes: HCBS - unspecified refers to HCBS provided through managed care organizations that were not authorized under another state plan or waiver authority. Arizona 2012 - 2014 data, California 2013 data, and New Mexico 2015 data include expenditures for state plan personal care and home health expenditures within managed care programs. States provided estimates for all non-institutional HCBS, which is used in this table. Delaware 2012 data were incomplete because the transition to managed care occurred during that year; state estimates were included starting in 2013. Hawaii provided an estimate for calendar year 2012. This estimate was used for both FY 2012 and FY 2013. Data do not include expenditures for a managed care program in California (2012, 2014, 2015). Data are presented based on state reporting. No further explanation of trends is available for the purposes of this report.

Total Managed Care LTSS Table BI
State
FY 2015 Expenditures Per Resident
Rank 2015
Rank 2014
FY 2012 Expenditures
FY 2013 Expenditures
Percent Change 12-13
FY 2014 Expenditures
Percent Change 13-14
FY 2015 Expenditures
Percent Change 14-15
New Mexico $473.01 1 4 $11,556,837 $11,738,681 1.6 $593,147,440 4952.9 $985,289,457 66.1 Delaware $411.70 2 1 $163,108,188 $338,420,912 107.5 $355,848,152 5.1 $384,915,320 8.2 Kansas $380.59 3 3 $7,519,717 $378,697,919 4936.1 $850,435,491 124.6 $1,103,470,331 29.8 Hawaii $267.05 4 5 $359,049,919 $359,049,919 0.0 $346,806,566 -3.4 $378,235,582 9.1 New York $262.86 5 2 $1,982,632,744 $3,723,804,564 87.8 $6,126,334,990 64.5 $5,183,276,792 -15.4 Arizona $236.90 6 6 $1,521,335,473 $1,493,242,034 -1.8 $1,554,041,836 4.1 $1,591,979,456 2.4 Tennessee $236.42 7 8 $1,381,297,230 $1,348,497,889 -2.4 $1,340,425,141 -0.6 $1,547,314,871 15.4 Wisconsin $234.24 8 7 $1,128,308,398 $1,196,783,771 6.1 $1,265,751,019 5.8 $1,348,852,391 6.6 Massachusetts $199.35 9 16 $549,209,903 $648,702,680 18.1 $463,527,867 -28.5 $1,345,594,782 190.3 Florida $184.76 10 9 $268,642,558 $284,956,862 6.1 $2,588,779,825 808.5 $3,674,587,039 41.9 Ohio $146.25 11 14 $22,605,111 $49,183,400 117.6 $850,263,500 1628.8 $1,695,642,189 99.4 Texas $145.46 12 11 $1,145,092,608 $1,950,940,588 70.4 $2,368,272,336 21.4 $3,919,234,206 65.5 New Jersey $124.39 13 10 $30,395,969 $377,090,108 1140.6 $819,825,384 117.4 $1,110,190,194 35.4 Minnesota $98.33 14 13 $427,993,365 $415,542,453 -2.9 $456,118,711 9.8 $536,174,449 17.6 Michigan $91.01 15 18 $455,164,599 $447,112,384 -1.8 $476,300,446 6.5 $902,458,968 89.5 Iowa $90.47 16 12 $4,703,460 $195,065,695 4047.3 $272,599,812 39.7 $281,208,461 3.2 North Carolina $77.62 17 15 $150,517,677 $503,698,667 234.6 $702,527,809 39.5 $771,132,010 9.8 Illinois $53.00 18 17 $0 $110,587,649 100.0 $672,829,767 508.4 $682,011,673 1.4 New Hampshire $44.42 19 19 $0 $0 0.0 $40,371,724 100.0 $59,022,410 46.2 Virginia $34.73 20 24 $30,026,671 $36,349,943 21.1 $66,398,709 82.7 $288,843,016 335.0 Colorado $23.17 21 20 $92,509,538 $98,056,171 6.0 $103,681,434 5.7 $123,955,089 19.6 Pennsylvania $17.72 22 21 $152,643,261 $172,409,105 12.9 $199,793,596 15.9 $226,651,463 13.4 Oregon $11.61 23 23 $29,018,628 $31,939,638 10.1 $39,067,449 22.3 $46,055,838 17.9 North Dakota $8.76 24 25 $3,192,118 $3,687,704 15.5 $4,321,976 17.2 $6,481,366 50.0 California $8.48 25 22 $170,894,654 $431,469,357 152.5 $463,182,481 7.4 $327,935,057 -29.2 Louisiana $5.88 26 27 $11,167,431 $80,921,544 624.6 $16,181,344 -80.0 $27,310,203 68.8 Wyoming $4.15 27 29 $0 $384,713 100.0 $1,556,611 304.6 $2,421,098 55.5 South Carolina $2.68 28 28 $12,155,354 $12,074,593 -0.7 $13,427,420 11.2 $12,916,303 -3.8 Nebraska $2.37 29 32 $0 $516,102 100.0 $2,891,265 460.2 $4,462,467 54.3 Arkansas $2.31 30 30 $3,889,642 $5,405,993 39.0 $6,355,149 17.6 $6,847,209 7.7 Washington $1.88 31 31 $18,189,431 $18,219,391 0.2 $14,082,016 -22.7 $13,278,837 -5.7 Oklahoma $1.51 32 35 $3,191,700 $4,026,118 26.1 $4,188,177 4.0 $5,859,363 39.9 Alabama $1.40 33 33 $1,032,300 $4,125,113 299.6 $6,119,891 48.4 $6,801,420 11.1 Missouri $1.18 34 34 $6,228,521 $6,776,334 8.8 $6,759,291 -0.3 $7,124,634 5.4 Indiana $0.98 35 26 $0 $13,817,745 100.0 $31,891,826 130.8 $6,474,076 -79.7 Maryland $0.86 36 36 $6,126,115 $6,101,805 -0.4 $5,973,026 -2.1 $5,124,605 -14.2 Alaska $0.00 n/a n/a $0 $0 0.0 $0 0.0 $0 0.0 Connecticut $0.00 n/a n/a $0 $0 0.0 $0 0.0 $0 0.0 Dist. of Columbia $0.00 n/a n/a $0 $0 0.0 $0 0.0 $0 0.0 Georgia $0.00 n/a n/a $0 $0 0.0 $0 0.0 $0 0.0 Idaho $0.00 n/a n/a $0 $0 0.0 $0 0.0 $0 0.0 Kentucky $0.00 n/a n/a $0 $0 0.0 $0 0.0 $0 0.0 Maine $0.00 n/a n/a $0 $0 0.0 $0 0.0 $0 0.0 Mississippi $0.00 n/a n/a $0 $0 0.0 $0 0.0 $0 0.0 Montana $0.00 n/a n/a $0 $0 0.0 $0 0.0 $0 0.0 Nevada $0.00 n/a n/a $0 $0 0.0 $0 0.0 $0 0.0 Rhode Island $0.00 n/a n/a $0 $0 0.0 $0 0.0 $0 0.0 South Dakota $0.00 n/a n/a $0 $0 0.0 $0 0.0 $0 0.0 Utah $0.00 n/a n/a $0 $0 0.0 $0 0.0 $0 0.0 Vermont $0.00 n/a n/a $5,736,135 $2,880,241 -49.8 $0 -100.0 $0 0.0 West Virginia $0.00 n/a n/a $0 $0 0.0 $0 0.0 $0 0.0 United States $89.84 n/a n/a $10,155,135,255 $14,762,277,785 45.4 $23,130,079,477 56.7 $28,619,132,625 23.7
Notes: Delaware 2012 and Michigan 2014 data were incomplete because the transition to managed care occurred during the year; state estimates were included the following year. Hawaii provided an estimate for managed care expenditures for calendar year 2012. This estimate was used for both FY 2012 and FY 2013. Data do not include expenditures for managed care programs in the following states (years of missing data in parentheses): California (2012, 2014, 2015); Massachusetts (2014); New Mexico (2010 - 2013); North Carolina (2013 - 2015). Data for several states include expenditures for Medicaid Upper Payment Limit programs or provider taxes. IMD services for people under age 21 or age 65 and older, case management, rehabilitative services, private duty nursing, state plan HCBS, and health homes data do not include services provided through managed care organizations. Data are presented based on state reporting. No further explanation of trends is available for the purposes of this report.

Managed Care 1915(c) Waiver Expenditures for Older Adults and People with Physical Disabilities Table BJ
State
FY 2015 Expenditures Per Resident
Rank 2015
Rank 2014
FY 2012 Expenditures
FY 2013 Expenditures
Percent Change 12-13
FY 2014 Expenditures
Percent Change 13-14
FY 2015 Expenditures
Percent Change 14-15
Wisconsin $70.65 1 1 $322,539,848 $352,363,565 9.2 $391,956,268 11.2 $406,854,380 3.8 Minnesota $53.31 2 3 $216,266,233 $205,563,582 -4.9 $230,238,594 12.0 $290,695,948 26.3 Kansas $49.32 3 2 $0 $140,984,102 100.0 $155,006,315 9.9 $142,990,981 -7.8 Ohio $39.95 4 5 $0 $0 0.0 $93,666,788 100.0 $463,222,195 394.5 Florida $32.99 5 4 $216,529,169 $230,712,192 6.6 $446,115,130 93.4 $656,125,647 47.1 Michigan $30.68 6 n/a $0 $0 0.0 $0 0.0 $304,166,604 100.0 Illinois $18.64 7 n/a $0 $0 0.0 $0 0.0 $239,807,460 100.0 Alabama $0.00 n/a n/a $0 $0 0.0 $0 0.0 $0 0.0 Alaska $0.00 n/a n/a $0 $0 0.0 $0 0.0 $0 0.0 Arizona $0.00 n/a n/a $0 $0 0.0 $0 0.0 $0 0.0 Arkansas $0.00 n/a n/a $0 $0 0.0 $0 0.0 $0 0.0 California $0.00 n/a n/a $0 $0 0.0 $0 0.0 $0 0.0 Colorado $0.00 n/a n/a $0 $0 0.0 $0 0.0 $0 0.0 Connecticut $0.00 n/a n/a $0 $0 0.0 $0 0.0 $0 0.0 Delaware $0.00 n/a n/a $0 $0 0.0 $0 0.0 $0 0.0 Dist. of Columbia $0.00 n/a n/a $0 $0 0.0 $0 0.0 $0 0.0 Georgia $0.00 n/a n/a $0 $0 0.0 $0 0.0 $0 0.0 Hawaii $0.00 n/a n/a $0 $0 0.0 $0 0.0 $0 0.0 Idaho $0.00 n/a n/a $0 $0 0.0 $0 0.0 $0 0.0 Indiana $0.00 n/a n/a $0 $0 0.0 $0 0.0 $0 0.0 Iowa $0.00 n/a n/a $0 $0 0.0 $0 0.0 $0 0.0 Kentucky $0.00 n/a n/a $0 $0 0.0 $0 0.0 $0 0.0 Louisiana $0.00 n/a n/a $0 $0 0.0 $0 0.0 $0 0.0 Maine $0.00 n/a n/a $0 $0 0.0 $0 0.0 $0 0.0 Maryland $0.00 n/a n/a $0 $0 0.0 $0 0.0 $0 0.0 Massachusetts $0.00 n/a n/a $0 $265,580,810 100.0 $0 -100.0 $0 0.0 Mississippi $0.00 n/a n/a $0 $0 0.0 $0 0.0 $0 0.0 Missouri $0.00 n/a n/a $0 $0 0.0 $0 0.0 $0 0.0 Montana $0.00 n/a n/a $0 $0 0.0 $0 0.0 $0 0.0 Nebraska $0.00 n/a n/a $0 $0 0.0 $0 0.0 $0 0.0 Nevada $0.00 n/a n/a $0 $0 0.0 $0 0.0 $0 0.0 New Hampshire $0.00 n/a n/a $0 $0 0.0 $0 0.0 $0 0.0 New Jersey $0.00 n/a n/a $0 $0 0.0 $0 0.0 $0 0.0 New Mexico $0.00 n/a n/a $0 $0 0.0 $0 0.0 $0 0.0 New York $0.00 n/a n/a $0 $0 0.0 $0 0.0 $0 0.0 North Carolina $0.00 n/a n/a $0 $0 0.0 $0 0.0 $0 0.0 North Dakota $0.00 n/a n/a $0 $0 0.0 $0 0.0 $0 0.0 Oklahoma $0.00 n/a n/a $0 $0 0.0 $0 0.0 $0 0.0 Oregon $0.00 n/a n/a $0 $0 0.0 $0 0.0 $0 0.0 Pennsylvania $0.00 n/a n/a $0 $0 0.0 $0 0.0 $0 0.0 Rhode Island $0.00 n/a n/a $0 $0 0.0 $0 0.0 $0 0.0 South Carolina $0.00 n/a n/a $0 $0 0.0 $0 0.0 $0 0.0 South Dakota $0.00 n/a n/a $0 $0 0.0 $0 0.0 $0 0.0 Tennessee $0.00 n/a n/a $0 $0 0.0 $0 0.0 $0 0.0 Texas $0.00 n/a n/a $31,272,919 $0 -100.0 $0 0.0 $0 0.0 Utah $0.00 n/a n/a $0 $0 0.0 $0 0.0 $0 0.0 Vermont $0.00 n/a n/a $0 $0 0.0 $0 0.0 $0 0.0 Virginia $0.00 n/a n/a $0 $0 0.0 $0 0.0 $0 0.0 Washington $0.00 n/a n/a $0 $3,060,251 100.0 $0 -100.0 $0 0.0 West Virginia $0.00 n/a n/a $0 $0 0.0 $0 0.0 $0 0.0 Wyoming $0.00 n/a n/a $0 $0 0.0 $0 0.0 $0 0.0 United States $7.86 n/a n/a $786,608,169 $1,198,264,502 52.3 $1,316,983,095 9.9 $2,503,863,215 90.1
Notes: Florida 2015 data include expenditures for state plan home health and personal care expenditures within a managed care program. The state provided an estimate for personal care, home health, and section 1915(c) waiver services. Kansas 2013 data include all section 1915(c) waiver expenditures within a managed care program. Historical information about the waivers in this program indicate most spending was for the waiver for older adults and people with physical disabilities. Massachusetts 2013 data include expenditures for state plan home health expenditures within a managed care program. The state provided an estimate for home health and section 1915(c) waiver services. Michigan 2014 data were incomplete because the transition to a managed care program occurred during that year; state estimates were included starting in 2015. Wisconsin combined its Family Care section 1915(c) waivers in 2015: one waiver targeted people with developmental disabilities and the other targeted older adults and people with physical disabilities. Expenditures by target population are estimated: the percentage of total Family Care spending for each population was assumed to be the 2012 - 2014 average percentage. Data do not include expenditures for managed care programs in New Mexico for 2012 - 2013.

Managed Care 1915(c) Waiver Expenditures for People with Developmental Disabilities Table BK
State
FY 2015 Expenditures Per Resident
Rank 2015
Rank 2014
FY 2012 Expenditures
FY 2013 Expenditures
Percent Change 12-13
FY 2014 Expenditures
Percent Change 13-14
FY 2015 Expenditures
Percent Change 14-15
Wisconsin $102.68 1 1 $502,436,958 $522,471,765 4.0 $541,443,911 3.6 $591,292,686 9.2 Kansas $99.99 2 3 $0 $0 0.0 $148,471,387 100.0 $289,909,830 95.3 North Carolina $72.59 3 2 $138,213,530 $482,107,953 248.8 $670,838,814 39.1 $721,130,980 7.5 Michigan $45.25 4 4 $429,486,167 $418,351,336 -2.6 $439,666,508 5.1 $448,718,822 2.1 Alabama $0.00 n/a n/a $0 $0 0.0 $0 0.0 $0 0.0 Alaska $0.00 n/a n/a $0 $0 0.0 $0 0.0 $0 0.0 Arizona $0.00 n/a n/a $0 $0 0.0 $0 0.0 $0 0.0 Arkansas $0.00 n/a n/a $0 $0 0.0 $0 0.0 $0 0.0 California $0.00 n/a n/a $0 $0 0.0 $0 0.0 $0 0.0 Colorado $0.00 n/a n/a $0 $0 0.0 $0 0.0 $0 0.0 Connecticut $0.00 n/a n/a $0 $0 0.0 $0 0.0 $0 0.0 Delaware $0.00 n/a n/a $0 $0 0.0 $0 0.0 $0 0.0 Dist. of Columbia $0.00 n/a n/a $0 $0 0.0 $0 0.0 $0 0.0 Florida $0.00 n/a n/a $0 $0 0.0 $0 0.0 $0 0.0 Georgia $0.00 n/a n/a $0 $0 0.0 $0 0.0 $0 0.0 Hawaii $0.00 n/a n/a $0 $0 0.0 $0 0.0 $0 0.0 Idaho $0.00 n/a n/a $0 $0 0.0 $0 0.0 $0 0.0 Illinois $0.00 n/a n/a $0 $0 0.0 $0 0.0 $0 0.0 Indiana $0.00 n/a n/a $0 $0 0.0 $0 0.0 $0 0.0 Iowa $0.00 n/a n/a $0 $0 0.0 $0 0.0 $0 0.0 Kentucky $0.00 n/a n/a $0 $0 0.0 $0 0.0 $0 0.0 Louisiana $0.00 n/a n/a $0 $0 0.0 $0 0.0 $0 0.0 Maine $0.00 n/a n/a $0 $0 0.0 $0 0.0 $0 0.0 Maryland $0.00 n/a n/a $0 $0 0.0 $0 0.0 $0 0.0 Massachusetts $0.00 n/a n/a $0 $0 0.0 $0 0.0 $0 0.0 Minnesota $0.00 n/a n/a $0 $0 0.0 $0 0.0 $0 0.0 Mississippi $0.00 n/a n/a $0 $0 0.0 $0 0.0 $0 0.0 Missouri $0.00 n/a n/a $0 $0 0.0 $0 0.0 $0 0.0 Montana $0.00 n/a n/a $0 $0 0.0 $0 0.0 $0 0.0 Nebraska $0.00 n/a n/a $0 $0 0.0 $0 0.0 $0 0.0 Nevada $0.00 n/a n/a $0 $0 0.0 $0 0.0 $0 0.0 New Hampshire $0.00 n/a n/a $0 $0 0.0 $0 0.0 $0 0.0 New Jersey $0.00 n/a n/a $0 $0 0.0 $0 0.0 $0 0.0 New Mexico $0.00 n/a n/a $0 $0 0.0 $0 0.0 $0 0.0 New York $0.00 n/a n/a $0 $0 0.0 $0 0.0 $0 0.0 North Dakota $0.00 n/a n/a $0 $0 0.0 $0 0.0 $0 0.0 Ohio $0.00 n/a n/a $0 $0 0.0 $0 0.0 $0 0.0 Oklahoma $0.00 n/a n/a $0 $0 0.0 $0 0.0 $0 0.0 Oregon $0.00 n/a n/a $0 $0 0.0 $0 0.0 $0 0.0 Pennsylvania $0.00 n/a n/a $0 $0 0.0 $0 0.0 $0 0.0 Rhode Island $0.00 n/a n/a $0 $0 0.0 $0 0.0 $0 0.0 South Carolina $0.00 n/a n/a $0 $0 0.0 $0 0.0 $0 0.0 South Dakota $0.00 n/a n/a $0 $0 0.0 $0 0.0 $0 0.0 Tennessee $0.00 n/a n/a $0 $0 0.0 $0 0.0 $0 0.0 Texas $0.00 n/a n/a $0 $0 0.0 $0 0.0 $0 0.0 Utah $0.00 n/a n/a $0 $0 0.0 $0 0.0 $0 0.0 Vermont $0.00 n/a n/a $0 $0 0.0 $0 0.0 $0 0.0 Virginia $0.00 n/a n/a $0 $0 0.0 $0 0.0 $0 0.0 Washington $0.00 n/a n/a $0 $0 0.0 $0 0.0 $0 0.0 West Virginia $0.00 n/a n/a $0 $0 0.0 $0 0.0 $0 0.0 Wyoming $0.00 n/a n/a $0 $0 0.0 $0 0.0 $0 0.0 United States $6.44 n/a n/a $1,070,136,655 $1,422,931,054 33.0 $1,800,420,620 26.5 $2,051,052,318 13.9
Notes: Wisconsin combined its Family Care section 1915(c) waivers in 2015: one waiver targeted people with developmental disabilities and the other targeted older adults and people with physical disabilities. Expenditures by target population are estimated: the percentage of total Family Care spending for each population was assumed to be the 2012 - 2014 average percentage. Data are presented based on state reporting. No further explanation of trends is available for the purposes of this report.

Managed Care 1915(c) Waiver Expenditures for Other Populations Table BL
State
FY 2015 Expenditures Per Resident
Rank 2015
Rank 2014
FY 2012 Expenditures
FY 2013 Expenditures
Percent Change 12-13
FY 2014 Expenditures
Percent Change 13-14
FY 2015 Expenditures
Percent Change 14-15
Kansas $34.18 1 1 $0 $0 0.0 $76,004,771 100.0 $99,090,952 30.4 Alabama $0.00 n/a n/a $0 $0 0.0 $0 0.0 $0 0.0 Alaska $0.00 n/a n/a $0 $0 0.0 $0 0.0 $0 0.0 Arizona $0.00 n/a n/a $0 $0 0.0 $0 0.0 $0 0.0 Arkansas $0.00 n/a n/a $0 $0 0.0 $0 0.0 $0 0.0 California $0.00 n/a n/a $0 $0 0.0 $0 0.0 $0 0.0 Colorado $0.00 n/a n/a $0 $0 0.0 $0 0.0 $0 0.0 Connecticut $0.00 n/a n/a $0 $0 0.0 $0 0.0 $0 0.0 Delaware $0.00 n/a n/a $0 $0 0.0 $0 0.0 $0 0.0 Dist. of Columbia $0.00 n/a n/a $0 $0 0.0 $0 0.0 $0 0.0 Florida $0.00 n/a n/a $0 $0 0.0 $0 0.0 $0 0.0 Georgia $0.00 n/a n/a $0 $0 0.0 $0 0.0 $0 0.0 Hawaii $0.00 n/a n/a $0 $0 0.0 $0 0.0 $0 0.0 Idaho $0.00 n/a n/a $0 $0 0.0 $0 0.0 $0 0.0 Illinois $0.00 n/a n/a $0 $0 0.0 $0 0.0 $0 0.0 Indiana $0.00 n/a n/a $0 $0 0.0 $0 0.0 $0 0.0 Iowa $0.00 n/a n/a $0 $0 0.0 $0 0.0 $0 0.0 Kentucky $0.00 n/a n/a $0 $0 0.0 $0 0.0 $0 0.0 Louisiana $0.00 n/a n/a $0 $0 0.0 $0 0.0 $0 0.0 Maine $0.00 n/a n/a $0 $0 0.0 $0 0.0 $0 0.0 Maryland $0.00 n/a n/a $0 $0 0.0 $0 0.0 $0 0.0 Massachusetts $0.00 n/a n/a $0 $0 0.0 $0 0.0 $0 0.0 Michigan $0.00 n/a n/a $0 $0 0.0 $0 0.0 $0 0.0 Minnesota $0.00 n/a n/a $0 $0 0.0 $0 0.0 $0 0.0 Mississippi $0.00 n/a n/a $0 $0 0.0 $0 0.0 $0 0.0 Missouri $0.00 n/a n/a $0 $0 0.0 $0 0.0 $0 0.0 Montana $0.00 n/a n/a $0 $0 0.0 $0 0.0 $0 0.0 Nebraska $0.00 n/a n/a $0 $0 0.0 $0 0.0 $0 0.0 Nevada $0.00 n/a n/a $0 $0 0.0 $0 0.0 $0 0.0 New Hampshire $0.00 n/a n/a $0 $0 0.0 $0 0.0 $0 0.0 New Jersey $0.00 n/a n/a $0 $0 0.0 $0 0.0 $0 0.0 New Mexico $0.00 n/a n/a $0 $0 0.0 $0 0.0 $0 0.0 New York $0.00 n/a n/a $0 $0 0.0 $0 0.0 $0 0.0 North Carolina $0.00 n/a n/a $0 $0 0.0 $0 0.0 $0 0.0 North Dakota $0.00 n/a n/a $0 $0 0.0 $0 0.0 $0 0.0 Ohio $0.00 n/a n/a $0 $0 0.0 $0 0.0 $0 0.0 Oklahoma $0.00 n/a n/a $0 $0 0.0 $0 0.0 $0 0.0 Oregon $0.00 n/a n/a $0 $0 0.0 $0 0.0 $0 0.0 Pennsylvania $0.00 n/a n/a $0 $0 0.0 $0 0.0 $0 0.0 Rhode Island $0.00 n/a n/a $0 $0 0.0 $0 0.0 $0 0.0 South Carolina $0.00 n/a n/a $0 $0 0.0 $0 0.0 $0 0.0 South Dakota $0.00 n/a n/a $0 $0 0.0 $0 0.0 $0 0.0 Tennessee $0.00 n/a n/a $0 $0 0.0 $0 0.0 $0 0.0 Texas $0.00 n/a n/a $0 $0 0.0 $0 0.0 $0 0.0 Utah $0.00 n/a n/a $0 $0 0.0 $0 0.0 $0 0.0 Vermont $0.00 n/a n/a $0 $0 0.0 $0 0.0 $0 0.0 Virginia $0.00 n/a n/a $0 $0 0.0 $0 0.0 $0 0.0 Washington $0.00 n/a n/a $0 $0 0.0 $0 0.0 $0 0.0 West Virginia $0.00 n/a n/a $0 $0 0.0 $0 0.0 $0 0.0 Wisconsin $0.00 n/a n/a $0 $0 0.0 $0 0.0 $0 0.0 Wyoming $0.00 n/a n/a $0 $0 0.0 $0 0.0 $0 0.0 United States $0.31 n/a n/a $0 $0 0.0 $76,004,771 100.0 $99,090,952 30.4
Notes: Kansas 2013 data do not include section 1915(c) waiver expenditures within a managed care program. Kansas 2014 and 2015 section 1915(c) data for other populations includes section 1915(c) waiver expenditures for behavioral health services within a managed care program. Data are presented based on state reporting. No further explanation of trends is available for the purposes of this report.

Managed Care HCBS Unspecified for Older Adults and People with Physical Disabilities Table BM
State
FY 2015 Expenditures Per Resident
Rank 2015
Rank 2014
FY 2012 Expenditures
FY 2013 Expenditures
Percent Change 12-13
FY 2014 Expenditures
Percent Change 13-14
FY 2015 Expenditures
Percent Change 14-15
New Mexico $342.63 1 6 $0 $0 0.0 $46,853,589 100.0 $713,711,476 1423.3 Massachusetts $86.55 2 4 $80,275,904 $0 -100.0 $261,016,062 100.0 $584,222,927 123.8 Hawaii $61.90 3 1 $67,442,912 $67,442,912 0.0 $81,234,954 20.4 $87,678,482 7.9 Delaware $56.79 4 3 $24,993,169 $34,640,762 38.6 $39,240,140 13.3 $53,097,934 35.3 Arizona $51.22 5 2 $350,197,720 $345,703,433 -1.3 $356,807,032 3.2 $344,166,060 -3.5 Tennessee $36.66 6 5 $200,907,127 $228,595,035 13.8 $235,855,408 3.2 $239,950,683 1.7 New Jersey $35.29 7 8 $0 $5,357,896 100.0 $74,260,963 1286.0 $314,929,471 324.1 Texas $22.90 8 7 $82,944,882 $410,484,324 394.9 $490,436,357 19.5 $616,947,000 25.8 Michigan $10.28 9 n/a $0 $0 0.0 $0 0.0 $101,957,983 100.0 New York $3.64 10 9 $0 $49,812,991 100.0 $64,465,573 29.4 $71,685,542 11.2 Virginia $0.13 11 10 $0 $0 0.0 $1,920,754 100.0 $1,076,547 -44.0 Alabama $0.00 n/a n/a $0 $0 0.0 $0 0.0 $0 0.0 Alaska $0.00 n/a n/a $0 $0 0.0 $0 0.0 $0 0.0 Arkansas $0.00 n/a n/a $0 $0 0.0 $0 0.0 $0 0.0 California $0.00 n/a n/a $0 $14,939,958 100.0 $0 -100.0 $0 0.0 Colorado $0.00 n/a n/a $0 $0 0.0 $0 0.0 $0 0.0 Connecticut $0.00 n/a n/a $0 $0 0.0 $0 0.0 $0 0.0 Dist. of Columbia $0.00 n/a n/a $0 $0 0.0 $0 0.0 $0 0.0 Florida $0.00 n/a n/a $0 $0 0.0 $0 0.0 $0 0.0 Georgia $0.00 n/a n/a $0 $0 0.0 $0 0.0 $0 0.0 Idaho $0.00 n/a n/a $0 $0 0.0 $0 0.0 $0 0.0 Illinois $0.00 n/a n/a $0 $0 0.0 $0 0.0 $0 0.0 Indiana $0.00 n/a n/a $0 $0 0.0 $0 0.0 $0 0.0 Iowa $0.00 n/a n/a $0 $0 0.0 $0 0.0 $0 0.0 Kansas $0.00 n/a n/a $0 $0 0.0 $0 0.0 $0 0.0 Kentucky $0.00 n/a n/a $0 $0 0.0 $0 0.0 $0 0.0 Louisiana $0.00 n/a n/a $0 $0 0.0 $0 0.0 $0 0.0 Maine $0.00 n/a n/a $0 $0 0.0 $0 0.0 $0 0.0 Maryland $0.00 n/a n/a $0 $0 0.0 $0 0.0 $0 0.0 Minnesota $0.00 n/a n/a $0 $0 0.0 $0 0.0 $0 0.0 Mississippi $0.00 n/a n/a $0 $0 0.0 $0 0.0 $0 0.0 Missouri $0.00 n/a n/a $0 $0 0.0 $0 0.0 $0 0.0 Montana $0.00 n/a n/a $0 $0 0.0 $0 0.0 $0 0.0 Nebraska $0.00 n/a n/a $0 $0 0.0 $0 0.0 $0 0.0 Nevada $0.00 n/a n/a $0 $0 0.0 $0 0.0 $0 0.0 New Hampshire $0.00 n/a n/a $0 $0 0.0 $0 0.0 $0 0.0 North Carolina $0.00 n/a n/a $0 $0 0.0 $0 0.0 $0 0.0 North Dakota $0.00 n/a n/a $0 $0 0.0 $0 0.0 $0 0.0 Ohio $0.00 n/a n/a $0 $0 0.0 $0 0.0 $0 0.0 Oklahoma $0.00 n/a n/a $0 $0 0.0 $0 0.0 $0 0.0 Oregon $0.00 n/a n/a $0 $0 0.0 $0 0.0 $0 0.0 Pennsylvania $0.00 n/a n/a $0 $0 0.0 $0 0.0 $0 0.0 Rhode Island $0.00 n/a n/a $0 $0 0.0 $0 0.0 $0 0.0 South Carolina $0.00 n/a n/a $0 $0 0.0 $0 0.0 $0 0.0 South Dakota $0.00 n/a n/a $0 $0 0.0 $0 0.0 $0 0.0 Utah $0.00 n/a n/a $0 $0 0.0 $0 0.0 $0 0.0 Vermont $0.00 n/a n/a $0 $0 0.0 $0 0.0 $0 0.0 Washington $0.00 n/a 11 $63,397 $0 -100.0 $199,662 100.0 $0 -100.0 West Virginia $0.00 n/a n/a $0 $0 0.0 $0 0.0 $0 0.0 Wisconsin $0.00 n/a n/a $0 $0 0.0 $0 0.0 $0 0.0 Wyoming $0.00 n/a n/a $0 $0 0.0 $0 0.0 $0 0.0 United States $9.82 n/a n/a $806,825,111 $1,156,977,311 43.4 $1,652,290,494 42.8 $3,129,424,105 89.4
Notes: HCBS - unspecified refers to HCBS provided through managed care organizations that were not authorized under another state plan or waiver authority. Data do not include expenditures for a managed care program in California (2012, 2014, 2015). Arizona 2012 - 2014 data, California 2013 data, and New Mexico 2015 data include expenditures for state plan personal care and home health expenditures within managed care programs. States provided estimates for all non-institutional HCBS, which is used in this table. Hawaii provided an estimate for calendar year 2012. This estimate was used for both FY 2012 and FY 2013. Data are presented based on state reporting. No further explanation of trends is available for the purposes of this report.

Managed Care HCBS Unspecified for People with Developmental Disabilities Table BN
State
FY 2015 Expenditures Per Resident
Rank 2015
Rank 2014
FY 2012 Expenditures
FY 2013 Expenditures
Percent Change 12-13
FY 2014 Expenditures
Percent Change 13-14
FY 2015 Expenditures
Percent Change 14-15
Arizona $117.81 1 1 $682,140,186 $717,014,497 5.1 $783,495,309 9.3 $791,690,020 1.0 Pennsylvania $0.43 2 2 $3,506,624 $4,766,268 35.9 $5,578,116 17.0 $5,562,201 -0.3 Alabama $0.00 n/a n/a $0 $0 0.0 $0 0.0 $0 0.0 Alaska $0.00 n/a n/a $0 $0 0.0 $0 0.0 $0 0.0 Arkansas $0.00 n/a n/a $0 $0 0.0 $0 0.0 $0 0.0 California $0.00 n/a n/a $0 $0 0.0 $0 0.0 $0 0.0 Colorado $0.00 n/a n/a $0 $0 0.0 $0 0.0 $0 0.0 Connecticut $0.00 n/a n/a $0 $0 0.0 $0 0.0 $0 0.0 Delaware $0.00 n/a n/a $0 $0 0.0 $0 0.0 $0 0.0 Dist. of Columbia $0.00 n/a n/a $0 $0 0.0 $0 0.0 $0 0.0 Florida $0.00 n/a n/a $0 $0 0.0 $0 0.0 $0 0.0 Georgia $0.00 n/a n/a $0 $0 0.0 $0 0.0 $0 0.0 Hawaii $0.00 n/a n/a $0 $0 0.0 $0 0.0 $0 0.0 Idaho $0.00 n/a n/a $0 $0 0.0 $0 0.0 $0 0.0 Illinois $0.00 n/a n/a $0 $0 0.0 $0 0.0 $0 0.0 Indiana $0.00 n/a n/a $0 $0 0.0 $0 0.0 $0 0.0 Iowa $0.00 n/a n/a $0 $0 0.0 $0 0.0 $0 0.0 Kansas $0.00 n/a n/a $0 $0 0.0 $0 0.0 $0 0.0 Kentucky $0.00 n/a n/a $0 $0 0.0 $0 0.0 $0 0.0 Louisiana $0.00 n/a n/a $0 $0 0.0 $0 0.0 $0 0.0 Maine $0.00 n/a n/a $0 $0 0.0 $0 0.0 $0 0.0 Maryland $0.00 n/a n/a $0 $0 0.0 $0 0.0 $0 0.0 Massachusetts $0.00 n/a n/a $0 $0 0.0 $0 0.0 $0 0.0 Michigan $0.00 n/a n/a $0 $0 0.0 $0 0.0 $0 0.0 Minnesota $0.00 n/a n/a $0 $0 0.0 $0 0.0 $0 0.0 Mississippi $0.00 n/a n/a $0 $0 0.0 $0 0.0 $0 0.0 Missouri $0.00 n/a n/a $0 $0 0.0 $0 0.0 $0 0.0 Montana $0.00 n/a n/a $0 $0 0.0 $0 0.0 $0 0.0 Nebraska $0.00 n/a n/a $0 $0 0.0 $0 0.0 $0 0.0 Nevada $0.00 n/a n/a $0 $0 0.0 $0 0.0 $0 0.0 New Hampshire $0.00 n/a n/a $0 $0 0.0 $0 0.0 $0 0.0 New Jersey $0.00 n/a n/a $0 $0 0.0 $0 0.0 $0 0.0 New Mexico $0.00 n/a n/a $0 $0 0.0 $0 0.0 $0 0.0 New York $0.00 n/a n/a $0 $0 0.0 $0 0.0 $0 0.0 North Carolina $0.00 n/a n/a $0 $0 0.0 $0 0.0 $0 0.0 North Dakota $0.00 n/a n/a $0 $0 0.0 $0 0.0 $0 0.0 Ohio $0.00 n/a n/a $0 $0 0.0 $0 0.0 $0 0.0 Oklahoma $0.00 n/a n/a $0 $0 0.0 $0 0.0 $0 0.0 Oregon $0.00 n/a n/a $0 $0 0.0 $0 0.0 $0 0.0 Rhode Island $0.00 n/a n/a $0 $0 0.0 $0 0.0 $0 0.0 South Carolina $0.00 n/a n/a $0 $0 0.0 $0 0.0 $0 0.0 South Dakota $0.00 n/a n/a $0 $0 0.0 $0 0.0 $0 0.0 Tennessee $0.00 n/a n/a $0 $0 0.0 $0 0.0 $0 0.0 Texas $0.00 n/a n/a $0 $0 0.0 $0 0.0 $0 0.0 Utah $0.00 n/a n/a $0 $0 0.0 $0 0.0 $0 0.0 Vermont $0.00 n/a n/a $0 $0 0.0 $0 0.0 $0 0.0 Virginia $0.00 n/a n/a $0 $0 0.0 $0 0.0 $0 0.0 Washington $0.00 n/a n/a $0 $0 0.0 $0 0.0 $0 0.0 West Virginia $0.00 n/a n/a $0 $0 0.0 $0 0.0 $0 0.0 Wisconsin $0.00 n/a n/a $0 $0 0.0 $0 0.0 $0 0.0 Wyoming $0.00 n/a n/a $0 $0 0.0 $0 0.0 $0 0.0 United States $2.50 n/a n/a $685,646,810 $721,780,765 5.3 $789,073,425 9.3 $797,252,221 1.0
Notes: HCBS - unspecified refers to HCBS provided through managed care organizations that were not authorized under another state plan or waiver authority. Data are presented based on state reporting. No further explanation of trends is available for the purposes of this report.

Managed Care HCBS Unspecified for Other Populations Table BO
State
FY 2015 Expenditures Per Resident
Rank 2015
Rank 2014
FY 2012 Expenditures
FY 2013 Expenditures
Percent Change 12-13
FY 2014 Expenditures
Percent Change 13-14
FY 2015 Expenditures
Percent Change 14-15
New Jersey $73.22 1 1 $0 $330,117,925 100.0 $665,873,364 101.7 $653,466,794 -1.9 Iowa $57.84 2 3 $0 $106,981,343 100.0 $174,954,746 63.5 $179,782,628 2.8 Massachusetts $47.52 3 n/a $0 $0 0.0 $0 0.0 $320,788,504 100.0 New Hampshire $44.42 4 4 $0 $0 0.0 $40,371,724 100.0 $59,022,410 46.2 Texas $19.46 5 6 $0 $170,548,294 100.0 $433,251,009 154.0 $524,421,780 21.0 Illinois $6.79 6 7 $0 $26,750,175 100.0 $194,155,822 625.8 $87,341,740 -55.0 Louisiana $3.53 7 10 $0 $70,635,791 100.0 $5,842,884 -91.7 $16,413,994 180.9 California $2.85 8 8 $133,617 $238,988,888 178761.1 $268,798,488 12.5 $110,175,419 -59.0 Indiana $0.29 9 9 $0 $4,417,951 100.0 $9,787,712 121.5 $1,897,080 -80.6 Alabama $0.00 n/a n/a $0 $0 0.0 $0 0.0 $0 0.0 Alaska $0.00 n/a n/a $0 $0 0.0 $0 0.0 $0 0.0 Arizona $0.00 n/a 11 $0 $0 0.0 $0 0.0 $0 0.0 Arkansas $0.00 n/a n/a $0 $0 0.0 $0 0.0 $0 0.0 Colorado $0.00 n/a n/a $0 $0 0.0 $0 0.0 $0 0.0 Connecticut $0.00 n/a n/a $0 $0 0.0 $0 0.0 $0 0.0 Delaware $0.00 n/a n/a $0 $0 0.0 $0 0.0 $0 0.0 Dist. of Columbia $0.00 n/a n/a $0 $0 0.0 $0 0.0 $0 0.0 Florida $0.00 n/a n/a $0 $0 0.0 $0 0.0 $0 0.0 Georgia $0.00 n/a n/a $0 $0 0.0 $0 0.0 $0 0.0 Hawaii $0.00 n/a n/a $0 $0 0.0 $0 0.0 $0 0.0 Idaho $0.00 n/a n/a $0 $0 0.0 $0 0.0 $0 0.0 Kansas $0.00 n/a n/a $0 $0 0.0 $0 0.0 $0 0.0 Kentucky $0.00 n/a n/a $0 $0 0.0 $0 0.0 $0 0.0 Maine $0.00 n/a n/a $0 $0 0.0 $0 0.0 $0 0.0 Maryland $0.00 n/a n/a $0 $0 0.0 $0 0.0 $0 0.0 Michigan $0.00 n/a n/a $0 $0 0.0 $0 0.0 $0 0.0 Minnesota $0.00 n/a n/a $0 $0 0.0 $0 0.0 $0 0.0 Mississippi $0.00 n/a n/a $0 $0 0.0 $0 0.0 $0 0.0 Missouri $0.00 n/a n/a $0 $0 0.0 $0 0.0 $0 0.0 Montana $0.00 n/a n/a $0 $0 0.0 $0 0.0 $0 0.0 Nebraska $0.00 n/a n/a $0 $0 0.0 $0 0.0 $0 0.0 Nevada $0.00 n/a n/a $0 $0 0.0 $0 0.0 $0 0.0 New Mexico $0.00 n/a n/a $0 $0 0.0 $0 0.0 $0 0.0 New York $0.00 n/a 2 $0 $0 0.0 $1,185,192,594 100.0 $0 -100.0 North Carolina $0.00 n/a n/a $0 $0 0.0 $0 0.0 $0 0.0 North Dakota $0.00 n/a n/a $0 $0 0.0 $0 0.0 $0 0.0 Ohio $0.00 n/a 5 $0 $26,543,658 100.0 $309,637,903 1066.5 $0 -100.0 Oklahoma $0.00 n/a n/a $0 $0 0.0 $0 0.0 $0 0.0 Oregon $0.00 n/a n/a $0 $0 0.0 $0 0.0 $0 0.0 Pennsylvania $0.00 n/a n/a $0 $0 0.0 $0 0.0 $0 0.0 Rhode Island $0.00 n/a n/a $0 $0 0.0 $0 0.0 $0 0.0 South Carolina $0.00 n/a n/a $0 $0 0.0 $0 0.0 $0 0.0 South Dakota $0.00 n/a n/a $0 $0 0.0 $0 0.0 $0 0.0 Tennessee $0.00 n/a n/a $0 $0 0.0 $0 0.0 $0 0.0 Utah $0.00 n/a n/a $0 $0 0.0 $0 0.0 $0 0.0 Vermont $0.00 n/a n/a $0 $0 0.0 $0 0.0 $0 0.0 Virginia $0.00 n/a n/a $0 $0 0.0 $0 0.0 $0 0.0 Washington $0.00 n/a n/a $0 $0 0.0 $0 0.0 $0 0.0 West Virginia $0.00 n/a n/a $0 $0 0.0 $0 0.0 $0 0.0 Wisconsin $0.00 n/a n/a $0 $0 0.0 $0 0.0 $0 0.0 Wyoming $0.00 n/a n/a $0 $0 0.0 $0 0.0 $0 0.0 United States $6.13 n/a n/a $133,617 $974,984,025 729585.6 $3,287,866,247 237.2 $1,953,310,349 -40.6
Notes: HCBS - unspecified refers to HCBS provided through managed care organizations that were not authorized under another state plan or waiver authority. Data are presented based on state reporting. No further explanation of trends is available for the purposes of this report.

Alabama Table 1
Service Type FY 2012 FY 2013
Percent Change 12-13 FY 2014
Percent Change 13-14 FY 2015
Percent Change 14-15
FY 2015 Expenditures Per Resident
Total-Older Adults, People with PD $1,084,893,948 $1,064,900,459 -1.8 $1,074,986,200 0.9 $1,099,576,779 2.3 $227.03 Nursing facilities $920,037,327 $902,847,111 -1.9 $928,618,105 2.9 $944,140,551 1.7 $194.94 Personal care $0 $0 0.0 $0 0.0 $0 0.0 $0.00 1915(c) waivers - AD $97,849,822 $86,108,140 -12.0 $71,963,209 -16.4 $74,293,683 3.2 $15.34 Home health $60,268,125 $66,231,253 9.9 $63,381,172 -4.3 $69,187,193 9.2 $14.29 Community first choice $0 $0 0.0 $0 0.0 $0 0.0 $0.00 HCBS - unspecified - AD $0 $0 0.0 $0 0.0 $0 0.0 $0.00 PACE $1,032,300 $4,125,113 299.6 $6,119,891 48.4 $6,801,420 11.1 $1.40 Private duty nursing $5,706,374 $5,588,842 -2.1 $4,903,823 -12.3 $5,153,932 5.1 $1.06 Self-directed PAS - alternative to 1915(c) $0 $0 0.0 $0 0.0 $0 0.0 $0.00 Self-directed PAS - alternative to personal care $0 $0 0.0 $0 0.0 $0 0.0 $0.00 Health homes - AD $0 $0 0.0 $0 0.0 $0 0.0 $0.00 State plan HCBS - AD $0 $0 0.0 $0 0.0 $0 0.0 $0.00 Total-People with DD $295,752,004 $306,323,017 3.6 $324,626,134 6.0 $326,230,530 0.5 $67.36 ICF/IID - public $8,073,583 -$39,330 -100.5 $0 -100.0 $405,000 100.0 $0.08 ICF/IID - private $2,512,793 $1,833,679 -27.0 $1,582,232 -13.7 $1,655,212 4.6 $0.34 1915(c) waivers - DD $285,165,628 $304,528,668 6.8 $323,043,902 6.1 $324,170,318 0.3 $66.93 HCBS - unspecified - DD $0 $0 0.0 $0 0.0 $0 0.0 $0.00 State plan HCBS - DD $0 $0 0.0 $0 0.0 $0 0.0 $0.00 Total-Behavioral Health Services $241,581,439 $233,229,104 -3.5 $237,225,478 1.7 $259,944,007 9.6 $53.67 IMD for people under age 21 or age 65 and older $65,570,182 $67,490,496 2.9 $71,333,341 5.7 $76,251,564 6.9 $15.74 Mental health facilities DSH $3,301,620 $0 -100.0 $155,073 100.0 $0 -100.0 $0.00 Rehabilitative services $172,709,637 $165,738,608 -4.0 $165,737,064 0.0 $183,692,443 10.8 $37.93 1915(c) waivers - BHS $0 $0 0.0 $0 0.0 $0 0.0 $0.00 State plan HCBS - BHS $0 $0 0.0 $0 0.0 $0 0.0 $0.00 Health homes - BHS $0 $0 0.0 $0 0.0 $0 0.0 $0.00 Total-Other/Multiple Populations $68,671,915 $76,104,274 10.8 $74,616,632 -2.0 $79,774,237 6.9 $16.47 Case management $63,407,224 $56,238,006 -11.3 $50,674,550 -9.9 $50,416,030 -0.5 $10.41 1915(c) waivers - other $867,326 $601,557 -30.6 $512,804 -14.8 $462,208 -9.9 $0.10 HCBS - unspecified - other $0 $0 0.0 $0 0.0 $0 0.0 $0.00 Health homes - other or multiple $4,397,365 $19,264,711 338.1 $23,041,180 19.6 $26,516,633 15.1 $5.48 Institutional MLTSS – unspecified $0 $0 0.0 $0 0.0 $0 0.0 $0.00 MFP demonstration $0 $0 0.0 $388,098 100.0 $2,379,366 513.1 $0.49 Total LTSS $1,690,899,306 $1,680,556,854 -0.6 $1,711,454,444 1.8 $1,765,525,553 3.2 $364.54 Total Institutional LTSS $999,495,505 $972,131,956 -2.7 $1,001,688,751 3.0 $1,022,452,327 2.1 $211.11 Total HCBS $691,403,801 $708,424,898 2.5 $709,765,693 0.2 $743,073,226 4.7 $153.43 Total Medicaid (all services) $4,894,500,814 $5,032,612,086 2.8 $5,168,579,944 2.7 $5,352,583,936 3.6 $1,105.17
Percentages FY 2012 FY 2013 FY 2014 FY 2015
Total LTSS as a Percentage of Total Medicaid 34.5% 33.4% 33.1% 33.0% Percentage of LTSS that is HCBS 40.9% 42.2% 41.5% 42.1% Percentage of LTSS that is HCBS – AD 15.2% 15.2% 13.6% 14.1% Percentage of LTSS that is HCBS – DD 96.4% 99.4% 99.5% 99.4% Percentage of LTSS that is HCBS – BHS 71.5% 71.1% 69.9% 70.7%
Notes: Expenditures are total Medicaid spending, including both federal and state payments. Data for several states include expenditures for Medicaid Upper Payment Limit programs or provider taxes. Institutional MLTSS - unspecified refers to institutional LTSS provided through managed care organizations and reported on the CMS-64. The CMS-64 does not specify the type of institutional LTSS. HCBS - unspecified refers to HCBS provided through managed care organizations and fee-for-service HCBS provided in section 1115 demonstrations that were not authorized under another state plan or waiver authority. IMD for people under age 21 or age 65 and older, case management, rehabilitative services, private duty nursing, state plan HCBS, and health homes data do not include services provided through managed care organizations.

Alaska Table 2
Service Type FY 2012 FY 2013
Percent Change 12-13 FY 2014
Percent Change 13-14 FY 2015
Percent Change 14-15
FY 2015 Expenditures Per Resident
Total-Older Adults, People with PD $345,337,210 $344,042,438 -0.4 $291,880,095 -15.2 $354,966,519 21.6 $481.83 Nursing facilities $130,958,260 $126,926,088 -3.1 $109,824,410 -13.5 $181,744,927 65.5 $246.70 Personal care $122,006,265 $122,015,945 0.0 $99,133,561 -18.8 $84,601,638 -14.7 $114.84 1915(c) waivers - AD $91,702,682 $94,323,779 2.9 $82,251,861 -12.8 $87,681,210 6.6 $119.02 Home health $670,003 $776,626 15.9 $670,263 -13.7 $938,744 40.1 $1.27 Community first choice $0 $0 0.0 $0 0.0 $0 0.0 $0.00 HCBS - unspecified - AD $0 $0 0.0 $0 0.0 $0 0.0 $0.00 PACE $0 $0 0.0 $0 0.0 $0 0.0 $0.00 Private duty nursing $0 $0 0.0 $0 0.0 $0 0.0 $0.00 Self-directed PAS - alternative to 1915(c) $0 $0 0.0 $0 0.0 $0 0.0 $0.00 Self-directed PAS - alternative to personal care $0 $0 0.0 $0 0.0 $0 0.0 $0.00 Health homes - AD $0 $0 0.0 $0 0.0 $0 0.0 $0.00 State plan HCBS - AD $0 $0 0.0 $0 0.0 $0 0.0 $0.00 Total-People with DD $133,194,153 $148,767,391 11.7 $141,787,980 -4.7 $175,155,081 23.5 $237.75 ICF/IID - public $0 $0 0.0 $0 0.0 $0 0.0 $0.00 ICF/IID - private $2,509,407 $3,191,791 27.2 $3,055,280 -4.3 $2,838,897 -7.1 $3.85 1915(c) waivers - DD $130,684,746 $145,575,600 11.4 $138,732,700 -4.7 $172,316,184 24.2 $233.90 HCBS - unspecified - DD $0 $0 0.0 $0 0.0 $0 0.0 $0.00 State plan HCBS - DD $0 $0 0.0 $0 0.0 $0 0.0 $0.00 Total-Behavioral Health Services $31,168,495 $30,948,586 -0.7 $30,426,779 -1.7 $28,261,166 -7.1 $38.36 IMD for people under age 21 or age 65 and older $17,400,719 $16,822,847 -3.3 $16,089,153 -4.4 $17,335,895 7.7 $23.53 Mental health facilities DSH $13,767,776 $14,125,739 2.6 $14,337,626 1.5 $10,925,271 -23.8 $14.83 Rehabilitative services $0 $0 0.0 $0 0.0 $0 0.0 $0.00 1915(c) waivers - BHS $0 $0 0.0 $0 0.0 $0 0.0 $0.00 State plan HCBS - BHS $0 $0 0.0 $0 0.0 $0 0.0 $0.00 Health homes - BHS $0 $0 0.0 $0 0.0 $0 0.0 $0.00 Total-Other/Multiple Populations $12,197,359 $11,112,754 -8.9 $9,742,556 -12.3 $13,283,841 36.3 $18.03 Case management $0 $0 0.0 $0 0.0 $0 0.0 $0.00 1915(c) waivers - other $12,197,359 $11,112,754 -8.9 $9,742,556 -12.3 $13,283,841 36.3 $18.03 HCBS - unspecified - other $0 $0 0.0 $0 0.0 $0 0.0 $0.00 Health homes - other or multiple $0 $0 0.0 $0 0.0 $0 0.0 $0.00 Institutional MLTSS – unspecified $0 $0 0.0 $0 0.0 $0 0.0 $0.00 MFP demonstration $0 $0 0.0 $0 0.0 $0 0.0 $0.00 Total LTSS $521,897,217 $534,871,169 2.5 $473,837,410 -11.4 $571,666,607 20.6 $775.98 Total Institutional LTSS $164,636,162 $161,066,465 -2.2 $143,306,469 -11.0 $212,844,990 48.5 $288.91 Total HCBS $357,261,055 $373,804,704 4.6 $330,530,941 -11.6 $358,821,617 8.6 $487.06 Total Medicaid (all services) $1,351,112,877 $1,345,045,986 -0.4 $1,302,979,034 -3.1 $1,564,778,066 20.1 $2,124.02
Percentages FY 2012 FY 2013 FY 2014 FY 2015
Total LTSS as a Percentage of Total Medicaid 38.6% 39.8% 36.4% 36.5% Percentage of LTSS that is HCBS 68.5% 69.9% 69.8% 62.8% Percentage of LTSS that is HCBS – AD 62.1% 63.1% 62.4% 48.8% Percentage of LTSS that is HCBS – DD 98.1% 97.9% 97.8% 98.4% Percentage of LTSS that is HCBS – BHS 0.0% 0.0% 0.0% 0.0%
Notes: Expenditures are total Medicaid spending, including both federal and state payments. Data for several states include expenditures for Medicaid Upper Payment Limit programs or provider taxes. Institutional MLTSS - unspecified refers to institutional LTSS provided through managed care organizations and reported on the CMS-64. The CMS-64 does not specify the type of institutional LTSS. HCBS - unspecified refers to HCBS provided through managed care organizations and fee-for-service HCBS provided in section 1115 demonstrations that were not authorized under another state plan or waiver authority. IMD for people under age 21 or age 65 and older, case management, rehabilitative services, private duty nursing, state plan HCBS, and health homes data do not include services provided through managed care organizations.

Arizona Table 3
Service Type FY 2012 FY 2013
Percent Change 12-13 FY 2014
Percent Change 13-14 FY 2015
Percent Change 14-15
FY 2015 Expenditures Per Resident
Total-Older Adults, People with PD $853,719,369 $792,469,468 -7.2 $786,972,975 -0.7 $818,578,926 4.0 $121.81 Nursing facilities $497,497,992 $440,882,892 -11.4 $425,010,024 -3.6 $448,951,277 5.6 $66.81 Personal care $5,205,225 $5,216,440 0.2 $4,420,166 -15.3 $1,329,793 -69.9 $0.20 1915(c) waivers - AD $0 $0 0.0 $0 0.0 $0 0.0 $0.00 Home health $818,432 $666,703 -18.5 $735,753 10.4 $24,131,796 3179.9 $3.59 Community first choice $0 $0 0.0 $0 0.0 $0 0.0 $0.00 HCBS - unspecified - AD $350,197,720 $345,703,433 -1.3 $356,807,032 3.2 $344,166,060 -3.5 $51.22 PACE $0 $0 0.0 $0 0.0 $0 0.0 $0.00 Private duty nursing $0 $0 0.0 $0 0.0 $0 0.0 $0.00 Self-directed PAS - alternative to 1915(c) $0 $0 0.0 $0 0.0 $0 0.0 $0.00 Self-directed PAS - alternative to personal care $0 $0 0.0 $0 0.0 $0 0.0 $0.00 Health homes - AD $0 $0 0.0 $0 0.0 $0 0.0 $0.00 State plan HCBS - AD $0 $0 0.0 $0 0.0 $0 0.0 $0.00 Total-People with DD $708,984,946 $743,964,029 4.9 $813,253,901 9.3 $819,202,520 0.7 $121.91 ICF/IID - public $26,844,760 $26,949,532 0.4 $29,758,592 10.4 $27,512,500 -7.5 $4.09 ICF/IID - private $0 $0 0.0 $0 0.0 $0 0.0 $0.00 1915(c) waivers - DD $0 $0 0.0 $0 0.0 $0 0.0 $0.00 HCBS - unspecified - DD $682,140,186 $717,014,497 5.1 $783,495,309 9.3 $791,690,020 1.0 $117.81 State plan HCBS - DD $0 $0 0.0 $0 0.0 $0 0.0 $0.00 Total-Behavioral Health Services $36,250,589 $36,895,825 1.8 $37,948,692 2.9 $39,548,043 4.2 $5.89 IMD for people under age 21 or age 65 and older $1,824,966 $2,235,619 22.5 $2,066,446 -7.6 $1,924,798 -6.9 $0.29 Mental health facilities DSH $27,502,389 $28,474,900 3.5 $28,474,900 0.0 $28,474,900 0.0 $4.24 Rehabilitative services $6,923,234 $6,185,306 -10.7 $7,407,346 19.8 $9,148,345 23.5 $1.36 1915(c) waivers - BHS $0 $0 0.0 $0 0.0 $0 0.0 $0.00 State plan HCBS - BHS $0 $0 0.0 $0 0.0 $0 0.0 $0.00 Health homes - BHS $0 $0 0.0 $0 0.0 $0 0.0 $0.00 Total-Other/Multiple Populations $0 $0 0.0 $1 100.0 $0 -100.0 $0.00 Case management $0 $0 0.0 $0 0.0 $0 0.0 $0.00 1915(c) waivers - other $0 $0 0.0 $0 0.0 $0 0.0 $0.00 HCBS - unspecified - other $0 $0 0.0 $1 100.0 $0 -100.0 $0.00 Health homes - other or multiple $0 $0 0.0 $0 0.0 $0 0.0 $0.00 Institutional MLTSS – unspecified $0 $0 0.0 $0 0.0 $0 0.0 $0.00 MFP demonstration $0 $0 0.0 $0 0.0 $0 0.0 $0.00 Total LTSS $1,598,954,904 $1,573,329,322 -1.6 $1,638,175,569 4.1 $1,677,329,489 2.4 $249.60 Total Institutional LTSS $553,670,107 $498,542,943 -10.0 $485,309,962 -2.7 $506,863,475 4.4 $75.43 Total HCBS $1,045,284,797 $1,074,786,379 2.8 $1,152,865,607 7.3 $1,170,466,014 1.5 $174.18 Total Medicaid (all services) $8,228,228,293 $8,658,472,418 5.2 $9,163,994,502 5.8 $10,518,023,254 14.8 $1,565.18
Percentages FY 2012 FY 2013 FY 2014 FY 2015
Total LTSS as a Percentage of Total Medicaid 19.4% 18.2% 17.9% 15.9% Percentage of LTSS that is HCBS 65.4% 68.3% 70.4% 69.8% Percentage of LTSS that is HCBS – AD 41.7% 44.4% 46.0% 45.2% Percentage of LTSS that is HCBS – DD 96.2% 96.4% 96.3% 96.6% Percentage of LTSS that is HCBS – BHS 19.1% 16.8% 19.5% 23.1%
Notes: Expenditures are total Medicaid spending, including both federal and state payments. Data for several states include expenditures for Medicaid Upper Payment Limit programs or provider taxes. Institutional MLTSS - unspecified refers to institutional LTSS provided through managed care organizations and reported on the CMS-64. The CMS-64 does not specify the type of institutional LTSS. HCBS - unspecified refers to HCBS provided through managed care organizations and fee-for-service HCBS provided in section 1115 demonstrations that were not authorized under another state plan or waiver authority. IMD for people under age 21 or age 65 and older, case management, rehabilitative services, private duty nursing, state plan HCBS, and health homes data do not include services provided through managed care organizations.

Arkansas Table 4
Service Type FY 2012 FY 2013
Percent Change 12-13 FY 2014
Percent Change 13-14 FY 2015
Percent Change 14-15
FY 2015 Expenditures Per Resident
Total-Older Adults, People with PD $973,089,575 $956,979,754 -1.7 $985,745,954 3.0 $1,000,996,430 1.5 $337.39 Nursing facilities $664,352,720 $641,411,420 -3.5 $667,625,722 4.1 $661,359,518 -0.9 $222.91 Personal care $86,074,621 $90,422,876 5.1 $96,232,122 6.4 $101,522,932 5.5 $34.22 1915(c) waivers - AD $118,122,767 $116,814,352 -1.1 $114,445,222 -2.0 $118,859,073 3.9 $40.06 Home health $63,741,813 $65,966,511 3.5 $64,878,504 -1.6 $73,106,703 12.7 $24.64 Community first choice $0 $0 0.0 $0 0.0 $0 0.0 $0.00 HCBS - unspecified - AD $0 $0 0.0 $0 0.0 $0 0.0 $0.00 PACE $3,889,642 $5,405,993 39.0 $6,355,149 17.6 $6,847,209 7.7 $2.31 Private duty nursing $9,501,732 $9,156,451 -3.6 $9,617,937 5.0 $8,538,024 -11.2 $2.88 Self-directed PAS - alternative to 1915(c) $0 $0 0.0 $0 0.0 $0 0.0 $0.00 Self-directed PAS - alternative to personal care $27,406,280 $27,802,151 1.4 $26,591,298 -4.4 $30,762,971 15.7 $10.37 Health homes - AD $0 $0 0.0 $0 0.0 $0 0.0 $0.00 State plan HCBS - AD $0 $0 0.0 $0 0.0 $0 0.0 $0.00 Total-People with DD $339,782,035 $340,981,989 0.4 $364,698,004 7.0 $380,476,668 4.3 $128.24 ICF/IID - public $145,157,278 $139,178,913 -4.1 $152,769,374 9.8 $153,503,274 0.5 $51.74 ICF/IID - private $23,382,876 $24,012,904 2.7 $24,708,062 2.9 $25,077,486 1.5 $8.45 1915(c) waivers - DD $171,241,881 $177,790,172 3.8 $187,220,568 5.3 $201,895,908 7.8 $68.05 HCBS - unspecified - DD $0 $0 0.0 $0 0.0 $0 0.0 $0.00 State plan HCBS - DD $0 $0 0.0 $0 0.0 $0 0.0 $0.00 Total-Behavioral Health Services $469,815,259 $551,801,431 17.5 $633,068,118 14.7 $596,647,204 -5.8 $201.10 IMD for people under age 21 or age 65 and older $156,080,025 $159,102,680 1.9 $152,742,606 -4.0 $116,487,648 -23.7 $39.26 Mental health facilities DSH $819,350 $819,350 0.0 $819,350 0.0 $0 -100.0 $0.00 Rehabilitative services $312,915,884 $391,879,401 25.2 $479,506,162 22.4 $480,159,556 0.1 $161.84 1915(c) waivers - BHS $0 $0 0.0 $0 0.0 $0 0.0 $0.00 State plan HCBS - BHS $0 $0 0.0 $0 0.0 $0 0.0 $0.00 Health homes - BHS $0 $0 0.0 $0 0.0 $0 0.0 $0.00 Total-Other/Multiple Populations $9,575,463 $10,459,497 9.2 $9,435,465 -9.8 $12,670,088 34.3 $4.27 Case management $2,522,319 $3,445,998 36.6 $3,749,582 8.8 $4,192,129 11.8 $1.41 1915(c) waivers - other $0 $0 0.0 $0 0.0 $0 0.0 $0.00 HCBS - unspecified - other $0 $0 0.0 $0 0.0 $0 0.0 $0.00 Health homes - other or multiple $0 $0 0.0 $0 0.0 $0 0.0 $0.00 Institutional MLTSS – unspecified $0 $0 0.0 $0 0.0 $0 0.0 $0.00 MFP demonstration $7,053,144 $7,013,499 -0.6 $5,685,883 -18.9 $8,477,959 49.1 $2.86 Total LTSS $1,792,262,332 $1,860,222,671 3.8 $1,992,947,541 7.1 $1,990,790,390 -0.1 $671.00 Total Institutional LTSS $989,792,249 $964,525,267 -2.6 $998,665,114 3.5 $956,427,926 -4.2 $322.36 Total HCBS $802,470,083 $895,697,404 11.6 $994,282,427 11.0 $1,034,362,464 4.0 $348.63 Total Medicaid (all services) $4,190,511,392 $4,203,226,120 0.3 $4,867,029,421 15.8 $5,537,200,521 13.8 $1,866.32
Percentages FY 2012 FY 2013 FY 2014 FY 2015
Total LTSS as a Percentage of Total Medicaid 42.8% 44.3% 40.9% 36.0% Percentage of LTSS that is HCBS 44.8% 48.2% 49.9% 52.0% Percentage of LTSS that is HCBS – AD 31.7% 33.0% 32.3% 33.9% Percentage of LTSS that is HCBS – DD 50.4% 52.1% 51.3% 53.1% Percentage of LTSS that is HCBS – BHS 66.6% 71.0% 75.7% 80.5%
Notes: Expenditures are total Medicaid spending, including both federal and state payments. Data for several states include expenditures for Medicaid Upper Payment Limit programs or provider taxes. Institutional MLTSS - unspecified refers to institutional LTSS provided through managed care organizations and reported on the CMS-64. The CMS-64 does not specify the type of institutional LTSS. HCBS - unspecified refers to HCBS provided through managed care organizations and fee-for-service HCBS provided in section 1115 demonstrations that were not authorized under another state plan or waiver authority. IMD for people under age 21 or age 65 and older, case management, rehabilitative services, private duty nursing, state plan HCBS, and health homes data do not include services provided through managed care organizations.

California Table 5
Service Type FY 2012 FY 2013
Percent Change 12-13 FY 2014
Percent Change 13-14 FY 2015
Percent Change 14-15
FY 2015 Expenditures Per Resident
Total-Older Adults, People with PD $9,956,819,495 $10,572,907,665 6.2 $10,500,502,343 -0.7 $9,004,330,707 -14.2 $232.79 Nursing facilities $4,280,502,519 $4,555,436,357 6.4 $4,488,887,181 -1.5 $3,250,424,448 -27.6 $84.03 Personal care $801,232,095 $796,031,423 -0.6 $2,213,144,582 178.0 $979,368,510 -55.7 $25.32 1915(c) waivers - AD $173,012,126 $206,558,906 19.4 $213,665,247 3.4 $237,665,990 11.2 $6.14 Home health $213,964,127 $223,013,057 4.2 $225,704,650 1.2 $233,166,029 3.3 $6.03 Community first choice $4,236,540,960 $4,558,133,064 7.6 $3,156,120,633 -30.8 $4,070,620,070 29.0 $105.24 HCBS - unspecified - AD $0 $14,939,958 100.0 $0 -100.0 $0 0.0 $0.00 PACE $170,761,037 $171,804,006 0.6 $194,383,993 13.1 $217,759,638 12.0 $5.63 Private duty nursing $0 $0 0.0 $0 0.0 $0 0.0 $0.00 Self-directed PAS - alternative to 1915(c) $0 $0 0.0 $0 0.0 $0 0.0 $0.00 Self-directed PAS - alternative to personal care $80,806,631 $46,990,894 -41.8 $8,596,057 -81.7 $15,326,022 78.3 $0.40 Health homes - AD $0 $0 0.0 $0 0.0 $0 0.0 $0.00 State plan HCBS - AD $0 $0 0.0 $0 0.0 $0 0.0 $0.00 Total-People with DD $2,961,915,519 $3,647,181,533 23.1 $3,721,730,326 2.0 $3,537,526,689 -4.9 $91.45 ICF/IID - public $440,226,561 $386,365,125 -12.2 $276,599,713 -28.4 $236,024,896 -14.7 $6.10 ICF/IID - private $381,613,318 $405,747,062 6.3 $424,460,717 4.6 $412,736,604 -2.8 $10.67 1915(c) waivers - DD $2,128,887,905 $2,321,241,017 9.0 $2,733,411,406 17.8 $2,476,504,637 -9.4 $64.02 HCBS - unspecified - DD $0 $0 0.0 $0 0.0 $0 0.0 $0.00 State plan HCBS - DD $11,187,735 $533,828,329 4671.5 $287,258,490 -46.2 $412,260,552 43.5 $10.66 Total-Behavioral Health Services $202,137,418 $187,143,734 -7.4 $422,780,640 125.9 $454,756,209 7.6 $11.76 IMD for people under age 21 or age 65 and older $191,048,730 $177,594,053 -7.0 $362,984,471 104.4 $440,448,941 21.3 $11.39 Mental health facilities DSH $127,396 $177,063 39.0 $520,619 194.0 -$23,332 -104.5 $0.00 Rehabilitative services $10,961,292 $9,372,618 -14.5 $59,275,550 532.4 $14,330,600 -75.8 $0.37 1915(c) waivers - BHS $0 $0 0.0 $0 0.0 $0 0.0 $0.00 State plan HCBS - BHS $0 $0 0.0 $0 0.0 $0 0.0 $0.00 Health homes - BHS $0 $0 0.0 $0 0.0 $0 0.0 $0.00 Total-Other/Multiple Populations $550,731,585 $836,766,987 51.9 $942,091,438 12.6 $735,518,413 -21.9 $19.02 Case management $522,685,022 $552,365,046 5.7 $621,371,145 12.5 $583,323,097 -6.1 $15.08 1915(c) waivers - other $12,553,941 $12,307,988 -2.0 $19,958,631 62.2 $10,730,364 -46.2 $0.28 HCBS - unspecified - other $133,617 $238,988,888 178761.1 $268,798,488 12.5 $110,175,419 -59.0 $2.85 Health homes - other or multiple $0 $0 0.0 $0 0.0 $0 0.0 $0.00 Institutional MLTSS – unspecified $0 $0 0.0 $0 0.0 $0 0.0 $0.00 MFP demonstration $15,359,005 $33,105,065 115.5 $31,963,174 -3.4 $31,289,533 -2.1 $0.81 Total LTSS $13,671,604,017 $15,243,999,919 11.5 $15,587,104,747 2.3 $13,732,132,018 -11.9 $355.01 Total Institutional LTSS $5,293,518,524 $5,525,319,660 4.4 $5,553,452,701 0.5 $4,339,611,557 -21.9 $112.19 Total HCBS $8,378,085,493 $9,718,680,259 16.0 $10,033,652,046 3.2 $9,392,520,461 -6.4 $242.82 Total Medicaid (all services) $52,656,477,798 $59,914,428,634 13.8 $64,285,568,899 7.3 $79,731,144,725 24.0 $2,061.26
Percentages FY 2012 FY 2013 FY 2014 FY 2015
Total LTSS as a Percentage of Total Medicaid 26.0% 25.4% 24.2% 17.2% Percentage of LTSS that is HCBS 61.3% 63.8% 64.4% n/a Percentage of LTSS that is HCBS – AD 57.0% 56.9% 57.3% n/a Percentage of LTSS that is HCBS – DD 72.3% 78.3% 81.2% 81.7% Percentage of LTSS that is HCBS – BHS 5.4% 5.0% 14.0% 3.2%
Notes: Expenditures are total Medicaid spending, including both federal and state payments. Data for several states include expenditures for Medicaid Upper Payment Limit programs or provider taxes. Institutional MLTSS - unspecified refers to institutional LTSS provided through managed care organizations and reported on the CMS-64. The CMS-64 does not specify the type of institutional LTSS. HCBS - unspecified refers to HCBS provided through managed care organizations and fee-for-service HCBS provided in section 1115 demonstrations that were not authorized under another state plan or waiver authority. IMD for people under age 21 or age 65 and older, case management, rehabilitative services, private duty nursing, state plan HCBS, and health homes data do not include services provided through managed care organizations. Data do not include expenditures for managed long-term services and supports in 2012, 2014, and 2015. The percentage of LTSS for HCBS, overall and for older adults and people with physical disabilities, is not calculated for 2015 because a significant portion of data are missing.

Colorado Table 6
Service Type FY 2012 FY 2013
Percent Change 12-13 FY 2014
Percent Change 13-14 FY 2015
Percent Change 14-15
FY 2015 Expenditures Per Resident
Total-Older Adults, People with PD $1,145,950,869 $1,218,052,078 6.3 $1,428,058,244 17.2 $1,589,351,350 11.3 $297.09 Nursing facilities $626,222,510 $642,321,149 2.6 $659,410,571 2.7 $694,010,946 5.2 $129.73 Personal care $0 $0 0.0 $0 0.0 $0 0.0 $0.00 1915(c) waivers - AD $222,848,050 $250,451,428 12.4 $288,419,592 15.2 $302,695,051 4.9 $56.58 Home health $201,525,483 $224,853,967 11.6 $374,378,024 66.5 $465,678,180 24.4 $87.05 Community first choice $0 $0 0.0 $0 0.0 $0 0.0 $0.00 HCBS - unspecified - AD $0 $0 0.0 $0 0.0 $0 0.0 $0.00 PACE $92,509,538 $98,056,171 6.0 $103,681,434 5.7 $123,955,089 19.6 $23.17 Private duty nursing $0 $0 0.0 $0 0.0 $0 0.0 $0.00 Self-directed PAS - alternative to 1915(c) $0 $0 0.0 $0 0.0 $0 0.0 $0.00 Self-directed PAS - alternative to personal care $0 $0 0.0 $0 0.0 $0 0.0 $0.00 Health homes - AD $0 $0 0.0 $0 0.0 $0 0.0 $0.00 State plan HCBS - AD $2,845,288 $2,369,363 -16.7 $2,168,623 -8.5 $3,012,084 38.9 $0.56 Total-People with DD $376,937,816 $385,048,226 2.2 $406,150,182 5.5 $441,054,850 8.6 $82.45 ICF/IID - public $36,486,258 $40,865,551 12.0 $40,592,082 -0.7 $34,388,378 -15.3 $6.43 ICF/IID - private $2,650,846 $5,635,497 112.6 $3,337,049 -40.8 $4,380,258 31.3 $0.82 1915(c) waivers - DD $337,800,712 $338,547,178 0.2 $362,221,051 7.0 $402,286,214 11.1 $75.20 HCBS - unspecified - DD $0 $0 0.0 $0 0.0 $0 0.0 $0.00 State plan HCBS - DD $0 $0 0.0 $0 0.0 $0 0.0 $0.00 Total-Behavioral Health Services $29,968,188 $35,411,139 18.2 $37,188,229 5.0 $41,855,153 12.5 $7.82 IMD for people under age 21 or age 65 and older $3,759,354 $6,245,580 66.1 $5,023,582 -19.6 $7,208,347 43.5 $1.35 Mental health facilities DSH $0 $0 0.0 $0 0.0 $0 0.0 $0.00 Rehabilitative services $0 $0 0.0 $0 0.0 $0 0.0 $0.00 1915(c) waivers - BHS $26,208,834 $29,165,559 11.3 $32,164,647 10.3 $34,646,806 7.7 $6.48 State plan HCBS - BHS $0 $0 0.0 $0 0.0 $0 0.0 $0.00 Health homes - BHS $0 $0 0.0 $0 0.0 $0 0.0 $0.00 Total-Other/Multiple Populations $33,481,384 $34,289,730 2.4 $37,664,384 9.8 $44,946,170 19.3 $8.40 Case management $20,523,300 $20,493,281 -0.1 $22,128,504 8.0 $26,063,318 17.8 $4.87 1915(c) waivers - other $12,958,084 $13,752,953 6.1 $14,774,195 7.4 $16,908,130 14.4 $3.16 HCBS - unspecified - other $0 $0 0.0 $0 0.0 $0 0.0 $0.00 Health homes - other or multiple $0 $0 0.0 $0 0.0 $0 0.0 $0.00 Institutional MLTSS – unspecified $0 $0 0.0 $0 0.0 $0 0.0 $0.00 MFP demonstration $0 $43,496 100.0 $761,685 1651.2 $1,974,722 159.3 $0.37 Total LTSS $1,586,338,257 $1,672,801,173 5.5 $1,909,061,039 14.1 $2,117,207,523 10.9 $395.77 Total Institutional LTSS $669,118,968 $695,067,777 3.9 $708,363,284 1.9 $739,987,929 4.5 $138.32 Total HCBS $917,219,289 $977,733,396 6.6 $1,200,697,755 22.8 $1,377,219,594 14.7 $257.44 Total Medicaid (all services) $4,672,048,439 $5,100,413,568 9.2 $5,955,208,766 16.8 $7,319,166,775 22.9 $1,368.16
Percentages FY 2012 FY 2013 FY 2014 FY 2015
Total LTSS as a Percentage of Total Medicaid 34.0% 32.8% 32.1% 28.9% Percentage of LTSS that is HCBS 57.8% 58.4% 62.9% 65.0% Percentage of LTSS that is HCBS – AD 45.4% 47.3% 53.8% 56.3% Percentage of LTSS that is HCBS – DD 89.6% 87.9% 89.2% 91.2% Percentage of LTSS that is HCBS – BHS 87.5% 82.4% 86.5% 82.8%
Notes: Expenditures are total Medicaid spending, including both federal and state payments. Data for several states include expenditures for Medicaid Upper Payment Limit programs or provider taxes. Institutional MLTSS - unspecified refers to institutional LTSS provided through managed care organizations and reported on the CMS-64. The CMS-64 does not specify the type of institutional LTSS. HCBS - unspecified refers to HCBS provided through managed care organizations and fee-for-service HCBS provided in section 1115 demonstrations that were not authorized under another state plan or waiver authority. IMD for people under age 21 or age 65 and older, case management, rehabilitative services, private duty nursing, state plan HCBS, and health homes data do not include services provided through managed care organizations.

Connecticut Table 7
Service Type FY 2012 FY 2013
Percent Change 12-13 FY 2014
Percent Change 13-14 FY 2015
Percent Change 14-15
FY 2015 Expenditures Per Resident
Total-Older Adults, People with PD $1,694,929,889 $1,732,303,406 2.2 $1,744,883,418 0.7 $1,868,957,056 7.1 $520.33 Nursing facilities $1,257,493,079 $1,250,852,152 -0.5 $1,217,243,251 -2.7 $1,197,886,175 -1.6 $333.50 Personal care $0 $0 0.0 $0 0.0 $0 0.0 $0.00 1915(c) waivers - AD $184,344,862 $225,470,278 22.3 $259,678,036 15.2 $360,228,992 38.7 $100.29 Home health $253,091,948 $255,980,976 1.1 $267,962,131 4.7 $307,984,136 14.9 $85.74 Community first choice $0 $0 0.0 $0 0.0 $2,857,753 100.0 $0.80 HCBS - unspecified - AD $0 $0 0.0 $0 0.0 $0 0.0 $0.00 PACE $0 $0 0.0 $0 0.0 $0 0.0 $0.00 Private duty nursing $0 $0 0.0 $0 0.0 $0 0.0 $0.00 Self-directed PAS - alternative to 1915(c) $0 $0 0.0 $0 0.0 $0 0.0 $0.00 Self-directed PAS - alternative to personal care $0 $0 0.0 $0 0.0 $0 0.0 $0.00 Health homes - AD $0 $0 0.0 $0 0.0 $0 0.0 $0.00 State plan HCBS - AD $0 $0 0.0 $0 0.0 $0 0.0 $0.00 Total-People with DD $1,069,686,525 $1,118,773,827 4.6 $1,057,621,032 -5.5 $1,152,117,561 8.9 $320.76 ICF/IID - public $214,755,990 $226,039,587 5.3 $188,419,774 -16.6 $196,137,966 4.1 $54.61 ICF/IID - private $69,885,974 $68,655,279 -1.8 $69,157,577 0.7 $68,550,058 -0.9 $19.08 1915(c) waivers - DD $785,044,561 $824,078,961 5.0 $800,043,681 -2.9 $887,429,537 10.9 $247.07 HCBS - unspecified - DD $0 $0 0.0 $0 0.0 $0 0.0 $0.00 State plan HCBS - DD $0 $0 0.0 $0 0.0 $0 0.0 $0.00 Total-Behavioral Health Services $180,784,855 $183,365,855 1.4 $226,262,349 23.4 $204,851,295 -9.5 $57.03 IMD for people under age 21 or age 65 and older $73,166,005 $74,039,595 1.2 $114,193,481 54.2 $90,179,892 -21.0 $25.11 Mental health facilities DSH $105,573,725 $105,573,725 0.0 $105,573,725 0.0 $105,573,724 0.0 $29.39 Rehabilitative services $0 $0 0.0 $0 0.0 $0 0.0 $0.00 1915(c) waivers - BHS $2,045,125 $3,752,535 83.5 $6,495,143 73.1 $9,097,679 40.1 $2.53 State plan HCBS - BHS $0 $0 0.0 $0 0.0 $0 0.0 $0.00 Health homes - BHS $0 $0 0.0 $0 0.0 $0 0.0 $0.00 Total-Other/Multiple Populations $85,990,977 $108,171,164 25.8 $176,045,993 62.7 $134,724,561 -23.5 $37.51 Case management $28,021,285 $46,024,199 64.2 $104,972,632 128.1 $54,162,749 -48.4 $15.08 1915(c) waivers - other $40,632,384 $40,081,921 -1.4 $44,628,392 11.3 $49,763,827 11.5 $13.85 HCBS - unspecified - other $0 $0 0.0 $0 0.0 $0 0.0 $0.00 Health homes - other or multiple $0 $0 0.0 $0 0.0 $0 0.0 $0.00 Institutional MLTSS – unspecified $0 $0 0.0 $0 0.0 $0 0.0 $0.00 MFP demonstration $17,337,308 $22,065,044 27.3 $26,444,969 19.9 $30,797,985 16.5 $8.57 Total LTSS $3,031,392,246 $3,142,614,252 3.7 $3,204,812,792 2.0 $3,360,650,473 4.9 $935.63 Total Institutional LTSS $1,720,874,773 $1,725,160,338 0.2 $1,694,587,808 -1.8 $1,658,327,815 -2.1 $461.69 Total HCBS $1,310,517,473 $1,417,453,914 8.2 $1,510,224,984 6.5 $1,702,322,658 12.7 $473.94 Total Medicaid (all services) $6,665,838,357 $6,766,535,062 1.5 $7,296,153,783 7.8 $7,751,987,299 6.2 $2,158.20
Percentages FY 2012 FY 2013 FY 2014 FY 2015
Total LTSS as a Percentage of Total Medicaid 45.5% 46.4% 43.9% 43.4% Percentage of LTSS that is HCBS 43.2% 45.1% 47.1% 50.7% Percentage of LTSS that is HCBS – AD 25.8% 27.8% 30.2% 35.9% Percentage of LTSS that is HCBS – DD 73.4% 73.7% 75.6% 77.0% Percentage of LTSS that is HCBS – BHS 1.1% 2.0% 2.9% 4.4%
Notes: Expenditures are total Medicaid spending, including both federal and state payments. Data for several states include expenditures for Medicaid Upper Payment Limit programs or provider taxes. Institutional MLTSS - unspecified refers to institutional LTSS provided through managed care organizations and reported on the CMS-64. The CMS-64 does not specify the type of institutional LTSS. HCBS - unspecified refers to HCBS provided through managed care organizations and fee-for-service HCBS provided in section 1115 demonstrations that were not authorized under another state plan or waiver authority. IMD for people under age 21 or age 65 and older, case management, rehabilitative services, private duty nursing, state plan HCBS, and health homes data do not include services provided through managed care organizations.

Delaware Table 8
Service Type FY 2012 FY 2013
Percent Change 12-13 FY 2014
Percent Change 13-14 FY 2015
Percent Change 14-15
FY 2015 Expenditures Per Resident
Total-Older Adults, People with PD $291,234,713 $343,074,259 17.8 $360,533,948 5.1 $389,241,252 8.0 $416.32 Nursing facilities $217,552,043 $259,320,978 19.2 $262,438,641 1.2 $272,898,967 4.0 $291.89 Personal care $4,684,010 $11,932,359 154.7 $16,286,928 36.5 $20,895,341 28.3 $22.35 1915(c) waivers - AD $16,237,031 $31,402 -99.8 $79,797 154.1 $23,772 -70.2 $0.03 Home health $23,763,799 $34,702,210 46.0 $36,266,844 4.5 $32,446,209 -10.5 $34.70 Community first choice $0 $0 0.0 $0 0.0 $0 0.0 $0.00 HCBS - unspecified - AD $24,993,169 $34,640,762 38.6 $39,240,140 13.3 $53,097,934 35.3 $56.79 PACE $0 $333,966 100.0 $4,490,848 1244.7 $8,388,529 86.8 $8.97 Private duty nursing $4,004,661 $2,112,582 -47.2 $1,730,750 -18.1 $1,490,500 -13.9 $1.59 Self-directed PAS - alternative to 1915(c) $0 $0 0.0 $0 0.0 $0 0.0 $0.00 Self-directed PAS - alternative to personal care $0 $0 0.0 $0 0.0 $0 0.0 $0.00 Health homes - AD $0 $0 0.0 $0 0.0 $0 0.0 $0.00 State plan HCBS - AD $0 $0 0.0 $0 0.0 $0 0.0 $0.00 Total-People with DD $137,155,435 $129,855,442 -5.3 $135,554,001 4.4 $144,225,982 6.4 $154.26 ICF/IID - public $33,715,693 $21,927,516 -35.0 $20,209,147 -7.8 $18,619,533 -7.9 $19.92 ICF/IID - private $7,675,506 $9,338,686 21.7 $9,704,285 3.9 $10,154,434 4.6 $10.86 1915(c) waivers - DD $95,764,236 $98,589,240 2.9 $105,640,569 7.2 $115,452,015 9.3 $123.48 HCBS - unspecified - DD $0 $0 0.0 $0 0.0 $0 0.0 $0.00 State plan HCBS - DD $0 $0 0.0 $0 0.0 $0 0.0 $0.00 Total-Behavioral Health Services $18,352,131 $18,283,402 -0.4 $19,056,362 4.2 $19,420,620 1.9 $20.77 IMD for people under age 21 or age 65 and older $727,615 $830,790 14.2 $243,394 -70.7 $63,346 -74.0 $0.07 Mental health facilities DSH $5,647,971 $5,633,185 -0.3 $5,760,512 2.3 $6,026,019 4.6 $6.45 Rehabilitative services $11,976,545 $11,819,427 -1.3 $13,052,456 10.4 $13,331,255 2.1 $14.26 1915(c) waivers - BHS $0 $0 0.0 $0 0.0 $0 0.0 $0.00 State plan HCBS - BHS $0 $0 0.0 $0 0.0 $0 0.0 $0.00 Health homes - BHS $0 $0 0.0 $0 0.0 $0 0.0 $0.00 Total-Other/Multiple Populations $1,988,138 $737,525 -62.9 $692,282 -6.1 $5,329,151 669.8 $5.70 Case management $0 $0 0.0 $0 0.0 $0 0.0 $0.00 1915(c) waivers - other $1,412,664 $28,560 -98.0 $0 -100.0 $0 0.0 $0.00 HCBS - unspecified - other $0 $0 0.0 $0 0.0 $0 0.0 $0.00 Health homes - other or multiple $0 $0 0.0 $0 0.0 $0 0.0 $0.00 Institutional MLTSS – unspecified $0 $0 0.0 $0 0.0 $0 0.0 $0.00 MFP demonstration $575,474 $708,965 23.2 $692,282 -2.4 $5,329,151 669.8 $5.70 Total LTSS $448,730,417 $491,950,628 9.6 $515,836,593 4.9 $558,217,005 8.2 $597.06 Total Institutional LTSS $265,318,828 $297,051,155 12.0 $298,355,979 0.4 $307,762,299 3.2 $329.18 Total HCBS $183,411,589 $194,899,473 6.3 $217,480,614 11.6 $250,454,706 15.2 $267.88 Total Medicaid (all services) $1,506,278,561 $1,563,725,796 3.8 $1,718,635,936 9.9 $1,845,979,080 7.4 $1,974.42
Percentages FY 2012 FY 2013 FY 2014 FY 2015
Total LTSS as a Percentage of Total Medicaid 29.8% 31.5% 30.0% 30.2% Percentage of LTSS that is HCBS 40.9% 39.6% 42.2% 44.9% Percentage of LTSS that is HCBS – AD 25.3% 24.4% 27.2% 29.9% Percentage of LTSS that is HCBS – DD 69.8% 75.9% 77.9% 80.0% Percentage of LTSS that is HCBS – BHS 65.3% 64.6% 68.5% 68.6%
Notes: Expenditures are total Medicaid spending, including both federal and state payments. Data for several states include expenditures for Medicaid Upper Payment Limit programs or provider taxes. Institutional MLTSS - unspecified refers to institutional LTSS provided through managed care organizations and reported on the CMS-64. The CMS-64 does not specify the type of institutional LTSS. HCBS - unspecified refers to HCBS provided through managed care organizations and fee-for-service HCBS provided in section 1115 demonstrations that were not authorized under another state plan or waiver authority. IMD for people under age 21 or age 65 and older, case management, rehabilitative services, private duty nursing, state plan HCBS, and health homes data do not include services provided through managed care organizations. Delaware 2012 data for nursing facility, personal care, home health, and HCBS - unspecified were incomplete because the transition to managed care occurred during the year and state estimates were included starting in 2013.

District of Columbia Table 9
Service Type FY 2012 FY 2013
Percent Change 12-13 FY 2014
Percent Change 13-14 FY 2015
Percent Change 14-15
FY 2015 Expenditures Per Resident
Total-Older Adults, People with PD $459,571,147 $531,415,977 15.6 $494,097,888 -7.0 $460,617,692 -6.8 $698.96 Nursing facilities $216,525,388 $226,766,565 4.7 $245,851,596 8.4 $232,783,949 -5.3 $353.24 Personal care $139,051,742 $260,890,322 87.6 $209,730,670 -19.6 $165,423,626 -21.1 $251.02 1915(c) waivers - AD $84,480,675 $31,336,762 -62.9 $25,096,128 -19.9 $32,506,259 29.5 $49.33 Home health $19,513,342 $12,422,328 -36.3 $13,419,494 8.0 $29,903,858 122.8 $45.38 Community first choice $0 $0 0.0 $0 0.0 $0 0.0 $0.00 HCBS - unspecified - AD $0 $0 0.0 $0 0.0 $0 0.0 $0.00 PACE $0 $0 0.0 $0 0.0 $0 0.0 $0.00 Private duty nursing $0 $0 0.0 $0 0.0 $0 0.0 $0.00 Self-directed PAS - alternative to 1915(c) $0 $0 0.0 $0 0.0 $0 0.0 $0.00 Self-directed PAS - alternative to personal care $0 $0 0.0 $0 0.0 $0 0.0 $0.00 Health homes - AD $0 $0 0.0 $0 0.0 $0 0.0 $0.00 State plan HCBS - AD $0 $0 0.0 $0 0.0 $0 0.0 $0.00 Total-People with DD $217,484,940 $236,710,567 8.8 $257,082,359 8.6 $286,023,569 11.3 $434.02 ICF/IID - public $0 $0 0.0 $0 0.0 $0 0.0 $0.00 ICF/IID - private $69,494,028 $85,877,825 23.6 $97,246,324 13.2 $95,400,125 -1.9 $144.76 1915(c) waivers - DD $147,990,912 $150,832,742 1.9 $159,836,035 6.0 $190,623,444 19.3 $289.26 HCBS - unspecified - DD $0 $0 0.0 $0 0.0 $0 0.0 $0.00 State plan HCBS - DD $0 $0 0.0 $0 0.0 $0 0.0 $0.00 Total-Behavioral Health Services $47,601,008 $31,863,181 -33.1 $35,220,132 10.5 $35,177,664 -0.1 $53.38 IMD for people under age 21 or age 65 and older $11,730,753 $7,529,148 -35.8 $18,993,413 152.3 $23,283,707 22.6 $35.33 Mental health facilities DSH $6,545,135 $6,493,425 -0.8 $5,922,254 -8.8 $6,291,897 6.2 $9.55 Rehabilitative services $29,325,120 $17,840,608 -39.2 $10,304,465 -42.2 $5,602,060 -45.6 $8.50 1915(c) waivers - BHS $0 $0 0.0 $0 0.0 $0 0.0 $0.00 State plan HCBS - BHS $0 $0 0.0 $0 0.0 $0 0.0 $0.00 Health homes - BHS $0 $0 0.0 $0 0.0 $0 0.0 $0.00 Total-Other/Multiple Populations $2,180,914 $1,650,432 -24.3 $1,349,496 -18.2 $2,300,908 70.5 $3.49 Case management $0 $0 0.0 $0 0.0 $0 0.0 $0.00 1915(c) waivers - other $0 $0 0.0 $0 0.0 $0 0.0 $0.00 HCBS - unspecified - other $0 $0 0.0 $0 0.0 $0 0.0 $0.00 Health homes - other or multiple $0 $0 0.0 $0 0.0 $0 0.0 $0.00 Institutional MLTSS – unspecified $0 $0 0.0 $0 0.0 $0 0.0 $0.00 MFP demonstration $2,180,914 $1,650,432 -24.3 $1,349,496 -18.2 $2,300,908 70.5 $3.49 Total LTSS $726,838,009 $801,640,157 10.3 $787,749,875 -1.7 $784,119,833 -0.5 $1,189.85 Total Institutional LTSS $304,295,304 $326,666,963 7.4 $368,013,587 12.7 $357,759,678 -2.8 $542.88 Total HCBS $422,542,705 $474,973,194 12.4 $419,736,288 -11.6 $426,360,155 1.6 $646.98 Total Medicaid (all services) $2,113,235,604 $2,283,153,373 8.0 $2,378,006,520 4.2 $2,492,875,863 4.8 $3,782.79
Percentages FY 2012 FY 2013 FY 2014 FY 2015
Total LTSS as a Percentage of Total Medicaid 34.4% 35.1% 33.1% 31.5% Percentage of LTSS that is HCBS 58.1% 59.3% 53.3% 54.4% Percentage of LTSS that is HCBS – AD 52.9% 57.3% 50.2% 49.5% Percentage of LTSS that is HCBS – DD 68.0% 63.7% 62.2% 66.6% Percentage of LTSS that is HCBS – BHS 61.6% 56.0% 29.3% 15.9%
Notes: Expenditures are total Medicaid spending, including both federal and state payments. Data for several states include expenditures for Medicaid Upper Payment Limit programs or provider taxes. Institutional MLTSS - unspecified refers to institutional LTSS provided through managed care organizations and reported on the CMS-64. The CMS-64 does not specify the type of institutional LTSS. HCBS - unspecified refers to HCBS provided through managed care organizations and fee-for-service HCBS provided in section 1115 demonstrations that were not authorized under another state plan or waiver authority. IMD for people under age 21 or age 65 and older, case management, rehabilitative services, private duty nursing, state plan HCBS, and health homes data do not include services provided through managed care organizations.

Florida Table 10
Service Type FY 2012 FY 2013
Percent Change 12-13 FY 2014
Percent Change 13-14 FY 2015
Percent Change 14-15
FY 2015 Expenditures Per Resident
Total-Older Adults, People with PD $3,651,905,547 $3,738,395,575 2.4 $4,456,381,055 19.2 $4,422,469,201 -0.8 $222.36 Nursing facilities $2,810,830,349 $2,839,666,292 1.0 $3,500,974,407 23.3 $3,472,597,367 -0.8 $174.60 Personal care $74,270,173 $85,590,933 15.2 $63,737,162 -25.5 $77,749,103 22.0 $3.91 1915(c) waivers - AD $372,764,351 $415,145,280 11.4 $491,130,973 18.3 $669,354,838 36.3 $33.65 Home health $162,538,141 $164,110,384 1.0 $153,606,926 -6.4 $46,435,704 -69.8 $2.33 Community first choice $0 $0 0.0 $0 0.0 $0 0.0 $0.00 HCBS - unspecified - AD $0 $0 0.0 $0 0.0 $0 0.0 $0.00 PACE $14,721,563 $20,974,041 42.5 $23,244,020 10.8 $30,631,912 31.8 $1.54 Private duty nursing $152,671,772 $143,696,753 -5.9 $160,386,008 11.6 $64,848,667 -59.6 $3.26 Self-directed PAS - alternative to 1915(c) $64,109,198 $69,211,892 8.0 $63,301,559 -8.5 $60,851,610 -3.9 $3.06 Self-directed PAS - alternative to personal care $0 $0 0.0 $0 0.0 $0 0.0 $0.00 Health homes - AD $0 $0 0.0 $0 0.0 $0 0.0 $0.00 State plan HCBS - AD $0 $0 0.0 $0 0.0 $0 0.0 $0.00 Total-People with DD $1,151,073,320 $1,104,490,263 -4.0 $1,138,475,521 3.1 $1,229,326,614 8.0 $61.81 ICF/IID - public $84,858,393 $46,877,727 -44.8 $68,510,726 46.1 $80,317,557 17.2 $4.04 ICF/IID - private $243,601,166 $275,005,423 12.9 $258,168,227 -6.1 $253,775,133 -1.7 $12.76 1915(c) waivers - DD $822,613,761 $782,607,113 -4.9 $811,796,568 3.7 $895,233,924 10.3 $45.01 HCBS - unspecified - DD $0 $0 0.0 $0 0.0 $0 0.0 $0.00 State plan HCBS - DD $0 $0 0.0 $0 0.0 $0 0.0 $0.00 Total-Behavioral Health Services $186,511,732 $141,855,070 -23.9 $127,680,192 -10.0 $152,350,967 19.3 $7.66 IMD for people under age 21 or age 65 and older $66,673,129 $48,724,722 -26.9 $31,490,664 -35.4 $32,113,763 2.0 $1.61 Mental health facilities DSH $119,838,603 $93,130,348 -22.3 $95,871,943 2.9 $119,098,224 24.2 $5.99 Rehabilitative services $0 $0 0.0 $0 0.0 $0 0.0 $0.00 1915(c) waivers - BHS $0 $0 0.0 $0 0.0 $0 0.0 $0.00 State plan HCBS - BHS $0 $0 0.0 $317,585 100.0 $1,138,980 258.6 $0.06 Health homes - BHS $0 $0 0.0 $0 0.0 $0 0.0 $0.00 Total-Other/Multiple Populations $115,060,561 $155,178,861 34.9 $205,081,302 32.2 $95,752,157 -53.3 $4.81 Case management $104,316,282 $143,006,271 37.1 $166,143,561 16.2 $72,231,339 -56.5 $3.63 1915(c) waivers - other $10,744,279 $12,172,590 13.3 $38,937,741 219.9 $23,520,818 -39.6 $1.18 HCBS - unspecified - other $0 $0 0.0 $0 0.0 $0 0.0 $0.00 Health homes - other or multiple $0 $0 0.0 $0 0.0 $0 0.0 $0.00 Institutional MLTSS – unspecified $0 $0 0.0 $0 0.0 $0 0.0 $0.00 MFP demonstration $0 $0 0.0 $0 0.0 $0 0.0 $0.00 Total LTSS $5,104,551,160 $5,139,919,769 0.7 $5,927,618,070 15.3 $5,899,898,939 -0.5 $296.65 Total Institutional LTSS $3,325,801,640 $3,303,404,512 -0.7 $3,955,015,967 19.7 $3,957,902,044 0.1 $199.00 Total HCBS $1,778,749,520 $1,836,515,257 3.2 $1,972,602,103 7.4 $1,941,996,895 -1.6 $97.64 Total Medicaid (all services) $18,021,631,444 $18,616,423,410 3.3 $20,473,727,346 10.0 $20,775,344,737 1.5 $1,044.58
Percentages FY 2012 FY 2013 FY 2014 FY 2015
Total LTSS as a Percentage of Total Medicaid 28.3% 27.6% 29.0% 28.4% Percentage of LTSS that is HCBS 34.8% 35.7% 33.3% 32.9% Percentage of LTSS that is HCBS – AD 23.0% 24.0% 21.4% 21.5% Percentage of LTSS that is HCBS – DD 71.5% 70.9% 71.3% 72.8% Percentage of LTSS that is HCBS – BHS 0.0% 0.0% 0.2% 0.7%
Notes: Expenditures are total Medicaid spending, including both federal and state payments. Data for several states include expenditures for Medicaid Upper Payment Limit programs or provider taxes. Institutional MLTSS - unspecified refers to institutional LTSS provided through managed care organizations and reported on the CMS-64. The CMS-64 does not specify the type of institutional LTSS. HCBS - unspecified refers to HCBS provided through managed care organizations and fee-for-service HCBS provided in section 1115 demonstrations that were not authorized under another state plan or waiver authority. IMD for people under age 21 or age 65 and older, case management, rehabilitative services, private duty nursing, state plan HCBS, and health homes data do not include services provided through managed care organizations. Florida 2015 section 1915(c) waiver data include expenditures for personal care and home health expenditures within a managed care program. The state provided a single estimate for personal care, home health, and section 1915(c) waiver services.

Georgia Table 11
Service Type FY 2012 FY 2013
Percent Change 12-13 FY 2014
Percent Change 13-14 FY 2015
Percent Change 14-15
FY 2015 Expenditures Per Resident
Total-Older Adults, People with PD $1,714,715,354 $1,813,534,818 5.8 $1,687,992,546 -6.9 $1,808,322,071 7.1 $179.27 Nursing facilities $1,217,913,647 $1,355,543,910 11.3 $1,229,040,946 -9.3 $1,289,088,662 4.9 $127.79 Personal care $1,983 $0 -100.0 $0 0.0 $0 0.0 $0.00 1915(c) waivers - AD $405,895,100 $412,557,610 1.6 $414,395,393 0.4 $468,300,206 13.0 $46.43 Home health $90,904,624 $45,433,298 -50.0 $44,556,207 -1.9 $50,933,203 14.3 $5.05 Community first choice $0 $0 0.0 $0 0.0 $0 0.0 $0.00 HCBS - unspecified - AD $0 $0 0.0 $0 0.0 $0 0.0 $0.00 PACE $0 $0 0.0 $0 0.0 $0 0.0 $0.00 Private duty nursing $0 $0 0.0 $0 0.0 $0 0.0 $0.00 Self-directed PAS - alternative to 1915(c) $0 $0 0.0 $0 0.0 $0 0.0 $0.00 Self-directed PAS - alternative to personal care $0 $0 0.0 $0 0.0 $0 0.0 $0.00 Health homes - AD $0 $0 0.0 $0 0.0 $0 0.0 $0.00 State plan HCBS - AD $0 $0 0.0 $0 0.0 $0 0.0 $0.00 Total-People with DD $450,352,924 $486,107,095 7.9 $495,975,565 2.0 $560,878,239 13.1 $55.60 ICF/IID - public $60,646,958 $43,426,627 -28.4 $23,272,105 -46.4 $39,315,848 68.9 $3.90 ICF/IID - private $6,470,336 $7,026,593 8.6 $6,860,648 -2.4 $6,976,857 1.7 $0.69 1915(c) waivers - DD $383,235,630 $435,653,875 13.7 $465,842,812 6.9 $514,585,534 10.5 $51.01 HCBS - unspecified - DD $0 $0 0.0 $0 0.0 $0 0.0 $0.00 State plan HCBS - DD $0 $0 0.0 $0 0.0 $0 0.0 $0.00 Total-Behavioral Health Services $86,170,552 $264,751,577 207.2 $192,407,225 -27.3 $154,785,822 -19.6 $15.34 IMD for people under age 21 or age 65 and older $28,443,076 $39,278,310 38.1 $14,911,270 -62.0 $16,076,528 7.8 $1.59 Mental health facilities DSH $0 $0 0.0 $0 0.0 $0 0.0 $0.00 Rehabilitative services $57,727,476 $225,473,267 290.6 $177,495,955 -21.3 $138,709,294 -21.9 $13.75 1915(c) waivers - BHS $0 $0 0.0 $0 0.0 $0 0.0 $0.00 State plan HCBS - BHS $0 $0 0.0 $0 0.0 $0 0.0 $0.00 Health homes - BHS $0 $0 0.0 $0 0.0 $0 0.0 $0.00 Total-Other/Multiple Populations $119,190,303 $80,760,032 -32.2 $59,481,042 -26.3 $37,605,969 -36.8 $3.73 Case management $82,092,269 $49,701,181 -39.5 $40,199,713 -19.1 $26,752,179 -33.5 $2.65 1915(c) waivers - other $15,405,186 $11,981,188 -22.2 $4,975,222 -58.5 $2,400,385 -51.8 $0.24 HCBS - unspecified - other $0 $0 0.0 $0 0.0 $0 0.0 $0.00 Health homes - other or multiple $0 $0 0.0 $0 0.0 $0 0.0 $0.00 Institutional MLTSS – unspecified $0 $0 0.0 $0 0.0 $0 0.0 $0.00 MFP demonstration $21,692,848 $19,077,663 -12.1 $14,306,107 -25.0 $8,453,405 -40.9 $0.84 Total LTSS $2,370,429,133 $2,645,153,522 11.6 $2,435,856,378 -7.9 $2,561,592,101 5.2 $253.94 Total Institutional LTSS $1,313,474,017 $1,445,275,440 10.0 $1,274,084,969 -11.8 $1,351,457,895 6.1 $133.98 Total HCBS $1,056,955,116 $1,199,878,082 13.5 $1,161,771,409 -3.2 $1,210,134,206 4.2 $119.97 Total Medicaid (all services) $8,735,471,630 $8,970,593,295 2.7 $9,395,281,716 4.7 $9,644,444,017 2.7 $956.10
Percentages FY 2012 FY 2013 FY 2014 FY 2015
Total LTSS as a Percentage of Total Medicaid 27.1% 29.5% 25.9% 26.6% Percentage of LTSS that is HCBS 44.6% 45.4% 47.7% 47.2% Percentage of LTSS that is HCBS – AD 29.0% 25.3% 27.2% 28.7% Percentage of LTSS that is HCBS – DD 85.1% 89.6% 93.9% 91.7% Percentage of LTSS that is HCBS – BHS 67.0% 85.2% 92.3% 89.6%
Notes: Expenditures are total Medicaid spending, including both federal and state payments. Data for several states include expenditures for Medicaid Upper Payment Limit programs or provider taxes. Institutional MLTSS - unspecified refers to institutional LTSS provided through managed care organizations and reported on the CMS-64. The CMS-64 does not specify the type of institutional LTSS. HCBS - unspecified refers to HCBS provided through managed care organizations and fee-for-service HCBS provided in section 1115 demonstrations that were not authorized under another state plan or waiver authority. IMD for people under age 21 or age 65 and older, case management, rehabilitative services, private duty nursing, state plan HCBS, and health homes data do not include services provided through managed care organizations.

Hawaii Table 12
Service Type FY 2012 FY 2013
Percent Change 12-13 FY 2014
Percent Change 13-14 FY 2015
Percent Change 14-15
FY 2015 Expenditures Per Resident
Total-Older Adults, People with PD $360,554,416 $359,489,491 -0.3 $347,382,257 -3.4 $378,350,135 8.9 $267.13 Nursing facilities $281,926,821 $280,867,064 -0.4 $262,418,045 -6.6 $287,793,558 9.7 $203.19 Personal care $0 -$256 100.0 $0 -100.0 $0 0.0 $0.00 1915(c) waivers - AD $0 $0 0.0 $0 0.0 $0 0.0 $0.00 Home health $11,184,683 $11,179,771 0.0 $3,729,258 -66.6 $2,878,095 -22.8 $2.03 Community first choice $0 $0 0.0 $0 0.0 $0 0.0 $0.00 HCBS - unspecified - AD $67,442,912 $67,442,912 0.0 $81,234,954 20.4 $87,678,482 7.9 $61.90 PACE $0 $0 0.0 $0 0.0 $0 0.0 $0.00 Private duty nursing $0 $0 0.0 $0 0.0 $0 0.0 $0.00 Self-directed PAS - alternative to 1915(c) $0 $0 0.0 $0 0.0 $0 0.0 $0.00 Self-directed PAS - alternative to personal care $0 $0 0.0 $0 0.0 $0 0.0 $0.00 Health homes - AD $0 $0 0.0 $0 0.0 $0 0.0 $0.00 State plan HCBS - AD $0 $0 0.0 $0 0.0 $0 0.0 $0.00 Total-People with DD $111,367,431 $116,205,094 4.3 $114,938,638 -1.1 $116,635,330 1.5 $82.35 ICF/IID - public $0 $0 0.0 $0 0.0 $0 0.0 $0.00 ICF/IID - private $8,824,994 $8,331,867 -5.6 $8,801,232 5.6 $9,241,744 5.0 $6.53 1915(c) waivers - DD $102,542,437 $107,873,227 5.2 $106,137,406 -1.6 $107,393,586 1.2 $75.82 HCBS - unspecified - DD $0 $0 0.0 $0 0.0 $0 0.0 $0.00 State plan HCBS - DD $0 $0 0.0 $0 0.0 $0 0.0 $0.00 Total-Behavioral Health Services $12,279 $564 -95.4 $26,707 4635.3 $68,551 156.7 $0.05 IMD for people under age 21 or age 65 and older $0 $0 0.0 $0 0.0 $0 0.0 $0.00 Mental health facilities DSH $0 $0 0.0 $0 0.0 $0 0.0 $0.00 Rehabilitative services $12,279 $564 -95.4 $26,707 4635.3 $68,551 156.7 $0.05 1915(c) waivers - BHS $0 $0 0.0 $0 0.0 $0 0.0 $0.00 State plan HCBS - BHS $0 $0 0.0 $0 0.0 $0 0.0 $0.00 Health homes - BHS $0 $0 0.0 $0 0.0 $0 0.0 $0.00 Total-Other/Multiple Populations $2,467,545 $3,123,875 26.6 $2,962,552 -5.2 $2,654,923 -10.4 $1.87 Case management $1,198,487 $1,432,370 19.5 $1,351,027 -5.7 $1,180,053 -12.7 $0.83 1915(c) waivers - other $0 $0 0.0 $0 0.0 $0 0.0 $0.00 HCBS - unspecified - other $0 $0 0.0 $0 0.0 $0 0.0 $0.00 Health homes - other or multiple $0 $0 0.0 $0 0.0 $0 0.0 $0.00 Institutional MLTSS – unspecified $0 $0 0.0 $0 0.0 $0 0.0 $0.00 MFP demonstration $1,269,058 $1,691,505 33.3 $1,611,525 -4.7 $1,474,870 -8.5 $1.04 Total LTSS $474,401,671 $478,819,024 0.9 $465,310,154 -2.8 $497,708,939 7.0 $351.40 Total Institutional LTSS $290,751,815 $289,198,931 -0.5 $271,219,277 -6.2 $297,035,302 9.5 $209.72 Total HCBS $183,649,856 $189,620,093 3.3 $194,090,877 2.4 $200,673,637 3.4 $141.68 Total Medicaid (all services) $1,506,618,138 $1,645,545,430 9.2 $1,951,331,283 18.6 $2,012,035,896 3.1 $1,420.58
Percentages FY 2012 FY 2013 FY 2014 FY 2015
Total LTSS as a Percentage of Total Medicaid 31.5% 29.1% 23.8% 24.7% Percentage of LTSS that is HCBS 38.7% 39.6% 41.7% 40.3% Percentage of LTSS that is HCBS – AD 21.8% 21.9% 24.5% 23.9% Percentage of LTSS that is HCBS – DD 92.1% 92.8% 92.3% 92.1% Percentage of LTSS that is HCBS – BHS 100.0% 100.0% 100.0% 100.0%
Notes: Expenditures are total Medicaid spending, including both federal and state payments. Data for several states include expenditures for Medicaid Upper Payment Limit programs or provider taxes. Institutional MLTSS - unspecified refers to institutional LTSS provided through managed care organizations and reported on the CMS-64. The CMS-64 does not specify the type of institutional LTSS. HCBS - unspecified refers to HCBS provided through managed care organizations and fee-for-service HCBS provided in section 1115 demonstrations that were not authorized under another state plan or waiver authority. IMD for people under age 21 or age 65 and older, case management, rehabilitative services, private duty nursing, state plan HCBS, and health homes data do not include services provided through managed care organizations. Hawaii provided an estimate for managed LTSS data for calendar year 2012. This estimate was used for both FY 2012 and FY 2013.

Idaho Table 13
Service Type FY 2012 FY 2013
Percent Change 12-13 FY 2014
Percent Change 13-14 FY 2015
Percent Change 14-15
FY 2015 Expenditures Per Resident
Total-Older Adults, People with PD $378,628,167 $422,893,370 11.7 $398,828,938 -5.7 $386,835,142 -3.0 $236.81 Nursing facilities $214,021,785 $236,244,853 10.4 $220,548,973 -6.6 $266,128,559 20.7 $162.92 Personal care $57,292,970 $73,381,603 28.1 $61,405,219 -16.3 $22,866,930 -62.8 $14.00 1915(c) waivers - AD $102,769,696 $105,514,553 2.7 $108,742,856 3.1 $89,179,181 -18.0 $54.59 Home health $4,543,716 $7,752,361 70.6 $8,131,890 4.9 $8,660,472 6.5 $5.30 Community first choice $0 $0 0.0 $0 0.0 $0 0.0 $0.00 HCBS - unspecified - AD $0 $0 0.0 $0 0.0 $0 0.0 $0.00 PACE $0 $0 0.0 $0 0.0 $0 0.0 $0.00 Private duty nursing $0 $0 0.0 $0 0.0 $0 0.0 $0.00 Self-directed PAS - alternative to 1915(c) $0 $0 0.0 $0 0.0 $0 0.0 $0.00 Self-directed PAS - alternative to personal care $0 $0 0.0 $0 0.0 $0 0.0 $0.00 Health homes - AD $0 $0 0.0 $0 0.0 $0 0.0 $0.00 State plan HCBS - AD $0 $0 0.0 $0 0.0 $0 0.0 $0.00 Total-People with DD $87,535,422 $128,314,077 46.6 $168,672,437 31.5 $249,500,243 47.9 $152.74 ICF/IID - public $10,475,899 $11,995,802 14.5 $8,887,723 -25.9 $8,087,067 -9.0 $4.95 ICF/IID - private $12,588,107 $36,644,201 191.1 $38,917,973 6.2 $40,802,789 4.8 $24.98 1915(c) waivers - DD $64,471,416 $79,674,074 23.6 $120,866,741 51.7 $200,610,387 66.0 $122.81 HCBS - unspecified - DD $0 $0 0.0 $0 0.0 $0 0.0 $0.00 State plan HCBS - DD $0 $0 0.0 $0 0.0 $0 0.0 $0.00 Total-Behavioral Health Services $1,677,678 $1,605,942 -4.3 $3,077,975 91.7 $1,722,044 -44.1 $1.05 IMD for people under age 21 or age 65 and older $1,677,678 $1,605,942 -4.3 $3,077,975 91.7 $1,722,044 -44.1 $1.05 Mental health facilities DSH $0 $0 0.0 $0 0.0 $0 0.0 $0.00 Rehabilitative services $0 $0 0.0 $0 0.0 $0 0.0 $0.00 1915(c) waivers - BHS $0 $0 0.0 $0 0.0 $0 0.0 $0.00 State plan HCBS - BHS $0 $0 0.0 $0 0.0 $0 0.0 $0.00 Health homes - BHS $0 $0 0.0 $0 0.0 $0 0.0 $0.00 Total-Other/Multiple Populations $17,747,753 $21,578,973 21.6 $10,934,763 -49.3 $10,810,962 -1.1 $6.62 Case management $17,140,380 $18,062,903 5.4 $6,902,266 -61.8 $6,475,194 -6.2 $3.96 1915(c) waivers - other $0 $0 0.0 $0 0.0 $0 0.0 $0.00 HCBS - unspecified - other $0 $0 0.0 $0 0.0 $0 0.0 $0.00 Health homes - other or multiple $0 $1,152,152 100.0 $1,732,705 50.4 $1,607,831 -7.2 $0.98 Institutional MLTSS – unspecified $0 $0 0.0 $0 0.0 $0 0.0 $0.00 MFP demonstration $607,373 $2,363,918 289.2 $2,299,792 -2.7 $2,727,937 18.6 $1.67 Total LTSS $485,589,020 $574,392,362 18.3 $581,514,113 1.2 $648,868,391 11.6 $397.22 Total Institutional LTSS $238,763,469 $286,490,798 20.0 $271,432,644 -5.3 $316,740,459 16.7 $193.90 Total HCBS $246,825,551 $287,901,564 16.6 $310,081,469 7.7 $332,127,932 7.1 $203.32 Total Medicaid (all services) $1,437,675,796 $1,688,758,313 17.5 $1,685,092,876 -0.2 $1,803,119,059 7.0 $1,103.82
Percentages FY 2012 FY 2013 FY 2014 FY 2015
Total LTSS as a Percentage of Total Medicaid 33.8% 34.0% 34.5% 36.0% Percentage of LTSS that is HCBS 50.8% 50.1% 53.3% 51.2% Percentage of LTSS that is HCBS – AD 43.5% 44.1% 44.7% 31.2% Percentage of LTSS that is HCBS – DD 73.7% 62.1% 71.7% 80.4% Percentage of LTSS that is HCBS – BHS 0.0% 0.0% 0.0% 0.0%
Notes: Expenditures are total Medicaid spending, including both federal and state payments. Data for several states include expenditures for Medicaid Upper Payment Limit programs or provider taxes. Institutional MLTSS - unspecified refers to institutional LTSS provided through managed care organizations and reported on the CMS-64. The CMS-64 does not specify the type of institutional LTSS. HCBS - unspecified refers to HCBS provided through managed care organizations and fee-for-service HCBS provided in section 1115 demonstrations that were not authorized under another state plan or waiver authority. IMD for people under age 21 or age 65 and older, case management, rehabilitative services, private duty nursing, state plan HCBS, and health homes data do not include services provided through managed care organizations.

Illinois Table 14
Service Type FY 2012 FY 2013
Percent Change 12-13 FY 2014
Percent Change 13-14 FY 2015
Percent Change 14-15
FY 2015 Expenditures Per Resident
Total-Older Adults, People with PD $2,536,567,676 $2,797,507,806 10.3 $2,472,501,907 -11.6 $2,505,924,430 1.4 $194.75 Nursing facilities $1,697,844,454 $1,779,248,949 4.8 $1,572,061,927 -11.6 $1,428,479,149 -9.1 $111.01 Personal care $0 $0 0.0 $0 0.0 $0 0.0 $0.00 1915(c) waivers - AD $792,425,435 $955,875,438 20.6 $848,061,613 -11.3 $1,039,230,269 22.5 $80.76 Home health $3,250,806 $4,752,767 46.2 $9,181,011 93.2 $6,061,737 -34.0 $0.47 Community first choice $0 $0 0.0 $0 0.0 $0 0.0 $0.00 HCBS - unspecified - AD $0 $0 0.0 $0 0.0 $0 0.0 $0.00 PACE $0 $0 0.0 $0 0.0 $0 0.0 $0.00 Private duty nursing $43,046,981 $57,630,652 33.9 $43,197,356 -25.0 $32,153,275 -25.6 $2.50 Self-directed PAS - alternative to 1915(c) $0 $0 0.0 $0 0.0 $0 0.0 $0.00 Self-directed PAS - alternative to personal care $0 $0 0.0 $0 0.0 $0 0.0 $0.00 Health homes - AD $0 $0 0.0 $0 0.0 $0 0.0 $0.00 State plan HCBS - AD $0 $0 0.0 $0 0.0 $0 0.0 $0.00 Total-People with DD $1,272,864,624 $1,523,470,628 19.7 $1,479,550,002 -2.9 $1,433,508,882 -3.1 $111.41 ICF/IID - public $404,522,943 $387,529,955 -4.2 $401,205,845 3.5 $350,985,505 -12.5 $27.28 ICF/IID - private $282,670,127 $469,478,862 66.1 $364,946,905 -22.3 $322,195,290 -11.7 $25.04 1915(c) waivers - DD $585,671,554 $666,461,811 13.8 $713,397,252 7.0 $760,328,087 6.6 $59.09 HCBS - unspecified - DD $0 $0 0.0 $0 0.0 $0 0.0 $0.00 State plan HCBS - DD $0 $0 0.0 $0 0.0 $0 0.0 $0.00 Total-Behavioral Health Services $389,096,895 $503,881,095 29.5 $421,185,488 -16.4 $399,391,464 -5.2 $31.04 IMD for people under age 21 or age 65 and older $72,087,738 $152,154,156 111.1 $109,083,941 -28.3 $96,125,582 -11.9 $7.47 Mental health facilities DSH $88,946,691 $75,834,229 -14.7 $89,425,307 17.9 $102,962,153 15.1 $8.00 Rehabilitative services $228,062,466 $275,892,710 21.0 $222,676,240 -19.3 $200,303,729 -10.0 $15.57 1915(c) waivers - BHS $0 $0 0.0 $0 0.0 $0 0.0 $0.00 State plan HCBS - BHS $0 $0 0.0 $0 0.0 $0 0.0 $0.00 Health homes - BHS $0 $0 0.0 $0 0.0 $0 0.0 $0.00 Total-Other/Multiple Populations $142,732,815 $239,145,805 67.5 $796,037,969 232.9 $544,404,557 -31.6 $42.31 Case management $35,979,332 $34,217,864 -4.9 $31,707,455 -7.3 $33,267,533 4.9 $2.59 1915(c) waivers - other $105,994,585 $91,162,971 -14.0 $81,022,521 -11.1 $64,477,722 -20.4 $5.01 HCBS - unspecified - other $0 $26,750,175 100.0 $194,155,822 625.8 $87,341,740 -55.0 $6.79 Health homes - other or multiple $0 $0 0.0 $0 0.0 $0 0.0 $0.00 Institutional MLTSS – unspecified $0 $83,837,474 100.0 $478,673,945 471.0 $354,862,473 -25.9 $27.58 MFP demonstration $758,898 $3,177,321 318.7 $10,478,226 229.8 $4,455,089 -57.5 $0.35 Total LTSS $4,341,262,010 $5,064,005,334 16.6 $5,169,275,366 2.1 $4,883,229,333 -5.5 $379.50 Total Institutional LTSS $2,546,071,953 $2,948,083,625 15.8 $3,015,397,870 2.3 $2,655,610,152 -11.9 $206.38 Total HCBS $1,795,190,057 $2,115,921,709 17.9 $2,153,877,496 1.8 $2,227,619,181 3.4 $173.12 Total Medicaid (all services) $13,072,865,775 $15,749,406,206 20.5 $16,640,782,945 5.7 $17,355,620,134 4.3 $1,348.79
Percentages FY 2012 FY 2013 FY 2014 FY 2015
Total LTSS as a Percentage of Total Medicaid 33.2% 32.2% 31.1% 28.1% Percentage of LTSS that is HCBS 41.4% 41.8% 41.7% 45.6% Percentage of LTSS that is HCBS – AD 33.1% 36.4% 36.4% 43.0% Percentage of LTSS that is HCBS – DD 46.0% 43.7% 48.2% 53.0% Percentage of LTSS that is HCBS – BHS 58.6% 54.8% 52.9% 50.2%
Notes: Expenditures are total Medicaid spending, including both federal and state payments. Data for several states include expenditures for Medicaid Upper Payment Limit programs or provider taxes. Institutional MLTSS - unspecified refers to institutional LTSS provided through managed care organizations and reported on the CMS-64. The CMS-64 does not specify the type of institutional LTSS. HCBS - unspecified refers to HCBS provided through managed care organizations and fee-for-service HCBS provided in section 1115 demonstrations that were not authorized under another state plan or waiver authority. IMD for people under age 21 or age 65 and older, case management, rehabilitative services, private duty nursing, state plan HCBS, and health homes data do not include services provided through managed care organizations.

Indiana Table 15
Service Type FY 2012 FY 2013
Percent Change 12-13 FY 2014
Percent Change 13-14 FY 2015
Percent Change 14-15
FY 2015 Expenditures Per Resident
Total-Older Adults, People with PD $1,795,586,551 $2,046,752,385 14.0 $2,464,718,911 20.4 $2,501,325,269 1.5 $379.26 Nursing facilities $1,456,880,644 $1,664,519,024 14.3 $2,015,823,343 21.1 $2,006,714,494 -0.5 $304.27 Personal care $0 $0 0.0 $0 0.0 $0 0.0 $0.00 1915(c) waivers - AD $119,889,632 $136,571,065 13.9 $167,729,458 22.8 $184,765,944 10.2 $28.02 Home health $218,816,275 $245,662,296 12.3 $281,166,110 14.5 $309,582,006 10.1 $46.94 Community first choice $0 $0 0.0 $0 0.0 $0 0.0 $0.00 HCBS - unspecified - AD $0 $0 0.0 $0 0.0 $0 0.0 $0.00 PACE $0 $0 0.0 $0 0.0 $262,825 100.0 $0.04 Private duty nursing $0 $0 0.0 $0 0.0 $0 0.0 $0.00 Self-directed PAS - alternative to 1915(c) $0 $0 0.0 $0 0.0 $0 0.0 $0.00 Self-directed PAS - alternative to personal care $0 $0 0.0 $0 0.0 $0 0.0 $0.00 Health homes - AD $0 $0 0.0 $0 0.0 $0 0.0 $0.00 State plan HCBS - AD $0 $0 0.0 $0 0.0 $0 0.0 $0.00 Total-People with DD $787,258,500 $819,558,948 4.1 $886,128,564 8.1 $927,497,814 4.7 $140.63 ICF/IID - public $58,267 $0 -100.0 $0 0.0 $0 0.0 $0.00 ICF/IID - private $294,005,680 $283,377,424 -3.6 $292,285,560 3.1 $275,915,169 -5.6 $41.84 1915(c) waivers - DD $493,194,553 $536,181,524 8.7 $593,843,004 10.8 $651,582,645 9.7 $98.80 HCBS - unspecified - DD $0 $0 0.0 $0 0.0 $0 0.0 $0.00 State plan HCBS - DD $0 $0 0.0 $0 0.0 $0 0.0 $0.00 Total-Behavioral Health Services $63,157,564 $54,688,207 -13.4 $54,944,122 0.5 $60,303,038 9.8 $9.14 IMD for people under age 21 or age 65 and older $56,247,812 $47,124,901 -16.2 $46,460,842 -1.4 $49,599,031 6.8 $7.52 Mental health facilities DSH $0 $0 0.0 $0 0.0 $0 0.0 $0.00 Rehabilitative services $6,909,752 $7,563,306 9.5 $8,184,952 8.2 $5,791,785 -29.2 $0.88 1915(c) waivers - BHS $0 $0 0.0 $0 0.0 $0 0.0 $0.00 State plan HCBS - BHS $0 $0 0.0 $298,328 100.0 $4,912,222 1546.6 $0.74 Health homes - BHS $0 $0 0.0 $0 0.0 $0 0.0 $0.00 Total-Other/Multiple Populations $14,856,602 $31,180,168 109.9 $47,710,984 53.0 $33,013,283 -30.8 $5.01 Case management $4,622,780 $4,955,062 7.2 $5,294,745 6.9 $5,864,476 10.8 $0.89 1915(c) waivers - other $4,529,271 $5,165,730 14.1 $5,212,944 0.9 $5,043,340 -3.3 $0.76 HCBS - unspecified - other $0 $4,417,951 100.0 $9,787,712 121.5 $1,897,080 -80.6 $0.29 Health homes - other or multiple $0 $0 0.0 $0 0.0 $0 0.0 $0.00 Institutional MLTSS – unspecified $0 $9,399,794 100.0 $22,104,114 135.2 $4,314,171 -80.5 $0.65 MFP demonstration $5,704,551 $7,241,631 26.9 $5,311,469 -26.7 $15,894,216 199.2 $2.41 Total LTSS $2,660,859,217 $2,952,179,708 10.9 $3,453,502,581 17.0 $3,522,139,404 2.0 $534.04 Total Institutional LTSS $1,807,192,403 $2,004,421,143 10.9 $2,376,673,859 18.6 $2,336,542,865 -1.7 $354.28 Total HCBS $853,666,814 $947,758,565 11.0 $1,076,828,722 13.6 $1,185,596,539 10.1 $179.77 Total Medicaid (all services) $7,737,604,465 $7,951,234,790 2.8 $9,103,489,415 14.5 $9,265,812,216 1.8 $1,404.93
Percentages FY 2012 FY 2013 FY 2014 FY 2015
Total LTSS as a Percentage of Total Medicaid 34.4% 37.1% 37.9% 38.0% Percentage of LTSS that is HCBS 32.1% 32.1% 31.2% 33.7% Percentage of LTSS that is HCBS – AD 18.9% 18.7% 18.2% 19.8% Percentage of LTSS that is HCBS – DD 62.6% 65.4% 67.0% 70.3% Percentage of LTSS that is HCBS – BHS 10.9% 13.8% 15.4% 17.8%
Notes: Expenditures are total Medicaid spending, including both federal and state payments. Data for several states include expenditures for Medicaid Upper Payment Limit programs or provider taxes. Institutional MLTSS - unspecified refers to institutional LTSS provided through managed care organizations and reported on the CMS-64. The CMS-64 does not specify the type of institutional LTSS. HCBS - unspecified refers to HCBS provided through managed care organizations and fee-for-service HCBS provided in section 1115 demonstrations that were not authorized under another state plan or waiver authority. IMD for people under age 21 or age 65 and older, case management, rehabilitative services, private duty nursing, state plan HCBS, and health homes data do not include services provided through managed care organizations.

Iowa Table 16
Service Type FY 2012 FY 2013
Percent Change 12-13 FY 2014
Percent Change 13-14 FY 2015
Percent Change 14-15
FY 2015 Expenditures Per Resident
Total-Older Adults, People with PD $787,563,790 $828,456,674 5.2 $889,174,622 7.3 $904,796,847 1.8 $291.12 Nursing facilities $579,119,404 $579,431,770 0.1 $621,178,560 7.2 $623,815,460 0.4 $200.71 Personal care $0 $0 0.0 $0 0.0 $0 0.0 $0.00 1915(c) waivers - AD $99,455,048 $105,573,572 6.2 $108,194,687 2.5 $107,788,449 -0.4 $34.68 Home health $104,285,878 $136,482,311 30.9 $150,542,319 10.3 $163,189,285 8.4 $52.51 Community first choice $0 $0 0.0 $0 0.0 $0 0.0 $0.00 HCBS - unspecified - AD $0 $0 0.0 $0 0.0 $0 0.0 $0.00 PACE $4,703,460 $6,969,021 48.2 $8,663,854 24.3 $10,005,176 15.5 $3.22 Private duty nursing $0 $0 0.0 $595,202 100.0 -$1,523 -100.3 $0.00 Self-directed PAS - alternative to 1915(c) $0 $0 0.0 $0 0.0 $0 0.0 $0.00 Self-directed PAS - alternative to personal care $0 $0 0.0 $0 0.0 $0 0.0 $0.00 Health homes - AD $0 $0 0.0 $0 0.0 $0 0.0 $0.00 State plan HCBS - AD $0 $0 0.0 $0 0.0 $0 0.0 $0.00 Total-People with DD $656,146,776 $721,880,514 10.0 $749,770,401 3.9 $784,596,527 4.6 $252.44 ICF/IID - public $121,389,773 $146,952,770 21.1 $128,198,054 -12.8 $129,860,555 1.3 $41.78 ICF/IID - private $168,507,239 $169,659,065 0.7 $171,308,021 1.0 $166,584,497 -2.8 $53.60 1915(c) waivers - DD $366,249,764 $405,268,679 10.7 $450,264,326 11.1 $488,151,475 8.4 $157.06 HCBS - unspecified - DD $0 $0 0.0 $0 0.0 $0 0.0 $0.00 State plan HCBS - DD $0 $0 0.0 $0 0.0 $0 0.0 $0.00 Total-Behavioral Health Services $48,291,107 $113,388,053 134.8 $39,188,162 -65.4 $58,127,811 48.3 $18.70 IMD for people under age 21 or age 65 and older $21,138,472 $18,149,216 -14.1 $17,328,609 -4.5 $13,519,037 -22.0 $4.35 Mental health facilities DSH $0 $0 0.0 $0 0.0 $0 0.0 $0.00 Rehabilitative services $764,555 $55,612 -92.7 $14,912 -73.2 $13,323 -10.7 $0.00 1915(c) waivers - BHS $7,796,671 $9,260,595 18.8 $9,066,178 -2.1 $7,420,652 -18.2 $2.39 State plan HCBS - BHS $18,591,409 $85,922,630 362.2 $1,308,890 -98.5 $1,461,695 11.7 $0.47 Health homes - BHS $0 $0 0.0 $11,469,573 100.0 $35,713,104 211.4 $11.49 Total-Other/Multiple Populations $71,612,733 $275,251,274 284.4 $372,142,053 35.2 $384,260,010 3.3 $123.63 Case management $40,133,380 $45,256,670 12.8 $49,238,236 8.8 $56,796,708 15.4 $18.27 1915(c) waivers - other $26,119,136 $30,454,047 16.6 $32,015,361 5.1 $33,179,403 3.6 $10.68 HCBS - unspecified - other $0 $106,981,343 100.0 $174,954,746 63.5 $179,782,628 2.8 $57.84 Health homes - other or multiple $9,191 $6,589,659 71596.9 $19,967,460 203.0 $11,565,921 -42.1 $3.72 Institutional MLTSS – unspecified $0 $81,115,331 100.0 $88,981,212 9.7 $91,420,657 2.7 $29.41 MFP demonstration $5,351,026 $4,854,224 -9.3 $6,985,038 43.9 $11,514,693 64.8 $3.70 Total LTSS $1,563,614,406 $1,938,976,515 24.0 $2,050,275,238 5.7 $2,131,781,195 4.0 $685.89 Total Institutional LTSS $890,154,888 $995,308,152 11.8 $1,026,994,456 3.2 $1,025,200,206 -0.2 $329.86 Total HCBS $673,459,518 $943,668,363 40.1 $1,023,280,782 8.4 $1,106,580,989 8.1 $356.04 Total Medicaid (all services) $3,478,924,376 $3,721,015,408 7.0 $4,053,523,269 8.9 $4,536,093,796 11.9 $1,459.48
Percentages FY 2012 FY 2013 FY 2014 FY 2015
Total LTSS as a Percentage of Total Medicaid 44.9% 52.1% 50.6% 47.0% Percentage of LTSS that is HCBS 43.1% 48.7% 49.9% 51.9% Percentage of LTSS that is HCBS – AD 26.5% 30.1% 30.1% 31.1% Percentage of LTSS that is HCBS – DD 55.8% 56.1% 60.1% 62.2% Percentage of LTSS that is HCBS – BHS 56.2% 84.0% 55.8% 76.7%
Notes: Expenditures are total Medicaid spending, including both federal and state payments. Data for several states include expenditures for Medicaid Upper Payment Limit programs or provider taxes. Institutional MLTSS - unspecified refers to institutional LTSS provided through managed care organizations and reported on the CMS-64. The CMS-64 does not specify the type of institutional LTSS. HCBS - unspecified refers to HCBS provided through managed care organizations and fee-for-service HCBS provided in section 1115 demonstrations that were not authorized under another state plan or waiver authority. IMD for people under age 21 or age 65 and older, case management, rehabilitative services, private duty nursing, state plan HCBS, and health homes data do not include services provided through managed care organizations.

Kansas Table 17
Service Type FY 2012 FY 2013
Percent Change 12-13 FY 2014
Percent Change 13-14 FY 2015
Percent Change 14-15
FY 2015 Expenditures Per Resident
Total-Older Adults, People with PD $643,219,865 $582,274,834 -9.5 $618,655,500 6.2 $704,035,762 13.8 $242.82 Nursing facilities $441,180,030 $354,047,350 -19.7 $424,629,181 19.9 $525,009,590 23.6 $181.08 Personal care $5,676,216 $5,589,378 -1.5 $1,611,490 -71.2 $0 -100.0 $0.00 1915(c) waivers - AD $180,063,744 $199,730,451 10.9 $155,165,719 -22.3 $142,991,853 -7.8 $49.32 Home health $8,780,158 $14,808,854 68.7 $23,219,118 56.8 $23,378,279 0.7 $8.06 Community first choice $0 $0 0.0 $0 0.0 $0 0.0 $0.00 HCBS - unspecified - AD $0 $0 0.0 $0 0.0 $0 0.0 $0.00 PACE $7,519,717 $8,098,801 7.7 $14,029,992 73.2 $12,656,040 -9.8 $4.37 Private duty nursing $0 $0 0.0 $0 0.0 $0 0.0 $0.00 Self-directed PAS - alternative to 1915(c) $0 $0 0.0 $0 0.0 $0 0.0 $0.00 Self-directed PAS - alternative to personal care $0 $0 0.0 $0 0.0 $0 0.0 $0.00 Health homes - AD $0 $0 0.0 $0 0.0 $0 0.0 $0.00 State plan HCBS - AD $0 $0 0.0 $0 0.0 $0 0.0 $0.00 Total-People with DD $398,425,644 $406,036,354 1.9 $348,352,250 -14.2 $355,439,629 2.0 $122.59 ICF/IID - public $51,770,146 $59,471,397 14.9 $61,232,884 3.0 $65,172,371 6.4 $22.48 ICF/IID - private $12,642,252 $4,002,503 -68.3 $5,644 -99.9 $56,238 896.4 $0.02 1915(c) waivers - DD $334,013,246 $342,562,454 2.6 $287,113,722 -16.2 $290,211,020 1.1 $100.09 HCBS - unspecified - DD $0 $0 0.0 $0 0.0 $0 0.0 $0.00 State plan HCBS - DD $0 $0 0.0 $0 0.0 $0 0.0 $0.00 Total-Behavioral Health Services $79,042,678 $46,796,600 -40.8 $27,085,959 -42.1 $51,305,256 89.4 $17.70 IMD for people under age 21 or age 65 and older $45,978,176 $17,738,097 -61.4 $1,235,741 -93.0 $76,464 -93.8 $0.03 Mental health facilities DSH $24,495,411 $25,285,520 3.2 $25,509,276 0.9 $26,045,571 2.1 $8.98 Rehabilitative services $8,597,709 $3,708,846 -56.9 $721,085 -80.6 $188,552 -73.9 $0.07 1915(c) waivers - BHS -$28,618 $64,137 -324.1 $64,427 0.5 $58,774 -8.8 $0.02 State plan HCBS - BHS $0 $0 0.0 $0 0.0 $0 0.0 $0.00 Health homes - BHS $0 $0 0.0 -$444,570 100.0 $24,935,895 -5709.0 $8.60 Total-Other/Multiple Populations $78,348,373 $48,881,376 -37.6 $93,804,084 91.9 $108,471,638 15.6 $37.41 Case management $30,148,251 $22,588,203 -25.1 $8,690,120 -61.5 $2,672,060 -69.3 $0.92 1915(c) waivers - other $39,692,590 $14,248,612 -64.1 $76,070,640 433.9 $99,091,874 30.3 $34.18 HCBS - unspecified - other $0 $0 0.0 $0 0.0 $0 0.0 $0.00 Health homes - other or multiple $0 $0 0.0 $0 0.0 $0 0.0 $0.00 Institutional MLTSS – unspecified $0 $0 0.0 $0 0.0 $0 0.0 $0.00 MFP demonstration $8,507,532 $12,044,561 41.6 $9,043,324 -24.9 $6,707,704 -25.8 $2.31 Total LTSS $1,199,036,560 $1,083,989,164 -9.6 $1,087,897,793 0.4 $1,219,252,285 12.1 $420.52 Total Institutional LTSS $576,066,015 $460,544,867 -20.1 $512,612,726 11.3 $616,360,234 20.2 $212.58 Total HCBS $622,970,545 $623,444,297 0.1 $575,285,067 -7.7 $602,892,051 4.8 $207.94 Total Medicaid (all services) $2,678,534,991 $2,559,305,369 -4.5 $2,819,994,777 10.2 $3,044,002,639 7.9 $1,049.89
Percentages FY 2012 FY 2013 FY 2014 FY 2015
Total LTSS as a Percentage of Total Medicaid 44.8% 42.4% 38.6% 40.1% Percentage of LTSS that is HCBS 52.0% 57.5% 52.9% 49.4% Percentage of LTSS that is HCBS – AD 31.4% 39.2% 31.4% 25.4% Percentage of LTSS that is HCBS – DD 83.8% 84.4% 82.4% 81.6% Percentage of LTSS that is HCBS – BHS 10.8% 8.1% 1.3% 49.1%
Notes: Expenditures are total Medicaid spending, including both federal and state payments. Data for several states include expenditures for Medicaid Upper Payment Limit programs or provider taxes. Institutional MLTSS - unspecified refers to institutional LTSS provided through managed care organizations and reported on the CMS-64. The CMS-64 does not specify the type of institutional LTSS. HCBS - unspecified refers to HCBS provided through managed care organizations and fee-for-service HCBS provided in section 1115 demonstrations that were not authorized under another state plan or waiver authority. IMD for people under age 21 or age 65 and older, case management, rehabilitative services, private duty nursing, state plan HCBS, and health homes data do not include services provided through managed care organizations. Kansas 2013 section 1915(c) data for older adults and people with physical disabilities includes all section 1915(c) waiver expenditures within a managed care program. Some program spending was targeted to behavioral health services or for other populations. Kansas 2014 and 2015 section 1915(c) data for other populations includes section 1915(c) waiver expenditures for behavioral health services within a managed care program.
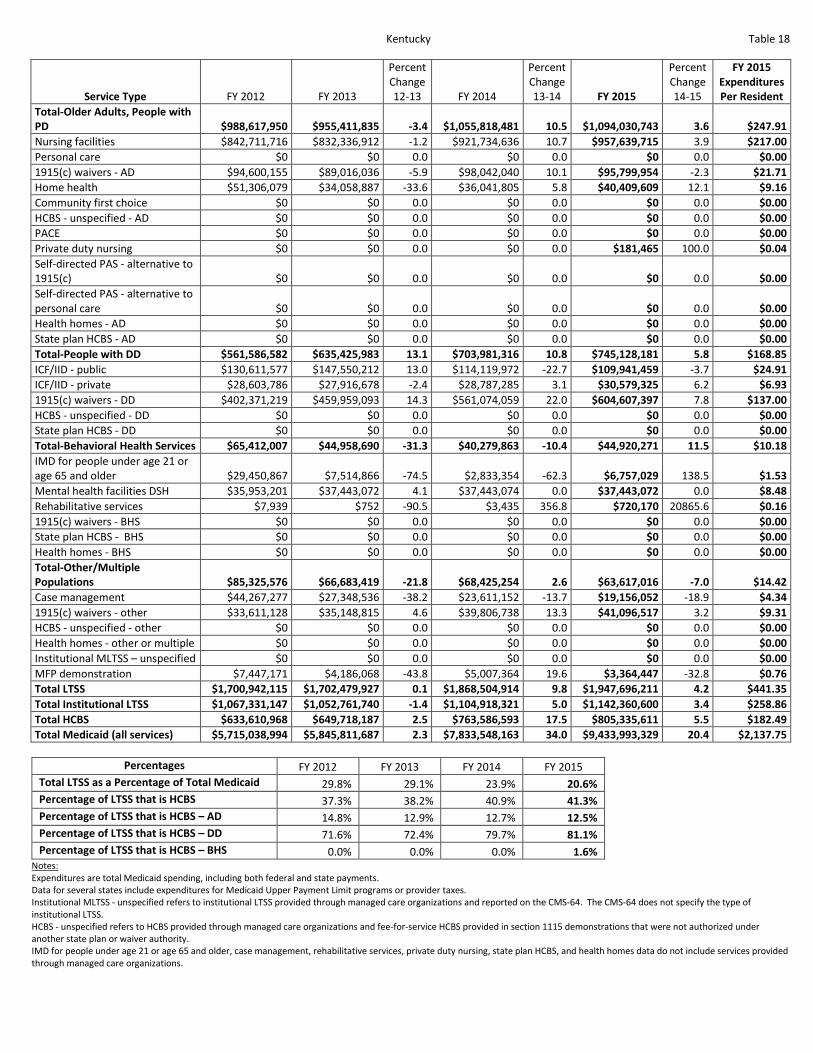
Kentucky Table 18
Service Type FY 2012 FY 2013
Percent Change 12-13 FY 2014
Percent Change 13-14 FY 2015
Percent Change 14-15
FY 2015 Expenditures Per Resident
Total-Older Adults, People with PD $988,617,950 $955,411,835 -3.4 $1,055,818,481 10.5 $1,094,030,743 3.6 $247.91 Nursing facilities $842,711,716 $832,336,912 -1.2 $921,734,636 10.7 $957,639,715 3.9 $217.00 Personal care $0 $0 0.0 $0 0.0 $0 0.0 $0.00 1915(c) waivers - AD $94,600,155 $89,016,036 -5.9 $98,042,040 10.1 $95,799,954 -2.3 $21.71 Home health $51,306,079 $34,058,887 -33.6 $36,041,805 5.8 $40,409,609 12.1 $9.16 Community first choice $0 $0 0.0 $0 0.0 $0 0.0 $0.00 HCBS - unspecified - AD $0 $0 0.0 $0 0.0 $0 0.0 $0.00 PACE $0 $0 0.0 $0 0.0 $0 0.0 $0.00 Private duty nursing $0 $0 0.0 $0 0.0 $181,465 100.0 $0.04 Self-directed PAS - alternative to 1915(c) $0 $0 0.0 $0 0.0 $0 0.0 $0.00 Self-directed PAS - alternative to personal care $0 $0 0.0 $0 0.0 $0 0.0 $0.00 Health homes - AD $0 $0 0.0 $0 0.0 $0 0.0 $0.00 State plan HCBS - AD $0 $0 0.0 $0 0.0 $0 0.0 $0.00 Total-People with DD $561,586,582 $635,425,983 13.1 $703,981,316 10.8 $745,128,181 5.8 $168.85 ICF/IID - public $130,611,577 $147,550,212 13.0 $114,119,972 -22.7 $109,941,459 -3.7 $24.91 ICF/IID - private $28,603,786 $27,916,678 -2.4 $28,787,285 3.1 $30,579,325 6.2 $6.93 1915(c) waivers - DD $402,371,219 $459,959,093 14.3 $561,074,059 22.0 $604,607,397 7.8 $137.00 HCBS - unspecified - DD $0 $0 0.0 $0 0.0 $0 0.0 $0.00 State plan HCBS - DD $0 $0 0.0 $0 0.0 $0 0.0 $0.00 Total-Behavioral Health Services $65,412,007 $44,958,690 -31.3 $40,279,863 -10.4 $44,920,271 11.5 $10.18 IMD for people under age 21 or age 65 and older $29,450,867 $7,514,866 -74.5 $2,833,354 -62.3 $6,757,029 138.5 $1.53 Mental health facilities DSH $35,953,201 $37,443,072 4.1 $37,443,074 0.0 $37,443,072 0.0 $8.48 Rehabilitative services $7,939 $752 -90.5 $3,435 356.8 $720,170 20865.6 $0.16 1915(c) waivers - BHS $0 $0 0.0 $0 0.0 $0 0.0 $0.00 State plan HCBS - BHS $0 $0 0.0 $0 0.0 $0 0.0 $0.00 Health homes - BHS $0 $0 0.0 $0 0.0 $0 0.0 $0.00 Total-Other/Multiple Populations $85,325,576 $66,683,419 -21.8 $68,425,254 2.6 $63,617,016 -7.0 $14.42 Case management $44,267,277 $27,348,536 -38.2 $23,611,152 -13.7 $19,156,052 -18.9 $4.34 1915(c) waivers - other $33,611,128 $35,148,815 4.6 $39,806,738 13.3 $41,096,517 3.2 $9.31 HCBS - unspecified - other $0 $0 0.0 $0 0.0 $0 0.0 $0.00 Health homes - other or multiple $0 $0 0.0 $0 0.0 $0 0.0 $0.00 Institutional MLTSS – unspecified $0 $0 0.0 $0 0.0 $0 0.0 $0.00 MFP demonstration $7,447,171 $4,186,068 -43.8 $5,007,364 19.6 $3,364,447 -32.8 $0.76 Total LTSS $1,700,942,115 $1,702,479,927 0.1 $1,868,504,914 9.8 $1,947,696,211 4.2 $441.35 Total Institutional LTSS $1,067,331,147 $1,052,761,740 -1.4 $1,104,918,321 5.0 $1,142,360,600 3.4 $258.86 Total HCBS $633,610,968 $649,718,187 2.5 $763,586,593 17.5 $805,335,611 5.5 $182.49 Total Medicaid (all services) $5,715,038,994 $5,845,811,687 2.3 $7,833,548,163 34.0 $9,433,993,329 20.4 $2,137.75
Percentages FY 2012 FY 2013 FY 2014 FY 2015
Total LTSS as a Percentage of Total Medicaid 29.8% 29.1% 23.9% 20.6% Percentage of LTSS that is HCBS 37.3% 38.2% 40.9% 41.3% Percentage of LTSS that is HCBS – AD 14.8% 12.9% 12.7% 12.5% Percentage of LTSS that is HCBS – DD 71.6% 72.4% 79.7% 81.1% Percentage of LTSS that is HCBS – BHS 0.0% 0.0% 0.0% 1.6%
Notes: Expenditures are total Medicaid spending, including both federal and state payments. Data for several states include expenditures for Medicaid Upper Payment Limit programs or provider taxes. Institutional MLTSS - unspecified refers to institutional LTSS provided through managed care organizations and reported on the CMS-64. The CMS-64 does not specify the type of institutional LTSS. HCBS - unspecified refers to HCBS provided through managed care organizations and fee-for-service HCBS provided in section 1115 demonstrations that were not authorized under another state plan or waiver authority. IMD for people under age 21 or age 65 and older, case management, rehabilitative services, private duty nursing, state plan HCBS, and health homes data do not include services provided through managed care organizations.

Louisiana Table 19
Service Type FY 2012 FY 2013
Percent Change 12-13 FY 2014
Percent Change 13-14 FY 2015
Percent Change 14-15
FY 2015 Expenditures Per Resident
Total-Older Adults, People with PD $1,229,052,745 $1,319,717,304 7.4 $1,270,271,980 -3.7 $1,327,008,020 4.5 $285.51 Nursing facilities $861,079,897 $923,695,431 7.3 $882,892,618 -4.4 $963,114,626 9.1 $207.22 Personal care $199,909,785 $235,896,416 18.0 $237,389,535 0.6 $201,294,642 -15.2 $43.31 1915(c) waivers - AD $121,973,563 $117,201,025 -3.9 $110,429,311 -5.8 $124,332,283 12.6 $26.75 Home health $34,922,069 $32,638,679 -6.5 $29,222,056 -10.5 $27,370,260 -6.3 $5.89 Community first choice $0 $0 0.0 $0 0.0 $0 0.0 $0.00 HCBS - unspecified - AD $0 $0 0.0 $0 0.0 $0 0.0 $0.00 PACE $11,167,431 $10,285,753 -7.9 $10,338,460 0.5 $10,896,209 5.4 $2.34 Private duty nursing $0 $0 0.0 $0 0.0 $0 0.0 $0.00 Self-directed PAS - alternative to 1915(c) $0 $0 0.0 $0 0.0 $0 0.0 $0.00 Self-directed PAS - alternative to personal care $0 $0 0.0 $0 0.0 $0 0.0 $0.00 Health homes - AD $0 $0 0.0 $0 0.0 $0 0.0 $0.00 State plan HCBS - AD $0 $0 0.0 $0 0.0 $0 0.0 $0.00 Total-People with DD $903,043,708 $872,534,062 -3.4 $824,141,135 -5.5 $846,865,215 2.8 $182.20 ICF/IID - public $236,714,343 $138,706,337 -41.4 $130,230,961 -6.1 $122,882,865 -5.6 $26.44 ICF/IID - private $230,802,344 $276,635,468 19.9 $241,580,201 -12.7 $260,534,506 7.8 $56.05 1915(c) waivers - DD $435,527,021 $457,192,257 5.0 $452,329,973 -1.1 $463,447,844 2.5 $99.71 HCBS - unspecified - DD $0 $0 0.0 $0 0.0 $0 0.0 $0.00 State plan HCBS - DD $0 $0 0.0 $0 0.0 $0 0.0 $0.00 Total-Behavioral Health Services $116,801,377 $117,878,199 0.9 $81,252,079 -31.1 $75,970,230 -6.5 $16.35 IMD for people under age 21 or age 65 and older $14,674,472 $2,384,331 -83.8 $1,680,152 -29.5 $4,038,136 140.3 $0.87 Mental health facilities DSH $101,014,133 $114,778,866 13.6 $78,763,008 -31.4 $71,319,042 -9.5 $15.34 Rehabilitative services $1,112,772 $715,002 -35.7 $804,324 12.5 $608,397 -24.4 $0.13 1915(c) waivers - BHS $0 $0 0.0 $0 0.0 $0 0.0 $0.00 State plan HCBS - BHS $0 $0 0.0 $4,595 100.0 $4,655 1.3 $0.00 Health homes - BHS $0 $0 0.0 $0 0.0 $0 0.0 $0.00 Total-Other/Multiple Populations $32,420,012 $95,269,377 193.9 $20,379,694 -78.6 $31,246,045 53.3 $6.72 Case management $22,985,322 $15,570,467 -32.3 $5,863,393 -62.3 $6,130,855 4.6 $1.32 1915(c) waivers - other $0 $0 0.0 $0 0.0 $0 0.0 $0.00 HCBS - unspecified - other $0 $70,635,791 100.0 $5,842,884 -91.7 $16,413,994 180.9 $3.53 Health homes - other or multiple $0 $0 0.0 $0 0.0 $0 0.0 $0.00 Institutional MLTSS – unspecified $0 $0 0.0 $0 0.0 $0 0.0 $0.00 MFP demonstration $9,434,690 $9,063,119 -3.9 $8,673,417 -4.3 $8,701,196 0.3 $1.87 Total LTSS $2,281,317,842 $2,405,398,942 5.4 $2,196,044,888 -8.7 $2,281,089,510 3.9 $490.78 Total Institutional LTSS $1,444,285,189 $1,456,200,433 0.8 $1,335,146,940 -8.3 $1,421,889,175 6.5 $305.92 Total HCBS $837,032,653 $949,198,509 13.4 $860,897,948 -9.3 $859,200,335 -0.2 $184.86 Total Medicaid (all services) $7,629,641,274 $7,075,779,933 -7.3 $7,168,123,756 1.3 $7,786,691,193 8.6 $1,675.32
Percentages FY 2012 FY 2013 FY 2014 FY 2015
Total LTSS as a Percentage of Total Medicaid 29.9% 34.0% 30.6% 29.3% Percentage of LTSS that is HCBS 36.7% 39.5% 39.2% 37.7% Percentage of LTSS that is HCBS – AD 29.9% 30.0% 30.5% 27.4% Percentage of LTSS that is HCBS – DD 48.2% 52.4% 54.9% 54.7% Percentage of LTSS that is HCBS – BHS 1.0% 0.6% 1.0% 0.8%
Notes: Expenditures are total Medicaid spending, including both federal and state payments. Data for several states include expenditures for Medicaid Upper Payment Limit programs or provider taxes. Institutional MLTSS - unspecified refers to institutional LTSS provided through managed care organizations and reported on the CMS-64. The CMS-64 does not specify the type of institutional LTSS. HCBS - unspecified refers to HCBS provided through managed care organizations and fee-for-service HCBS provided in section 1115 demonstrations that were not authorized under another state plan or waiver authority. IMD for people under age 21 or age 65 and older, case management, rehabilitative services, private duty nursing, state plan HCBS, and health homes data do not include services provided through managed care organizations.

Maine Table 20
Service Type FY 2012 FY 2013
Percent Change 12-13 FY 2014
Percent Change 13-14 FY 2015
Percent Change 14-15
FY 2015 Expenditures Per Resident
Total-Older Adults, People with PD $332,827,015 $358,424,346 7.7 $383,854,834 7.1 $398,324,969 3.8 $299.33 Nursing facilities $225,628,586 $237,891,541 5.4 $258,192,169 8.5 $277,015,869 7.3 $208.17 Personal care $63,057,352 $73,230,338 16.1 $77,406,295 5.7 $73,868,675 -4.6 $55.51 1915(c) waivers - AD $25,861,552 $28,421,519 9.9 $29,597,950 4.1 $20,809,640 -29.7 $15.64 Home health $7,927,635 $7,570,827 -4.5 $5,631,831 -25.6 $8,259,309 46.7 $6.21 Community first choice $0 $0 0.0 $0 0.0 $0 0.0 $0.00 HCBS - unspecified - AD $0 $0 0.0 $0 0.0 $0 0.0 $0.00 PACE $0 $0 0.0 $0 0.0 $0 0.0 $0.00 Private duty nursing $10,351,890 $11,310,121 9.3 $13,026,589 15.2 $18,371,476 41.0 $13.81 Self-directed PAS - alternative to 1915(c) $0 $0 0.0 $0 0.0 $0 0.0 $0.00 Self-directed PAS - alternative to personal care $0 $0 0.0 $0 0.0 $0 0.0 $0.00 Health homes - AD $0 $0 0.0 $0 0.0 $0 0.0 $0.00 State plan HCBS - AD $0 $0 0.0 $0 0.0 $0 0.0 $0.00 Total-People with DD $389,660,556 $374,613,987 -3.9 $402,554,997 7.5 $420,031,512 4.3 $315.64 ICF/IID - public $1,722,234 $1,636,980 -5.0 $1,501,011 -8.3 $1,732,635 15.4 $1.30 ICF/IID - private $73,192,576 $72,565,015 -0.9 $75,044,919 3.4 $77,212,046 2.9 $58.02 1915(c) waivers - DD $314,745,746 $300,411,992 -4.6 $326,009,067 8.5 $341,086,831 4.6 $256.32 HCBS - unspecified - DD $0 $0 0.0 $0 0.0 $0 0.0 $0.00 State plan HCBS - DD $0 $0 0.0 $0 0.0 $0 0.0 $0.00 Total-Behavioral Health Services $97,628,454 $112,149,471 14.9 $104,676,413 -6.7 $111,535,915 6.6 $83.82 IMD for people under age 21 or age 65 and older $46,082,625 $62,036,076 34.6 $52,688,788 -15.1 $51,810,935 -1.7 $38.93 Mental health facilities DSH $41,241,661 $37,489,437 -9.1 $39,328,950 4.9 $42,093,817 7.0 $31.63 Rehabilitative services $10,304,168 $12,623,958 22.5 $12,658,675 0.3 $10,740,155 -15.2 $8.07 1915(c) waivers - BHS $0 $0 0.0 $0 0.0 $0 0.0 $0.00 State plan HCBS - BHS $0 $0 0.0 $0 0.0 $0 0.0 $0.00 Health homes - BHS $0 $0 0.0 $0 0.0 $6,891,008 100.0 $5.18 Total-Other/Multiple Populations $40,392,669 $45,277,043 12.1 $54,746,380 20.9 $61,469,121 12.3 $46.19 Case management $40,392,669 $42,263,391 4.6 $44,215,856 4.6 $46,852,959 6.0 $35.21 1915(c) waivers - other $0 $0 0.0 $0 0.0 $3,903,118 100.0 $2.93 HCBS - unspecified - other $0 $0 0.0 $0 0.0 $0 0.0 $0.00 Health homes - other or multiple $0 $2,885,832 100.0 $9,745,330 237.7 $9,368,018 -3.9 $7.04 Institutional MLTSS – unspecified $0 $0 0.0 $0 0.0 $0 0.0 $0.00 MFP demonstration $0 $127,820 100.0 $785,194 514.3 $1,345,026 71.3 $1.01 Total LTSS $860,508,694 $890,464,847 3.5 $945,832,624 6.2 $991,361,517 4.8 $744.98 Total Institutional LTSS $387,867,682 $411,619,049 6.1 $426,755,837 3.7 $449,865,302 5.4 $338.06 Total HCBS $472,641,012 $478,845,798 1.3 $519,076,787 8.4 $541,496,215 4.3 $406.92 Total Medicaid (all services) $2,340,722,056 $2,889,071,389 23.4 $2,460,834,485 -14.8 $2,596,509,373 5.5 $1,951.21
Percentages FY 2012 FY 2013 FY 2014 FY 2015
Total LTSS as a Percentage of Total Medicaid 36.8% 30.8% 38.4% 38.2% Percentage of LTSS that is HCBS 54.9% 53.8% 54.9% 54.6% Percentage of LTSS that is HCBS – AD 32.2% 33.6% 32.7% 30.5% Percentage of LTSS that is HCBS – DD 80.8% 80.2% 81.0% 81.2% Percentage of LTSS that is HCBS – BHS 10.6% 11.3% 12.1% 15.8%
Notes: Expenditures are total Medicaid spending, including both federal and state payments. Data for several states include expenditures for Medicaid Upper Payment Limit programs or provider taxes. Institutional MLTSS - unspecified refers to institutional LTSS provided through managed care organizations and reported on the CMS-64. The CMS-64 does not specify the type of institutional LTSS. HCBS - unspecified refers to HCBS provided through managed care organizations and fee-for-service HCBS provided in section 1115 demonstrations that were not authorized under another state plan or waiver authority. IMD for people under age 21 or age 65 and older, case management, rehabilitative services, private duty nursing, state plan HCBS, and health homes data do not include services provided through managed care organizations.

Maryland Table 21
Service Type FY 2012 FY 2013
Percent Change 12-13 FY 2014
Percent Change 13-14 FY 2015
Percent Change 14-15
FY 2015 Expenditures Per Resident
Total-Older Adults, People with PD $1,491,672,920 $1,514,743,161 1.5 $1,565,305,382 3.3 $1,604,141,547 2.5 $268.82 Nursing facilities $1,145,380,412 $1,142,712,350 -0.2 $1,166,267,462 2.1 $1,174,675,454 0.7 $196.85 Personal care $41,325,521 $41,280,499 -0.1 $45,601,745 10.5 $32,557,968 -28.6 $5.46 1915(c) waivers - AD $207,217,338 $228,349,908 10.2 $153,708,185 -32.7 $120,803,342 -21.4 $20.24 Home health $2,967,282 $2,964,587 -0.1 $3,004,144 1.3 $3,891,832 29.5 $0.65 Community first choice $0 $0 0.0 $94,140,240 100.0 $169,309,951 79.8 $28.37 HCBS - unspecified - AD $0 $0 0.0 $0 0.0 $0 0.0 $0.00 PACE $6,126,115 $6,101,805 -0.4 $5,973,026 -2.1 $5,124,605 -14.2 $0.86 Private duty nursing $88,656,252 $93,334,012 5.3 $96,610,580 3.5 $97,778,395 1.2 $16.39 Self-directed PAS - alternative to 1915(c) $0 $0 0.0 $0 0.0 $0 0.0 $0.00 Self-directed PAS - alternative to personal care $0 $0 0.0 $0 0.0 $0 0.0 $0.00 Health homes - AD $0 $0 0.0 $0 0.0 $0 0.0 $0.00 State plan HCBS - AD $0 $0 0.0 $0 0.0 $0 0.0 $0.00 Total-People with DD $726,078,089 $764,096,450 5.2 $809,356,463 5.9 $866,508,665 7.1 $145.21 ICF/IID - public $123,036 $59,375 -51.7 $10,653,445 17842.6 $19,595,815 83.9 $3.28 ICF/IID - private $0 -$1,779 100.0 $0 -100.0 $0 0.0 $0.00 1915(c) waivers - DD $725,955,053 $764,038,854 5.2 $798,703,018 4.5 $846,912,850 6.0 $141.93 HCBS - unspecified - DD $0 $0 0.0 $0 0.0 $0 0.0 $0.00 State plan HCBS - DD $0 $0 0.0 $0 0.0 $0 0.0 $0.00 Total-Behavioral Health Services $491,225,912 $458,845,606 -6.6 $576,521,731 25.6 $529,672,755 -8.1 $88.76 IMD for people under age 21 or age 65 and older $106,182,937 $96,345,226 -9.3 $106,430,021 10.5 $94,637,284 -11.1 $15.86 Mental health facilities DSH $51,637,668 $52,876,971 2.4 $53,670,127 1.5 $54,528,848 1.6 $9.14 Rehabilitative services $333,405,307 $309,623,409 -7.1 $415,712,861 34.3 $377,782,102 -9.1 $63.31 1915(c) waivers - BHS $0 $0 0.0 $0 0.0 $0 0.0 $0.00 State plan HCBS - BHS $0 $0 0.0 $0 0.0 $0 0.0 $0.00 Health homes - BHS $0 $0 0.0 $708,722 100.0 $2,724,521 284.4 $0.46 Total-Other/Multiple Populations $38,535,003 $32,389,476 -15.9 $37,498,172 15.8 $90,403,389 141.1 $15.15 Case management $8,533,234 $8,090,868 -5.2 $12,710,349 57.1 $64,611,350 408.3 $10.83 1915(c) waivers - other $8,828,269 $7,083,010 -19.8 $7,950,480 12.2 $9,557,573 20.2 $1.60 HCBS - unspecified - other $0 $0 0.0 $0 0.0 $0 0.0 $0.00 Health homes - other or multiple $0 $0 0.0 $0 0.0 $0 0.0 $0.00 Institutional MLTSS – unspecified $0 $0 0.0 $0 0.0 $0 0.0 $0.00 MFP demonstration $21,173,500 $17,215,598 -18.7 $16,837,343 -2.2 $16,234,466 -3.6 $2.72 Total LTSS $2,747,511,924 $2,770,074,693 0.8 $2,988,681,748 7.9 $3,090,726,356 3.4 $517.94 Total Institutional LTSS $1,303,324,053 $1,291,992,143 -0.9 $1,337,021,055 3.5 $1,343,437,401 0.5 $225.13 Total HCBS $1,444,187,871 $1,478,082,550 2.3 $1,651,660,693 11.7 $1,747,288,955 5.8 $292.81 Total Medicaid (all services) $7,579,399,491 $7,801,194,610 2.9 $9,352,302,117 19.9 $9,584,147,753 2.5 $1,606.11
Percentages FY 2012 FY 2013 FY 2014 FY 2015
Total LTSS as a Percentage of Total Medicaid 36.2% 35.5% 32.0% 32.2% Percentage of LTSS that is HCBS 52.6% 53.4% 55.3% 56.5% Percentage of LTSS that is HCBS – AD 23.2% 24.6% 25.5% 26.8% Percentage of LTSS that is HCBS – DD 100.0% 100.0% 98.7% 97.7% Percentage of LTSS that is HCBS – BHS 67.9% 67.5% 72.2% 71.8%
Notes: Expenditures are total Medicaid spending, including both federal and state payments. Data for several states include expenditures for Medicaid Upper Payment Limit programs or provider taxes. Institutional MLTSS - unspecified refers to institutional LTSS provided through managed care organizations and reported on the CMS-64. The CMS-64 does not specify the type of institutional LTSS. HCBS - unspecified refers to HCBS provided through managed care organizations and fee-for-service HCBS provided in section 1115 demonstrations that were not authorized under another state plan or waiver authority. IMD for people under age 21 or age 65 and older, case management, rehabilitative services, private duty nursing, state plan HCBS, and health homes data do not include services provided through managed care organizations.

Massachusetts Table 22
Service Type FY 2012 FY 2013
Percent Change 12-13 FY 2014
Percent Change 13-14 FY 2015
Percent Change 14-15
FY 2015 Expenditures Per Resident
Total-Older Adults, People with PD $3,212,042,277 $3,418,748,856 6.4 $3,378,988,742 -1.2 $4,320,289,425 27.9 $640.05 Nursing facilities $1,741,645,002 $1,746,652,894 0.3 $1,502,863,463 -14.0 $1,814,969,019 20.8 $268.89 Personal care $842,466,693 $929,611,359 10.3 $997,675,887 7.3 $1,060,508,854 6.3 $157.11 1915(c) waivers - AD $97,695,276 $378,900,529 287.8 $128,678,437 -66.0 $141,138,369 9.7 $20.91 Home health $339,952,775 $246,605,661 -27.5 $359,592,764 45.8 $573,473,613 59.5 $84.96 Community first choice $0 $0 0.0 $0 0.0 $0 0.0 $0.00 HCBS - unspecified - AD $80,275,904 $0 -100.0 $261,016,062 100.0 $584,222,927 123.8 $86.55 PACE $110,005,286 $116,965,844 6.3 $129,176,068 10.4 $141,646,074 9.7 $20.98 Private duty nursing $1,341 $12,569 837.3 -$13,939 -210.9 $4,330,569 -31168.0 $0.64 Self-directed PAS - alternative to 1915(c) $0 $0 0.0 $0 0.0 $0 0.0 $0.00 Self-directed PAS - alternative to personal care $0 $0 0.0 $0 0.0 $0 0.0 $0.00 Health homes - AD $0 $0 0.0 $0 0.0 $0 0.0 $0.00 State plan HCBS - AD $0 $0 0.0 $0 0.0 $0 0.0 $0.00 Total-People with DD $1,041,808,786 $720,368,943 -30.9 $893,707,756 24.1 $1,565,922,667 75.2 $231.99 ICF/IID - public $165,995,204 $4,527,021 -97.3 $10,433,046 130.5 $406,466,544 3796.0 $60.22 ICF/IID - private $0 $0 0.0 $0 0.0 $0 0.0 $0.00 1915(c) waivers - DD $875,813,582 $715,841,922 -18.3 $883,274,710 23.4 $1,159,456,123 31.3 $171.77 HCBS - unspecified - DD $0 $0 0.0 $0 0.0 $0 0.0 $0.00 State plan HCBS - DD $0 $0 0.0 $0 0.0 $0 0.0 $0.00 Total-Behavioral Health Services $258,760,630 $417,831,416 61.5 $374,258,071 -10.4 $498,644,342 33.2 $73.87 IMD for people under age 21 or age 65 and older $102,193,405 $99,263,801 -2.9 $122,526,934 23.4 $139,393,953 13.8 $20.65 Mental health facilities DSH $0 $0 0.0 $0 0.0 $0 0.0 $0.00 Rehabilitative services $156,567,225 $318,567,615 103.5 $251,121,344 -21.2 $353,684,197 40.8 $52.40 1915(c) waivers - BHS $0 $0 0.0 $609,793 100.0 $5,566,192 812.8 $0.82 State plan HCBS - BHS $0 $0 0.0 $0 0.0 $0 0.0 $0.00 Health homes - BHS $0 $0 0.0 $0 0.0 $0 0.0 $0.00 Total-Other/Multiple Populations $96,026,706 -$37,896,124 -139.5 $195,449,679 -615.8 $432,318,059 121.2 $64.05 Case management $79,273,972 -$60,947,856 -176.9 $91,391,533 -250.0 $84,635,532 -7.4 $12.54 1915(c) waivers - other $12,529,669 $13,743,140 9.7 $19,035,313 38.5 $13,685,633 -28.1 $2.03 HCBS - unspecified - other $0 $0 0.0 $0 0.0 $320,788,504 100.0 $47.52 Health homes - other or multiple $0 $0 0.0 $0 0.0 $0 0.0 $0.00 Institutional MLTSS – unspecified $0 $0 0.0 $73,335,737 100.0 $0 -100.0 $0.00 MFP demonstration $4,223,065 $9,308,592 120.4 $11,687,096 25.6 $13,208,390 13.0 $1.96 Total LTSS $4,608,638,399 $4,519,053,091 -1.9 $4,842,404,248 7.2 $6,817,174,493 40.8 $1,009.97 Total Institutional LTSS $2,009,833,611 $1,850,443,716 -7.9 $1,709,159,180 -7.6 $2,360,829,516 38.1 $349.76 Total HCBS $2,598,804,788 $2,668,609,375 2.7 $3,133,245,068 17.4 $4,456,344,977 42.2 $660.21 Total Medicaid (all services) $12,657,854,983 $12,815,751,537 1.2 $14,593,485,515 13.9 $16,119,196,444 10.5 $2,388.06
Percentages FY 2012 FY 2013 FY 2014 FY 2015
Total LTSS as a Percentage of Total Medicaid 36.4% 35.3% 33.2% 42.3% Percentage of LTSS that is HCBS 56.4% 59.1% 64.7% 65.4% Percentage of LTSS that is HCBS – AD 45.8% 48.9% 55.5% 58.0% Percentage of LTSS that is HCBS – DD 84.1% 99.4% 98.8% 74.0% Percentage of LTSS that is HCBS – BHS 60.5% 76.2% 67.3% 72.0%
Notes: Expenditures are total Medicaid spending, including both federal and state payments. Data for several states include expenditures for Medicaid Upper Payment Limit programs or provider taxes. Institutional MLTSS - unspecified refers to institutional LTSS provided through managed care organizations and reported on the CMS-64. The CMS-64 does not specify the type of institutional LTSS. HCBS - unspecified refers to HCBS provided through managed care organizations and fee-for-service HCBS provided in section 1115 demonstrations that were not authorized under another state plan or waiver authority. IMD for people under age 21 or age 65 and older, case management, rehabilitative services, private duty nursing, state plan HCBS, and health homes data do not include services provided through managed care organizations. Data do not include expenditures for managed long-term services and supports in 2014. Massachusetts 2013 data include expenditures for state plan home health expenditures within a managed care program. The state provided a single estimate for home health and section 1915(c) waiver services.

Michigan Table 23
Service Type FY 2012 FY 2013
Percent Change 12-13 FY 2014
Percent Change 13-14 FY 2015
Percent Change 14-15
FY 2015 Expenditures Per Resident
Total-Older Adults, People with PD $2,251,595,500 $2,327,667,798 3.4 $2,319,415,431 -0.4 $2,594,161,556 11.8 $261.62 Nursing facilities $1,726,576,417 $1,769,563,738 2.5 $1,781,042,486 0.6 $1,782,636,993 0.1 $179.78 Personal care $306,895,482 $318,797,449 3.9 $328,775,155 3.1 $320,394,561 -2.5 $32.31 1915(c) waivers - AD $161,260,703 $175,713,347 9.0 $135,877,987 -22.7 $304,166,604 123.9 $30.68 Home health $3,362,906 $3,797,940 12.9 $3,832,651 0.9 $7,120,364 85.8 $0.72 Community first choice $0 $0 0.0 $0 0.0 $0 0.0 $0.00 HCBS - unspecified - AD $0 $0 0.0 $0 0.0 $101,957,983 100.0 $10.28 PACE $25,678,432 $28,761,048 12.0 $36,633,938 27.4 $47,615,559 30.0 $4.80 Private duty nursing $27,821,560 $31,034,276 11.5 $33,253,214 7.1 $30,269,492 -9.0 $3.05 Self-directed PAS - alternative to 1915(c) $0 $0 0.0 $0 0.0 $0 0.0 $0.00 Self-directed PAS - alternative to personal care $0 $0 0.0 $0 0.0 $0 0.0 $0.00 Health homes - AD $0 $0 0.0 $0 0.0 $0 0.0 $0.00 State plan HCBS - AD $0 $0 0.0 $0 0.0 $0 0.0 $0.00 Total-People with DD $448,407,211 $435,586,019 -2.9 $454,892,987 4.4 $462,773,999 1.7 $46.67 ICF/IID - public $0 $215,843 100.0 $0 -100.0 $0 0.0 $0.00 ICF/IID - private $0 $0 0.0 $0 0.0 $0 0.0 $0.00 1915(c) waivers - DD $448,407,211 $435,370,176 -2.9 $454,892,987 4.5 $462,773,999 1.7 $46.67 HCBS - unspecified - DD $0 $0 0.0 $0 0.0 $0 0.0 $0.00 State plan HCBS - DD $0 $0 0.0 $0 0.0 $0 0.0 $0.00 Total-Behavioral Health Services $135,767,960 $115,808,692 -14.7 $166,094,564 43.4 $150,799,374 -9.2 $15.21 IMD for people under age 21 or age 65 and older $29,582,989 $11,355,844 -61.6 $35,057,544 208.7 $29,696,184 -15.3 $2.99 Mental health facilities DSH $101,043,110 $98,850,757 -2.2 $125,105,674 26.6 $114,962,268 -8.1 $11.59 Rehabilitative services $360,420 $245,567 -31.9 $127,383 -48.1 $140,905 10.6 $0.01 1915(c) waivers - BHS $4,781,441 $5,356,524 12.0 $5,803,963 8.4 $5,504,075 -5.2 $0.56 State plan HCBS - BHS $0 $0 0.0 $0 0.0 $0 0.0 $0.00 Health homes - BHS $0 $0 0.0 $0 0.0 $495,942 100.0 $0.05 Total-Other/Multiple Populations $35,210,273 $38,089,395 8.2 $45,810,912 20.3 $22,076,666 -51.8 $2.23 Case management $19,986,435 $22,340,366 11.8 $26,601,424 19.1 $9,879,250 -62.9 $1.00 1915(c) waivers - other $0 $0 0.0 $0 0.0 $0 0.0 $0.00 HCBS - unspecified - other $0 $0 0.0 $0 0.0 $0 0.0 $0.00 Health homes - other or multiple $0 $0 0.0 $0 0.0 $0 0.0 $0.00 Institutional MLTSS – unspecified $0 $0 0.0 $0 0.0 $0 0.0 $0.00 MFP demonstration $15,223,838 $15,749,029 3.4 $19,209,488 22.0 $12,197,416 -36.5 $1.23 Total LTSS $2,870,980,944 $2,917,151,904 1.6 $2,986,213,894 2.4 $3,229,811,595 8.2 $325.72 Total Institutional LTSS $1,857,202,516 $1,879,986,182 1.2 $1,941,205,704 3.3 $1,927,295,445 -0.7 $194.37 Total HCBS $1,013,778,428 $1,037,165,722 2.3 $1,045,008,190 0.8 $1,302,516,150 24.6 $131.36 Total Medicaid (all services) $12,170,083,640 $12,352,386,939 1.5 $13,456,874,346 8.9 $16,047,998,915 19.3 $1,618.43
Percentages FY 2012 FY 2013 FY 2014 FY 2015
Total LTSS as a Percentage of Total Medicaid 23.6% 23.6% 22.2% 20.1% Percentage of LTSS that is HCBS 35.3% 35.6% 35.0% 40.3% Percentage of LTSS that is HCBS – AD 23.3% 24.0% 23.2% 31.3% Percentage of LTSS that is HCBS – DD 100.0% 100.0% 100.0% 100.0% Percentage of LTSS that is HCBS – BHS 3.8% 4.8% 3.6% 4.1%
Notes: Expenditures are total Medicaid spending, including both federal and state payments. Data for several states include expenditures for Medicaid Upper Payment Limit programs or provider taxes. Institutional MLTSS - unspecified refers to institutional LTSS provided through managed care organizations and reported on the CMS-64. The CMS-64 does not specify the type of institutional LTSS. HCBS - unspecified refers to HCBS provided through managed care organizations and fee-for-service HCBS provided in section 1115 demonstrations that were not authorized under another state plan or waiver authority. IMD for people under age 21 or age 65 and older, case management, rehabilitative services, private duty nursing, state plan HCBS, and health homes data do not include services provided through managed care organizations. Michigan 2014 data for nursing facility, 1915(c) waiver, and HCBS - unspecified were incomplete because the transition to managed care occurred during the year and state estimates were included starting in 2015.

Minnesota Table 24
Service Type FY 2012 FY 2013
Percent Change 12-13 FY 2014
Percent Change 13-14 FY 2015
Percent Change 14-15
FY 2015 Expenditures Per Resident
Total-Older Adults, People with PD $2,358,017,593 $2,353,633,286 -0.2 $2,543,070,808 8.0 $2,758,297,421 8.5 $505.82 Nursing facilities $816,475,470 $781,797,797 -4.2 $800,276,281 2.4 $780,646,726 -2.5 $143.16 Personal care $577,182,721 $598,505,543 3.7 $660,231,906 10.3 $745,722,646 12.9 $136.75 1915(c) waivers - AD $750,849,957 $758,744,695 1.1 $852,902,340 12.4 $989,249,574 16.0 $181.41 Home health $117,238,215 $114,036,956 -2.7 $118,207,580 3.7 $121,584,179 2.9 $22.30 Community first choice $0 $0 0.0 $0 0.0 $0 0.0 $0.00 HCBS - unspecified - AD $0 $0 0.0 $0 0.0 $0 0.0 $0.00 PACE $0 $0 0.0 $0 0.0 $0 0.0 $0.00 Private duty nursing $96,271,230 $100,548,295 4.4 $111,452,701 10.8 $121,094,296 8.7 $22.21 Self-directed PAS - alternative to 1915(c) $0 $0 0.0 $0 0.0 $0 0.0 $0.00 Self-directed PAS - alternative to personal care $0 $0 0.0 $0 0.0 $0 0.0 $0.00 Health homes - AD $0 $0 0.0 $0 0.0 $0 0.0 $0.00 State plan HCBS - AD $0 $0 0.0 $0 0.0 $0 0.0 $0.00 Total-People with DD $1,175,404,545 $1,174,312,673 -0.1 $1,240,286,536 5.6 $1,335,094,533 7.6 $244.83 ICF/IID - public $9,664,984 $9,824,178 1.6 $9,441,160 -3.9 $9,036,227 -4.3 $1.66 ICF/IID - private $154,479,655 $151,862,966 -1.7 $157,787,809 3.9 $158,912,010 0.7 $29.14 1915(c) waivers - DD $1,011,259,906 $1,012,625,529 0.1 $1,073,057,567 6.0 $1,167,146,296 8.8 $214.03 HCBS - unspecified - DD $0 $0 0.0 $0 0.0 $0 0.0 $0.00 State plan HCBS - DD $0 $0 0.0 $0 0.0 $0 0.0 $0.00 Total-Behavioral Health Services $93,421,670 $87,006,122 -6.9 $78,731,113 -9.5 $105,490,743 34.0 $19.35 IMD for people under age 21 or age 65 and older $93,207,158 $86,750,812 -6.9 $78,719,554 -9.3 $105,490,743 34.0 $19.35 Mental health facilities DSH $214,512 $197,998 -7.7 $11,559 -94.2 $0 -100.0 $0.00 Rehabilitative services $0 $57,312 100.0 $0 -100.0 $0 0.0 $0.00 1915(c) waivers - BHS $0 $0 0.0 $0 0.0 $0 0.0 $0.00 State plan HCBS - BHS $0 $0 0.0 $0 0.0 $0 0.0 $0.00 Health homes - BHS $0 $0 0.0 $0 0.0 $0 0.0 $0.00 Total-Other/Multiple Populations $294,382,219 $294,856,194 0.2 $297,269,585 0.8 $325,212,878 9.4 $59.64 Case management $199,908,880 $201,920,861 1.0 $201,357,930 -0.3 $221,804,466 10.2 $40.67 1915(c) waivers - other $94,473,339 $92,935,333 -1.6 $95,487,367 2.7 $98,072,923 2.7 $17.98 HCBS - unspecified - other $0 $0 0.0 $0 0.0 $0 0.0 $0.00 Health homes - other or multiple $0 $0 0.0 $0 0.0 $0 0.0 $0.00 Institutional MLTSS – unspecified $0 $0 0.0 $0 0.0 $0 0.0 $0.00 MFP demonstration $0 $0 0.0 $424,288 100.0 $5,335,489 1157.5 $0.98 Total LTSS $3,921,226,027 $3,909,808,275 -0.3 $4,159,358,042 6.4 $4,524,095,575 8.8 $829.64 Total Institutional LTSS $1,074,041,779 $1,030,433,751 -4.1 $1,046,236,363 1.5 $1,054,085,706 0.8 $193.30 Total HCBS $2,847,184,248 $2,879,374,524 1.1 $3,113,121,679 8.1 $3,470,009,869 11.5 $636.34 Total Medicaid (all services) $8,920,910,028 $8,919,853,473 0.0 $10,020,786,305 12.3 $10,953,158,789 9.3 $2,008.61
Percentages FY 2012 FY 2013 FY 2014 FY 2015
Total LTSS as a Percentage of Total Medicaid 44.0% 43.8% 41.5% 41.3% Percentage of LTSS that is HCBS 72.6% 73.6% 74.8% 76.7% Percentage of LTSS that is HCBS – AD 65.4% 66.8% 68.5% 71.7% Percentage of LTSS that is HCBS – DD 86.0% 86.2% 86.5% 87.4% Percentage of LTSS that is HCBS – BHS 0.0% 0.1% 0.0% 0.0%
Notes: Expenditures are total Medicaid spending, including both federal and state payments. Data for several states include expenditures for Medicaid Upper Payment Limit programs or provider taxes. Institutional MLTSS - unspecified refers to institutional LTSS provided through managed care organizations and reported on the CMS-64. The CMS-64 does not specify the type of institutional LTSS. HCBS - unspecified refers to HCBS provided through managed care organizations and fee-for-service HCBS provided in section 1115 demonstrations that were not authorized under another state plan or waiver authority. IMD for people under age 21 or age 65 and older, case management, rehabilitative services, private duty nursing, state plan HCBS, and health homes data do not include services provided through managed care organizations. Minnesota 2013 data for nursing facility, personal care, and home health are estimated expenditures for calendar year 2013.

Mississippi Table 25
Service Type FY 2012 FY 2013
Percent Change 12-13 FY 2014
Percent Change 13-14 FY 2015
Percent Change 14-15
FY 2015 Expenditures Per Resident
Total-Older Adults, People with PD $972,801,689 $1,025,023,835 5.4 $995,705,644 -2.9 $1,069,823,399 7.4 $357.51 Nursing facilities $756,786,480 $788,640,228 4.2 $748,045,679 -5.1 $761,814,277 1.8 $254.58 Personal care $0 $0 0.0 $0 0.0 $0 0.0 $0.00 1915(c) waivers - AD $208,620,960 $229,386,297 10.0 $240,987,223 5.1 $299,153,438 24.1 $99.97 Home health $2,615,277 $1,892,077 -27.7 $1,453,111 -23.2 $1,515,164 4.3 $0.51 Community first choice $0 $0 0.0 $0 0.0 $0 0.0 $0.00 HCBS - unspecified - AD $0 $0 0.0 $0 0.0 $0 0.0 $0.00 PACE $0 $0 0.0 $0 0.0 $0 0.0 $0.00 Private duty nursing $4,778,972 $5,105,233 6.8 $5,219,631 2.2 $7,340,520 40.6 $2.45 Self-directed PAS - alternative to 1915(c) $0 $0 0.0 $0 0.0 $0 0.0 $0.00 Self-directed PAS - alternative to personal care $0 $0 0.0 $0 0.0 $0 0.0 $0.00 Health homes - AD $0 $0 0.0 $0 0.0 $0 0.0 $0.00 State plan HCBS - AD $0 $0 0.0 $0 0.0 $0 0.0 $0.00 Total-People with DD $314,263,478 $311,645,299 -0.8 $340,607,845 9.3 $345,764,272 1.5 $115.55 ICF/IID - public $220,470,620 $209,726,696 -4.9 $221,201,808 5.5 $211,864,398 -4.2 $70.80 ICF/IID - private $49,816,607 $50,645,468 1.7 $51,002,138 0.7 $51,186,884 0.4 $17.11 1915(c) waivers - DD $43,976,251 $51,273,135 16.6 $68,403,899 33.4 $82,712,990 20.9 $27.64 HCBS - unspecified - DD $0 $0 0.0 $0 0.0 $0 0.0 $0.00 State plan HCBS - DD $0 $0 0.0 $0 0.0 $0 0.0 $0.00 Total-Behavioral Health Services $174,002,223 $139,602,591 -19.8 $138,062,138 -1.1 $135,338,865 -2.0 $45.23 IMD for people under age 21 or age 65 and older $69,441,790 $74,201,314 6.9 $76,223,987 2.7 $74,445,064 -2.3 $24.88 Mental health facilities DSH $0 $0 0.0 $0 0.0 $0 0.0 $0.00 Rehabilitative services $104,560,433 $65,401,277 -37.5 $61,838,151 -5.4 $60,893,801 -1.5 $20.35 1915(c) waivers - BHS $0 $0 0.0 $0 0.0 $0 0.0 $0.00 State plan HCBS - BHS $0 $0 0.0 $0 0.0 $0 0.0 $0.00 Health homes - BHS $0 $0 0.0 $0 0.0 $0 0.0 $0.00 Total-Other/Multiple Populations $48,813,909 $32,689,212 -33.0 $32,274,862 -1.3 $32,194,155 -0.3 $10.76 Case management $48,583,503 $29,553,047 -39.2 $27,754,232 -6.1 $26,931,644 -3.0 $9.00 1915(c) waivers - other $0 $0 0.0 $0 0.0 $0 0.0 $0.00 HCBS - unspecified - other $0 $0 0.0 $0 0.0 $0 0.0 $0.00 Health homes - other or multiple $0 $0 0.0 $0 0.0 $0 0.0 $0.00 Institutional MLTSS – unspecified $0 $0 0.0 $0 0.0 $0 0.0 $0.00 MFP demonstration $230,406 $3,136,165 1261.1 $4,520,630 44.1 $5,262,511 16.4 $1.76 Total LTSS $1,509,881,299 $1,508,960,937 -0.1 $1,506,650,489 -0.2 $1,583,120,691 5.1 $529.05 Total Institutional LTSS $1,096,515,497 $1,123,213,706 2.4 $1,096,473,612 -2.4 $1,099,310,623 0.3 $367.37 Total HCBS $413,365,802 $385,747,231 -6.7 $410,176,877 6.3 $483,810,068 18.0 $161.68 Total Medicaid (all services) $4,465,935,437 $4,736,403,877 6.1 $4,884,142,318 3.1 $5,204,753,503 6.6 $1,739.32
Percentages FY 2012 FY 2013 FY 2014 FY 2015
Total LTSS as a Percentage of Total Medicaid 33.8% 31.9% 30.8% 30.4% Percentage of LTSS that is HCBS 27.4% 25.6% 27.2% 30.6% Percentage of LTSS that is HCBS – AD 22.2% 23.1% 24.9% 28.8% Percentage of LTSS that is HCBS – DD 14.0% 16.5% 20.1% 23.9% Percentage of LTSS that is HCBS – BHS 60.1% 46.8% 44.8% 45.0%
Notes: Expenditures are total Medicaid spending, including both federal and state payments. Data for several states include expenditures for Medicaid Upper Payment Limit programs or provider taxes. Institutional MLTSS - unspecified refers to institutional LTSS provided through managed care organizations and reported on the CMS-64. The CMS-64 does not specify the type of institutional LTSS. HCBS - unspecified refers to HCBS provided through managed care organizations and fee-for-service HCBS provided in section 1115 demonstrations that were not authorized under another state plan or waiver authority. IMD for people under age 21 or age 65 and older, case management, rehabilitative services, private duty nursing, state plan HCBS, and health homes data do not include services provided through managed care organizations.

Missouri Table 26
Service Type FY 2012 FY 2013
Percent Change 12-13 FY 2014
Percent Change 13-14 FY 2015
Percent Change 14-15
FY 2015 Expenditures Per Resident
Total-Older Adults, People with PD $1,507,811,874 $1,617,322,120 7.3 $1,756,106,556 8.6 $1,850,826,787 5.4 $305.37 Nursing facilities $938,653,877 $982,937,986 4.7 $1,048,328,084 6.7 $1,068,005,677 1.9 $176.21 Personal care $404,124,662 $457,792,114 13.3 $523,105,307 14.3 $606,356,853 15.9 $100.04 1915(c) waivers - AD $112,395,792 $114,362,289 1.7 $120,004,367 4.9 $106,570,500 -11.2 $17.58 Home health $6,256,273 $6,246,898 -0.1 $5,347,214 -14.4 $5,402,168 1.0 $0.89 Community first choice $0 $0 0.0 $0 0.0 $0 0.0 $0.00 HCBS - unspecified - AD $0 $0 0.0 $0 0.0 $0 0.0 $0.00 PACE $6,228,521 $6,776,334 8.8 $6,759,291 -0.3 $7,124,634 5.4 $1.18 Private duty nursing $40,152,749 $49,206,499 22.5 $52,562,293 6.8 $57,366,955 9.1 $9.47 Self-directed PAS - alternative to 1915(c) $0 $0 0.0 $0 0.0 $0 0.0 $0.00 Self-directed PAS - alternative to personal care $0 $0 0.0 $0 0.0 $0 0.0 $0.00 Health homes - AD $0 $0 0.0 $0 0.0 $0 0.0 $0.00 State plan HCBS - AD $0 $0 0.0 $0 0.0 $0 0.0 $0.00 Total-People with DD $898,252,875 $707,604,077 -21.2 $762,760,691 7.8 $822,748,175 7.9 $135.75 ICF/IID - public $116,824,338 $106,015,542 -9.3 $104,924,519 -1.0 $98,664,491 -6.0 $16.28 ICF/IID - private $246,880,928 $5,477,860 -97.8 $5,857,011 6.9 $6,014,503 2.7 $0.99 1915(c) waivers - DD $534,547,609 $596,110,675 11.5 $651,979,161 9.4 $718,069,181 10.1 $118.48 HCBS - unspecified - DD $0 $0 0.0 $0 0.0 $0 0.0 $0.00 State plan HCBS - DD $0 $0 0.0 $0 0.0 $0 0.0 $0.00 Total-Behavioral Health Services $252,968,495 $510,183,905 101.7 $518,513,464 1.6 $570,778,294 10.1 $94.17 IMD for people under age 21 or age 65 and older $35,671,013 $28,892,056 -19.0 $27,964,542 -3.2 $25,179,896 -10.0 $4.15 Mental health facilities DSH $206,156,064 $207,234,539 0.5 $211,118,467 1.9 $209,875,764 -0.6 $34.63 Rehabilitative services $115,015 $260,484,117 226378.4 $262,239,167 0.7 $316,034,923 20.5 $52.14 1915(c) waivers - BHS $0 $0 0.0 $0 0.0 $0 0.0 $0.00 State plan HCBS - BHS $0 $0 0.0 $0 0.0 $0 0.0 $0.00 Health homes - BHS $11,026,403 $13,573,193 23.1 $17,191,288 26.7 $19,687,711 14.5 $3.25 Total-Other/Multiple Populations $75,561,655 $90,493,923 19.8 $86,871,118 -4.0 $97,480,314 12.2 $16.08 Case management $62,071,521 $68,846,235 10.9 $69,528,766 1.0 $76,728,089 10.4 $12.66 1915(c) waivers - other $1,541,314 $1,889,917 22.6 $1,724,390 -8.8 $2,023,233 17.3 $0.33 HCBS - unspecified - other $0 $0 0.0 $0 0.0 $0 0.0 $0.00 Health homes - other or multiple $6,056,896 $8,472,138 39.9 $9,709,695 14.6 $10,866,930 11.9 $1.79 Institutional MLTSS – unspecified $0 $0 0.0 $0 0.0 $0 0.0 $0.00 MFP demonstration $5,891,924 $11,285,633 91.5 $5,908,267 -47.6 $7,862,062 33.1 $1.30 Total LTSS $2,734,594,899 $2,925,604,025 7.0 $3,124,251,829 6.8 $3,341,833,570 7.0 $551.37 Total Institutional LTSS $1,544,186,220 $1,330,557,983 -13.8 $1,398,192,623 5.1 $1,407,740,331 0.7 $232.26 Total HCBS $1,190,408,679 $1,595,046,042 34.0 $1,726,059,206 8.2 $1,934,093,239 12.1 $319.11 Total Medicaid (all services) $8,515,587,137 $8,837,905,408 3.8 $8,972,646,288 1.5 $9,656,952,532 7.6 $1,593.31
Percentages FY 2012 FY 2013 FY 2014 FY 2015
Total LTSS as a Percentage of Total Medicaid 32.1% 33.1% 34.8% 34.6% Percentage of LTSS that is HCBS 43.5% 54.5% 55.2% 57.9% Percentage of LTSS that is HCBS – AD 37.7% 39.2% 40.3% 42.3% Percentage of LTSS that is HCBS – DD 59.5% 84.2% 85.5% 87.3% Percentage of LTSS that is HCBS – BHS 4.4% 53.7% 53.9% 58.8%
Notes: Expenditures are total Medicaid spending, including both federal and state payments. Data for several states include expenditures for Medicaid Upper Payment Limit programs or provider taxes. Institutional MLTSS - unspecified refers to institutional LTSS provided through managed care organizations and reported on the CMS-64. The CMS-64 does not specify the type of institutional LTSS. HCBS - unspecified refers to HCBS provided through managed care organizations and fee-for-service HCBS provided in section 1115 demonstrations that were not authorized under another state plan or waiver authority. IMD for people under age 21 or age 65 and older, case management, rehabilitative services, private duty nursing, state plan HCBS, and health homes data do not include services provided through managed care organizations.

Montana Table 27
Service Type FY 2012 FY 2013
Percent Change 12-13 FY 2014
Percent Change 13-14 FY 2015
Percent Change 14-15
FY 2015 Expenditures Per Resident
Total-Older Adults, People with PD $253,970,475 $254,219,051 0.1 $255,664,735 0.6 $268,099,049 4.9 $262.11 Nursing facilities $162,086,707 $160,723,463 -0.8 $161,607,970 0.6 $165,540,894 2.4 $161.84 Personal care $42,065,113 $42,331,865 0.6 $26,521,271 -37.3 $10,294,283 -61.2 $10.06 1915(c) waivers - AD $31,495,804 $31,502,581 0.0 $30,408,872 -3.5 $31,844,514 4.7 $31.13 Home health $14,273,584 $15,352,918 7.6 $14,835,592 -3.4 $15,076,215 1.6 $14.74 Community first choice $0 $0 0.0 $18,131,543 100.0 $41,006,390 126.2 $40.09 HCBS - unspecified - AD $0 $0 0.0 $0 0.0 $0 0.0 $0.00 PACE $0 $0 0.0 $0 0.0 $0 0.0 $0.00 Private duty nursing $4,049,267 $4,308,224 6.4 $4,159,487 -3.5 $4,336,753 4.3 $4.24 Self-directed PAS - alternative to 1915(c) $0 $0 0.0 $0 0.0 $0 0.0 $0.00 Self-directed PAS - alternative to personal care $0 $0 0.0 $0 0.0 $0 0.0 $0.00 Health homes - AD $0 $0 0.0 $0 0.0 $0 0.0 $0.00 State plan HCBS - AD $0 $0 0.0 $0 0.0 $0 0.0 $0.00 Total-People with DD $98,987,652 $103,592,471 4.7 $110,720,199 6.9 $114,489,420 3.4 $111.93 ICF/IID - public $11,218,733 $10,242,297 -8.7 $11,047,364 7.9 $11,603,797 5.0 $11.34 ICF/IID - private $101,373 $54,779 -46.0 $72,080 31.6 $0 -100.0 $0.00 1915(c) waivers - DD $87,667,546 $93,295,395 6.4 $99,600,755 6.8 $102,885,623 3.3 $100.59 HCBS - unspecified - DD $0 $0 0.0 $0 0.0 $0 0.0 $0.00 State plan HCBS - DD $0 $0 0.0 $0 0.0 $0 0.0 $0.00 Total-Behavioral Health Services $42,594,818 $44,123,906 3.6 $47,246,193 7.1 $51,946,503 9.9 $50.79 IMD for people under age 21 or age 65 and older $15,701,828 $18,089,515 15.2 $20,325,881 12.4 $23,361,699 14.9 $22.84 Mental health facilities DSH $0 $0 0.0 $0 0.0 $0 0.0 $0.00 Rehabilitative services $23,769,900 $22,904,113 -3.6 $23,288,425 1.7 $24,874,174 6.8 $24.32 1915(c) waivers - BHS $3,123,090 $3,049,401 -2.4 $3,306,160 8.4 $3,607,741 9.1 $3.53 State plan HCBS - BHS $0 $80,877 100.0 $325,727 302.7 $102,889 -68.4 $0.10 Health homes - BHS $0 $0 0.0 $0 0.0 $0 0.0 $0.00 Total-Other/Multiple Populations $27,278,859 $26,797,651 -1.8 $30,836,443 15.1 $34,113,425 10.6 $33.35 Case management $27,278,859 $26,797,651 -1.8 $30,749,090 14.7 $32,817,770 6.7 $32.08 1915(c) waivers - other $0 $0 0.0 $0 0.0 $0 0.0 $0.00 HCBS - unspecified - other $0 $0 0.0 $0 0.0 $0 0.0 $0.00 Health homes - other or multiple $0 $0 0.0 $0 0.0 $0 0.0 $0.00 Institutional MLTSS – unspecified $0 $0 0.0 $0 0.0 $0 0.0 $0.00 MFP demonstration $0 $0 0.0 $87,353 100.0 $1,295,655 1383.2 $1.27 Total LTSS $422,831,804 $428,733,079 1.4 $444,467,570 3.7 $468,648,397 5.4 $458.17 Total Institutional LTSS $189,108,641 $189,110,054 0.0 $193,053,295 2.1 $200,506,390 3.9 $196.02 Total HCBS $233,723,163 $239,623,025 2.5 $251,414,275 4.9 $268,142,007 6.7 $262.15 Total Medicaid (all services) $963,923,541 $1,007,885,833 4.6 $1,088,467,612 8.0 $1,151,150,342 5.8 $1,125.42
Percentages FY 2012 FY 2013 FY 2014 FY 2015
Total LTSS as a Percentage of Total Medicaid 43.9% 42.5% 40.8% 40.7% Percentage of LTSS that is HCBS 55.3% 55.9% 56.6% 57.2% Percentage of LTSS that is HCBS – AD 36.2% 36.8% 36.8% 38.3% Percentage of LTSS that is HCBS – DD 88.6% 90.1% 90.0% 89.9% Percentage of LTSS that is HCBS – BHS 63.1% 59.0% 57.0% 55.0%
Notes: Expenditures are total Medicaid spending, including both federal and state payments. Data for several states include expenditures for Medicaid Upper Payment Limit programs or provider taxes. Institutional MLTSS - unspecified refers to institutional LTSS provided through managed care organizations and reported on the CMS-64. The CMS-64 does not specify the type of institutional LTSS. HCBS - unspecified refers to HCBS provided through managed care organizations and fee-for-service HCBS provided in section 1115 demonstrations that were not authorized under another state plan or waiver authority. IMD for people under age 21 or age 65 and older, case management, rehabilitative services, private duty nursing, state plan HCBS, and health homes data do not include services provided through managed care organizations.

Nebraska Table 28
Service Type FY 2012 FY 2013
Percent Change 12-13 FY 2014
Percent Change 13-14 FY 2015
Percent Change 14-15
FY 2015 Expenditures Per Resident
Total-Older Adults, People with PD $427,553,956 $440,976,051 3.1 $456,105,525 3.4 $464,136,244 1.8 $246.73 Nursing facilities $326,999,066 $334,682,262 2.3 $342,167,900 2.2 $340,031,830 -0.6 $180.76 Personal care $14,378,242 $16,952,865 17.9 $19,736,009 16.4 $20,619,595 4.5 $10.96 1915(c) waivers - AD $69,363,837 $73,995,079 6.7 $78,033,299 5.5 $85,735,791 9.9 $45.58 Home health $16,812,811 $14,829,743 -11.8 $13,277,052 -10.5 $13,286,561 0.1 $7.06 Community first choice $0 $0 0.0 $0 0.0 $0 0.0 $0.00 HCBS - unspecified - AD $0 $0 0.0 $0 0.0 $0 0.0 $0.00 PACE $0 $516,102 100.0 $2,891,265 460.2 $4,462,467 54.3 $2.37 Private duty nursing $0 $0 0.0 $0 0.0 $0 0.0 $0.00 Self-directed PAS - alternative to 1915(c) $0 $0 0.0 $0 0.0 $0 0.0 $0.00 Self-directed PAS - alternative to personal care $0 $0 0.0 $0 0.0 $0 0.0 $0.00 Health homes - AD $0 $0 0.0 $0 0.0 $0 0.0 $0.00 State plan HCBS - AD $0 $0 0.0 $0 0.0 $0 0.0 $0.00 Total-People with DD $274,368,525 $321,192,652 17.1 $318,280,770 -0.9 $324,671,265 2.0 $172.59 ICF/IID - public $33,850,894 $49,228,520 45.4 $42,193,718 -14.3 $29,044,654 -31.2 $15.44 ICF/IID - private $23,802,606 $37,785,913 58.7 $31,786,558 -15.9 $32,906,368 3.5 $17.49 1915(c) waivers - DD $216,715,025 $234,178,219 8.1 $244,300,494 4.3 $262,720,243 7.5 $139.66 HCBS - unspecified - DD $0 $0 0.0 $0 0.0 $0 0.0 $0.00 State plan HCBS - DD $0 $0 0.0 $0 0.0 $0 0.0 $0.00 Total-Behavioral Health Services $14,705,301 $20,100,091 36.7 $3,910,075 -80.5 $1,487,438 -62.0 $0.79 IMD for people under age 21 or age 65 and older $12,893,963 $18,527,793 43.7 $2,098,738 -88.7 $48,732 -97.7 $0.03 Mental health facilities DSH $1,811,338 $1,572,298 -13.2 $1,811,337 15.2 $1,438,706 -20.6 $0.76 Rehabilitative services $0 $0 0.0 $0 0.0 $0 0.0 $0.00 1915(c) waivers - BHS $0 $0 0.0 $0 0.0 $0 0.0 $0.00 State plan HCBS - BHS $0 $0 0.0 $0 0.0 $0 0.0 $0.00 Health homes - BHS $0 $0 0.0 $0 0.0 $0 0.0 $0.00 Total-Other/Multiple Populations $28,594,298 $30,959,122 8.3 $28,758,417 -7.1 $29,754,372 3.5 $15.82 Case management $26,548,782 $27,971,305 5.4 $26,248,690 -6.2 $28,037,720 6.8 $14.90 1915(c) waivers - other $651,529 $688,624 5.7 $661,095 -4.0 $680,648 3.0 $0.36 HCBS - unspecified - other $0 $0 0.0 $0 0.0 $0 0.0 $0.00 Health homes - other or multiple $0 $0 0.0 $0 0.0 $0 0.0 $0.00 Institutional MLTSS – unspecified $0 $0 0.0 $0 0.0 $0 0.0 $0.00 MFP demonstration $1,393,987 $2,299,193 64.9 $1,848,632 -19.6 $1,036,004 -44.0 $0.55 Total LTSS $745,222,080 $813,227,916 9.1 $807,054,787 -0.8 $820,049,319 1.6 $435.93 Total Institutional LTSS $399,357,867 $441,796,786 10.6 $420,058,251 -4.9 $403,470,290 -3.9 $214.48 Total HCBS $345,864,213 $371,431,130 7.4 $386,996,536 4.2 $416,579,029 7.6 $221.45 Total Medicaid (all services) $1,731,564,838 $1,843,597,981 6.5 $1,830,410,451 -0.7 $1,884,258,567 2.9 $1,001.66
Percentages FY 2012 FY 2013 FY 2014 FY 2015
Total LTSS as a Percentage of Total Medicaid 43.0% 44.1% 44.1% 43.5% Percentage of LTSS that is HCBS 46.4% 45.7% 48.0% 50.8% Percentage of LTSS that is HCBS – AD 23.5% 24.1% 25.0% 26.7% Percentage of LTSS that is HCBS – DD 79.0% 72.9% 76.8% 80.9% Percentage of LTSS that is HCBS – BHS 0.0% 0.0% 0.0% 0.0%
Notes: Expenditures are total Medicaid spending, including both federal and state payments. Data for several states include expenditures for Medicaid Upper Payment Limit programs or provider taxes. Institutional MLTSS - unspecified refers to institutional LTSS provided through managed care organizations and reported on the CMS-64. The CMS-64 does not specify the type of institutional LTSS. HCBS - unspecified refers to HCBS provided through managed care organizations and fee-for-service HCBS provided in section 1115 demonstrations that were not authorized under another state plan or waiver authority. IMD for people under age 21 or age 65 and older, case management, rehabilitative services, private duty nursing, state plan HCBS, and health homes data do not include services provided through managed care organizations.

Nevada Table 29
Service Type FY 2012 FY 2013
Percent Change 12-13 FY 2014
Percent Change 13-14 FY 2015
Percent Change 14-15
FY 2015 Expenditures Per Resident
Total-Older Adults, People with PD $287,635,476 $293,612,369 2.1 $314,983,718 7.3 $336,018,397 6.7 $118.61 Nursing facilities $191,084,172 $190,989,542 0.0 $203,010,450 6.3 $214,752,988 5.8 $75.80 Personal care $62,856,358 $73,489,897 16.9 $84,495,959 15.0 $89,603,207 6.0 $31.63 1915(c) waivers - AD $12,769,577 $12,635,994 -1.0 $14,265,295 12.9 $15,757,228 10.5 $5.56 Home health $11,047,128 $4,441,944 -59.8 $1,754,215 -60.5 $1,480,760 -15.6 $0.52 Community first choice $0 $0 0.0 $0 0.0 $0 0.0 $0.00 HCBS - unspecified - AD $0 $0 0.0 $0 0.0 $0 0.0 $0.00 PACE $0 $0 0.0 $0 0.0 $0 0.0 $0.00 Private duty nursing $9,878,241 $12,054,992 22.0 $11,457,799 -5.0 $14,424,214 25.9 $5.09 Self-directed PAS - alternative to 1915(c) $0 $0 0.0 $0 0.0 $0 0.0 $0.00 Self-directed PAS - alternative to personal care $0 $0 0.0 $0 0.0 $0 0.0 $0.00 Health homes - AD $0 $0 0.0 $0 0.0 $0 0.0 $0.00 State plan HCBS - AD $0 $0 0.0 $0 0.0 $0 0.0 $0.00 Total-People with DD $89,719,090 $85,089,067 -5.2 $99,605,285 17.1 $108,245,744 8.7 $38.21 ICF/IID - public $9,914,605 $9,989,461 0.8 $10,944,109 9.6 $9,888,090 -9.6 $3.49 ICF/IID - private $8,040,883 $7,748,203 -3.6 $7,631,640 -1.5 $7,159,025 -6.2 $2.53 1915(c) waivers - DD $71,763,602 $67,351,403 -6.1 $81,029,536 20.3 $91,198,629 12.5 $32.19 HCBS - unspecified - DD $0 $0 0.0 $0 0.0 $0 0.0 $0.00 State plan HCBS - DD $0 $0 0.0 $0 0.0 $0 0.0 $0.00 Total-Behavioral Health Services $76,311,969 $81,644,613 7.0 $74,238,819 -9.1 $131,266,926 76.8 $46.33 IMD for people under age 21 or age 65 and older $48,232,102 $52,899,600 9.7 $46,881,973 -11.4 $54,043,378 15.3 $19.08 Mental health facilities DSH $0 $0 0.0 $0 0.0 $0 0.0 $0.00 Rehabilitative services $22,929,898 $23,305,033 1.6 $20,640,663 -11.4 $69,893,594 238.6 $24.67 1915(c) waivers - BHS $0 $0 0.0 $0 0.0 $0 0.0 $0.00 State plan HCBS - BHS $5,149,969 $5,439,980 5.6 $6,716,183 23.5 $7,329,954 9.1 $2.59 Health homes - BHS $0 $0 0.0 $0 0.0 $0 0.0 $0.00 Total-Other/Multiple Populations $48,724,160 $49,419,729 1.4 $42,498,854 -14.0 $40,334,765 -5.1 $14.24 Case management $48,724,018 $49,131,256 0.8 $41,189,524 -16.2 $38,181,589 -7.3 $13.48 1915(c) waivers - other $0 $0 0.0 $0 0.0 $0 0.0 $0.00 HCBS - unspecified - other $0 $0 0.0 $0 0.0 $0 0.0 $0.00 Health homes - other or multiple $0 $0 0.0 $0 0.0 $0 0.0 $0.00 Institutional MLTSS – unspecified $0 $0 0.0 $0 0.0 $0 0.0 $0.00 MFP demonstration $142 $288,473 203050.0 $1,309,330 353.9 $2,153,176 64.4 $0.76 Total LTSS $502,390,695 $509,765,778 1.5 $531,326,676 4.2 $615,865,832 15.9 $217.39 Total Institutional LTSS $257,271,762 $261,626,806 1.7 $268,468,172 2.6 $285,843,481 6.5 $100.90 Total HCBS $245,118,933 $248,138,972 1.2 $262,858,504 5.9 $330,022,351 25.6 $116.49 Total Medicaid (all services) $1,730,802,213 $1,798,734,564 3.9 $2,327,940,250 29.4 $3,063,479,987 31.6 $1,081.35
Percentages FY 2012 FY 2013 FY 2014 FY 2015 Total LTSS as a Percentage of Total Medicaid 29.0% 28.3% 22.8% 20.1% Percentage of LTSS that is HCBS 48.8% 48.7% 49.5% 53.6% Percentage of LTSS that is HCBS – AD 33.6% 35.0% 35.5% 36.1% Percentage of LTSS that is HCBS – DD 80.0% 79.2% 81.4% 84.3% Percentage of LTSS that is HCBS – BHS 36.8% 35.2% 36.8% 58.8%
Notes: Expenditures are total Medicaid spending, including both federal and state payments. Data for several states include expenditures for Medicaid Upper Payment Limit programs or provider taxes. Institutional MLTSS - unspecified refers to institutional LTSS provided through managed care organizations and reported on the CMS-64. The CMS-64 does not specify the type of institutional LTSS. HCBS - unspecified refers to HCBS provided through managed care organizations and fee-for-service HCBS provided in section 1115 demonstrations that were not authorized under another state plan or waiver authority. IMD for people under age 21 or age 65 and older, case management, rehabilitative services, private duty nursing, state plan HCBS, and health homes data do not include services provided through managed care organizations.

New Hampshire Table 30
Service Type FY 2012 FY 2013
Percent Change 12-13 FY 2014
Percent Change 13-14 FY 2015
Percent Change 14-15
FY 2015 Expenditures Per Resident
Total-Older Adults, People with PD $399,537,594 $392,232,254 -1.8 $423,961,167 8.1 $404,141,676 -4.7 $304.15 Nursing facilities $324,511,092 $317,801,107 -2.1 $356,936,305 12.3 $341,825,520 -4.2 $257.25 Personal care $7,106,204 $6,835,181 -3.8 $4,576,000 -33.1 $4,482,388 -2.0 $3.37 1915(c) waivers - AD $50,389,212 $49,210,835 -2.3 $50,130,161 1.9 $47,591,629 -5.1 $35.82 Home health $11,392,145 $10,613,894 -6.8 $6,683,966 -37.0 $5,264,429 -21.2 $3.96 Community first choice $0 $0 0.0 $0 0.0 $0 0.0 $0.00 HCBS - unspecified - AD $0 $0 0.0 $0 0.0 $0 0.0 $0.00 PACE $0 $0 0.0 $0 0.0 $0 0.0 $0.00 Private duty nursing $6,138,941 $7,771,237 26.6 $5,634,735 -27.5 $4,977,710 -11.7 $3.75 Self-directed PAS - alternative to 1915(c) $0 $0 0.0 $0 0.0 $0 0.0 $0.00 Self-directed PAS - alternative to personal care $0 $0 0.0 $0 0.0 $0 0.0 $0.00 Health homes - AD $0 $0 0.0 $0 0.0 $0 0.0 $0.00 State plan HCBS - AD $0 $0 0.0 $0 0.0 $0 0.0 $0.00 Total-People with DD $195,963,420 $192,381,667 -1.8 $219,037,283 13.9 $230,171,670 5.1 $173.23 ICF/IID - public $3,252,890 $1,841,199 -43.4 $0 -100.0 $0 0.0 $0.00 ICF/IID - private $0 $0 0.0 $641,458 100.0 $8,891,427 1286.1 $6.69 1915(c) waivers - DD $192,710,530 $190,540,468 -1.1 $218,395,825 14.6 $221,280,243 1.3 $166.53 HCBS - unspecified - DD $0 $0 0.0 $0 0.0 $0 0.0 $0.00 State plan HCBS - DD $0 $0 0.0 $0 0.0 $0 0.0 $0.00 Total-Behavioral Health Services $107,872,261 $112,523,961 4.3 $76,368,310 -32.1 $78,477,342 2.8 $59.06 IMD for people under age 21 or age 65 and older $7,541,582 $7,447,459 -1.2 $2,605,674 -65.0 $7,723,274 196.4 $5.81 Mental health facilities DSH $27,609,967 $23,013,040 -16.6 $25,113,766 9.1 $31,688,938 26.2 $23.85 Rehabilitative services $72,720,712 $82,063,462 12.8 $48,648,870 -40.7 $39,065,130 -19.7 $29.40 1915(c) waivers - BHS $0 $0 0.0 $0 0.0 $0 0.0 $0.00 State plan HCBS - BHS $0 $0 0.0 $0 0.0 $0 0.0 $0.00 Health homes - BHS $0 $0 0.0 $0 0.0 $0 0.0 $0.00 Total-Other/Multiple Populations $19,167,838 $37,446,701 95.4 $85,059,909 127.1 $100,217,291 17.8 $75.42 Case management $59,637 $17,790,849 29731.9 $20,667,200 16.2 $18,865,337 -8.7 $14.20 1915(c) waivers - other $17,481,231 $18,178,347 4.0 $22,254,385 22.4 $21,382,069 -3.9 $16.09 HCBS - unspecified - other $0 $0 0.0 $40,371,724 100.0 $59,022,410 46.2 $44.42 Health homes - other or multiple $0 $0 0.0 $0 0.0 $0 0.0 $0.00 Institutional MLTSS – unspecified $0 $0 0.0 $0 0.0 $0 0.0 $0.00 MFP demonstration $1,626,970 $1,477,505 -9.2 $1,766,600 19.6 $947,475 -46.4 $0.71 Total LTSS $722,541,113 $734,584,583 1.7 $804,426,669 9.5 $813,007,979 1.1 $611.86 Total Institutional LTSS $362,915,531 $350,102,805 -3.5 $385,297,203 10.1 $390,129,159 1.3 $293.61 Total HCBS $359,625,582 $384,481,778 6.9 $419,129,466 9.0 $422,878,820 0.9 $318.25 Total Medicaid (all services) $1,221,515,448 $1,204,274,022 -1.4 $1,386,185,581 15.1 $1,724,417,722 24.4 $1,297.78
Percentages FY 2012 FY 2013 FY 2014 FY 2015
Total LTSS as a Percentage of Total Medicaid 59.2% 61.0% 58.0% 47.1% Percentage of LTSS that is HCBS 49.8% 52.3% 52.1% 52.0% Percentage of LTSS that is HCBS – AD 18.8% 19.0% 15.8% 15.4% Percentage of LTSS that is HCBS – DD 98.3% 99.0% 99.7% 96.1% Percentage of LTSS that is HCBS – BHS 67.4% 72.9% 63.7% 49.8%
Notes: Expenditures are total Medicaid spending, including both federal and state payments. Data for several states include expenditures for Medicaid Upper Payment Limit programs or provider taxes. Institutional MLTSS - unspecified refers to institutional LTSS provided through managed care organizations and reported on the CMS-64. The CMS-64 does not specify the type of institutional LTSS. HCBS - unspecified refers to HCBS provided through managed care organizations and fee-for-service HCBS provided in section 1115 demonstrations that were not authorized under another state plan or waiver authority. IMD for people under age 21 or age 65 and older, case management, rehabilitative services, private duty nursing, state plan HCBS, and health homes data do not include services provided through managed care organizations.

New Jersey Table 31
Service Type FY 2012 FY 2013
Percent Change 12-13 FY 2014
Percent Change 13-14 FY 2015
Percent Change 14-15
FY 2015 Expenditures Per Resident
Total-Older Adults, People with PD $2,161,961,323 $2,193,549,276 1.5 $2,188,927,086 -0.2 $2,199,483,975 0.5 $246.44 Nursing facilities $1,823,551,529 $1,828,596,548 0.3 $1,840,133,277 0.6 $1,759,935,928 -4.4 $197.19 Personal care $83,412,009 $64,895,913 -22.2 $65,144,011 0.4 $63,974,258 -1.8 $7.17 1915(c) waivers - AD $197,280,915 $20,477,638 -89.6 $268,406 -98.7 $0 -100.0 $0.00 Home health $4,403,940 $2,379,163 -46.0 $1,635,716 -31.2 $1,137,197 -30.5 $0.13 Community first choice $0 $0 0.0 $0 0.0 $0 0.0 $0.00 HCBS - unspecified - AD $0 $198,602,042 100.0 $196,751,674 -0.9 $319,161,188 62.2 $35.76 PACE $30,395,969 $39,273,430 29.2 $44,055,745 12.2 $43,803,101 -0.6 $4.91 Private duty nursing $1,399,112 $1,007,425 -28.0 $1,488,894 47.8 $1,614,656 8.4 $0.18 Self-directed PAS - alternative to 1915(c) $0 $984,156 100.0 $0 -100.0 $8,498,017 100.0 $0.95 Self-directed PAS - alternative to personal care $21,517,849 $37,332,961 73.5 $39,449,363 5.7 $1,359,630 -96.6 $0.15 Health homes - AD $0 $0 0.0 $0 0.0 $0 0.0 $0.00 State plan HCBS - AD $0 $0 0.0 $0 0.0 $0 0.0 $0.00 Total-People with DD $1,333,990,386 $1,405,626,090 5.4 $1,489,222,660 5.9 $1,472,596,108 -1.1 $165.00 ICF/IID - public $638,993,352 $686,514,965 7.4 $652,624,819 -4.9 $497,159,282 -23.8 $55.70 ICF/IID - private $11,879,917 $10,613,297 -10.7 $11,724,153 10.5 $11,274,320 -3.8 $1.26 1915(c) waivers - DD $683,117,117 $708,497,828 3.7 $824,873,688 16.4 $964,162,506 16.9 $108.03 HCBS - unspecified - DD $0 $0 0.0 $0 0.0 $0 0.0 $0.00 State plan HCBS - DD $0 $0 0.0 $0 0.0 $0 0.0 $0.00 Total-Behavioral Health Services $474,908,745 $469,246,242 -1.2 $481,260,752 2.6 $480,868,640 -0.1 $53.88 IMD for people under age 21 or age 65 and older $105,395,811 $95,383,334 -9.5 $106,260,435 11.4 $105,568,137 -0.7 $11.83 Mental health facilities DSH $357,370,460 $357,370,462 0.0 $357,370,460 0.0 $357,370,460 0.0 $40.04 Rehabilitative services $12,142,474 $16,492,446 35.8 $17,629,857 6.9 $17,930,043 1.7 $2.01 1915(c) waivers - BHS $0 $0 0.0 $0 0.0 $0 0.0 $0.00 State plan HCBS - BHS $0 $0 0.0 $0 0.0 $0 0.0 $0.00 Health homes - BHS $0 $0 0.0 $0 0.0 $0 0.0 $0.00 Total-Other/Multiple Populations $58,879,316 $398,942,926 577.6 $883,255,194 121.4 $736,842,148 -16.6 $82.56
Case management $23,910,348 $23,666,911 -1.0 $26,888,369 13.6 $27,588,690 2.6 $3.09 1915(c) waivers - other $29,124,950 $4,888,450 -83.2 $56,827 -98.8 $8,597 -84.9 $0.00 HCBS - unspecified - other $0 $357,272,414 100.0 $799,177,071 123.7 $690,677,518 -13.6 $77.39 Health homes - other or multiple $0 $0 0.0 $0 0.0 $0 0.0 $0.00 Institutional MLTSS – unspecified $0 $2,340,857 100.0 $35,635,312 1422.3 $0 -100.0 $0.00 MFP demonstration $5,844,018 $10,774,294 84.4 $21,497,615 99.5 $18,567,343 -13.6 $2.08 Total LTSS $4,029,739,770 $4,467,364,534 10.9 $5,042,665,692 12.9 $4,889,790,871 -3.0 $547.88 Total Institutional LTSS $2,937,191,069 $2,980,819,463 1.5 $3,003,748,456 0.8 $2,731,308,127 -9.1 $306.03 Total HCBS $1,092,548,701 $1,486,545,071 36.1 $2,038,917,236 37.2 $2,158,482,744 5.9 $241.85 Total Medicaid (all services) $10,595,226,441 $10,692,984,472 0.9 $12,604,053,353 17.9 $14,405,135,592 14.3 $1,614.02
Percentages FY 2012 FY 2013 FY 2014 FY 2015
Total LTSS as a Percentage of Total Medicaid 38.0% 41.8% 40.0% 33.9% Percentage of LTSS that is HCBS 27.1% 33.3% 40.4% 44.1% Percentage of LTSS that is HCBS – AD 15.7% 16.6% 15.9% 20.0% Percentage of LTSS that is HCBS – DD 51.2% 50.4% 55.4% 65.5% Percentage of LTSS that is HCBS – BHS 2.6% 3.5% 3.7% 3.7%
Notes: Expenditures are total Medicaid spending, including both federal and state payments. Data for several states include expenditures for Medicaid Upper Payment Limit programs or provider taxes. Institutional MLTSS - unspecified refers to institutional LTSS provided through managed care organizations and reported on the CMS-64. The CMS-64 does not specify the type of institutional LTSS. HCBS - unspecified refers to HCBS provided through managed care organizations and fee-for-service HCBS provided in section 1115 demonstrations that were not authorized under another state plan or waiver authority. IMD for people under age 21 or age 65 and older, case management, rehabilitative services, private duty nursing, state plan HCBS, and health homes data do not include services provided through managed care organizations.

New Mexico Table 32
Service Type FY 2012 FY 2013
Percent Change 12-13 FY 2014
Percent Change 13-14 FY 2015
Percent Change 14-15
FY 2015 Expenditures Per Resident
Total-Older Adults, People with PD $46,438,538 $52,307,166 12.6 $621,002,813 1087.2 $1,000,901,370 61.2 $480.50 Nursing facilities $2,701,522 $3,337,030 23.5 $221,914,192 6550.1 $260,091,378 17.2 $124.86 Personal care $576,513 $637,067 10.5 $291,849,319 45711.4 $0 -100.0 $0.00 1915(c) waivers - AD $27,821,245 $32,792,706 17.9 $12,973,334 -60.4 $1,768 -100.0 $0.00 Home health $3,415,047 $3,441,688 0.8 $35,304,222 925.8 $15,135,013 -57.1 $7.27 Community first choice $0 $0 0.0 $0 0.0 $0 0.0 $0.00 HCBS - unspecified - AD $0 $0 0.0 $46,853,589 100.0 $713,711,476 1423.3 $342.63 PACE $11,556,837 $11,738,681 1.6 $11,873,948 1.2 $11,832,530 -0.3 $5.68 Private duty nursing $367,374 $359,994 -2.0 $234,209 -34.9 $129,205 -44.8 $0.06 Self-directed PAS - alternative to 1915(c) $0 $0 0.0 $0 0.0 $0 0.0 $0.00 Self-directed PAS - alternative to personal care $0 $0 0.0 $0 0.0 $0 0.0 $0.00 Health homes - AD $0 $0 0.0 $0 0.0 $0 0.0 $0.00 State plan HCBS - AD $0 $0 0.0 $0 0.0 $0 0.0 $0.00 Total-People with DD $302,973,903 $309,753,406 2.2 $325,825,430 5.2 $345,881,686 6.2 $166.05 ICF/IID - public $781,353 $782,441 0.1 $1,039,709 32.9 $851,927 -18.1 $0.41 ICF/IID - private $24,027,964 $24,194,633 0.7 $24,848,666 2.7 $25,433,670 2.4 $12.21 1915(c) waivers - DD $278,164,586 $284,776,332 2.4 $299,937,055 5.3 $319,596,089 6.6 $153.43 HCBS - unspecified - DD $0 $0 0.0 $0 0.0 $0 0.0 $0.00 State plan HCBS - DD $0 $0 0.0 $0 0.0 $0 0.0 $0.00 Total-Behavioral Health Services $4,265,273 $2,689,771 -36.9 $1,788,732 -33.5 $1,856,182 3.8 $0.89 IMD for people under age 21 or age 65 and older $4,228,269 $2,651,117 -37.3 $1,770,610 -33.2 $1,849,293 4.4 $0.89 Mental health facilities DSH $0 $0 0.0 $0 0.0 $0 0.0 $0.00 Rehabilitative services $37,004 $38,654 4.5 $18,122 -53.1 $6,889 -62.0 $0.00 1915(c) waivers - BHS $0 $0 0.0 $0 0.0 $0 0.0 $0.00 State plan HCBS - BHS $0 $0 0.0 $0 0.0 $0 0.0 $0.00 Health homes - BHS $0 $0 0.0 $0 0.0 $0 0.0 $0.00 Total-Other/Multiple Populations $2,065,282 $1,978,902 -4.2 $1,690,449 -14.6 $1,658,249 -1.9 $0.80 Case management $35,906 $37,948 5.7 $23,429 -38.3 $13,757 -41.3 $0.01 1915(c) waivers - other $2,029,376 $1,940,954 -4.4 $1,667,020 -14.1 $1,644,492 -1.4 $0.79 HCBS - unspecified - other $0 $0 0.0 $0 0.0 $0 0.0 $0.00 Health homes - other or multiple $0 $0 0.0 $0 0.0 $0 0.0 $0.00 Institutional MLTSS – unspecified $0 $0 0.0 $0 0.0 $0 0.0 $0.00 MFP demonstration $0 $0 0.0 $0 0.0 $0 0.0 $0.00 Total LTSS $355,742,996 $366,729,245 3.1 $950,307,424 159.1 $1,350,297,487 42.1 $648.24 Total Institutional LTSS $31,739,108 $30,965,221 -2.4 $249,573,177 706.0 $288,226,268 15.5 $138.37 Total HCBS $324,003,888 $335,764,024 3.6 $700,734,247 108.7 $1,062,071,219 51.6 $509.87 Total Medicaid (all services) $3,340,811,555 $3,274,464,853 -2.0 $4,274,784,112 30.5 $4,952,666,769 15.9 $2,377.63
Percentages FY 2012 FY 2013 FY 2014 FY 2015
Total LTSS as a Percentage of Total Medicaid 10.6% 11.2% 22.2% 27.3% Percentage of LTSS that is HCBS n/a n/a 73.7% 78.7% Percentage of LTSS that is HCBS – AD n/a n/a 64.3% 74.0% Percentage of LTSS that is HCBS – DD 91.8% 91.9% 92.1% 92.4% Percentage of LTSS that is HCBS – BHS 0.9% 1.4% 1.0% 0.4%
Notes: Expenditures are total Medicaid spending, including both federal and state payments. Data for several states include expenditures for Medicaid Upper Payment Limit programs or provider taxes. Institutional MLTSS - unspecified refers to institutional LTSS provided through managed care organizations and reported on the CMS-64. The CMS-64 does not specify the type of institutional LTSS. HCBS - unspecified refers to HCBS provided through managed care organizations and fee-for-service HCBS provided in section 1115 demonstrations that were not authorized under another state plan or waiver authority. IMD for people under age 21 or age 65 and older, case management, rehabilitative services, private duty nursing, state plan HCBS, and health homes data do not include services provided through managed care organizations. Data do not include expenditures for managed long-term services and supports from 2012 through 2013. The percentage of LTSS for HCBS, overall and for older adults and people with physical disabilities, is not calculated for 2012 through 2013 because a significant portion of data are missing. New Mexico 2015 HCBS - unspecified data include expenditures for personal care expenditures within a managed care program. The state provided a single estimate for personal care and HCBS - unspecified.

New York Table 33
Service Type FY 2012 FY 2013
Percent Change 12-13 FY 2014
Percent Change 13-14 FY 2015
Percent Change 14-15
FY 2015 Expenditures Per Resident
Total-Older Adults, People with PD $13,282,646,090 $13,743,492,545 3.5 $13,102,531,694 -4.7 $14,047,326,704 7.2 $712.39 Nursing facilities $7,275,624,053 $7,265,138,796 -0.1 $6,944,351,612 -4.4 $6,882,589,408 -0.9 $349.04 Personal care $3,856,888,096 $4,355,003,424 12.9 $4,514,350,533 3.7 $4,639,053,660 2.8 $235.26 1915(c) waivers - AD $106,348,757 $135,572,972 27.5 $132,008,969 -2.6 $147,558,128 11.8 $7.48 Home health $1,807,652,842 $1,654,725,050 -8.5 $1,117,066,384 -32.5 $845,567,859 -24.3 $42.88 Community first choice $0 $0 0.0 $0 0.0 $1,161,516,682 100.0 $58.90 HCBS - unspecified - AD $0 $49,812,991 100.0 $64,465,573 29.4 $71,685,542 11.2 $3.64 PACE $236,132,342 $283,239,312 19.9 $330,288,623 16.6 $299,355,425 -9.4 $15.18 Private duty nursing $0 $0 0.0 $0 0.0 $0 0.0 $0.00 Self-directed PAS - alternative to 1915(c) $0 $0 0.0 $0 0.0 $0 0.0 $0.00 Self-directed PAS - alternative to personal care $0 $0 0.0 $0 0.0 $0 0.0 $0.00 Health homes - AD $0 $0 0.0 $0 0.0 $0 0.0 $0.00 State plan HCBS - AD $0 $0 0.0 $0 0.0 $0 0.0 $0.00 Total-People with DD $8,910,817,212 $7,351,110,776 -17.5 $6,189,840,208 -15.8 $6,996,476,756 13.0 $354.82 ICF/IID - public $2,302,619,635 $921,582,940 -60.0 $445,457,655 -51.7 $348,772,437 -21.7 $17.69 ICF/IID - private $1,079,775,306 $1,179,775,837 9.3 $1,093,380,500 -7.3 $1,513,293,961 38.4 $76.74 1915(c) waivers - DD $5,528,422,271 $5,249,751,999 -5.0 $4,651,002,053 -11.4 $5,134,410,358 10.4 $260.39 HCBS - unspecified - DD $0 $0 0.0 $0 0.0 $0 0.0 $0.00 State plan HCBS - DD $0 $0 0.0 $0 0.0 $0 0.0 $0.00 Total-Behavioral Health Services $1,190,399,447 $1,163,035,262 -2.3 $1,192,289,672 2.5 $876,199,499 -26.5 $44.44 IMD for people under age 21 or age 65 and older $510,562,873 $479,092,847 -6.2 $452,635,982 -5.5 $437,492,879 -3.3 $22.19 Mental health facilities DSH $605,000,000 $605,000,000 0.0 $605,000,000 0.0 $302,500,000 -50.0 $15.34 Rehabilitative services $17,836 $214 -98.8 $0 -100.0 $153 100.0 $0.00 1915(c) waivers - BHS $74,818,738 $78,942,201 5.5 $134,653,690 70.6 $136,206,467 1.2 $6.91 State plan HCBS - BHS $0 $0 0.0 $0 0.0 $0 0.0 $0.00 Health homes - BHS $0 $0 0.0 $0 0.0 $0 0.0 $0.00 Total-Other/Multiple Populations $551,251,137 $641,468,339 16.4 $1,911,903,908 198.1 $890,462,838 -53.4 $45.16 Case management $388,037,326 $292,302,802 -24.7 $252,560,431 -13.6 $230,914,020 -8.6 $11.71 1915(c) waivers - other $127,277,872 $148,780,365 16.9 $159,686,274 7.3 $168,101,563 5.3 $8.53 HCBS - unspecified - other $0 $0 0.0 $1,185,192,594 100.0 $0 -100.0 $0.00 Health homes - other or multiple $11,767,759 $178,765,959 1419.1 $292,350,240 63.5 $472,619,404 61.7 $23.97 Institutional MLTSS – unspecified $0 $0 0.0 $0 0.0 $0 0.0 $0.00 MFP demonstration $24,168,180 $21,619,213 -10.5 $22,114,369 2.3 $18,827,851 -14.9 $0.95 Total LTSS $23,935,113,886 $22,899,106,922 -4.3 $22,396,565,482 -2.2 $22,810,465,797 1.8 $1,156.80 Total Institutional LTSS $11,773,581,867 $10,450,590,420 -11.2 $9,540,825,749 -8.7 $9,484,648,685 -0.6 $481.00 Total HCBS $12,161,532,019 $12,448,516,502 2.4 $12,855,739,733 3.3 $13,325,817,112 3.7 $675.80 Total Medicaid (all services) $54,018,106,254 $54,040,149,631 0.0 $55,117,522,487 2.0 $59,621,474,558 8.2 $3,023.63
Percentages FY 2012 FY 2013 FY 2014 FY 2015
Total LTSS as a Percentage of Total Medicaid 44.3% 42.4% 40.6% 38.3% Percentage of LTSS that is HCBS 50.8% 54.4% 57.4% 58.4% Percentage of LTSS that is HCBS – AD 45.2% 47.1% 47.0% 51.0% Percentage of LTSS that is HCBS – DD 62.0% 71.4% 75.1% 73.4% Percentage of LTSS that is HCBS – BHS 6.3% 6.8% 11.3% 15.5%
Notes: Expenditures are total Medicaid spending, including both federal and state payments. Data for several states include expenditures for Medicaid Upper Payment Limit programs or provider taxes. Institutional MLTSS - unspecified refers to institutional LTSS provided through managed care organizations and reported on the CMS-64. The CMS-64 does not specify the type of institutional LTSS. HCBS - unspecified refers to HCBS provided through managed care organizations and fee-for-service HCBS provided in section 1115 demonstrations that were not authorized under another state plan or waiver authority. IMD for people under age 21 or age 65 and older, case management, rehabilitative services, private duty nursing, state plan HCBS, and health homes data do not include services provided through managed care organizations.

North Carolina Table 34
Service Type FY 2012 FY 2013
Percent Change 12-13 FY 2014
Percent Change 13-14 FY 2015
Percent Change 14-15
FY 2015 Expenditures Per Resident
Total-Older Adults, People with PD $2,085,407,722 $2,049,799,536 -1.7 $2,093,844,231 2.1 $2,046,199,964 -2.3 $205.97 Nursing facilities $1,223,405,314 $1,160,063,770 -5.2 $1,206,575,260 4.0 $1,179,920,815 -2.2 $118.77 Personal care $419,390,273 $451,748,994 7.7 $479,569,951 6.2 $462,241,402 -3.6 $46.53 1915(c) waivers - AD $243,144,141 $220,081,420 -9.5 $244,957,312 11.3 $229,378,965 -6.4 $23.09 Home health $60,752,514 $52,756,445 -13.2 $47,166,718 -10.6 $42,350,878 -10.2 $4.26 Community first choice $0 $0 0.0 $0 0.0 $0 0.0 $0.00 HCBS - unspecified - AD $0 $0 0.0 $0 0.0 $0 0.0 $0.00 PACE $12,304,147 $21,590,714 75.5 $31,688,995 46.8 $50,001,030 57.8 $5.03 Private duty nursing $71,749,914 $73,583,466 2.6 $83,885,995 14.0 $82,306,874 -1.9 $8.29 Self-directed PAS - alternative to 1915(c) $0 $0 0.0 $0 0.0 $0 0.0 $0.00 Self-directed PAS - alternative to personal care $0 $0 0.0 $0 0.0 $0 0.0 $0.00 Health homes - AD $54,661,419 $69,974,727 28.0 $0 -100.0 $0 0.0 $0.00 State plan HCBS - AD $0 $0 0.0 $0 0.0 $0 0.0 $0.00 Total-People with DD $1,030,184,231 $778,273,286 -24.5 $674,859,287 -13.3 $723,553,934 7.2 $72.83 ICF/IID - public $210,143,021 $73,362,117 -65.1 $2,773,483 -96.2 $0 -100.0 $0.00 ICF/IID - private $234,239,847 $71,974,614 -69.3 $1,058,498 -98.5 $2,415,197 128.2 $0.24 1915(c) waivers - DD $585,801,363 $632,936,555 8.0 $671,027,306 6.0 $721,138,737 7.5 $72.59 HCBS - unspecified - DD $0 $0 0.0 $0 0.0 $0 0.0 $0.00 State plan HCBS - DD $0 $0 0.0 $0 0.0 $0 0.0 $0.00 Total-Behavioral Health Services $954,452,150 $495,267,240 -48.1 $244,081,163 -50.7 $170,353,164 -30.2 $17.15 IMD for people under age 21 or age 65 and older $101,081,867 $39,318,283 -61.1 -$126,294 -100.3 $122,169 -196.7 $0.01 Mental health facilities DSH $152,718,355 $156,138,910 2.2 $157,830,493 1.1 $160,112,377 1.4 $16.12 Rehabilitative services $700,651,928 $299,810,047 -57.2 $86,376,964 -71.2 $10,118,618 -88.3 $1.02 1915(c) waivers - BHS $0 $0 0.0 $0 0.0 $0 0.0 $0.00 State plan HCBS - BHS $0 $0 0.0 $0 0.0 $0 0.0 $0.00 Health homes - BHS $0 $0 0.0 $0 0.0 $0 0.0 $0.00 Total-Other/Multiple Populations $147,153,765 $109,662,085 -25.5 $110,315,135 0.6 $113,391,515 2.8 $11.41 Case management $88,069,505 $36,809,436 -58.2 $22,214,181 -39.7 $13,614,169 -38.7 $1.37 1915(c) waivers - other $57,306,169 $71,320,104 24.5 $86,894,464 21.8 $97,898,214 12.7 $9.85 HCBS - unspecified - other $0 $0 0.0 $0 0.0 $0 0.0 $0.00 Health homes - other or multiple $0 $0 0.0 $0 0.0 $0 0.0 $0.00 Institutional MLTSS – unspecified $0 $0 0.0 $0 0.0 $0 0.0 $0.00 MFP demonstration $1,778,091 $1,532,545 -13.8 $1,206,490 -21.3 $1,879,132 55.8 $0.19 Total LTSS $4,217,197,868 $3,433,002,147 -18.6 $3,123,099,816 -9.0 $3,053,498,577 -2.2 $307.37 Total Institutional LTSS $1,921,588,404 $1,500,857,694 -21.9 $1,368,111,440 -8.8 $1,342,570,558 -1.9 $135.14 Total HCBS $2,295,609,464 $1,932,144,453 -15.8 $1,754,988,376 -9.2 $1,710,928,019 -2.5 $172.22 Total Medicaid (all services) $12,513,041,952 $11,989,979,443 -4.2 $12,348,890,055 3.0 $12,734,419,848 3.1 $1,281.85
Percentages FY 2012 FY 2013 FY 2014 FY 2015
Total LTSS as a Percentage of Total Medicaid 33.7% 28.6% 25.3% 24.0% Percentage of LTSS that is HCBS 54.4% n/a n/a n/a Percentage of LTSS that is HCBS – AD 41.3% 43.4% 42.4% 42.3% Percentage of LTSS that is HCBS – DD 56.9% n/a n/a n/a Percentage of LTSS that is HCBS – BHS 73.4% 60.5% 35.4% 5.9%
Notes: Expenditures are total Medicaid spending, including both federal and state payments. Data for several states include expenditures for Medicaid Upper Payment Limit programs or provider taxes. Institutional MLTSS - unspecified refers to institutional LTSS provided through managed care organizations and reported on the CMS-64. The CMS-64 does not specify the type of institutional LTSS. HCBS - unspecified refers to HCBS provided through managed care organizations and fee-for-service HCBS provided in section 1115 demonstrations that were not authorized under another state plan or waiver authority. IMD for people under age 21 or age 65 and older, case management, rehabilitative services, private duty nursing, state plan HCBS, and health homes data do not include services provided through managed care organizations. Data do not include expenditures for ICF/IID provided in a managed long-term services and supports program in 2013 through 2015. The percentage of LTSS for HCBS, overall and for people with developmental disabilities, is not calculated for 2013 through 2015 because a significant portion of data are missing.

North Dakota Table 35
Service Type FY 2012 FY 2013
Percent Change 12-13 FY 2014
Percent Change 13-14 FY 2015
Percent Change 14-15
FY 2015 Expenditures Per Resident
Total-Older Adults, People with PD $235,171,011 $248,661,982 5.7 $270,265,231 8.7 $269,090,239 -0.4 $363.68 Nursing facilities $202,278,684 $211,746,851 4.7 $230,672,295 8.9 $226,606,268 -1.8 $306.26 Personal care $19,796,301 $21,041,143 6.3 $22,766,038 8.2 $22,594,624 -0.8 $30.54 1915(c) waivers - AD $4,706,661 $5,111,785 8.6 $5,434,116 6.3 $6,228,957 14.6 $8.42 Home health $5,197,247 $7,074,499 36.1 $7,070,859 -0.1 $6,861,686 -3.0 $9.27 Community first choice $0 $0 0.0 $0 0.0 $0 0.0 $0.00 HCBS - unspecified - AD $0 $0 0.0 $0 0.0 $0 0.0 $0.00 PACE $3,192,118 $3,687,704 15.5 $4,321,976 17.2 $6,481,366 50.0 $8.76 Private duty nursing $0 $0 0.0 -$53 100.0 $317,338 -598850.9 $0.43 Self-directed PAS - alternative to 1915(c) $0 $0 0.0 $0 0.0 $0 0.0 $0.00 Self-directed PAS - alternative to personal care $0 $0 0.0 $0 0.0 $0 0.0 $0.00 Health homes - AD $0 $0 0.0 $0 0.0 $0 0.0 $0.00 State plan HCBS - AD $0 $0 0.0 $0 0.0 $0 0.0 $0.00 Total-People with DD $222,290,354 $237,651,493 6.9 $265,698,216 11.8 $281,941,232 6.1 $381.05 ICF/IID - public $23,227,105 $22,093,643 -4.9 $23,739,292 7.4 $23,632,590 -0.4 $31.94 ICF/IID - private $68,856,876 $73,433,190 6.6 $73,131,861 -0.4 $75,219,532 2.9 $101.66 1915(c) waivers - DD $130,206,373 $142,124,660 9.2 $168,827,063 18.8 $183,089,110 8.4 $247.45 HCBS - unspecified - DD $0 $0 0.0 $0 0.0 $0 0.0 $0.00 State plan HCBS - DD $0 $0 0.0 $0 0.0 $0 0.0 $0.00 Total-Behavioral Health Services $19,230,752 $16,514,921 -14.1 $24,495,679 48.3 $24,207,394 -1.2 $32.72 IMD for people under age 21 or age 65 and older $8,740,228 $7,633,039 -12.7 $12,329,639 61.5 $13,024,902 5.6 $17.60 Mental health facilities DSH $988,478 $741,360 -25.0 $1,235,596 66.7 $988,478 -20.0 $1.34 Rehabilitative services $9,502,046 $8,140,522 -14.3 $10,930,444 34.3 $10,194,014 -6.7 $13.78 1915(c) waivers - BHS $0 $0 0.0 $0 0.0 $0 0.0 $0.00 State plan HCBS - BHS $0 $0 0.0 $0 0.0 $0 0.0 $0.00 Health homes - BHS $0 $0 0.0 $0 0.0 $0 0.0 $0.00 Total-Other/Multiple Populations $11,854,415 $10,038,349 -15.3 $12,942,454 28.9 $10,820,248 -16.4 $14.62 Case management $9,226,154 $8,419,415 -8.7 $10,538,430 25.2 $8,574,035 -18.6 $11.59 1915(c) waivers - other $40,848 $29,029 -28.9 $91,347 214.7 $107,776 18.0 $0.15 HCBS - unspecified - other $0 $0 0.0 $0 0.0 $0 0.0 $0.00 Health homes - other or multiple $0 $0 0.0 $0 0.0 $0 0.0 $0.00 Institutional MLTSS – unspecified $0 $0 0.0 $0 0.0 $0 0.0 $0.00 MFP demonstration $2,587,413 $1,589,905 -38.6 $2,312,677 45.5 $2,138,437 -7.5 $2.89 Total LTSS $488,546,532 $512,866,745 5.0 $573,401,580 11.8 $586,059,113 2.2 $792.07 Total Institutional LTSS $304,091,371 $315,648,083 3.8 $341,108,683 8.1 $339,471,770 -0.5 $458.81 Total HCBS $184,455,161 $197,218,662 6.9 $232,292,897 17.8 $246,587,343 6.2 $333.27 Total Medicaid (all services) $746,706,868 $789,862,597 5.8 $959,975,230 21.5 $1,105,648,269 15.2 $1,494.31
Percentages FY 2012 FY 2013 FY 2014 FY 2015
Total LTSS as a Percentage of Total Medicaid 65.4% 64.9% 59.7% 53.0% Percentage of LTSS that is HCBS 37.8% 38.5% 40.5% 42.1% Percentage of LTSS that is HCBS – AD 14.0% 14.8% 14.6% 15.8% Percentage of LTSS that is HCBS – DD 58.6% 59.8% 63.5% 64.9% Percentage of LTSS that is HCBS – BHS 49.4% 49.3% 44.6% 42.1%
Notes: Expenditures are total Medicaid spending, including both federal and state payments. Data for several states include expenditures for Medicaid Upper Payment Limit programs or provider taxes. Institutional MLTSS - unspecified refers to institutional LTSS provided through managed care organizations and reported on the CMS-64. The CMS-64 does not specify the type of institutional LTSS. HCBS - unspecified refers to HCBS provided through managed care organizations and fee-for-service HCBS provided in section 1115 demonstrations that were not authorized under another state plan or waiver authority. IMD for people under age 21 or age 65 and older, case management, rehabilitative services, private duty nursing, state plan HCBS, and health homes data do not include services provided through managed care organizations.

Ohio Table 36
Service Type FY 2012 FY 2013
Percent Change 12-13 FY 2014
Percent Change 13-14 FY 2015
Percent Change 14-15
FY 2015 Expenditures Per Resident
Total-Older Adults, People with PD $3,629,447,993 $3,660,631,124 0.9 $3,831,469,499 4.7 $4,179,296,974 9.1 $360.46 Nursing facilities $2,454,341,021 $2,450,452,939 -0.2 $2,563,370,981 4.6 $2,786,965,428 8.7 $240.37 Personal care $0 $0 0.0 $0 0.0 $0 0.0 $0.00 1915(c) waivers - AD $711,514,731 $686,913,626 -3.5 $739,270,448 7.6 $855,514,100 15.7 $73.79 Home health $380,786,540 $440,608,974 15.7 $438,216,139 -0.5 $463,127,229 5.7 $39.94 Community first choice $0 $0 0.0 $0 0.0 $0 0.0 $0.00 HCBS - unspecified - AD $0 $0 0.0 $0 0.0 $0 0.0 $0.00 PACE $22,605,111 $17,457,400 -22.8 $24,518,414 40.4 $10,498,486 -57.2 $0.91 Private duty nursing $60,200,590 $65,198,185 8.3 $66,093,517 1.4 $63,191,731 -4.4 $5.45 Self-directed PAS - alternative to 1915(c) $0 $0 0.0 $0 0.0 $0 0.0 $0.00 Self-directed PAS - alternative to personal care $0 $0 0.0 $0 0.0 $0 0.0 $0.00 Health homes - AD $0 $0 0.0 $0 0.0 $0 0.0 $0.00 State plan HCBS - AD $0 $0 0.0 $0 0.0 $0 0.0 $0.00 Total-People with DD $1,998,660,173 $2,098,903,217 5.0 $2,123,271,948 1.2 $2,156,469,250 1.6 $185.99 ICF/IID - public $194,005,279 $186,536,671 -3.8 $175,562,566 -5.9 $159,457,673 -9.2 $13.75 ICF/IID - private $563,782,595 $560,062,308 -0.7 $554,008,233 -1.1 $537,632,458 -3.0 $46.37 1915(c) waivers - DD $1,240,872,299 $1,352,304,238 9.0 $1,393,701,149 3.1 $1,459,379,119 4.7 $125.87 HCBS - unspecified - DD $0 $0 0.0 $0 0.0 $0 0.0 $0.00 State plan HCBS - DD $0 $0 0.0 $0 0.0 $0 0.0 $0.00 Total-Behavioral Health Services $551,622,984 $758,212,657 37.5 $724,669,309 -4.4 $774,463,727 6.9 $66.80 IMD for people under age 21 or age 65 and older $458,190,226 $484,290,577 5.7 -$159,583 -100.0 $0 -100.0 $0.00 Mental health facilities DSH $93,432,758 $93,432,758 0.0 $93,432,758 0.0 $93,432,758 0.0 $8.06 Rehabilitative services $0 $140,493,306 100.0 $587,638,007 318.3 $643,544,125 9.5 $55.50 1915(c) waivers - BHS $0 $0 0.0 $0 0.0 $0 0.0 $0.00 State plan HCBS - BHS $0 $0 0.0 $0 0.0 $0 0.0 $0.00 Health homes - BHS $0 $39,996,016 100.0 $43,758,127 9.4 $37,486,844 -14.3 $3.23 Total-Other/Multiple Populations $93,230,834 $145,784,313 56.4 $430,728,651 195.5 $123,233,441 -71.4 $10.63 Case management $68,409,408 $74,639,845 9.1 $73,801,802 -1.1 $75,687,074 2.6 $6.53 1915(c) waivers - other $0 $0 0.0 $0 0.0 $0 0.0 $0.00 HCBS - unspecified - other $0 $26,543,658 100.0 $309,637,903 1066.5 $0 -100.0 $0.00 Health homes - other or multiple $0 $0 0.0 $0 0.0 $0 0.0 $0.00 Institutional MLTSS – unspecified $0 $5,182,342 100.0 $0 -100.0 $0 0.0 $0.00 MFP demonstration $24,821,426 $39,418,468 58.8 $47,288,946 20.0 $47,546,367 0.5 $4.10 Total LTSS $6,272,961,984 $6,663,531,311 6.2 $7,110,139,407 6.7 $7,233,463,392 1.7 $623.88 Total Institutional LTSS $3,763,751,879 $3,779,957,595 0.4 $3,386,214,955 -10.4 $3,577,488,317 5.6 $308.55 Total HCBS $2,509,210,105 $2,883,573,716 14.9 $3,723,924,452 29.1 $3,655,975,075 -1.8 $315.32 Total Medicaid (all services) $16,522,203,567 $16,598,321,129 0.5 $19,393,389,821 16.8 $20,756,491,730 7.0 $1,790.22
Percentages FY 2012 FY 2013 FY 2014 FY 2015
Total LTSS as a Percentage of Total Medicaid 38.0% 40.1% 36.7% 34.8% Percentage of LTSS that is HCBS 40.0% 43.3% 52.4% 50.5% Percentage of LTSS that is HCBS – AD 32.4% 33.1% 33.1% 33.3% Percentage of LTSS that is HCBS – DD 62.1% 64.4% 65.6% 67.7% Percentage of LTSS that is HCBS – BHS 0.0% 23.8% 87.1% 87.9%
Notes: Expenditures are total Medicaid spending, including both federal and state payments. Data for several states include expenditures for Medicaid Upper Payment Limit programs or provider taxes. Institutional MLTSS - unspecified refers to institutional LTSS provided through managed care organizations and reported on the CMS-64. The CMS-64 does not specify the type of institutional LTSS. HCBS - unspecified refers to HCBS provided through managed care organizations and fee-for-service HCBS provided in section 1115 demonstrations that were not authorized under another state plan or waiver authority. IMD for people under age 21 or age 65 and older, case management, rehabilitative services, private duty nursing, state plan HCBS, and health homes data do not include services provided through managed care organizations.

Oklahoma Table 37
Service Type FY 2012 FY 2013
Percent Change 12-13 FY 2014
Percent Change 13-14 FY 2015
Percent Change 14-15
FY 2015 Expenditures Per Resident
Total-Older Adults, People with PD $719,488,491 $774,954,806 7.7 $811,294,695 4.7 $805,737,238 -0.7 $207.80 Nursing facilities $498,177,896 $561,789,425 12.8 $581,994,265 3.6 $577,092,726 -0.8 $148.83 Personal care $11,991,353 -$2,602,849 -121.7 $11,908,001 -557.5 $11,980,137 0.6 $3.09 1915(c) waivers - AD $185,546,315 $191,768,361 3.4 $194,020,517 1.2 $192,590,176 -0.7 $49.67 Home health $20,581,227 $19,973,751 -3.0 $19,183,735 -4.0 $18,214,836 -5.1 $4.70 Community first choice $0 $0 0.0 $0 0.0 $0 0.0 $0.00 HCBS - unspecified - AD $0 $0 0.0 $0 0.0 $0 0.0 $0.00 PACE $3,191,700 $4,026,118 26.1 $4,188,177 4.0 $5,859,363 39.9 $1.51 Private duty nursing $0 $0 0.0 $0 0.0 $0 0.0 $0.00 Self-directed PAS - alternative to 1915(c) $0 $0 0.0 $0 0.0 $0 0.0 $0.00 Self-directed PAS - alternative to personal care $0 $0 0.0 $0 0.0 $0 0.0 $0.00 Health homes - AD $0 $0 0.0 $0 0.0 $0 0.0 $0.00 State plan HCBS - AD $0 $0 0.0 $0 0.0 $0 0.0 $0.00 Total-People with DD $392,323,639 $396,817,326 1.1 $389,003,951 -2.0 $416,277,316 7.0 $107.36 ICF/IID - public $55,362,595 $52,381,143 -5.4 $32,712,449 -37.5 $36,528,359 11.7 $9.42 ICF/IID - private $57,865,390 $59,249,461 2.4 $59,466,971 0.4 $60,985,078 2.6 $15.73 1915(c) waivers - DD $279,095,654 $285,186,722 2.2 $296,824,531 4.1 $318,763,879 7.4 $82.21 HCBS - unspecified - DD $0 $0 0.0 $0 0.0 $0 0.0 $0.00 State plan HCBS - DD $0 $0 0.0 $0 0.0 $0 0.0 $0.00 Total-Behavioral Health Services $68,445,616 $72,704,206 6.2 $97,678,072 34.3 $103,799,385 6.3 $26.77 IMD for people under age 21 or age 65 and older $67,627,310 $72,160,757 6.7 $94,404,824 30.8 $91,562,560 -3.0 $23.61 Mental health facilities DSH $818,306 $543,449 -33.6 $3,273,248 502.3 $3,273,248 0.0 $0.84 Rehabilitative services $0 $0 0.0 $0 0.0 $0 0.0 $0.00 1915(c) waivers - BHS $0 $0 0.0 $0 0.0 $0 0.0 $0.00 State plan HCBS - BHS $0 $0 0.0 $0 0.0 $0 0.0 $0.00 Health homes - BHS $0 $0 0.0 $0 0.0 $8,963,577 100.0 $2.31 Total-Other/Multiple Populations $50,263,700 $78,889,823 57.0 $68,744,589 -12.9 $75,072,440 9.2 $19.36 Case management $44,900,325 $72,010,505 60.4 $50,805,484 -29.4 $57,964,089 14.1 $14.95 1915(c) waivers - other $1,608,885 $2,733,110 69.9 $3,743,859 37.0 $5,093,665 36.1 $1.31 HCBS - unspecified - other $0 $0 0.0 $0 0.0 $0 0.0 $0.00 Health homes - other or multiple $0 $0 0.0 $0 0.0 $0 0.0 $0.00 Institutional MLTSS – unspecified $0 $0 0.0 $0 0.0 $0 0.0 $0.00 MFP demonstration $3,754,490 $4,146,208 10.4 $14,195,246 242.4 $12,014,686 -15.4 $3.10 Total LTSS $1,230,521,446 $1,323,366,161 7.5 $1,366,721,307 3.3 $1,400,886,379 2.5 $361.29 Total Institutional LTSS $679,851,497 $746,124,235 9.7 $771,851,757 3.4 $769,441,971 -0.3 $198.44 Total HCBS $550,669,949 $577,241,926 4.8 $594,869,550 3.1 $631,444,408 6.1 $162.85 Total Medicaid (all services) $4,654,117,095 $4,808,515,126 3.3 $4,948,306,400 2.9 $4,992,161,302 0.9 $1,287.47
Percentages FY 2012 FY 2013 FY 2014 FY 2015
Total LTSS as a Percentage of Total Medicaid 26.4% 27.5% 27.6% 28.1% Percentage of LTSS that is HCBS 44.8% 43.6% 43.5% 45.1% Percentage of LTSS that is HCBS – AD 30.8% 27.5% 28.3% 28.4% Percentage of LTSS that is HCBS – DD 71.1% 71.9% 76.3% 76.6% Percentage of LTSS that is HCBS – BHS 0.0% 0.0% 0.0% 8.6%
Notes: Expenditures are total Medicaid spending, including both federal and state payments. Data for several states include expenditures for Medicaid Upper Payment Limit programs or provider taxes. Institutional MLTSS - unspecified refers to institutional LTSS provided through managed care organizations and reported on the CMS-64. The CMS-64 does not specify the type of institutional LTSS. HCBS - unspecified refers to HCBS provided through managed care organizations and fee-for-service HCBS provided in section 1115 demonstrations that were not authorized under another state plan or waiver authority. IMD for people under age 21 or age 65 and older, case management, rehabilitative services, private duty nursing, state plan HCBS, and health homes data do not include services provided through managed care organizations.

Oregon Table 38
Service Type FY 2012 FY 2013
Percent Change 12-13 FY 2014
Percent Change 13-14 FY 2015
Percent Change 14-15
FY 2015 Expenditures Per Resident
Total-Older Adults, People with PD $834,668,937 $922,351,997 10.5 $1,730,586,066 87.6 $2,050,027,823 18.5 $516.59 Nursing facilities $331,367,454 $331,445,397 0.0 $386,549,973 16.6 $388,304,626 0.5 $97.85 Personal care $37,549,763 $44,486,418 18.5 $58,147,585 30.7 $33,994,883 -41.5 $8.57 1915(c) waivers - AD $436,003,326 $416,177,604 -4.5 -$43,745,737 -110.5 $7,698,110 -117.6 $1.94 Home health $557,039 $510,620 -8.3 $529,556 3.7 $540,259 2.0 $0.14 Community first choice $0 $94,726,637 100.0 $1,286,602,157 1258.2 $1,559,628,252 21.2 $393.01 HCBS - unspecified - AD $0 $0 0.0 $0 0.0 $0 0.0 $0.00 PACE $29,018,628 $31,939,638 10.1 $39,067,449 22.3 $46,055,838 17.9 $11.61 Private duty nursing $0 $0 0.0 $0 0.0 $0 0.0 $0.00 Self-directed PAS - alternative to 1915(c) $0 $1,380,050 100.0 $3,435,083 148.9 $13,813,865 302.1 $3.48 Self-directed PAS - alternative to personal care $172,727 $1,685,633 875.9 $0 -100.0 -$8,010 100.0 $0.00 Health homes - AD $0 $0 0.0 $0 0.0 $0 0.0 $0.00 State plan HCBS - AD $0 $0 0.0 $0 0.0 $0 0.0 $0.00 Total-People with DD $620,381,745 $561,058,306 -9.6 $64,445,600 -88.5 $61,951,558 -3.9 $15.61 ICF/IID - public $0 $0 0.0 $0 0.0 $0 0.0 $0.00 ICF/IID - private $0 $0 0.0 $0 0.0 $0 0.0 $0.00 1915(c) waivers - DD $620,381,745 $561,058,306 -9.6 $64,445,600 -88.5 $61,951,558 -3.9 $15.61 HCBS - unspecified - DD $0 $0 0.0 $0 0.0 $0 0.0 $0.00 State plan HCBS - DD $0 $0 0.0 $0 0.0 $0 0.0 $0.00 Total-Behavioral Health Services $102,981,128 $59,270,316 -42.4 $146,440,254 147.1 $134,330,370 -8.3 $33.85 IMD for people under age 21 or age 65 and older $1,040,029 $3,636,647 249.7 $6,929,582 90.5 $6,565,913 -5.2 $1.65 Mental health facilities DSH $24,844,783 $18,941,552 -23.8 $19,975,093 5.5 $19,975,092 0.0 $5.03 Rehabilitative services $77,078,353 $40,152,664 -47.9 $34,288,137 -14.6 $33,099,353 -3.5 $8.34 1915(c) waivers - BHS $0 $0 0.0 $0 0.0 $0 0.0 $0.00 State plan HCBS - BHS $17,963 -$3,460,547 -19364.9 $85,247,442 -2563.4 $74,690,012 -12.4 $18.82 Health homes - BHS $0 $0 0.0 $0 0.0 $0 0.0 $0.00 Total-Other/Multiple Populations $90,001,303 $83,713,868 -7.0 $66,164,124 -21.0 $81,575,707 23.3 $20.56 Case management $88,961,602 $65,499,165 -26.4 $59,373,272 -9.4 $79,508,567 33.9 $20.04 1915(c) waivers - other $1,261,526 $1,614,811 28.0 $2,169,915 34.4 $2,067,140 -4.7 $0.52 HCBS - unspecified - other $0 $0 0.0 $0 0.0 $0 0.0 $0.00 Health homes - other or multiple -$130,081 $16,523,852 -12802.7 $4,620,937 -72.0 $0 -100.0 $0.00 Institutional MLTSS – unspecified $0 $0 0.0 $0 0.0 $0 0.0 $0.00 MFP demonstration -$91,744 $76,040 -182.9 $0 -100.0 $0 0.0 $0.00 Total LTSS $1,648,033,113 $1,626,394,487 -1.3 $2,007,636,044 23.4 $2,327,885,458 16.0 $586.61 Total Institutional LTSS $357,252,266 $354,023,596 -0.9 $413,454,648 16.8 $414,845,631 0.3 $104.54 Total HCBS $1,290,780,847 $1,272,370,891 -1.4 $1,594,181,396 25.3 $1,913,039,827 20.0 $482.07 Total Medicaid (all services) $4,630,832,956 $5,141,662,499 11.0 $6,737,695,155 31.0 $8,164,164,213 21.2 $2,057.31
Percentages FY 2012 FY 2013 FY 2014 FY 2015
Total LTSS as a Percentage of Total Medicaid 35.6% 31.6% 29.8% 28.5% Percentage of LTSS that is HCBS 78.3% 78.2% 79.4% 82.2% Percentage of LTSS that is HCBS – AD 60.3% 64.1% 77.7% 81.1% Percentage of LTSS that is HCBS – DD 100.0% 100.0% 100.0% 100.0% Percentage of LTSS that is HCBS – BHS 74.9% 61.9% 81.6% 80.2%
Notes: Expenditures are total Medicaid spending, including both federal and state payments. Data for several states include expenditures for Medicaid Upper Payment Limit programs or provider taxes. Institutional MLTSS - unspecified refers to institutional LTSS provided through managed care organizations and reported on the CMS-64. The CMS-64 does not specify the type of institutional LTSS. HCBS - unspecified refers to HCBS provided through managed care organizations and fee-for-service HCBS provided in section 1115 demonstrations that were not authorized under another state plan or waiver authority. IMD for people under age 21 or age 65 and older, case management, rehabilitative services, private duty nursing, state plan HCBS, and health homes data do not include services provided through managed care organizations.

Pennsylvania Table 39
Service Type FY 2012 FY 2013
Percent Change 12-13 FY 2014
Percent Change 13-14 FY 2015
Percent Change 14-15
FY 2015 Expenditures Per Resident
Total-Older Adults, People with PD $4,744,268,088 $5,173,956,985 9.1 $5,403,367,015 4.4 $5,679,894,263 5.1 $444.07 Nursing facilities $3,572,703,412 $3,837,512,888 7.4 $3,895,811,411 1.5 $3,848,904,521 -1.2 $300.92 Personal care $0 $0 0.0 $0 0.0 $0 0.0 $0.00 1915(c) waivers - AD $859,550,493 $1,066,458,806 24.1 $1,251,580,600 17.4 $1,549,830,556 23.8 $121.17 Home health $162,877,546 $102,342,454 -37.2 $61,759,524 -39.7 $60,069,924 -2.7 $4.70 Community first choice $0 $0 0.0 $0 0.0 $0 0.0 $0.00 HCBS - unspecified - AD $0 $0 0.0 $0 0.0 $0 0.0 $0.00 PACE $149,136,637 $167,642,837 12.4 $194,215,480 15.9 $221,089,262 13.8 $17.29 Private duty nursing $0 $0 0.0 $0 0.0 $0 0.0 $0.00 Self-directed PAS - alternative to 1915(c) $0 $0 0.0 $0 0.0 $0 0.0 $0.00 Self-directed PAS - alternative to personal care $0 $0 0.0 $0 0.0 $0 0.0 $0.00 Health homes - AD $0 $0 0.0 $0 0.0 $0 0.0 $0.00 State plan HCBS - AD $0 $0 0.0 $0 0.0 $0 0.0 $0.00 Total-People with DD $2,484,454,955 $2,655,099,453 6.9 $2,775,802,918 4.5 $2,869,164,989 3.4 $224.32 ICF/IID - public $288,744,897 $293,612,555 1.7 $296,978,127 1.1 $315,677,733 6.3 $24.68 ICF/IID - private $292,130,942 $324,346,714 11.0 $307,902,147 -5.1 $302,641,473 -1.7 $23.66 1915(c) waivers - DD $1,900,072,492 $2,032,373,916 7.0 $2,165,344,528 6.5 $2,245,283,582 3.7 $175.54 HCBS - unspecified - DD $3,506,624 $4,766,268 35.9 $5,578,116 17.0 $5,562,201 -0.3 $0.43 State plan HCBS - DD $0 $0 0.0 $0 0.0 $0 0.0 $0.00 Total-Behavioral Health Services $378,032,412 $384,805,553 1.8 $395,126,781 2.7 $370,422,106 -6.3 $28.96 IMD for people under age 21 or age 65 and older $71,131,903 $73,891,899 3.9 $79,231,430 7.2 $72,449,864 -8.6 $5.66 Mental health facilities DSH $304,925,621 $308,882,708 1.3 $313,957,347 1.6 $296,196,274 -5.7 $23.16 Rehabilitative services $1,974,888 $2,030,946 2.8 $1,938,004 -4.6 $1,775,968 -8.4 $0.14 1915(c) waivers - BHS $0 $0 0.0 $0 0.0 $0 0.0 $0.00 State plan HCBS - BHS $0 $0 0.0 $0 0.0 $0 0.0 $0.00 Health homes - BHS $0 $0 0.0 $0 0.0 $0 0.0 $0.00 Total-Other/Multiple Populations $97,884,152 $106,224,432 8.5 $112,956,783 6.3 $122,782,479 8.7 $9.60 Case management $42,743,579 $42,795,135 0.1 $43,676,112 2.1 $39,684,185 -9.1 $3.10 1915(c) waivers - other $47,882,715 $49,594,917 3.6 $51,684,575 4.2 $59,341,832 14.8 $4.64 HCBS - unspecified - other $0 $0 0.0 $0 0.0 $0 0.0 $0.00 Health homes - other or multiple $0 $0 0.0 $0 0.0 $0 0.0 $0.00 Institutional MLTSS – unspecified $0 $0 0.0 $0 0.0 $0 0.0 $0.00 MFP demonstration $7,257,858 $13,834,380 90.6 $17,596,096 27.2 $23,756,462 35.0 $1.86 Total LTSS $7,704,639,607 $8,320,086,423 8.0 $8,687,253,497 4.4 $9,042,263,837 4.1 $706.95 Total Institutional LTSS $4,529,636,775 $4,838,246,764 6.8 $4,893,880,462 1.1 $4,835,869,865 -1.2 $378.08 Total HCBS $3,175,002,832 $3,481,839,659 9.7 $3,793,373,035 8.9 $4,206,393,972 10.9 $328.87 Total Medicaid (all services) $20,286,481,399 $21,181,113,829 4.4 $23,613,413,952 11.5 $23,401,623,491 -0.9 $1,829.60
Percentages FY 2012 FY 2013 FY 2014 FY 2015
Total LTSS as a Percentage of Total Medicaid 38.0% 39.3% 36.8% 38.6% Percentage of LTSS that is HCBS 41.2% 41.8% 43.7% 46.5% Percentage of LTSS that is HCBS – AD 24.7% 25.8% 27.9% 32.2% Percentage of LTSS that is HCBS – DD 76.6% 76.7% 78.2% 78.4% Percentage of LTSS that is HCBS – BHS 0.5% 0.5% 0.5% 0.5%
Notes: Expenditures are total Medicaid spending, including both federal and state payments. Data for several states include expenditures for Medicaid Upper Payment Limit programs or provider taxes. Institutional MLTSS - unspecified refers to institutional LTSS provided through managed care organizations and reported on the CMS-64. The CMS-64 does not specify the type of institutional LTSS. HCBS - unspecified refers to HCBS provided through managed care organizations and fee-for-service HCBS provided in section 1115 demonstrations that were not authorized under another state plan or waiver authority. IMD for people under age 21 or age 65 and older, case management, rehabilitative services, private duty nursing, state plan HCBS, and health homes data do not include services provided through managed care organizations.

Rhode Island Table 40
Service Type FY 2012 FY 2013
Percent Change 12-13 FY 2014
Percent Change 13-14 FY 2015
Percent Change 14-15
FY 2015 Expenditures Per Resident
Total-Older Adults, People with PD $398,208,722 $426,490,393 7.1 $445,329,003 4.4 $469,370,338 5.4 $445.12 Nursing facilities $323,345,787 $334,521,953 3.5 $347,534,642 3.9 $361,594,353 4.0 $342.91 Personal care $0 $0 0.0 $0 0.0 $0 0.0 $0.00 1915(c) waivers - AD $0 $0 0.0 $0 0.0 $0 0.0 $0.00 Home health $1,862,935 $1,968,440 5.7 $1,794,361 -8.8 $1,275,985 -28.9 $1.21 Community first choice $0 $0 0.0 $0 0.0 $0 0.0 $0.00 HCBS - unspecified - AD $73,000,000 $90,000,000 23.3 $96,000,000 6.7 $106,500,000 10.9 $101.00 PACE $0 $0 0.0 $0 0.0 $0 0.0 $0.00 Private duty nursing $0 $0 0.0 $0 0.0 $0 0.0 $0.00 Self-directed PAS - alternative to 1915(c) $0 $0 0.0 $0 0.0 $0 0.0 $0.00 Self-directed PAS - alternative to personal care $0 $0 0.0 $0 0.0 $0 0.0 $0.00 Health homes - AD $0 $0 0.0 $0 0.0 $0 0.0 $0.00 State plan HCBS - AD $0 $0 0.0 $0 0.0 $0 0.0 $0.00 Total-People with DD $213,159,578 $218,870,914 2.7 $227,004,728 3.7 $235,427,749 3.7 $223.26 ICF/IID - public $2,489,747 $5,321,259 113.7 $3,330,464 -37.4 $2,336,454 -29.8 $2.22 ICF/IID - private $6,669,831 $4,549,655 -31.8 $5,674,264 24.7 $5,591,295 -1.5 $5.30 1915(c) waivers - DD $0 $0 0.0 $0 0.0 $0 0.0 $0.00 HCBS - unspecified - DD $204,000,000 $209,000,000 2.5 $218,000,000 4.3 $227,500,000 4.4 $215.75 State plan HCBS - DD $0 $0 0.0 $0 0.0 $0 0.0 $0.00 Total-Behavioral Health Services $165,180,373 $176,475,327 6.8 $169,761,594 -3.8 $153,936,561 -9.3 $145.98 IMD for people under age 21 or age 65 and older $5,461,478 $5,619,343 2.9 $4,528,588 -19.4 $4,496,569 -0.7 $4.26 Mental health facilities DSH $0 $0 0.0 $0 0.0 $0 0.0 $0.00 Rehabilitative services $132,820,640 $134,507,148 1.3 $165,233,006 22.8 $149,439,992 -9.6 $141.72 1915(c) waivers - BHS $0 $0 0.0 $0 0.0 $0 0.0 $0.00 State plan HCBS - BHS $0 $0 0.0 $0 0.0 $0 0.0 $0.00 Health homes - BHS $26,898,255 $36,348,836 35.1 $0 -100.0 $0 0.0 $0.00 Total-Other/Multiple Populations $7,842,198 $8,880,912 13.2 $14,549,414 63.8 $16,418,025 12.8 $15.57 Case management $7,641,505 $8,108,537 6.1 $10,516,733 29.7 $9,540,886 -9.3 $9.05 1915(c) waivers - other $0 $0 0.0 $0 0.0 $0 0.0 $0.00 HCBS - unspecified - other $0 $0 0.0 -$2,000,000 100.0 $0 -100.0 $0.00 Health homes - other or multiple $0 $0 0.0 $4,757,206 100.0 $4,808,227 1.1 $4.56 Institutional MLTSS – unspecified $0 $0 0.0 $0 0.0 $0 0.0 $0.00 MFP demonstration $200,693 $772,375 284.9 $1,275,475 65.1 $2,068,912 62.2 $1.96 Total LTSS $784,390,871 $830,717,546 5.9 $856,644,739 3.1 $875,152,673 2.2 $829.94 Total Institutional LTSS $337,966,843 $350,012,210 3.6 $361,067,958 3.2 $374,018,671 3.6 $354.69 Total HCBS $446,424,028 $480,705,336 7.7 $495,576,781 3.1 $501,134,002 1.1 $475.24 Total Medicaid (all services) $1,851,740,520 $1,945,057,475 5.0 $2,458,071,339 26.4 $2,595,271,558 5.6 $2,461.19
Percentages FY 2012 FY 2013 FY 2014 FY 2015
Total LTSS as a Percentage of Total Medicaid 42.4% 42.7% 34.9% 33.7% Percentage of LTSS that is HCBS 56.9% 57.9% 57.9% 57.3% Percentage of LTSS that is HCBS – AD 18.8% 21.6% 22.0% 23.0% Percentage of LTSS that is HCBS – DD 95.7% 95.5% 96.0% 96.6% Percentage of LTSS that is HCBS – BHS 96.7% 96.8% 97.3% 97.1%
Notes: Expenditures are total Medicaid spending, including both federal and state payments. Data for several states include expenditures for Medicaid Upper Payment Limit programs or provider taxes. Institutional MLTSS - unspecified refers to institutional LTSS provided through managed care organizations and reported on the CMS-64. The CMS-64 does not specify the type of institutional LTSS. HCBS - unspecified refers to HCBS provided through managed care organizations and fee-for-service HCBS provided in section 1115 demonstrations that were not authorized under another state plan or waiver authority. IMD for people under age 21 or age 65 and older, case management, rehabilitative services, private duty nursing, state plan HCBS, and health homes data do not include services provided through managed care organizations. Rhode Island data for nursing facilities (2014 and 2015) and HCBS - unspecified (2012 - 2015) are estimated expenditures for the state fiscal year.

South Carolina Table 41
Service Type FY 2012 FY 2013
Percent Change 12-13 FY 2014
Percent Change 13-14 FY 2015
Percent Change 14-15
FY 2015 Expenditures Per Resident
Total-Older Adults, People with PD $749,873,182 $735,301,054 -1.9 $784,898,792 6.7 $827,796,330 5.5 $171.44 Nursing facilities $553,342,116 $531,556,194 -3.9 $569,196,129 7.1 $583,852,291 2.6 $120.92 Personal care $13,661,618 $12,679,352 -7.2 $9,866,323 -22.2 $12,111,459 22.8 $2.51 1915(c) waivers - AD $156,671,356 $159,590,572 1.9 $166,006,346 4.0 $190,681,902 14.9 $39.49 Home health $6,974,713 $9,750,048 39.8 $13,226,926 35.7 $13,680,165 3.4 $2.83 Community first choice $0 $0 0.0 $0 0.0 $0 0.0 $0.00 HCBS - unspecified - AD $0 $0 0.0 $0 0.0 $0 0.0 $0.00 PACE $12,155,354 $12,074,593 -0.7 $13,427,420 11.2 $12,916,303 -3.8 $2.68 Private duty nursing $7,068,025 $9,650,295 36.5 $13,175,648 36.5 $14,554,210 10.5 $3.01 Self-directed PAS - alternative to 1915(c) $0 $0 0.0 $0 0.0 $0 0.0 $0.00 Self-directed PAS - alternative to personal care $0 $0 0.0 $0 0.0 $0 0.0 $0.00 Health homes - AD $0 $0 0.0 $0 0.0 $0 0.0 $0.00 State plan HCBS - AD $0 $0 0.0 $0 0.0 $0 0.0 $0.00 Total-People with DD $446,280,517 $436,842,595 -2.1 $445,360,553 1.9 $456,911,607 2.6 $94.63 ICF/IID - public $155,037,462 $140,204,579 -9.6 $138,751,670 -1.0 $135,212,895 -2.6 $28.00 ICF/IID - private $0 $0 0.0 $0 0.0 $0 0.0 $0.00 1915(c) waivers - DD $291,243,055 $296,638,016 1.9 $306,608,883 3.4 $321,698,712 4.9 $66.63 HCBS - unspecified - DD $0 $0 0.0 $0 0.0 $0 0.0 $0.00 State plan HCBS - DD $0 $0 0.0 $0 0.0 $0 0.0 $0.00 Total-Behavioral Health Services $118,617,065 $128,173,764 8.1 $141,121,283 10.1 $209,980,232 48.8 $43.49 IMD for people under age 21 or age 65 and older $40,332,230 $49,853,499 23.6 $55,153,912 10.6 $24,215,677 -56.1 $5.02 Mental health facilities DSH $52,323,602 $52,175,304 -0.3 $49,069,197 -6.0 $52,323,601 6.6 $10.84 Rehabilitative services $25,961,233 $26,144,961 0.7 $36,898,174 41.1 $133,440,954 261.6 $27.64 1915(c) waivers - BHS $0 $0 0.0 $0 0.0 $0 0.0 $0.00 State plan HCBS - BHS $0 $0 0.0 $0 0.0 $0 0.0 $0.00 Health homes - BHS $0 $0 0.0 $0 0.0 $0 0.0 $0.00 Total-Other/Multiple Populations $42,978,599 $25,242,603 -41.3 $46,666,271 84.9 $33,563,352 -28.1 $6.95 Case management $37,663,607 $19,954,852 -47.0 $41,520,747 108.1 $26,645,989 -35.8 $5.52 1915(c) waivers - other $5,314,992 $5,242,338 -1.4 $4,887,731 -6.8 $6,575,489 34.5 $1.36 HCBS - unspecified - other $0 $0 0.0 $0 0.0 $0 0.0 $0.00 Health homes - other or multiple $0 $0 0.0 $0 0.0 $0 0.0 $0.00 Institutional MLTSS – unspecified $0 $0 0.0 $0 0.0 $0 0.0 $0.00 MFP demonstration $0 $45,413 100.0 $257,793 467.7 $341,874 32.6 $0.07 Total LTSS $1,357,749,363 $1,325,560,016 -2.4 $1,418,046,899 7.0 $1,528,251,521 7.8 $316.51 Total Institutional LTSS $801,035,410 $773,789,576 -3.4 $812,170,908 5.0 $795,604,464 -2.0 $164.77 Total HCBS $556,713,953 $551,770,440 -0.9 $605,875,991 9.8 $732,647,057 20.9 $151.74 Total Medicaid (all services) $4,792,403,503 $4,949,056,058 3.3 $5,496,508,714 11.1 $6,050,859,531 10.1 $1,253.17
Percentages FY 2012 FY 2013 FY 2014 FY 2015
Total LTSS as a Percentage of Total Medicaid 28.3% 26.8% 25.8% 25.3% Percentage of LTSS that is HCBS 41.0% 41.6% 42.7% 47.9% Percentage of LTSS that is HCBS – AD 26.2% 27.7% 27.5% 29.5% Percentage of LTSS that is HCBS – DD 65.3% 67.9% 68.8% 70.4% Percentage of LTSS that is HCBS – BHS 21.9% 20.4% 26.1% 63.5%
Notes: Expenditures are total Medicaid spending, including both federal and state payments. Data for several states include expenditures for Medicaid Upper Payment Limit programs or provider taxes. Institutional MLTSS - unspecified refers to institutional LTSS provided through managed care organizations and reported on the CMS-64. The CMS-64 does not specify the type of institutional LTSS. HCBS - unspecified refers to HCBS provided through managed care organizations and fee-for-service HCBS provided in section 1115 demonstrations that were not authorized under another state plan or waiver authority. IMD for people under age 21 or age 65 and older, case management, rehabilitative services, private duty nursing, state plan HCBS, and health homes data do not include services provided through managed care organizations.

South Dakota Table 42
Service Type FY 2012 FY 2013
Percent Change 12-13 FY 2014
Percent Change 13-14 FY 2015
Percent Change 14-15
FY 2015 Expenditures Per Resident
Total-Older Adults, People with PD $161,424,362 $159,611,314 -1.1 $157,815,292 -1.1 $170,599,388 8.1 $200.10 Nursing facilities $135,051,804 $132,970,013 -1.5 $130,037,952 -2.2 $138,775,106 6.7 $162.77 Personal care $1,155,083 $864,268 -25.2 $958,735 10.9 $1,087,849 13.5 $1.28 1915(c) waivers - AD $13,521,166 $14,334,466 6.0 $15,401,289 7.4 $17,160,339 11.4 $20.13 Home health $11,696,309 $11,442,567 -2.2 $11,417,316 -0.2 $13,576,094 18.9 $15.92 Community first choice $0 $0 0.0 $0 0.0 $0 0.0 $0.00 HCBS - unspecified - AD $0 $0 0.0 $0 0.0 $0 0.0 $0.00 PACE $0 $0 0.0 $0 0.0 $0 0.0 $0.00 Private duty nursing $0 $0 0.0 $0 0.0 $0 0.0 $0.00 Self-directed PAS - alternative to 1915(c) $0 $0 0.0 $0 0.0 $0 0.0 $0.00 Self-directed PAS - alternative to personal care $0 $0 0.0 $0 0.0 $0 0.0 $0.00 Health homes - AD $0 $0 0.0 $0 0.0 $0 0.0 $0.00 State plan HCBS - AD $0 $0 0.0 $0 0.0 $0 0.0 $0.00 Total-People with DD $132,046,721 $136,620,896 3.5 $139,046,013 1.8 $144,092,784 3.6 $169.01 ICF/IID - public $29,593,899 $30,171,490 2.0 $30,891,316 2.4 $29,564,601 -4.3 $34.68 ICF/IID - private $0 $0 0.0 $0 0.0 $0 0.0 $0.00 1915(c) waivers - DD $102,452,822 $106,449,406 3.9 $108,154,697 1.6 $114,528,183 5.9 $134.33 HCBS - unspecified - DD $0 $0 0.0 $0 0.0 $0 0.0 $0.00 State plan HCBS - DD $0 $0 0.0 $0 0.0 $0 0.0 $0.00 Total-Behavioral Health Services $11,176,097 $11,643,069 4.2 $11,849,832 1.8 $11,864,249 0.1 $13.92 IMD for people under age 21 or age 65 and older $2,613,324 $3,225,631 23.4 $3,454,249 7.1 $2,802,664 -18.9 $3.29 Mental health facilities DSH $751,299 $751,299 0.0 $751,299 0.0 $751,299 0.0 $0.88 Rehabilitative services $7,811,474 $7,666,139 -1.9 $7,644,284 -0.3 $8,310,286 8.7 $9.75 1915(c) waivers - BHS $0 $0 0.0 $0 0.0 $0 0.0 $0.00 State plan HCBS - BHS $0 $0 0.0 $0 0.0 $0 0.0 $0.00 Health homes - BHS $0 $0 0.0 $0 0.0 $0 0.0 $0.00 Total-Other/Multiple Populations $0 $650,538 100.0 $3,767,279 479.1 $3,230,258 -14.3 $3.79 Case management $0 $0 0.0 $0 0.0 $0 0.0 $0.00 1915(c) waivers - other $0 $0 0.0 $0 0.0 $0 0.0 $0.00 HCBS - unspecified - other $0 $0 0.0 $0 0.0 $0 0.0 $0.00 Health homes - other or multiple $0 $650,538 100.0 $3,537,761 443.8 $2,563,451 -27.5 $3.01 Institutional MLTSS – unspecified $0 $0 0.0 $0 0.0 $0 0.0 $0.00 MFP demonstration $0 $0 0.0 $229,518 100.0 $666,807 190.5 $0.78 Total LTSS $304,647,180 $308,525,817 1.3 $312,478,416 1.3 $329,786,679 5.5 $386.82 Total Institutional LTSS $168,010,326 $167,118,433 -0.5 $165,134,816 -1.2 $171,893,670 4.1 $201.62 Total HCBS $136,636,854 $141,407,384 3.5 $147,343,600 4.2 $157,893,009 7.2 $185.20 Total Medicaid (all services) $749,264,081 $766,441,148 2.3 $756,994,934 -1.2 $827,540,746 9.3 $970.65
Percentages FY 2012 FY 2013 FY 2014 FY 2015
Total LTSS as a Percentage of Total Medicaid 40.7% 40.3% 41.3% 39.9% Percentage of LTSS that is HCBS 44.9% 45.8% 47.2% 47.9% Percentage of LTSS that is HCBS – AD 16.3% 16.7% 17.6% 18.7% Percentage of LTSS that is HCBS – DD 77.6% 77.9% 77.8% 79.5% Percentage of LTSS that is HCBS – BHS 69.9% 65.8% 64.5% 70.0%
Notes: Expenditures are total Medicaid spending, including both federal and state payments. Data for several states include expenditures for Medicaid Upper Payment Limit programs or provider taxes. Institutional MLTSS - unspecified refers to institutional LTSS provided through managed care organizations and reported on the CMS-64. The CMS-64 does not specify the type of institutional LTSS. HCBS - unspecified refers to HCBS provided through managed care organizations and fee-for-service HCBS provided in section 1115 demonstrations that were not authorized under another state plan or waiver authority. IMD for people under age 21 or age 65 and older, case management, rehabilitative services, private duty nursing, state plan HCBS, and health homes data do not include services provided through managed care organizations.

Tennessee Table 43
Service Type FY 2012 FY 2013
Percent Change 12-13 FY 2014
Percent Change 13-14 FY 2015
Percent Change 14-15
FY 2015 Expenditures Per Resident
Total-Older Adults, People with PD $1,390,433,864 $1,356,530,324 -2.4 $1,349,243,921 -0.5 $1,553,680,557 15.2 $237.40 Nursing facilities $955,101,277 $910,665,547 -4.7 $890,647,225 -2.2 $1,096,126,979 23.1 $167.48 Personal care $0 $0 0.0 $0 0.0 $0 0.0 $0.00 1915(c) waivers - AD $94,436 $0 -100.0 $0 0.0 $0 0.0 $0.00 Home health $222,905,254 $206,433,165 -7.4 $211,710,047 2.6 $207,071,067 -2.2 $31.64 Community first choice $0 $0 0.0 $0 0.0 $0 0.0 $0.00 HCBS - unspecified - AD $200,907,127 $228,595,035 13.8 $235,855,408 3.2 $239,950,683 1.7 $36.66 PACE $11,425,770 $10,836,577 -5.2 $11,031,241 1.8 $10,531,828 -4.5 $1.61 Private duty nursing $0 $0 0.0 $0 0.0 $0 0.0 $0.00 Self-directed PAS - alternative to 1915(c) $0 $0 0.0 $0 0.0 $0 0.0 $0.00 Self-directed PAS - alternative to personal care $0 $0 0.0 $0 0.0 $0 0.0 $0.00 Health homes - AD $0 $0 0.0 $0 0.0 $0 0.0 $0.00 State plan HCBS - AD $0 $0 0.0 $0 0.0 $0 0.0 $0.00 Total-People with DD $795,499,652 $876,285,479 10.2 $896,942,079 2.4 $889,118,717 -0.9 $135.85 ICF/IID - public $100,139,751 $128,883,401 28.7 $102,010,044 -20.9 $102,860,161 0.8 $15.72 ICF/IID - private $116,136,426 $113,637,882 -2.2 $110,759,489 -2.5 $111,578,512 0.7 $17.05 1915(c) waivers - DD $579,223,475 $633,764,196 9.4 $684,172,546 8.0 $674,680,044 -1.4 $103.09 HCBS - unspecified - DD $0 $0 0.0 $0 0.0 $0 0.0 $0.00 State plan HCBS - DD $0 $0 0.0 $0 0.0 $0 0.0 $0.00 Total-Behavioral Health Services $31,908,732 $33,892,091 6.2 $37,165,896 9.7 $50,957,217 37.1 $7.79 IMD for people under age 21 or age 65 and older $31,908,732 $33,892,091 6.2 $37,165,896 9.7 $50,957,217 37.1 $7.79 Mental health facilities DSH $0 $0 0.0 $0 0.0 $0 0.0 $0.00 Rehabilitative services $0 $0 0.0 $0 0.0 $0 0.0 $0.00 1915(c) waivers - BHS $0 $0 0.0 $0 0.0 $0 0.0 $0.00 State plan HCBS - BHS $0 $0 0.0 $0 0.0 $0 0.0 $0.00 Health homes - BHS $0 $0 0.0 $0 0.0 $0 0.0 $0.00 Total-Other/Multiple Populations $113,216,034 $127,268,677 12.4 $149,398,870 17.4 $133,695,078 -10.5 $20.43 Case management $107,415,447 $122,056,922 13.6 $140,499,916 15.1 $122,122,853 -13.1 $18.66 1915(c) waivers - other $0 $0 0.0 $0 0.0 $0 0.0 $0.00 HCBS - unspecified - other $0 $0 0.0 $0 0.0 $0 0.0 $0.00 Health homes - other or multiple $0 $0 0.0 $0 0.0 $0 0.0 $0.00 Institutional MLTSS – unspecified $0 $0 0.0 $0 0.0 $0 0.0 $0.00 MFP demonstration $5,800,587 $5,211,755 -10.2 $8,898,954 70.7 $11,572,225 30.0 $1.77 Total LTSS $2,331,058,282 $2,393,976,571 2.7 $2,432,750,766 1.6 $2,627,451,569 8.0 $401.46 Total Institutional LTSS $1,203,286,186 $1,187,078,921 -1.3 $1,140,582,654 -3.9 $1,361,522,869 19.4 $208.04 Total HCBS $1,127,772,096 $1,206,897,650 7.0 $1,292,168,112 7.1 $1,265,928,700 -2.0 $193.43 Total Medicaid (all services) $8,929,438,248 $8,619,235,404 -3.5 $9,299,619,031 7.9 $9,072,117,646 -2.4 $1,386.19
Percentages FY 2012 FY 2013 FY 2014 FY 2015
Total LTSS as a Percentage of Total Medicaid 26.1% 27.8% 26.2% 29.0% Percentage of LTSS that is HCBS 48.4% 50.4% 53.1% 48.2% Percentage of LTSS that is HCBS – AD 31.3% 32.9% 34.0% 29.4% Percentage of LTSS that is HCBS – DD 72.8% 72.3% 76.3% 75.9% Percentage of LTSS that is HCBS – BHS 0.0% 0.0% 0.0% 0.0%
Notes: Expenditures are total Medicaid spending, including both federal and state payments. Data for several states include expenditures for Medicaid Upper Payment Limit programs or provider taxes. Institutional MLTSS - unspecified refers to institutional LTSS provided through managed care organizations and reported on the CMS-64. The CMS-64 does not specify the type of institutional LTSS. HCBS - unspecified refers to HCBS provided through managed care organizations and fee-for-service HCBS provided in section 1115 demonstrations that were not authorized under another state plan or waiver authority. IMD for people under age 21 or age 65 and older, case management, rehabilitative services, private duty nursing, state plan HCBS, and health homes data do not include services provided through managed care organizations.

Texas Table 44
Service Type FY 2012 FY 2013
Percent Change 12-13 FY 2014
Percent Change 13-14 FY 2015
Percent Change 14-15
FY 2015 Expenditures Per Resident
Total-Older Adults, People with PD $4,814,599,439 $5,212,234,802 8.3 $5,512,743,335 5.8 $6,197,241,329 12.4 $230.00 Nursing facilities $2,402,042,262 $2,364,892,340 -1.5 $2,461,017,294 4.1 $2,640,412,056 7.3 $97.99 Personal care $1,787,833,362 $2,033,051,193 13.7 $2,154,782,244 6.0 $2,358,005,770 9.4 $87.51 1915(c) waivers - AD $280,381,634 $170,061,116 -39.3 $167,492,830 -1.5 $4,221,418 -97.5 $0.16 Home health $223,576,324 $192,758,631 -13.8 $195,812,030 1.6 $188,422,264 -3.8 $6.99 Community first choice $0 $0 0.0 $0 0.0 $345,811,927 100.0 $12.83 HCBS - unspecified - AD $82,944,882 $410,484,324 394.9 $490,436,357 19.5 $616,947,000 25.8 $22.90 PACE $34,967,494 $35,681,056 2.0 $36,811,803 3.2 $37,634,651 2.2 $1.40 Private duty nursing $0 $0 0.0 $0 0.0 $0 0.0 $0.00 Self-directed PAS - alternative to 1915(c) $0 $0 0.0 $0 0.0 $0 0.0 $0.00 Self-directed PAS - alternative to personal care $2,853,481 $5,306,142 86.0 $6,390,777 20.4 $5,786,243 -9.5 $0.21 Health homes - AD $0 $0 0.0 $0 0.0 $0 0.0 $0.00 State plan HCBS - AD $0 $0 0.0 $0 0.0 $0 0.0 $0.00 Total-People with DD $2,095,122,206 $2,181,492,035 4.1 $2,263,008,012 3.7 $2,283,295,130 0.9 $84.74 ICF/IID - public $759,008,853 $810,770,928 6.8 $850,093,255 4.8 $839,913,265 -1.2 $31.17 ICF/IID - private $288,589,184 $274,638,108 -4.8 $273,892,344 -0.3 $269,294,689 -1.7 $9.99 1915(c) waivers - DD $1,047,524,169 $1,096,082,999 4.6 $1,139,022,413 3.9 $1,174,087,176 3.1 $43.57 HCBS - unspecified - DD $0 $0 0.0 $0 0.0 $0 0.0 $0.00 State plan HCBS - DD $0 $0 0.0 $0 0.0 $0 0.0 $0.00 Total-Behavioral Health Services $437,422,819 $358,278,388 -18.1 $326,584,167 -8.8 $331,150,359 1.4 $12.29 IMD for people under age 21 or age 65 and older $24,703,011 $20,528,722 -16.9 $17,353,780 -15.5 $17,367,873 0.1 $0.64 Mental health facilities DSH $292,513,592 $237,506,152 -18.8 $216,377,066 -8.9 $256,273,807 18.4 $9.51 Rehabilitative services $120,057,358 $100,100,365 -16.6 $89,451,053 -10.6 $51,341,406 -42.6 $1.91 1915(c) waivers - BHS $148,858 $143,149 -3.8 $3,402,268 2276.7 $6,167,273 81.3 $0.23 State plan HCBS - BHS $0 $0 0.0 $0 0.0 $0 0.0 $0.00 Health homes - BHS $0 $0 0.0 $0 0.0 $0 0.0 $0.00 Total-Other/Multiple Populations $201,471,305 $409,104,601 103.1 $643,773,940 57.4 $735,983,916 14.3 $27.31 Case management $88,774,755 $91,394,519 3.0 $92,066,692 0.7 $88,837,451 -3.5 $3.30 1915(c) waivers - other $84,972,867 $96,210,080 13.2 $94,538,429 -1.7 $88,077,481 -6.8 $3.27 HCBS - unspecified - other $0 $170,548,294 100.0 $433,251,009 154.0 $524,421,780 21.0 $19.46 Health homes - other or multiple $0 $0 0.0 $0 0.0 $0 0.0 $0.00 Institutional MLTSS – unspecified $0 $0 0.0 $0 0.0 $0 0.0 $0.00 MFP demonstration $27,723,683 $50,951,708 83.8 $23,917,810 -53.1 $34,647,204 44.9 $1.29 Total LTSS $7,548,615,769 $8,161,109,826 8.1 $8,746,109,454 7.2 $9,547,670,734 9.2 $354.34 Total Institutional LTSS $3,766,856,902 $3,708,336,250 -1.6 $3,818,733,739 3.0 $4,023,261,690 5.4 $149.32 Total HCBS $3,781,758,867 $4,452,773,576 17.7 $4,927,375,715 10.7 $5,524,409,044 12.1 $205.03 Total Medicaid (all services) $29,703,172,868 $30,505,857,320 2.7 $33,232,161,492 8.9 $34,885,244,075 5.0 $1,294.70
Percentages FY 2012 FY 2013 FY 2014 FY 2015
Total LTSS as a Percentage of Total Medicaid 25.4% 26.8% 26.3% 27.4% Percentage of LTSS that is HCBS 50.1% 54.6% 56.3% 57.9% Percentage of LTSS that is HCBS – AD 50.1% 54.6% 55.4% 57.4% Percentage of LTSS that is HCBS – DD 50.0% 50.2% 50.3% 51.4% Percentage of LTSS that is HCBS – BHS 27.5% 28.0% 28.4% 17.4%
Notes: Expenditures are total Medicaid spending, including both federal and state payments. Data for several states include expenditures for Medicaid Upper Payment Limit programs or provider taxes. Institutional MLTSS - unspecified refers to institutional LTSS provided through managed care organizations and reported on the CMS-64. The CMS-64 does not specify the type of institutional LTSS. HCBS - unspecified refers to HCBS provided through managed care organizations and fee-for-service HCBS provided in section 1115 demonstrations that were not authorized under another state plan or waiver authority. IMD for people under age 21 or age 65 and older, case management, rehabilitative services, private duty nursing, state plan HCBS, and health homes data do not include services provided through managed care organizations.

Utah Table 45
Service Type FY 2012 FY 2013
Percent Change 12-13 FY 2014
Percent Change 13-14 FY 2015
Percent Change 14-15
FY 2015 Expenditures Per Resident
Total-Older Adults, People with PD $222,884,354 $222,076,382 -0.4 $237,546,017 7.0 $248,528,565 4.6 $84.48 Nursing facilities $174,207,461 $170,909,468 -1.9 $183,936,372 7.6 $190,765,138 3.7 $64.85 Personal care $3,151,205 $3,266,802 3.7 $2,864,074 -12.3 $2,924,554 2.1 $0.99 1915(c) waivers - AD $32,509,208 $37,418,832 15.1 $42,812,107 14.4 $46,963,897 9.7 $15.96 Home health $10,246,910 $8,443,541 -17.6 $6,233,748 -26.2 $6,023,016 -3.4 $2.05 Community first choice $0 $0 0.0 $0 0.0 $0 0.0 $0.00 HCBS - unspecified - AD $0 $0 0.0 $0 0.0 $0 0.0 $0.00 PACE $0 $0 0.0 $0 0.0 $0 0.0 $0.00 Private duty nursing $2,769,570 $2,037,739 -26.4 $1,699,716 -16.6 $1,851,960 9.0 $0.63 Self-directed PAS - alternative to 1915(c) $0 $0 0.0 $0 0.0 $0 0.0 $0.00 Self-directed PAS - alternative to personal care $0 $0 0.0 $0 0.0 $0 0.0 $0.00 Health homes - AD $0 $0 0.0 $0 0.0 $0 0.0 $0.00 State plan HCBS - AD $0 $0 0.0 $0 0.0 $0 0.0 $0.00 Total-People with DD $233,624,306 $231,028,284 -1.1 $243,259,979 5.3 $263,041,653 8.1 $89.41 ICF/IID - public $30,747,767 $31,489,359 2.4 $32,957,647 4.7 $33,210,402 0.8 $11.29 ICF/IID - private $32,530,592 $31,587,870 -2.9 $32,527,343 3.0 $34,110,209 4.9 $11.59 1915(c) waivers - DD $170,345,947 $167,951,055 -1.4 $177,774,989 5.8 $195,721,042 10.1 $66.53 HCBS - unspecified - DD $0 $0 0.0 $0 0.0 $0 0.0 $0.00 State plan HCBS - DD $0 $0 0.0 $0 0.0 $0 0.0 $0.00 Total-Behavioral Health Services $31,192,496 $24,774,026 -20.6 $35,644,897 43.9 $44,412,742 24.6 $15.10 IMD for people under age 21 or age 65 and older $16,396,929 $10,382,665 -36.7 $24,479,975 135.8 $15,508,716 -36.6 $5.27 Mental health facilities DSH $1,871,016 $934,586 -50.0 $934,586 0.0 $934,586 0.0 $0.32 Rehabilitative services $12,924,551 $13,456,775 4.1 $10,230,336 -24.0 $27,969,440 173.4 $9.51 1915(c) waivers - BHS $0 $0 0.0 $0 0.0 $0 0.0 $0.00 State plan HCBS - BHS $0 $0 0.0 $0 0.0 $0 0.0 $0.00 Health homes - BHS $0 $0 0.0 $0 0.0 $0 0.0 $0.00 Total-Other/Multiple Populations $6,643,801 $7,053,357 6.2 $7,242,880 2.7 $7,517,308 3.8 $2.56 Case management $3,488 $6,980 100.1 $4,296 -38.5 $1,573 -63.4 $0.00 1915(c) waivers - other $6,640,313 $7,046,377 6.1 $7,238,584 2.7 $7,515,735 3.8 $2.55 HCBS - unspecified - other $0 $0 0.0 $0 0.0 $0 0.0 $0.00 Health homes - other or multiple $0 $0 0.0 $0 0.0 $0 0.0 $0.00 Institutional MLTSS – unspecified $0 $0 0.0 $0 0.0 $0 0.0 $0.00 MFP demonstration $0 $0 0.0 $0 0.0 $0 0.0 $0.00 Total LTSS $494,344,957 $484,932,049 -1.9 $523,693,773 8.0 $563,500,268 7.6 $191.55 Total Institutional LTSS $255,753,765 $245,303,948 -4.1 $274,835,923 12.0 $274,529,051 -0.1 $93.32 Total HCBS $238,591,192 $239,628,101 0.4 $248,857,850 3.9 $288,971,217 16.1 $98.23 Total Medicaid (all services) $1,892,256,465 $2,143,820,954 13.3 $2,057,159,773 -4.0 $2,268,816,289 10.3 $771.22
Percentages FY 2012 FY 2013 FY 2014 FY 2015
Total LTSS as a Percentage of Total Medicaid 26.1% 22.6% 25.5% 24.8% Percentage of LTSS that is HCBS 48.3% 49.4% 47.5% 51.3% Percentage of LTSS that is HCBS – AD 21.8% 23.0% 22.6% 23.2% Percentage of LTSS that is HCBS – DD 72.9% 72.7% 73.1% 74.4% Percentage of LTSS that is HCBS – BHS 41.4% 54.3% 28.7% 63.0%
Notes: Expenditures are total Medicaid spending, including both federal and state payments. Data for several states include expenditures for Medicaid Upper Payment Limit programs or provider taxes. Institutional MLTSS - unspecified refers to institutional LTSS provided through managed care organizations and reported on the CMS-64. The CMS-64 does not specify the type of institutional LTSS. HCBS - unspecified refers to HCBS provided through managed care organizations and fee-for-service HCBS provided in section 1115 demonstrations that were not authorized under another state plan or waiver authority. IMD for people under age 21 or age 65 and older, case management, rehabilitative services, private duty nursing, state plan HCBS, and health homes data do not include services provided through managed care organizations.

Vermont Table 46
Service Type FY 2012 FY 2013
Percent Change 12-13 FY 2014
Percent Change 13-14 FY 2015
Percent Change 14-15
FY 2015 Expenditures Per Resident
Total-Older Adults, People with PD $212,730,213 $209,187,191 -1.7 $222,731,417 6.5 $225,125,892 1.1 $359.06 Nursing facilities $117,665,805 $116,670,437 -0.8 $121,806,559 4.4 $121,983,664 0.1 $194.56 Personal care $29,461,378 $26,141,635 -11.3 $32,807,380 25.5 $30,516,182 -7.0 $48.67 1915(c) waivers - AD $0 $0 0.0 $0 0.0 $0 0.0 $0.00 Home health $7,283,013 $7,375,354 1.3 $7,599,082 3.0 $7,675,130 1.0 $12.24 Community first choice $0 $0 0.0 $0 0.0 $0 0.0 $0.00 HCBS - unspecified - AD $52,583,882 $56,119,524 6.7 $60,518,396 7.8 $64,950,916 7.3 $103.59 PACE $5,736,135 $2,880,241 -49.8 $0 -100.0 $0 0.0 $0.00 Private duty nursing $0 $0 0.0 $0 0.0 $0 0.0 $0.00 Self-directed PAS - alternative to 1915(c) $0 $0 0.0 $0 0.0 $0 0.0 $0.00 Self-directed PAS - alternative to personal care $0 $0 0.0 $0 0.0 $0 0.0 $0.00 Health homes - AD $0 $0 0.0 $0 0.0 $0 0.0 $0.00 State plan HCBS - AD $0 $0 0.0 $0 0.0 $0 0.0 $0.00 Total-People with DD $144,894,765 $153,752,172 6.1 $161,336,344 4.9 $166,691,077 3.3 $265.86 ICF/IID - public $1,211,654 $1,201,518 -0.8 $1,254,497 4.4 $1,286,725 2.6 $2.05 ICF/IID - private $0 $0 0.0 $0 0.0 $0 0.0 $0.00 1915(c) waivers - DD $0 $0 0.0 $0 0.0 $0 0.0 $0.00 HCBS - unspecified - DD $143,683,111 $152,550,654 6.2 $160,081,847 4.9 $165,404,352 3.3 $263.81 State plan HCBS - DD $0 $0 0.0 $0 0.0 $0 0.0 $0.00 Total-Behavioral Health Services $40,852 $55,889 36.8 $108,490 94.1 $110,284 1.7 $0.18 IMD for people under age 21 or age 65 and older $1,156 $5,840 405.2 $0 -100.0 $2,432 100.0 $0.00 Mental health facilities DSH $0 $0 0.0 $0 0.0 $0 0.0 $0.00 Rehabilitative services $39,696 $50,049 26.1 $108,490 116.8 $107,852 -0.6 $0.17 1915(c) waivers - BHS $0 $0 0.0 $0 0.0 $0 0.0 $0.00 State plan HCBS - BHS $0 $0 0.0 $0 0.0 $0 0.0 $0.00 Health homes - BHS $0 $0 0.0 $0 0.0 $0 0.0 $0.00 Total-Other/Multiple Populations $8,101,902 $9,187,984 13.4 $9,761,114 6.2 $10,012,855 2.6 $15.97 Case management $45,103 $89,171 97.7 $88,382 -0.9 $61,595 -30.3 $0.10 1915(c) waivers - other $0 $0 0.0 $0 0.0 $0 0.0 $0.00 HCBS - unspecified - other $7,782,256 $7,730,217 -0.7 $8,181,129 5.8 $7,613,564 -6.9 $12.14 Health homes - other or multiple $0 $0 0.0 $0 0.0 $0 0.0 $0.00 Institutional MLTSS – unspecified $0 $0 0.0 $0 0.0 $0 0.0 $0.00 MFP demonstration $274,543 $1,368,596 398.5 $1,491,603 9.0 $2,337,696 56.7 $3.73 Total LTSS $365,767,732 $372,183,236 1.8 $393,937,365 5.8 $401,940,108 2.0 $641.07 Total Institutional LTSS $118,878,615 $117,877,795 -0.8 $123,061,056 4.4 $123,272,821 0.2 $196.61 Total HCBS $246,889,117 $254,305,441 3.0 $270,876,309 6.5 $278,667,287 2.9 $444.46 Total Medicaid (all services) $1,388,919,441 $1,445,881,374 4.1 $1,535,217,667 6.2 $1,632,312,261 6.3 $2,603.44
Percentages FY 2012 FY 2013 FY 2014 FY 2015
Total LTSS as a Percentage of Total Medicaid 26.3% 25.7% 25.7% 24.6% Percentage of LTSS that is HCBS 67.5% 68.3% 68.8% 69.3% Percentage of LTSS that is HCBS – AD 44.7% 44.2% 45.3% 45.8% Percentage of LTSS that is HCBS – DD 99.2% 99.2% 99.2% 99.2% Percentage of LTSS that is HCBS – BHS 97.2% 89.6% 100.0% 97.8%
Notes: Expenditures are total Medicaid spending, including both federal and state payments. Data for several states include expenditures for Medicaid Upper Payment Limit programs or provider taxes. Institutional MLTSS - unspecified refers to institutional LTSS provided through managed care organizations and reported on the CMS-64. The CMS-64 does not specify the type of institutional LTSS. HCBS - unspecified refers to HCBS provided through managed care organizations and fee-for-service HCBS provided in section 1115 demonstrations that were not authorized under another state plan or waiver authority. IMD for people under age 21 or age 65 and older, case management, rehabilitative services, private duty nursing, state plan HCBS, and health homes data do not include services provided through managed care organizations.

Virginia Table 47
Service Type FY 2012 FY 2013
Percent Change 12-13 FY 2014
Percent Change 13-14 FY 2015
Percent Change 14-15
FY 2015 Expenditures Per Resident
Total-Older Adults, People with PD $1,467,651,056 $1,557,403,231 6.1 $1,669,113,481 7.2 $1,777,045,853 6.5 $213.65 Nursing facilities $825,304,290 $847,679,689 2.7 $870,847,862 2.7 $948,886,864 9.0 $114.08 Personal care $0 $0 0.0 $2,928,483 100.0 $37,094,732 1166.7 $4.46 1915(c) waivers - AD $599,902,912 $649,270,247 8.2 $718,727,441 10.7 $686,771,059 -4.4 $82.57 Home health $7,704,243 $5,938,977 -22.9 $5,182,429 -12.7 $26,681,284 414.8 $3.21 Community first choice $0 $0 0.0 $0 0.0 $0 0.0 $0.00 HCBS - unspecified - AD $0 $0 0.0 $1,920,754 100.0 $1,076,547 -44.0 $0.13 PACE $30,026,671 $36,349,943 21.1 $48,121,184 32.4 $57,323,907 19.1 $6.89 Private duty nursing $4,712,940 $18,164,375 285.4 $21,385,328 17.7 $19,211,460 -10.2 $2.31 Self-directed PAS - alternative to 1915(c) $0 $0 0.0 $0 0.0 $0 0.0 $0.00 Self-directed PAS - alternative to personal care $0 $0 0.0 $0 0.0 $0 0.0 $0.00 Health homes - AD $0 $0 0.0 $0 0.0 $0 0.0 $0.00 State plan HCBS - AD $0 $0 0.0 $0 0.0 $0 0.0 $0.00 Total-People with DD $833,861,811 $876,193,646 5.1 $884,922,015 1.0 $924,573,564 4.5 $111.16 ICF/IID - public $212,446,783 $218,507,789 2.9 $191,727,385 -12.3 $130,938,444 -31.7 $15.74 ICF/IID - private $75,669,098 $83,917,831 10.9 $89,157,600 6.2 $100,569,805 12.8 $12.09 1915(c) waivers - DD $545,745,930 $573,768,026 5.1 $604,037,030 5.3 $693,065,315 14.7 $83.33 HCBS - unspecified - DD $0 $0 0.0 $0 0.0 $0 0.0 $0.00 State plan HCBS - DD $0 $0 0.0 $0 0.0 $0 0.0 $0.00 Total-Behavioral Health Services $126,879,921 $142,150,386 12.0 $145,037,263 2.0 $164,323,070 13.3 $19.76 IMD for people under age 21 or age 65 and older $126,879,921 $135,288,751 6.6 $135,640,318 0.3 $150,300,783 10.8 $18.07 Mental health facilities DSH $0 $6,861,635 100.0 $9,396,945 36.9 $14,022,287 49.2 $1.69 Rehabilitative services $0 $0 0.0 $0 0.0 $0 0.0 $0.00 1915(c) waivers - BHS $0 $0 0.0 $0 0.0 $0 0.0 $0.00 State plan HCBS - BHS $0 $0 0.0 $0 0.0 $0 0.0 $0.00 Health homes - BHS $0 $0 0.0 $0 0.0 $0 0.0 $0.00 Total-Other/Multiple Populations $138,704,347 $144,178,686 3.9 $148,130,853 2.7 $153,751,216 3.8 $18.49 Case management $130,156,003 $134,161,785 3.1 $136,254,148 1.6 $141,742,500 4.0 $17.04 1915(c) waivers - other $264,066 $0 -100.0 $0 0.0 $0 0.0 $0.00 HCBS - unspecified - other $0 $0 0.0 $0 0.0 $0 0.0 $0.00 Health homes - other or multiple $0 $0 0.0 $0 0.0 $0 0.0 $0.00 Institutional MLTSS – unspecified $0 $0 0.0 $0 0.0 $0 0.0 $0.00 MFP demonstration $8,284,278 $10,016,901 20.9 $11,876,705 18.6 $12,008,716 1.1 $1.44 Total LTSS $2,567,097,135 $2,719,925,949 6.0 $2,847,203,612 4.7 $3,019,693,703 6.1 $363.06 Total Institutional LTSS $1,240,300,092 $1,292,255,695 4.2 $1,296,770,110 0.3 $1,344,718,183 3.7 $161.68 Total HCBS $1,326,797,043 $1,427,670,254 7.6 $1,550,433,502 8.6 $1,674,975,520 8.0 $201.38 Total Medicaid (all services) $6,886,178,858 $7,314,244,050 6.2 $7,731,122,892 5.7 $8,030,220,829 3.9 $965.48
Percentages FY 2012 FY 2013 FY 2014 FY 2015
Total LTSS as a Percentage of Total Medicaid 37.3% 37.2% 36.8% 37.6% Percentage of LTSS that is HCBS 51.7% 52.5% 54.5% 55.5% Percentage of LTSS that is HCBS – AD 43.8% 45.6% 47.8% 46.6% Percentage of LTSS that is HCBS – DD 65.4% 65.5% 68.3% 75.0% Percentage of LTSS that is HCBS – BHS 0.0% 0.0% 0.0% 0.0%
Notes: Expenditures are total Medicaid spending, including both federal and state payments. Data for several states include expenditures for Medicaid Upper Payment Limit programs or provider taxes. Institutional MLTSS - unspecified refers to institutional LTSS provided through managed care organizations and reported on the CMS-64. The CMS-64 does not specify the type of institutional LTSS. HCBS - unspecified refers to HCBS provided through managed care organizations and fee-for-service HCBS provided in section 1115 demonstrations that were not authorized under another state plan or waiver authority. IMD for people under age 21 or age 65 and older, case management, rehabilitative services, private duty nursing, state plan HCBS, and health homes data do not include services provided through managed care organizations.

Washington Table 48
Service Type FY 2012 FY 2013
Percent Change 12-13 FY 2014
Percent Change 13-14 FY 2015
Percent Change 14-15
FY 2015 Expenditures Per Resident
Total-Older Adults, People with PD $1,607,821,859 $1,605,316,687 -0.2 $1,725,444,337 7.5 $1,924,830,987 11.6 $272.86 Nursing facilities $614,400,345 $609,838,648 -0.7 $628,660,165 3.1 $644,037,493 2.4 $91.30 Personal care $393,046,408 $336,543,256 -14.4 $374,295,449 11.2 $441,681,810 18.0 $62.61 1915(c) waivers - AD $558,030,016 $607,994,450 9.0 $671,355,210 10.4 $586,009,728 -12.7 $83.07 Home health $27,428,288 $25,459,344 -7.2 $23,135,063 -9.1 $20,110,518 -13.1 $2.85 Community first choice $0 $0 0.0 $0 0.0 $204,296,557 100.0 $28.96 HCBS - unspecified - AD $63,397 $0 -100.0 $199,662 100.0 $0 -100.0 $0.00 PACE $11,527,330 $11,215,448 -2.7 $13,038,202 16.3 $13,278,837 1.8 $1.88 Private duty nursing $3,326,075 $14,265,541 328.9 $14,760,586 3.5 $15,416,044 4.4 $2.19 Self-directed PAS - alternative to 1915(c) $0 $0 0.0 $0 0.0 $0 0.0 $0.00 Self-directed PAS - alternative to personal care $0 $0 0.0 $0 0.0 $0 0.0 $0.00 Health homes - AD $0 $0 0.0 $0 0.0 $0 0.0 $0.00 State plan HCBS - AD $0 $0 0.0 $0 0.0 $0 0.0 $0.00 Total-People with DD $661,549,529 $705,868,316 6.7 $770,367,063 9.1 $793,045,782 2.9 $112.42 ICF/IID - public $100,339,159 $111,920,925 11.5 $124,630,705 11.4 $119,124,842 -4.4 $16.89 ICF/IID - private $5,771,679 $5,954,962 3.2 $6,157,953 3.4 $6,183,185 0.4 $0.88 1915(c) waivers - DD $555,438,691 $587,992,429 5.9 $639,578,405 8.8 $667,737,755 4.4 $94.66 HCBS - unspecified - DD $0 $0 0.0 $0 0.0 $0 0.0 $0.00 State plan HCBS - DD $0 $0 0.0 $0 0.0 $0 0.0 $0.00 Total-Behavioral Health Services $150,475,998 $156,076,099 3.7 $159,145,773 2.0 $163,217,036 2.6 $23.14 IMD for people under age 21 or age 65 and older $25,272,474 $27,823,193 10.1 $28,929,729 4.0 $30,996,868 7.1 $4.39 Mental health facilities DSH $125,203,524 $128,252,906 2.4 $130,216,044 1.5 $132,220,168 1.5 $18.74 Rehabilitative services $0 $0 0.0 $0 0.0 $0 0.0 $0.00 1915(c) waivers - BHS $0 $0 0.0 $0 0.0 $0 0.0 $0.00 State plan HCBS - BHS $0 $0 0.0 $0 0.0 $0 0.0 $0.00 Health homes - BHS $0 $0 0.0 $0 0.0 $0 0.0 $0.00 Total-Other/Multiple Populations $33,058,713 $28,987,635 -12.3 $34,143,386 17.8 $45,271,027 32.6 $6.42 Case management $13,372,530 $12,033,547 -10.0 $11,814,537 -1.8 $12,952,829 9.6 $1.84 1915(c) waivers - other $0 $0 0.0 $0 0.0 $0 0.0 $0.00 HCBS - unspecified - other $0 $0 0.0 $0 0.0 $0 0.0 $0.00 Health homes - other or multiple $0 $9,864 100.0 $1,574,514 15862.2 $6,880,717 337.0 $0.98 Institutional MLTSS – unspecified $0 $0 0.0 $0 0.0 $0 0.0 $0.00 MFP demonstration $19,686,183 $16,944,224 -13.9 $20,754,335 22.5 $25,437,481 22.6 $3.61 Total LTSS $2,452,906,099 $2,496,248,737 1.8 $2,689,100,559 7.7 $2,926,364,832 8.8 $414.84 Total Institutional LTSS $870,987,181 $883,790,634 1.5 $918,594,596 3.9 $932,562,556 1.5 $132.20 Total HCBS $1,581,918,918 $1,612,458,103 1.9 $1,770,505,963 9.8 $1,993,802,276 12.6 $282.64 Total Medicaid (all services) $7,569,696,927 $8,020,152,575 6.0 $9,307,367,915 16.0 $10,810,563,949 16.2 $1,532.50
Percentages FY 2012 FY 2013 FY 2014 FY 2015
Total LTSS as a Percentage of Total Medicaid 32.4% 31.1% 28.9% 27.1% Percentage of LTSS that is HCBS 64.5% 64.6% 65.8% 68.1% Percentage of LTSS that is HCBS – AD 61.8% 62.0% 63.6% 66.5% Percentage of LTSS that is HCBS – DD 84.0% 83.3% 83.0% 84.2% Percentage of LTSS that is HCBS – BHS 0.0% 0.0% 0.0% 0.0%
Notes: Expenditures are total Medicaid spending, including both federal and state payments. Data for several states include expenditures for Medicaid Upper Payment Limit programs or provider taxes. Institutional MLTSS - unspecified refers to institutional LTSS provided through managed care organizations and reported on the CMS-64. The CMS-64 does not specify the type of institutional LTSS. HCBS - unspecified refers to HCBS provided through managed care organizations and fee-for-service HCBS provided in section 1115 demonstrations that were not authorized under another state plan or waiver authority. IMD for people under age 21 or age 65 and older, case management, rehabilitative services, private duty nursing, state plan HCBS, and health homes data do not include services provided through managed care organizations.
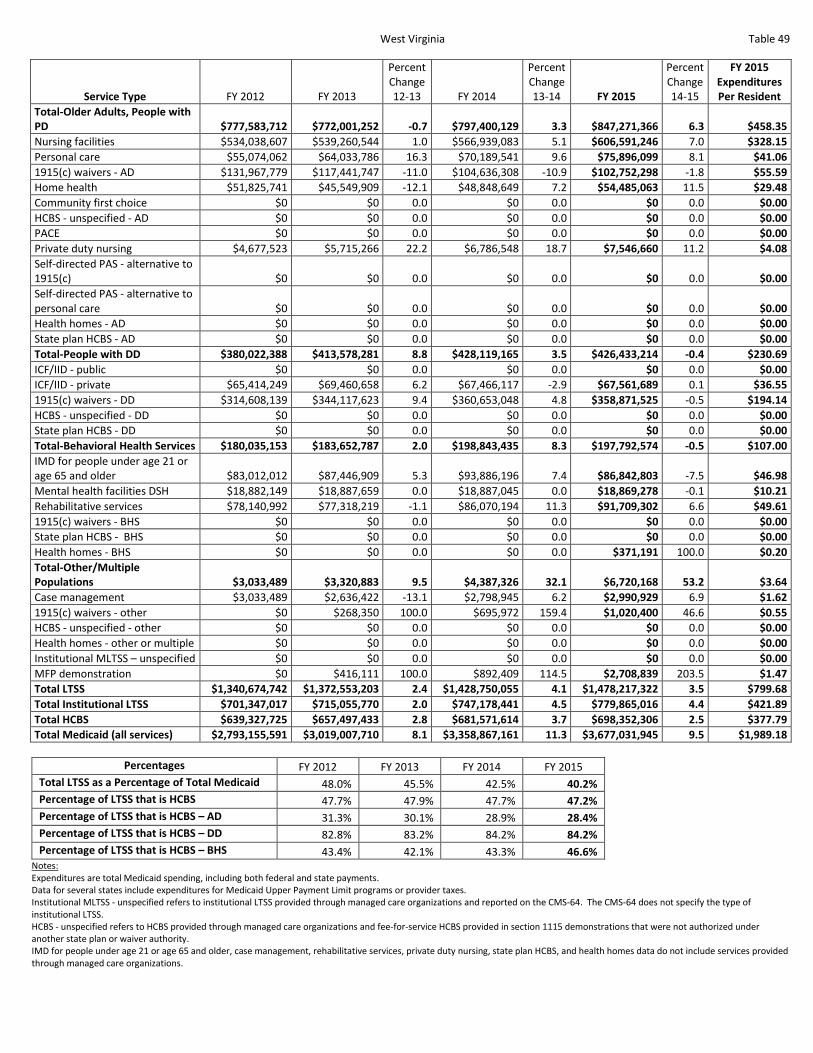
West Virginia Table 49
Service Type FY 2012 FY 2013
Percent Change 12-13 FY 2014
Percent Change 13-14 FY 2015
Percent Change 14-15
FY 2015 Expenditures Per Resident
Total-Older Adults, People with PD $777,583,712 $772,001,252 -0.7 $797,400,129 3.3 $847,271,366 6.3 $458.35 Nursing facilities $534,038,607 $539,260,544 1.0 $566,939,083 5.1 $606,591,246 7.0 $328.15 Personal care $55,074,062 $64,033,786 16.3 $70,189,541 9.6 $75,896,099 8.1 $41.06 1915(c) waivers - AD $131,967,779 $117,441,747 -11.0 $104,636,308 -10.9 $102,752,298 -1.8 $55.59 Home health $51,825,741 $45,549,909 -12.1 $48,848,649 7.2 $54,485,063 11.5 $29.48 Community first choice $0 $0 0.0 $0 0.0 $0 0.0 $0.00 HCBS - unspecified - AD $0 $0 0.0 $0 0.0 $0 0.0 $0.00 PACE $0 $0 0.0 $0 0.0 $0 0.0 $0.00 Private duty nursing $4,677,523 $5,715,266 22.2 $6,786,548 18.7 $7,546,660 11.2 $4.08 Self-directed PAS - alternative to 1915(c) $0 $0 0.0 $0 0.0 $0 0.0 $0.00 Self-directed PAS - alternative to personal care $0 $0 0.0 $0 0.0 $0 0.0 $0.00 Health homes - AD $0 $0 0.0 $0 0.0 $0 0.0 $0.00 State plan HCBS - AD $0 $0 0.0 $0 0.0 $0 0.0 $0.00 Total-People with DD $380,022,388 $413,578,281 8.8 $428,119,165 3.5 $426,433,214 -0.4 $230.69 ICF/IID - public $0 $0 0.0 $0 0.0 $0 0.0 $0.00 ICF/IID - private $65,414,249 $69,460,658 6.2 $67,466,117 -2.9 $67,561,689 0.1 $36.55 1915(c) waivers - DD $314,608,139 $344,117,623 9.4 $360,653,048 4.8 $358,871,525 -0.5 $194.14 HCBS - unspecified - DD $0 $0 0.0 $0 0.0 $0 0.0 $0.00 State plan HCBS - DD $0 $0 0.0 $0 0.0 $0 0.0 $0.00 Total-Behavioral Health Services $180,035,153 $183,652,787 2.0 $198,843,435 8.3 $197,792,574 -0.5 $107.00 IMD for people under age 21 or age 65 and older $83,012,012 $87,446,909 5.3 $93,886,196 7.4 $86,842,803 -7.5 $46.98 Mental health facilities DSH $18,882,149 $18,887,659 0.0 $18,887,045 0.0 $18,869,278 -0.1 $10.21 Rehabilitative services $78,140,992 $77,318,219 -1.1 $86,070,194 11.3 $91,709,302 6.6 $49.61 1915(c) waivers - BHS $0 $0 0.0 $0 0.0 $0 0.0 $0.00 State plan HCBS - BHS $0 $0 0.0 $0 0.0 $0 0.0 $0.00 Health homes - BHS $0 $0 0.0 $0 0.0 $371,191 100.0 $0.20 Total-Other/Multiple Populations $3,033,489 $3,320,883 9.5 $4,387,326 32.1 $6,720,168 53.2 $3.64 Case management $3,033,489 $2,636,422 -13.1 $2,798,945 6.2 $2,990,929 6.9 $1.62 1915(c) waivers - other $0 $268,350 100.0 $695,972 159.4 $1,020,400 46.6 $0.55 HCBS - unspecified - other $0 $0 0.0 $0 0.0 $0 0.0 $0.00 Health homes - other or multiple $0 $0 0.0 $0 0.0 $0 0.0 $0.00 Institutional MLTSS – unspecified $0 $0 0.0 $0 0.0 $0 0.0 $0.00 MFP demonstration $0 $416,111 100.0 $892,409 114.5 $2,708,839 203.5 $1.47 Total LTSS $1,340,674,742 $1,372,553,203 2.4 $1,428,750,055 4.1 $1,478,217,322 3.5 $799.68 Total Institutional LTSS $701,347,017 $715,055,770 2.0 $747,178,441 4.5 $779,865,016 4.4 $421.89 Total HCBS $639,327,725 $657,497,433 2.8 $681,571,614 3.7 $698,352,306 2.5 $377.79 Total Medicaid (all services) $2,793,155,591 $3,019,007,710 8.1 $3,358,867,161 11.3 $3,677,031,945 9.5 $1,989.18
Percentages FY 2012 FY 2013 FY 2014 FY 2015
Total LTSS as a Percentage of Total Medicaid 48.0% 45.5% 42.5% 40.2% Percentage of LTSS that is HCBS 47.7% 47.9% 47.7% 47.2% Percentage of LTSS that is HCBS – AD 31.3% 30.1% 28.9% 28.4% Percentage of LTSS that is HCBS – DD 82.8% 83.2% 84.2% 84.2% Percentage of LTSS that is HCBS – BHS 43.4% 42.1% 43.3% 46.6%
Notes: Expenditures are total Medicaid spending, including both federal and state payments. Data for several states include expenditures for Medicaid Upper Payment Limit programs or provider taxes. Institutional MLTSS - unspecified refers to institutional LTSS provided through managed care organizations and reported on the CMS-64. The CMS-64 does not specify the type of institutional LTSS. HCBS - unspecified refers to HCBS provided through managed care organizations and fee-for-service HCBS provided in section 1115 demonstrations that were not authorized under another state plan or waiver authority. IMD for people under age 21 or age 65 and older, case management, rehabilitative services, private duty nursing, state plan HCBS, and health homes data do not include services provided through managed care organizations.

Wisconsin Table 50
Service Type FY 2012 FY 2013
Percent Change 12-13 FY 2014
Percent Change 13-14 FY 2015
Percent Change 14-15
FY 2015 Expenditures Per Resident
Total-Older Adults, People with PD $1,837,830,384 $2,027,773,199 10.3 $2,085,097,141 2.8 $2,159,922,849 3.6 $375.09 Nursing facilities $914,390,660 $972,521,977 6.4 $939,100,221 -3.4 $1,059,236,756 12.8 $183.95 Personal care $366,573,886 $435,247,898 18.7 $451,937,717 3.8 $467,782,275 3.5 $81.24 1915(c) waivers - AD $432,537,846 $491,129,012 13.5 $567,908,305 15.6 $509,794,714 -10.2 $88.53 Home health $78,634,598 $83,253,135 5.9 $82,325,864 -1.1 $81,374,345 -1.2 $14.13 Community first choice $0 $0 0.0 $0 0.0 $0 0.0 $0.00 HCBS - unspecified - AD $0 $0 0.0 $0 0.0 $0 0.0 $0.00 PACE $0 $0 0.0 $0 0.0 $0 0.0 $0.00 Private duty nursing $45,693,394 $45,621,177 -0.2 $43,824,176 -3.9 $41,734,759 -4.8 $7.25 Self-directed PAS - alternative to 1915(c) $0 $0 0.0 $0 0.0 $0 0.0 $0.00 Self-directed PAS - alternative to personal care $0 $0 0.0 $858 100.0 $0 -100.0 $0.00 Health homes - AD $0 $0 0.0 $0 0.0 $0 0.0 $0.00 State plan HCBS - AD $0 $0 0.0 $0 0.0 $0 0.0 $0.00 Total-People with DD $997,021,579 $1,004,950,863 0.8 $1,054,253,408 4.9 $1,244,044,306 18.0 $216.04 ICF/IID - public $178,878,985 $148,546,772 -17.0 $149,834,808 0.9 $141,881,178 -5.3 $24.64 ICF/IID - private $18,616,932 $16,494,534 -11.4 $11,007,004 -33.3 $1,744,623 -84.1 $0.30 1915(c) waivers - DD $799,525,662 $839,909,557 5.1 $893,411,596 6.4 $1,100,418,505 23.2 $191.10 HCBS - unspecified - DD $0 $0 0.0 $0 0.0 $0 0.0 $0.00 State plan HCBS - DD $0 $0 0.0 $0 0.0 $0 0.0 $0.00 Total-Behavioral Health Services $51,038,025 $44,410,821 -13.0 $43,728,389 -1.5 $50,260,920 14.9 $8.73 IMD for people under age 21 or age 65 and older $15,015,561 $15,873,688 5.7 $16,392,873 3.3 $15,680,913 -4.3 $2.72 Mental health facilities DSH $0 $0 0.0 $0 0.0 $0 0.0 $0.00 Rehabilitative services $7,535,325 $7,193,265 -4.5 $6,928,755 -3.7 $6,124,357 -11.6 $1.06 1915(c) waivers - BHS $25,028,289 $17,684,244 -29.3 $16,204,269 -8.4 $22,094,086 36.3 $3.84 State plan HCBS - BHS $3,458,850 $3,659,624 5.8 $4,202,492 14.8 $6,361,564 51.4 $1.10 Health homes - BHS $0 $0 0.0 $0 0.0 $0 0.0 $0.00 Total-Other/Multiple Populations $63,917,617 $70,150,141 9.8 $48,708,227 -30.6 $39,913,719 -18.1 $6.93 Case management $53,773,922 $56,935,743 5.9 $33,614,020 -41.0 $28,689,461 -14.7 $4.98 1915(c) waivers - other $5,549,290 $5,938,529 7.0 $4,553,344 -23.3 $531,890 -88.3 $0.09 HCBS - unspecified - other $0 $0 0.0 $0 0.0 $0 0.0 $0.00 Health homes - other or multiple $0 $155,351 100.0 $221,481 42.6 $330,024 49.0 $0.06 Institutional MLTSS – unspecified $0 $0 0.0 $0 0.0 $0 0.0 $0.00 MFP demonstration $4,594,405 $7,120,518 55.0 $10,319,382 44.9 $10,362,344 0.4 $1.80 Total LTSS $2,949,807,605 $3,147,285,024 6.7 $3,231,787,165 2.7 $3,494,141,794 8.1 $606.79 Total Institutional LTSS $1,126,902,138 $1,153,436,971 2.4 $1,116,334,906 -3.2 $1,218,543,470 9.2 $211.61 Total HCBS $1,822,905,467 $1,993,848,053 9.4 $2,115,452,259 6.1 $2,275,598,324 7.6 $395.18 Total Medicaid (all services) $6,825,756,806 $7,158,368,459 4.9 $7,392,029,747 3.3 $7,999,631,053 8.2 $1,389.22
Percentages FY 2012 FY 2013 FY 2014 FY 2015
Total LTSS as a Percentage of Total Medicaid 43.2% 44.0% 43.7% 43.7% Percentage of LTSS that is HCBS 61.8% 63.4% 65.5% 65.1% Percentage of LTSS that is HCBS – AD 50.2% 52.0% 55.0% 51.0% Percentage of LTSS that is HCBS – DD 80.2% 83.6% 84.7% 88.5% Percentage of LTSS that is HCBS – BHS 70.6% 64.3% 62.5% 68.8%
Notes: Expenditures are total Medicaid spending, including both federal and state payments. Data for several states include expenditures for Medicaid Upper Payment Limit programs or provider taxes. Institutional MLTSS - unspecified refers to institutional LTSS provided through managed care organizations and reported on the CMS-64. The CMS-64 does not specify the type of institutional LTSS. HCBS - unspecified refers to HCBS provided through managed care organizations and fee-for-service HCBS provided in section 1115 demonstrations that were not authorized under another state plan or waiver authority. IMD for people under age 21 or age 65 and older, case management, rehabilitative services, private duty nursing, state plan HCBS, and health homes data do not include services provided through managed care organizations. Wisconsin combined its Family Care section 1915(c) waivers in 2015: one waiver targeted people with developmental disabilities and the other targeted older adults and people with physical disabilities. Expenditures by target population are estimated: the percentage of total Family Care spending for each population was assumed to be the 2012 - 2014 average percentage.

Wyoming Table 51
Service Type FY 2012 FY 2013
Percent Change 12-13 FY 2014
Percent Change 13-14 FY 2015
Percent Change 14-15
FY 2015 Expenditures Per Resident
Total-Older Adults, People with PD $126,241,567 $127,376,059 0.9 $129,119,948 1.4 $134,717,944 4.3 $230.82 Nursing facilities $100,954,262 $102,017,436 1.1 $101,531,460 -0.5 $103,147,531 1.6 $176.73 Personal care $0 $0 0.0 $0 0.0 $0 0.0 $0.00 1915(c) waivers - AD $16,155,056 $15,611,929 -3.4 $16,129,589 3.3 $17,050,681 5.7 $29.21 Home health $9,132,249 $9,361,981 2.5 $9,902,288 5.8 $12,098,634 22.2 $20.73 Community first choice $0 $0 0.0 $0 0.0 $0 0.0 $0.00 HCBS - unspecified - AD $0 $0 0.0 $0 0.0 $0 0.0 $0.00 PACE $0 $384,713 100.0 $1,556,611 304.6 $2,421,098 55.5 $4.15 Private duty nursing $0 $0 0.0 $0 0.0 $0 0.0 $0.00 Self-directed PAS - alternative to 1915(c) $0 $0 0.0 $0 0.0 $0 0.0 $0.00 Self-directed PAS - alternative to personal care $0 $0 0.0 $0 0.0 $0 0.0 $0.00 Health homes - AD $0 $0 0.0 $0 0.0 $0 0.0 $0.00 State plan HCBS - AD $0 $0 0.0 $0 0.0 $0 0.0 $0.00 Total-People with DD $119,157,011 $116,704,264 -2.1 $111,189,301 -4.7 $109,122,709 -1.9 $186.97 ICF/IID - public $20,744,605 $19,640,307 -5.3 $17,451,654 -11.1 $19,960,138 14.4 $34.20 ICF/IID - private $0 $0 0.0 $0 0.0 $0 0.0 $0.00 1915(c) waivers - DD $98,412,406 $97,063,957 -1.4 $93,737,647 -3.4 $89,162,571 -4.9 $152.77 HCBS - unspecified - DD $0 $0 0.0 $0 0.0 $0 0.0 $0.00 State plan HCBS - DD $0 $0 0.0 $0 0.0 $0 0.0 $0.00 Total-Behavioral Health Services $9,628,191 $13,995,204 45.4 $15,563,984 11.2 $13,708,242 -11.9 $23.49 IMD for people under age 21 or age 65 and older $8,715,604 $13,363,341 53.3 $14,981,043 12.1 $13,116,984 -12.4 $22.47 Mental health facilities DSH $0 $0 0.0 $0 0.0 $0 0.0 $0.00 Rehabilitative services $0 $0 0.0 $0 0.0 $0 0.0 $0.00 1915(c) waivers - BHS $912,587 $631,863 -30.8 $582,941 -7.7 $591,258 1.4 $1.01 State plan HCBS - BHS $0 $0 0.0 $0 0.0 $0 0.0 $0.00 Health homes - BHS $0 $0 0.0 $0 0.0 $0 0.0 $0.00 Total-Other/Multiple Populations $7,329,241 $10,121,500 38.1 $10,890,184 7.6 $10,113,523 -7.1 $17.33 Case management $258,321 $2,390,033 825.2 $3,693,884 54.6 $3,521,722 -4.7 $6.03 1915(c) waivers - other $7,070,920 $7,731,467 9.3 $7,196,300 -6.9 $6,591,801 -8.4 $11.29 HCBS - unspecified - other $0 $0 0.0 $0 0.0 $0 0.0 $0.00 Health homes - other or multiple $0 $0 0.0 $0 0.0 $0 0.0 $0.00 Institutional MLTSS – unspecified $0 $0 0.0 $0 0.0 $0 0.0 $0.00 MFP demonstration $0 $0 0.0 $0 0.0 $0 0.0 $0.00 Total LTSS $262,356,010 $268,197,027 2.2 $266,763,417 -0.5 $267,662,418 0.3 $458.61 Total Institutional LTSS $130,414,471 $135,021,084 3.5 $133,964,157 -0.8 $136,224,653 1.7 $233.40 Total HCBS $131,941,539 $133,175,943 0.9 $132,799,260 -0.3 $131,437,765 -1.0 $225.20 Total Medicaid (all services) $545,524,234 $560,188,308 2.7 $562,372,512 0.4 $547,072,421 -2.7 $937.34
Percentages FY 2012 FY 2013 FY 2014 FY 2015
Total LTSS as a Percentage of Total Medicaid 48.1% 47.9% 47.4% 48.9% Percentage of LTSS that is HCBS 50.3% 49.7% 49.8% 49.1% Percentage of LTSS that is HCBS – AD 20.0% 19.9% 21.4% 23.4% Percentage of LTSS that is HCBS – DD 82.6% 83.2% 84.3% 81.7% Percentage of LTSS that is HCBS – BHS 9.5% 4.5% 3.7% 4.3%
Notes: Expenditures are total Medicaid spending, including both federal and state payments. Data for several states include expenditures for Medicaid Upper Payment Limit programs or provider taxes. Institutional MLTSS - unspecified refers to institutional LTSS provided through managed care organizations and reported on the CMS-64. The CMS-64 does not specify the type of institutional LTSS. HCBS - unspecified refers to HCBS provided through managed care organizations and fee-for-service HCBS provided in section 1115 demonstrations that were not authorized under another state plan or waiver authority. IMD for people under age 21 or age 65 and older, case management, rehabilitative services, private duty nursing, state plan HCBS, and health homes data do not include services provided through managed care organizations.