medicaid financing and expenditures - federation of ... of national health expenditures, trends in...
TRANSCRIPT
Medicaid Financing and Expenditures
Alison Mitchell
Analyst in Health Care Financing
December 14, 2015
Congressional Research Service
7-5700
www.crs.gov
R42640
Medicaid Financing and Expenditures
Congressional Research Service
Summary Medicaid is a means-tested entitlement program that finances the delivery of primary and acute
medical services as well as long-term services and supports. Medicaid is a federal and state
partnership that is jointly financed by both the federal government and the states.
The federal government’s share for most Medicaid expenditures is called the federal medical
assistance percentage (FMAP). Generally determined annually, the FMAP formula is designed so
that the federal government pays a larger portion of Medicaid costs in states with lower per capita
incomes relative to the national average (and vice versa for states with higher per capita incomes).
Federal Medicaid funding to states is open ended.
The federal government provides states a good deal of flexibility in determining the composition
of the state share (also referred to as the nonfederal share) of Medicaid expenditures. As a result,
there is significant variation from state to state in how the state share of Medicaid expenditures is
financed.
In 2014, Medicaid represented 16% of national health expenditures; in that year, private health
insurance and Medicare accounted for 33% and 20% of national health expenditures, respectively.
Medicaid is a significant payer in the categories of health spending that include long-term
services and supports and hospital expenditures. For the other services (such as durable medical
equipment, physician and clinical services, prescription drugs, and dental services), Medicaid
accounts for a smaller share of the national expenditures.
In FY2014, Medicaid expenditures totaled $494 billion, with the federal government paying $299
billion, or about 60% of the total. Over the next few years, Medicaid expenditures are expected to
increase significantly due to the Patient Protection and Affordable Care Act (ACA; P.L. 111-148,
as amended) Medicaid expansion. The federal government is paying the vast majority of the costs
associated with the ACA Medicaid expansion due to the enhanced federal matching rates
available to states that choose to implement the ACA Medicaid expansion.
Spending on managed care and long-term services and supports comprises more than half of
Medicaid expenditures on benefits. Per-enrollee Medicaid expenditures for individuals with
disabilities and the elderly are significantly higher than per-enrollee expenditures for adults and
children, due in part to the higher utilization of long-term services and supports among
individuals with disabilities and the elderly.
Medicaid expenditures are influenced by economic, demographic, and programmatic factors.
Economic factors include health care prices, unemployment rates, and individuals’ wages. In
addition, state-specific factors, such as programmatic decisions and demographics, affect
Medicaid expenditures and cause Medicaid spending to vary widely from state to state.
Medicaid constitutes a significant portion of the federal budget, and federal Medicaid
expenditures are expected to increase significantly over the next ten years due to the ACA
Medicaid expansion. As a result, Medicaid could be a focus of any potential deficit reduction or
other legislative proposals affecting the federal budget.
This report provides an overview of Medicaid’s financing structure, including both federal and
state financing issues. The “Medicaid Expenditures” section of the report discusses Medicaid in
terms of national health expenditures, trends in Medicaid expenditures, economic factors
affecting Medicaid, and state variability in spending.
Medicaid Financing and Expenditures
Congressional Research Service
Contents
Introduction ..................................................................................................................................... 1
Medicaid Financing ......................................................................................................................... 1
Federal Share ............................................................................................................................. 1 The Federal Medical Assistance Percentage ....................................................................... 2 Medicaid and the Federal Budget Process .......................................................................... 3
State Share ................................................................................................................................. 4
Medicaid Expenditures .................................................................................................................... 5
Medicaid and National Health Expenditures ............................................................................ 5 Trend in Medicaid Expenditures ............................................................................................... 8
Medicaid Expenditures by Service Type ............................................................................. 9 Per-Enrollee Medicaid Expenditures ................................................................................ 10
Factors Affecting Medicaid Expenditures ................................................................................ 11 State Variability in Medicaid Spending ................................................................................... 12
Conclusion ..................................................................................................................................... 13
Figures
Figure 1. Medicaid as a Percentage of National Health Expenditures ............................................ 6
Figure 2. Percentage Distribution of National Health Expenditures by Type of Service
and Source of Funds ..................................................................................................................... 7
Figure 3. Federal and State Actual and Projected Medicaid Expenditures ...................................... 8
Figure 4. Medicaid Benefit Expenditures by Service Type ........................................................... 10
Figure 5. Expenditures Per Medicaid Enrollee by Major Eligibility Groups ................................. 11
Figure 6. States’ Share of Total Medicaid Expenditures ............................................................... 12
Appendixes
Appendix. Medicaid Expenditures by State .................................................................................. 14
Contacts
Author Contact Information .......................................................................................................... 16
Medicaid Financing and Expenditures
Congressional Research Service 1
Introduction Medicaid is a means-tested entitlement program that finances the delivery of primary and acute
medical services as well as long-term services and supports.1 Medicaid is a federal and state
partnership. The states are responsible for administering their Medicaid programs, and Medicaid
is jointly financed by the federal government and the states. In FY2014, Medicaid is estimated to
have provided health care services to 65 million individuals2 at a total cost of $494 billion
(including federal and state expenditures).3
Participation in Medicaid is voluntary, though all states, the District of Columbia, and the
territories choose to participate. The federal government sets some basic requirements for
Medicaid, and states have the flexibility to design their own version of Medicaid within the
federal government’s basic framework.
States incur Medicaid costs by making payments to service providers (e.g., for beneficiaries’
doctor visits) and performing administrative activities (e.g., making eligibility determinations).
The federal government reimburses states for a share of each dollar spent in accordance with their
federally approved Medicaid state plans.
Medicaid is an entitlement for both states and individuals. The Medicaid entitlement to states
ensures that, so long as states operate their programs within the federal requirements, states are
entitled to federal Medicaid matching funds. Medicaid is also an individual entitlement, which
means that anyone eligible for Medicaid under his or her state’s eligibility standards is guaranteed
Medicaid coverage.
This report provides an overview of Medicaid’s financing structure, including both federal and
state financing issues. The “Medicaid Expenditures” section of the report discusses Medicaid in
terms of national health expenditures, trends in Medicaid expenditures, economic factors
affecting Medicaid, and state variability in spending.
Medicaid Financing The federal government and the states share the cost of Medicaid. The federal government
reimburses states for a portion (i.e., the federal share or the federal financial participation) of
each state’s Medicaid program costs. Federal Medicaid funding is an open-ended entitlement to
states, which means there is no upper limit or cap on the amount of federal Medicaid funds a state
may receive.
Federal Share
A primary goal of the federal Medicaid matching arrangement is to share the cost of providing
health care services to low-income residents with the states. The Medicaid financing structure
1 For more information about the Medicaid program, see CRS Report R43357, Medicaid: An Overview, coordinated by
Alison Mitchell. 2 This enrollment figure is measured according to person-year equivalents, which represent the average program
enrollment over the course of a year and differ from ever-enrolled counts, which measure the number of people
covered by Medicaid for any period of time during the year. (Christopher J. Truffer, Christian J. Wolfe, and Kathryn E.
Rennie, 2014 Actuarial Report on the Financial Outlook for Medicaid, Office of the Actuary, Centers for Medicare &
Medicaid Services [CMS], U.S. Department of Health & Human Services [HHS], 2015.) 3 CMS, Form CMS-64 data as of March 30, 2015.
Medicaid Financing and Expenditures
Congressional Research Service 2
represents a fiscal commitment on the part of the federal government toward paying at least half
(but not all) of the cost of Medicaid.4
The federal government’s open-ended financial commitment to Medicaid provides a fiscal
incentive for states to extend Medicaid coverage to more low-income individuals than a state
might choose to fund without the federal Medicaid funding. However, this incentive is
counterbalanced by the requirement for states to share in the cost of Medicaid.5
Although most federal Medicaid funding is provided on an open-ended basis, certain types of
federal Medicaid funding are capped. For instance, federal disproportionate share hospital (DSH)6
funding to states cannot exceed a state-specific annual allotment. In addition, Medicaid programs
in the territories (i.e., American Samoa, Guam, the Commonwealth of the Northern Mariana
Islands, Puerto Rico, and the Virgin Islands) are subject to annual spending caps. Another
exception to open-ended federal Medicaid funding includes the Qualified Individuals program.7
The Federal Medical Assistance Percentage
The federal government’s share of most Medicaid expenditures is established by the federal
medical assistance percentage (FMAP) rate, which generally is determined annually and varies by
state according to each state’s per capita income relative to the U.S. per capita income. The
formula provides higher FMAP rates, or federal reimbursement rates, to states with lower per
capita incomes, and it provides lower FMAP rates to states with higher per capita incomes.
FMAP rates have a statutory minimum of 50% and a statutory maximum of 83%.8 In FY2016,
FMAP rates range from 50% (13 states) to 74% (Mississippi).
The FMAP rate is used to reimburse states for the federal share of most Medicaid expenditures,
but exceptions to the regular FMAP rate have been made for certain states (e.g., the District of
Columbia and the territories), situations (e.g., during economic downturns), populations (e.g.,
certain women with breast or cervical cancer and individuals in the Qualifying Individuals
program), providers (e.g., Indian Health Service facilities), and services (e.g., family planning and
home health services). In addition, the federal share for most Medicaid administrative costs does
not vary by state and is generally 50%.
4 Andy Schneider and David Rousseau, The Medicaid Resource Book, Kaiser Commission on Medicaid and the
Uninsured, Publication Number 2236, January 17, 2003; Teresa A. Coughlin and Stephen Zuckerman, States’ Use of
Medicaid Maximization Strategies to Tap Federal Revenues: Program Implications and Consequences, The Urban
Institute, June 2002. 5 Ibid. 6 The federal Medicaid statute requires that states make disproportionate share hospital (DSH) adjustments to the
payment rates of hospitals treating large numbers of low-income and Medicaid patients. For more information about
Medicaid DSH payments, see CRS Report R42865, Medicaid Disproportionate Share Hospital Payments, by Alison
Mitchell. 7 States are required to pay Medicare Part B premiums for Medicare beneficiaries with income between 120% and
135% of the federal poverty level (FPL) and limited assets (referred to as qualifying individuals), up to a specified
dollar allotment. 8 For more detail about the federal medical assistance percentage (FMAP), see CRS Report R43847, Medicaid’s
Federal Medical Assistance Percentage (FMAP), FY2016, by Alison Mitchell.
Medicaid Financing and Expenditures
Congressional Research Service 3
The Patient Protection and Affordable Care Act
(ACA; P.L. 111-148, as amended) included a
couple of FMAP exceptions, such as the newly
eligible federal matching rates and the
expansion state federal matching rates. Under
the newly eligible federal matching rate, from
2014 through 2016, states receive a 100%
federal matching rate for the cost of individuals
who are newly eligible for Medicaid due to the
ACA expansion,9 and this newly eligible
federal matching rate phases down to 90% for
2020 and thereafter.10
The expansion state
federal matching rate is available for coverage
of individuals in expansion states11
who were
eligible for Medicaid on March 23, 2010, and
are in the new eligibility group. The expansion
state federal matching rate ranged from 72% to
92% in 2014 and varies each year until 2020,
when the matching rate will be 90% for 2020
and thereafter.
The federal share of Medicaid expenditures
used to be about 57% in a typical year, which
meant the state share was about 43%. However,
with the exceptions to the FMAP added by the
ACA, the federal share of Medicaid
expenditures has increased. In FY2014, the
federal share of Medicaid expenditures was
60% on average. It is expected to remain
around 60% through at least FY2023.12
Medicaid and the Federal Budget Process
As discussed above, Medicaid is a federal entitlement to states, and in federal-budget parlance
entitlement spending is categorized as mandatory spending, which is also referred to as direct
spending. Although most mandatory spending programs bypass the annual appropriations process
and automatically receive funding each year according to either permanent or multiyear
9 The Patient Protection and Affordable Care Act (ACA; P.L. 111-148, as amended) Medicaid expansion expands
Medicaid eligibility to most adults under the age of 65 with income up to 133% of FPL (effectively 138% of FPL with
a 5% of FPL income disregard). For more information about the ACA Medicaid expansion, see CRS Report R43564,
The ACA Medicaid Expansion, by Alison Mitchell. 10 The newly eligible FMAP rates are available for these specific years, regardless of whether a state implements the
ACA Medicaid expansion in 2014 or a later year. 11 This definition of expansion state was established prior to the Supreme Court decision making the ACA Medicaid
expansion optional for states. In this context, expansion state refers to states that already had implemented (or partially
implemented) the ACA Medicaid expansion at the time the ACA was enacted. 12 Christopher J. Truffer, Christian J. Wolfe, and Kathryn E. Rennie, 2014 Actuarial Report on the Financial Outlook
for Medicaid, Centers for Medicare & Medicaid Services' Office of the Actuary, 2015.
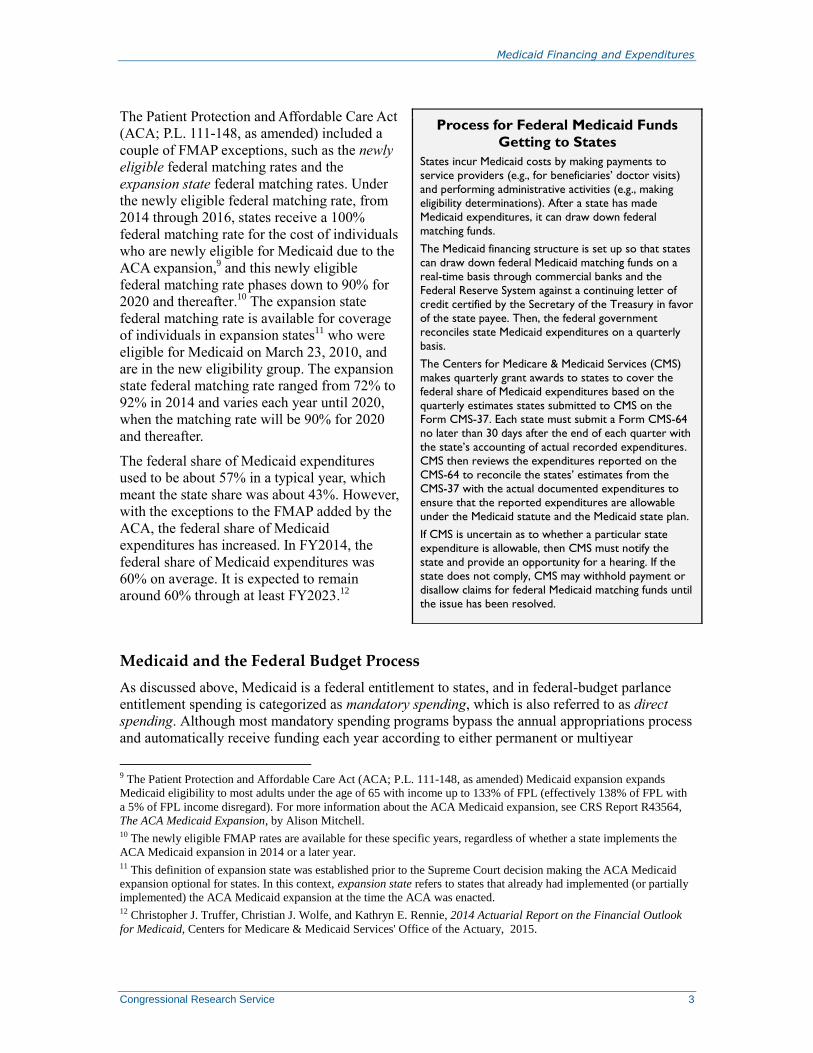
Process for Federal Medicaid Funds
Getting to States
States incur Medicaid costs by making payments to
service providers (e.g., for beneficiaries’ doctor visits)
and performing administrative activities (e.g., making
eligibility determinations). After a state has made
Medicaid expenditures, it can draw down federal
matching funds.
The Medicaid financing structure is set up so that states
can draw down federal Medicaid matching funds on a
real-time basis through commercial banks and the
Federal Reserve System against a continuing letter of
credit certified by the Secretary of the Treasury in favor
of the state payee. Then, the federal government
reconciles state Medicaid expenditures on a quarterly
basis.
The Centers for Medicare & Medicaid Services (CMS)
makes quarterly grant awards to states to cover the
federal share of Medicaid expenditures based on the
quarterly estimates states submitted to CMS on the Form CMS-37. Each state must submit a Form CMS-64
no later than 30 days after the end of each quarter with
the state’s accounting of actual recorded expenditures.
CMS then reviews the expenditures reported on the
CMS-64 to reconcile the states’ estimates from the
CMS-37 with the actual documented expenditures to
ensure that the reported expenditures are allowable
under the Medicaid statute and the Medicaid state plan.
If CMS is uncertain as to whether a particular state
expenditure is allowable, then CMS must notify the
state and provide an opportunity for a hearing. If the
state does not comply, CMS may withhold payment or
disallow claims for federal Medicaid matching funds until
the issue has been resolved.
Medicaid Financing and Expenditures
Congressional Research Service 4
appropriations in the substantive law, Medicaid is funded in the annual appropriations acts. For
this reason, Medicaid is referred to as an appropriated entitlement.13
The level of spending for appropriated entitlements, similar to other entitlements, is based on the
benefit and eligibility criteria established in law. The amount of budget authority provided in
appropriations acts for Medicaid is based on budget projections for meeting the funding needs of
the program. Although most changes to the Medicaid program are made through statute, the fact
that Medicaid is subject to the annual appropriations process provides an opportunity for
Congress to place funding limitations on specified activities in Medicaid, such as the
circumstances under which federal funds can be used to pay for abortions.
The appropriations bill usually provides Medicaid with (1) funding for the fiscal year considered
in the appropriations bill and (2) an advance appropriation for the first quarter of the following
fiscal year.14
For instance, the Consolidated and Further Continuing Appropriations Act, 2015
(P.L. 113-235), provided Medicaid with $234.6 billion for FY2015 and an advance appropriation
of $113.3 billion for the first quarter of FY2016.
State Share
The federal government provides broad guidelines to states regarding allowable funding sources
for the state share of Medicaid expenditures. However, to a large extent, states are free to
determine how to fund their share of Medicaid expenditures. As a result, there is significant
variation from state to state in funding sources.
States can use state general funds (i.e., personal-income, sales, and corporate-income taxes) and
“other state funds” (i.e., provider taxes,15
local government funds,16
tobacco settlement funds,
etc.) to finance the state share of Medicaid. Federal statute allows as much as 60% of the state
share to come from local government funding.17
Federal regulations also stipulate that the state
share not be funded with federal funds (Medicaid or otherwise).18
In state fiscal year 2013, on
average, 73% of the state share of Medicaid expenditures was financed by state general funds,
and the remaining 27% was financed by other state funds. 19
A few funding sources have received a great deal of attention over the past couple decades
because states have used these funds in financing mechanisms designed to maximize the amount
13 For more information about appropriated entitlements, see CRS Report RS20129, Entitlements and Appropriated
Entitlements in the Federal Budget Process, by Bill Heniff Jr. 14 Advance appropriations become available for obligation one or more fiscal years after the budget year covered by the
appropriations act. For more information about advance appropriations, see CRS Report R43482, Advance
Appropriations, Forward Funding, and Advance Funding: Concepts, Practice, and Budget Process Considerations, by
Jessica Tollestrup. 15 Federal statute and regulations define a provider tax as a health care-related fee, assessment, or other mandatory
payment for which at least 85% of the burden of the tax revenue falls on health care providers. For more information
about Medicaid provider taxes, see CRS Report RS22843, Medicaid Provider Taxes, by Alison Mitchell. 16 Local governments and local government providers can contribute to the state share of Medicaid payments through
intergovernmental transfers (IGTs) or certified public expenditures (CPEs). For IGTs, a local government transfers
funds to the state government to be used to finance Medicaid. When CPEs are used to fund the state share, the local
government certifies its Medicaid expenditures to the state, and then the state claims the federal Medicaid matching
funds. 17 §1902(a)(2) of the Social Security Act. 18 42 C.F.R. 433.51(c). 19 National Association of State Budget Officers, State Expenditure Report: Examining Fiscal 2012-2014 State
Spending, 2014.
Medicaid Financing and Expenditures
Congressional Research Service 5
of federal Medicaid funds coming to the state. For example, some states have used financing
mechanisms that involve the coordination of fund sources, such as provider taxes and
intergovernmental transfers, and payment policies, such as DSH and supplemental payments,20
to
draw down federal Medicaid funds without expending much, if any, state general funds.
Medicaid Expenditures21 Medicaid expenditures account for a significant and growing portion of total health expenditures
in the United States. Expansions of eligibility account for much of Medicaid’s expenditure growth
over time, and the ACA Medicaid expansion is expected to significantly increase Medicaid
expenditures over the next few years. However, Medicaid expenditures also are influenced by
economic, demographic, and programmatic factors. In addition, there is considerable variation in
Medicaid spending from state to state due to demographic differences, state policy choices,
utilization of services, and provider payment rates.
Medicaid and National Health Expenditures
In 2014, Medicaid represented 16% of national health expenditures; in that same year, private
health insurance and Medicare accounted for 33% and 20% of national health expenditures,
respectively.22
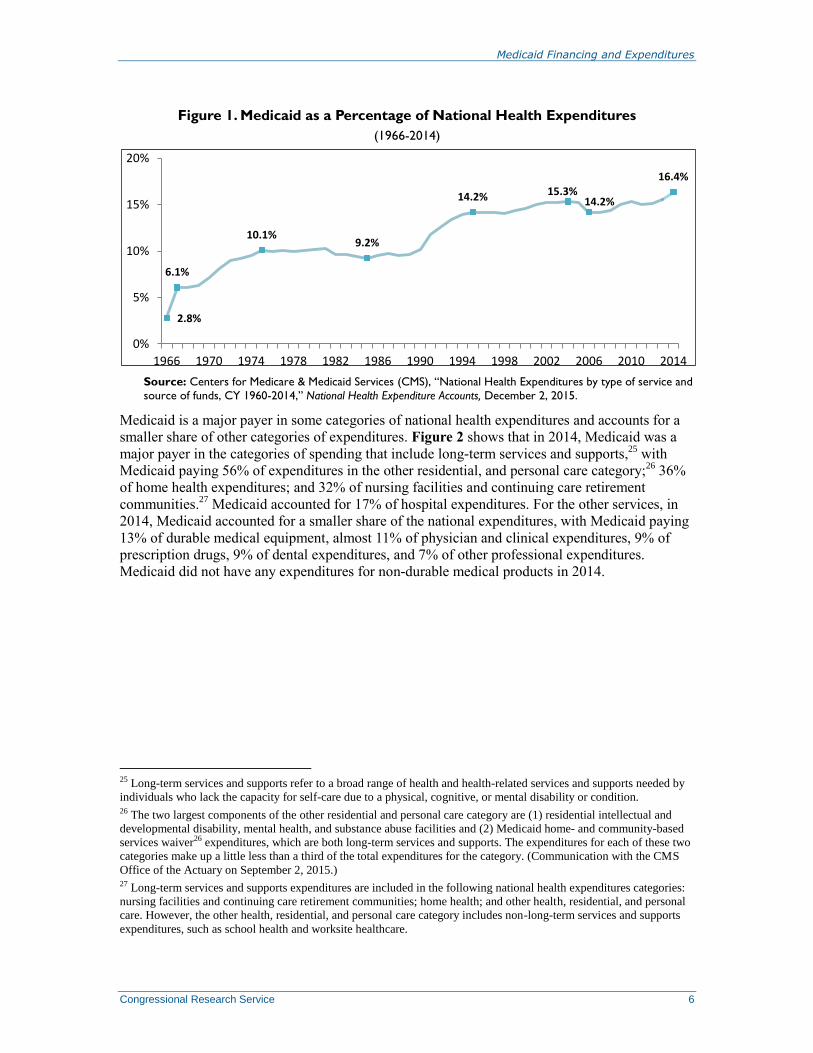
Figure 1 shows Medicaid as a percentage of national health expenditures from
1966 (the first year Medicaid was in operation) through 2014. Since the start-up years (i.e., 1966
through 1971), Medicaid expenditures have grown as a percentage of national health expenditures
with just a couple of exceptions.23
In the past, much of Medicaid’s expenditure growth has been
due to federal or state expansions of Medicaid eligibility criteria.24
Over time, Medicaid has
become one of the largest payers in the U.S. health care system.
20 Supplemental payments are Medicaid payments made to providers that are separate from and in addition to the
standard payment rates for services rendered to Medicaid enrollees. Often, providers receive supplemental payments in
a lump sum. 21 Data in this section are provided for different years (i.e., calendar year 2013, FY2013, or FY2014) because Medicaid
data are collected from states at different times for different purposes. For each type of expenditure, the most recent
data are provided. 22 CMS, “National Health Expenditures by type of service and source of funds, CY 1960-2014,” National Health
Expenditure Accounts, December 2, 2015. 23 For the years 1982 through 1984, Medicaid expenditure growth decreased due to a three-year reduction to the federal
Medicaid matching rate. In addition, Medicaid expenditures as a percentage of national health expenditures dropped
from 15% in 2005 to 14% in 2006 due to prescription drug coverage for dual-eligible beneficiaries moving from
Medicaid to Medicare Part D beginning on January 1, 2006, which resulted in a substantial reduction in Medicaid
prescription drug spending. 24 Rachel Garfield et al., Enrollment-Driven Expenditure Growth: Medicaid Spending during the Economic Downturn,
FFY2007-2010, Kaiser Commission on Medicaid and the Uninsured, Publication #8309, May 2012.
Medicaid Financing and Expenditures
Congressional Research Service 6
Figure 1. Medicaid as a Percentage of National Health Expenditures
(1966-2014)
Source: Centers for Medicare & Medicaid Services (CMS), “National Health Expenditures by type of service and
source of funds, CY 1960-2014,” National Health Expenditure Accounts, December 2, 2015.
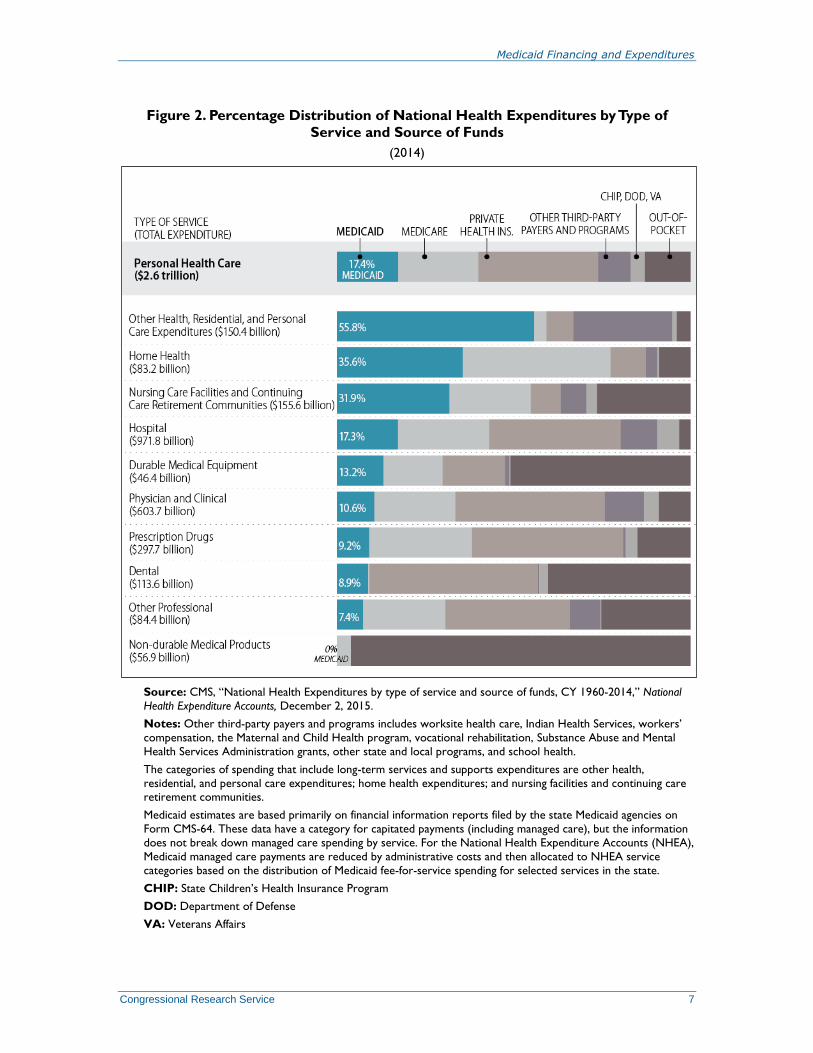
Medicaid is a major payer in some categories of national health expenditures and accounts for a
smaller share of other categories of expenditures. Figure 2 shows that in 2014, Medicaid was a
major payer in the categories of spending that include long-term services and supports,25
with
Medicaid paying 56% of expenditures in the other residential, and personal care category;26
36%
of home health expenditures; and 32% of nursing facilities and continuing care retirement
communities.27
Medicaid accounted for 17% of hospital expenditures. For the other services, in
2014, Medicaid accounted for a smaller share of the national expenditures, with Medicaid paying
13% of durable medical equipment, almost 11% of physician and clinical expenditures, 9% of
prescription drugs, 9% of dental expenditures, and 7% of other professional expenditures.
Medicaid did not have any expenditures for non-durable medical products in 2014.
25 Long-term services and supports refer to a broad range of health and health-related services and supports needed by
individuals who lack the capacity for self-care due to a physical, cognitive, or mental disability or condition. 26 The two largest components of the other residential and personal care category are (1) residential intellectual and
developmental disability, mental health, and substance abuse facilities and (2) Medicaid home- and community-based
services waiver26 expenditures, which are both long-term services and supports. The expenditures for each of these two
categories make up a little less than a third of the total expenditures for the category. (Communication with the CMS
Office of the Actuary on September 2, 2015.) 27 Long-term services and supports expenditures are included in the following national health expenditures categories:
nursing facilities and continuing care retirement communities; home health; and other health, residential, and personal
care. However, the other health, residential, and personal care category includes non-long-term services and supports
expenditures, such as school health and worksite healthcare.
2.8%
6.1%
10.1%9.2%
14.2% 15.3%14.2%
16.4%
0%
5%
10%
15%
20%
1966 1970 1974 1978 1982 1986 1990 1994 1998 2002 2006 2010 2014
Medicaid Financing and Expenditures
Congressional Research Service 7
Figure 2. Percentage Distribution of National Health Expenditures by Type of
Service and Source of Funds
(2014)
Source: CMS, “National Health Expenditures by type of service and source of funds, CY 1960-2014,” National
Health Expenditure Accounts, December 2, 2015.
Notes: Other third-party payers and programs includes worksite health care, Indian Health Services, workers’
compensation, the Maternal and Child Health program, vocational rehabilitation, Substance Abuse and Mental
Health Services Administration grants, other state and local programs, and school health.
The categories of spending that include long-term services and supports expenditures are other health,
residential, and personal care expenditures; home health expenditures; and nursing facilities and continuing care retirement communities.
Medicaid estimates are based primarily on financial information reports filed by the state Medicaid agencies on
Form CMS-64. These data have a category for capitated payments (including managed care), but the information
does not break down managed care spending by service. For the National Health Expenditure Accounts (NHEA),
Medicaid managed care payments are reduced by administrative costs and then allocated to NHEA service
categories based on the distribution of Medicaid fee-for-service spending for selected services in the state.
CHIP: State Children’s Health Insurance Program
DOD: Department of Defense
VA: Veterans Affairs
Medicaid Financing and Expenditures
Congressional Research Service 8
Trend in Medicaid Expenditures
Over time, much of Medicaid’s expenditure growth has been due to federal or state expansions of
Medicaid eligibility criteria, and the ACA Medicaid expansion is expected to significantly
increase Medicaid expenditures over the next few years.28
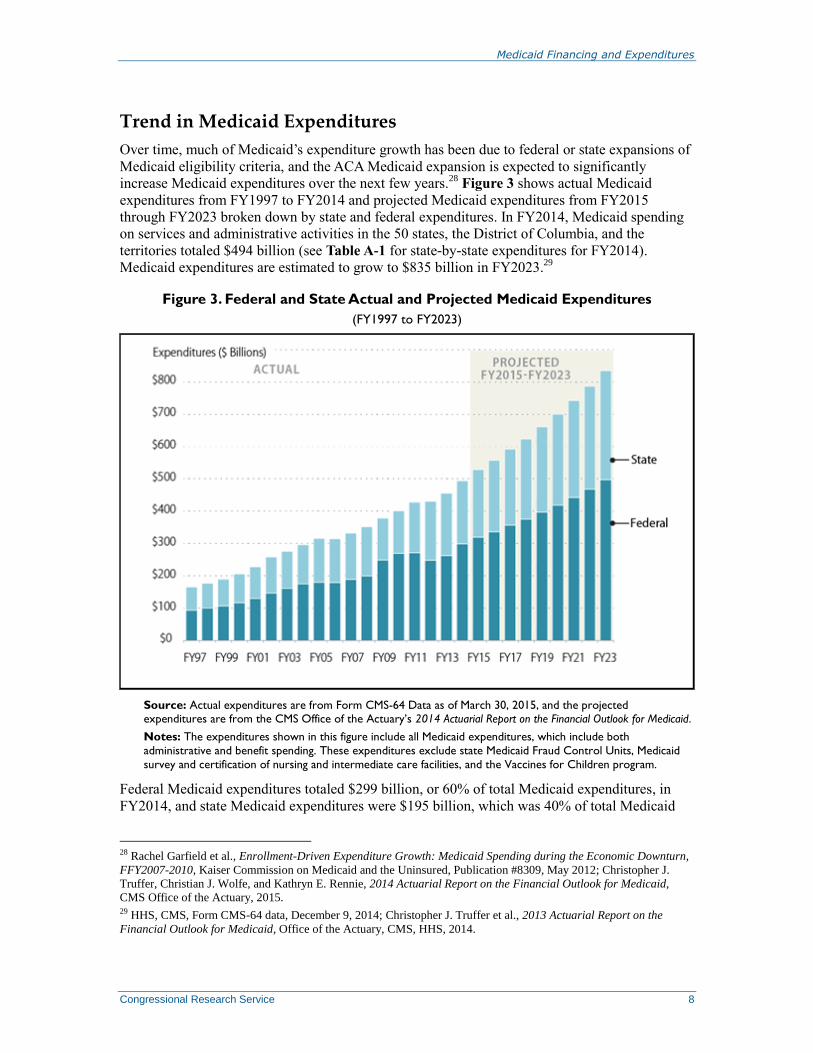
Figure 3 shows actual Medicaid
expenditures from FY1997 to FY2014 and projected Medicaid expenditures from FY2015
through FY2023 broken down by state and federal expenditures. In FY2014, Medicaid spending
on services and administrative activities in the 50 states, the District of Columbia, and the
territories totaled $494 billion (see Table A-1 for state-by-state expenditures for FY2014).
Medicaid expenditures are estimated to grow to $835 billion in FY2023.29
Figure 3. Federal and State Actual and Projected Medicaid Expenditures
(FY1997 to FY2023)
Source: Actual expenditures are from Form CMS-64 Data as of March 30, 2015, and the projected expenditures are from the CMS Office of the Actuary’s 2014 Actuarial Report on the Financial Outlook for Medicaid.
Notes: The expenditures shown in this figure include all Medicaid expenditures, which include both
administrative and benefit spending. These expenditures exclude state Medicaid Fraud Control Units, Medicaid
survey and certification of nursing and intermediate care facilities, and the Vaccines for Children program.
Federal Medicaid expenditures totaled $299 billion, or 60% of total Medicaid expenditures, in
FY2014, and state Medicaid expenditures were $195 billion, which was 40% of total Medicaid
28 Rachel Garfield et al., Enrollment-Driven Expenditure Growth: Medicaid Spending during the Economic Downturn,
FFY2007-2010, Kaiser Commission on Medicaid and the Uninsured, Publication #8309, May 2012; Christopher J.
Truffer, Christian J. Wolfe, and Kathryn E. Rennie, 2014 Actuarial Report on the Financial Outlook for Medicaid,
CMS Office of the Actuary, 2015. 29 HHS, CMS, Form CMS-64 data, December 9, 2014; Christopher J. Truffer et al., 2013 Actuarial Report on the
Financial Outlook for Medicaid, Office of the Actuary, CMS, HHS, 2014.
Medicaid Financing and Expenditures
Congressional Research Service 9
spending.30
From FY2013 to FY2014, federal Medicaid expenditures grew by almost 14%
whereas state Medicaid expenditures grew by only 1% due to the enhanced federal matching rates
for the ACA Medicaid expansion (discussed in the “The Federal Medical Assistance Percentage”
section).31
Medicaid expenditures resulting from the ACA Medicaid expansion are projected to be
$457 billion from FY2014 to FY2023, with the federal government paying about 93% of this
amount.
Medicaid Expenditures by Service Type
Most Medicaid expenditures (i.e., 95% in FY2014) are for medical assistance (or
nonadministrative) payments. In FY2014, Medicaid spending on medical assistance grew by an
estimated 9.5%, which is significant relative to the annual percentage increases for FY2012 and
FY2013—0.2% and 6.0%, respectively. The ACA Medicaid expansion was the main reason for
the large increase in Medicaid spending, but the woodwork effect32
also contributed to the
increase.33
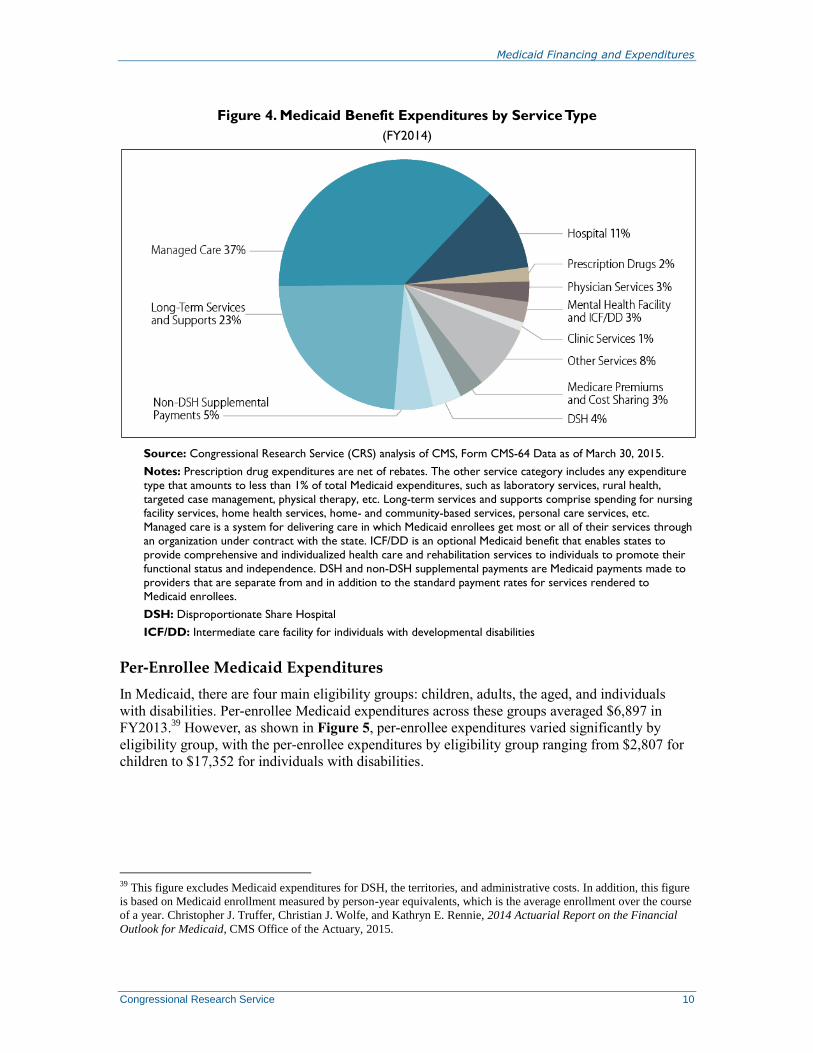
Figure 4 shows medical assistance payments by service type for FY2014. Managed care, which
includes payments to managed care organizations,34
primary care case management,35
and non-
comprehensive prepaid health plans,36
accounted for 37% of Medicaid expenditures. Long-term
services and supports, which include nursing facility care and home- and community-based
services, made up 23% of all Medicaid expenditures.37
Hospitals received 11% of total Medicaid
expenditures in return for services provided to Medicaid fee-for-service enrollees at the payment
rates set by states.38
30 CMS, Form CMS-64 data as of March 30, 2015. 31 CRS analysis of CMS, Form CMS-64 Data from FY2013 and FY2014 as of March 30, 2015; Christopher J. Truffer,
Christian J. Wolfe, and Kathryn E. Rennie, 2014 Actuarial Report on the Financial Outlook for Medicaid, CMS Office
of the Actuary, 2015. 32 The woodwork effect is the term for uninsured individuals who are eligible for Medicaid without the expansion but
who decide to enroll in Medicaid due to increased media attention and outreach efforts associated with the ACA. 33 Christopher J. Truffer, Christian J. Wolfe, and Kathryn E. Rennie, 2014 Actuarial Report on the Financial Outlook
for Medicaid, CMS Office of the Actuary, 2015. 34 States contract with managed care organizations to provide a comprehensive package of benefits to enrolled
Medicaid beneficiaries, primarily on a capitated basis (i.e., a set amount per enrollee regardless of the services utilized). 35 Under primary care case management, states contract with primary care physicians to provide case management
services to Medicaid enrollees. For these enrollees, other services generally are provided on a fee-for-service basis. 36 States contract with health plans to provide non-comprehensive benefits (e.g., inpatient behavioral health care or
dental care). 37 For more information about long-term services and supports, see CRS Report R43328, Medicaid Coverage of Long-
Term Services and Supports, by Kirsten J. Colello. 38 Hospitals also receive a significant portion of both the Medicaid DSH funding and the supplemental payments.
Medicaid Financing and Expenditures
Congressional Research Service 10
Figure 4. Medicaid Benefit Expenditures by Service Type
(FY2014)
Source: Congressional Research Service (CRS) analysis of CMS, Form CMS-64 Data as of March 30, 2015.
Notes: Prescription drug expenditures are net of rebates. The other service category includes any expenditure
type that amounts to less than 1% of total Medicaid expenditures, such as laboratory services, rural health,
targeted case management, physical therapy, etc. Long-term services and supports comprise spending for nursing
facility services, home health services, home- and community-based services, personal care services, etc.
Managed care is a system for delivering care in which Medicaid enrollees get most or all of their services through
an organization under contract with the state. ICF/DD is an optional Medicaid benefit that enables states to
provide comprehensive and individualized health care and rehabilitation services to individuals to promote their
functional status and independence. DSH and non-DSH supplemental payments are Medicaid payments made to
providers that are separate from and in addition to the standard payment rates for services rendered to
Medicaid enrollees.
DSH: Disproportionate Share Hospital
ICF/DD: Intermediate care facility for individuals with developmental disabilities
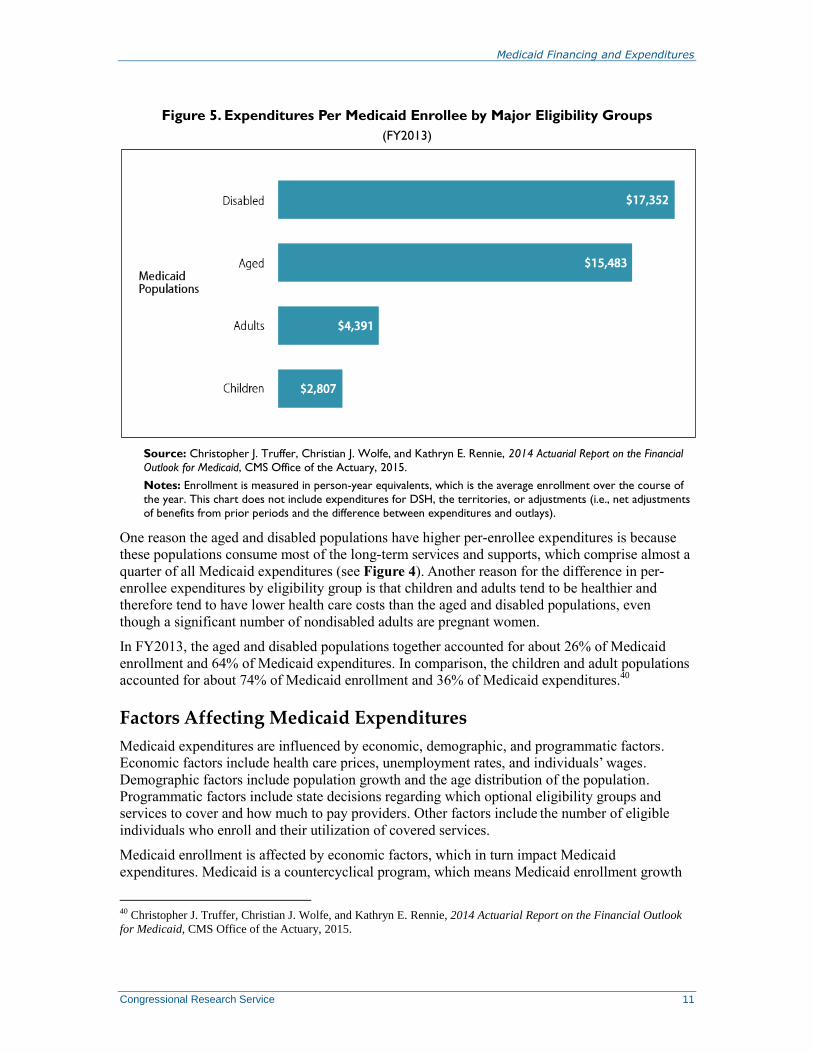
Per-Enrollee Medicaid Expenditures
In Medicaid, there are four main eligibility groups: children, adults, the aged, and individuals
with disabilities. Per-enrollee Medicaid expenditures across these groups averaged $6,897 in
FY2013.39
However, as shown in Figure 5, per-enrollee expenditures varied significantly by
eligibility group, with the per-enrollee expenditures by eligibility group ranging from $2,807 for
children to $17,352 for individuals with disabilities.
39 This figure excludes Medicaid expenditures for DSH, the territories, and administrative costs. In addition, this figure
is based on Medicaid enrollment measured by person-year equivalents, which is the average enrollment over the course
of a year. Christopher J. Truffer, Christian J. Wolfe, and Kathryn E. Rennie, 2014 Actuarial Report on the Financial
Outlook for Medicaid, CMS Office of the Actuary, 2015.
Medicaid Financing and Expenditures
Congressional Research Service 11
Figure 5. Expenditures Per Medicaid Enrollee by Major Eligibility Groups
(FY2013)
Source: Christopher J. Truffer, Christian J. Wolfe, and Kathryn E. Rennie, 2014 Actuarial Report on the Financial
Outlook for Medicaid, CMS Office of the Actuary, 2015.
Notes: Enrollment is measured in person-year equivalents, which is the average enrollment over the course of
the year. This chart does not include expenditures for DSH, the territories, or adjustments (i.e., net adjustments
of benefits from prior periods and the difference between expenditures and outlays).
One reason the aged and disabled populations have higher per-enrollee expenditures is because
these populations consume most of the long-term services and supports, which comprise almost a
quarter of all Medicaid expenditures (see Figure 4). Another reason for the difference in per-
enrollee expenditures by eligibility group is that children and adults tend to be healthier and
therefore tend to have lower health care costs than the aged and disabled populations, even
though a significant number of nondisabled adults are pregnant women.
In FY2013, the aged and disabled populations together accounted for about 26% of Medicaid
enrollment and 64% of Medicaid expenditures. In comparison, the children and adult populations
accounted for about 74% of Medicaid enrollment and 36% of Medicaid expenditures.40
Factors Affecting Medicaid Expenditures
Medicaid expenditures are influenced by economic, demographic, and programmatic factors.
Economic factors include health care prices, unemployment rates, and individuals’ wages.
Demographic factors include population growth and the age distribution of the population.
Programmatic factors include state decisions regarding which optional eligibility groups and
services to cover and how much to pay providers. Other factors include the number of eligible
individuals who enroll and their utilization of covered services.
Medicaid enrollment is affected by economic factors, which in turn impact Medicaid
expenditures. Medicaid is a countercyclical program, which means Medicaid enrollment growth
40 Christopher J. Truffer, Christian J. Wolfe, and Kathryn E. Rennie, 2014 Actuarial Report on the Financial Outlook
for Medicaid, CMS Office of the Actuary, 2015.
Medicaid Financing and Expenditures
Congressional Research Service 12
tends to accelerate when the economy weakens and tends to slow when the economy gains
strength. During the most recent recession, researchers estimated that for every 1% increase in the
national unemployment rate, Medicaid enrollment increased by 1 million individuals.41
People
become eligible for Medicaid during economic downturns because they lose their jobs,
experience reductions in income, or lose access to health benefits.42
State Variability in Medicaid Spending
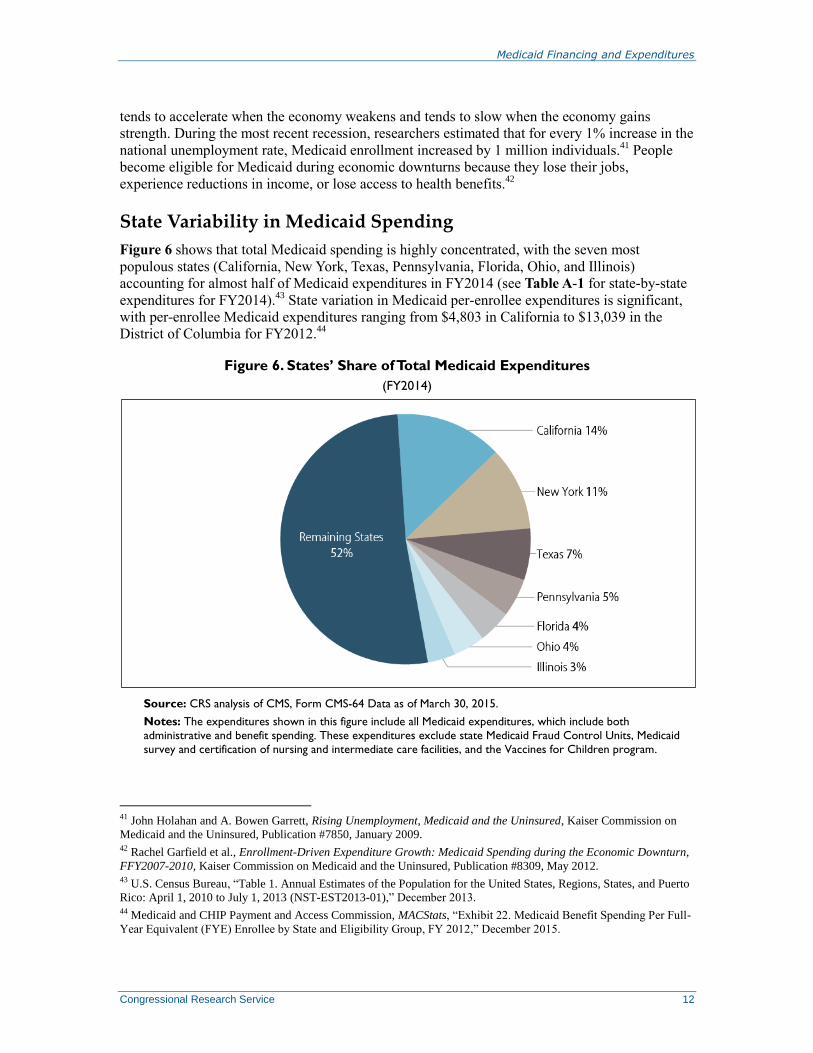
Figure 6 shows that total Medicaid spending is highly concentrated, with the seven most
populous states (California, New York, Texas, Pennsylvania, Florida, Ohio, and Illinois)
accounting for almost half of Medicaid expenditures in FY2014 (see Table A-1 for state-by-state
expenditures for FY2014).43
State variation in Medicaid per-enrollee expenditures is significant,
with per-enrollee Medicaid expenditures ranging from $4,803 in California to $13,039 in the
District of Columbia for FY2012.44
Figure 6. States’ Share of Total Medicaid Expenditures
(FY2014)
Source: CRS analysis of CMS, Form CMS-64 Data as of March 30, 2015.
Notes: The expenditures shown in this figure include all Medicaid expenditures, which include both
administrative and benefit spending. These expenditures exclude state Medicaid Fraud Control Units, Medicaid
survey and certification of nursing and intermediate care facilities, and the Vaccines for Children program.
41 John Holahan and A. Bowen Garrett, Rising Unemployment, Medicaid and the Uninsured, Kaiser Commission on
Medicaid and the Uninsured, Publication #7850, January 2009. 42 Rachel Garfield et al., Enrollment-Driven Expenditure Growth: Medicaid Spending during the Economic Downturn,
FFY2007-2010, Kaiser Commission on Medicaid and the Uninsured, Publication #8309, May 2012. 43 U.S. Census Bureau, “Table 1. Annual Estimates of the Population for the United States, Regions, States, and Puerto
Rico: April 1, 2010 to July 1, 2013 (NST-EST2013-01),” December 2013. 44 Medicaid and CHIP Payment and Access Commission, MACStats, “Exhibit 22. Medicaid Benefit Spending Per Full-
Year Equivalent (FYE) Enrollee by State and Eligibility Group, FY 2012,” December 2015.
Medicaid Financing and Expenditures
Congressional Research Service 13
Some of the state variation in Medicaid per-enrollee expenditures is due to demographic
differences across states. For instance, states with lower-than-average proportions of elderly and
disabled Medicaid enrollees and higher-than-average proportions of Medicaid enrollees who are
children and adults would be expected to have lower-than-average per-enrollee Medicaid
expenditures.45
However, state policy choices regarding optional populations and services cause
variation in Medicaid spending. Other reasons for state variation in Medicaid per-enrollee
expenditures include variation in utilization and provider payment rates.46
Conclusion Medicaid is the largest source of general revenue-based spending on health services (even when
compared to Medicare) because a sizable portion of Medicare spending is funded by a dedicated
revenue source. Medicaid constitutes a significant portion of the federal budget, and federal
Medicaid expenditures are expected to increase significantly over the next ten years due to the
ACA Medicaid expansion. As a result, Medicaid could be a focus of potential deficit reduction or
other legislative proposals affecting the federal budget.
Both the House and Senate FY2016 budget resolutions included proposals to reform Medicaid
financing. The House Budget Resolution for FY2016 (H.Con.Res. 27) and its resolutions for the
previous four years have included converting Medicaid to a block grant47
as an illustrative
example for achieving budget savings. The FY2016 Senate Budget Resolution (S.Con.Res. 11)
proposes to convert Medicaid for the “low-income, working-age, able-bodied adults” and
children to a capped allotment48
like CHIP.49
Also, in February 2015, Senators Richard Burr and
Orrin Hatch along with Representative Fred Upton released the Patient Choice, Affordability,
Responsibility, and Empowerment (CARE) Act, which is a policy proposal that would convert
Medicaid to a capped allotment.50
45 Todd P. Gilmer and Richard G. Kronick, “Differences in the Volume of Services and in Prices Drive Big Variation
in Medicaid Spending Among U.S. States and Regions,” Health Affairs, vol. 30, no. 7 (July 2011). 46 Ibid. 47 Block grants are a form of grant-in-aid that the federal government uses to provide state and local governments a
specified amount of funding to assist them in addressing broad purposes, such as community development, social
services, public health, or law enforcement. For additional information on block grants, see CRS Report R40486, Block
Grants: Perspectives and Controversies, by Robert Jay Dilger and Eugene Boyd, or Congressional Budget Office,
Options for Reducing the Deficit: 2014 to 2023, November 13, 2013, Mandatory Spending Function 550 – Health
Option 1: Impose Caps on Federal Spending for Medicaid. 48 There is no agreed-upon definition for capped allotment, but it seems as though the terms block grant and capped
allotment are being used somewhat interchangeably. 49 Senator Mike Enzi, “A Balanced Budget That Supports Economic Growth And Expands Opportunity for
Hardworking Families,” March 17, 2015, at
http://www.budget.senate.gov/republican/public/index.cfm?a=Files.Serve&File_id=81b01032-186d-4166-b21b-
8035b89853d9. 50 Energy & Commerce Committee, “Burr, Hatch, Upton Unveil Obamacare Replacement Plan,” February 5, 2015, at
http://energycommerce.house.gov/press-release/burr-hatch-upton-unveil-obamacare-replacement-plan.
Medicaid Financing and Expenditures
Congressional Research Service 14
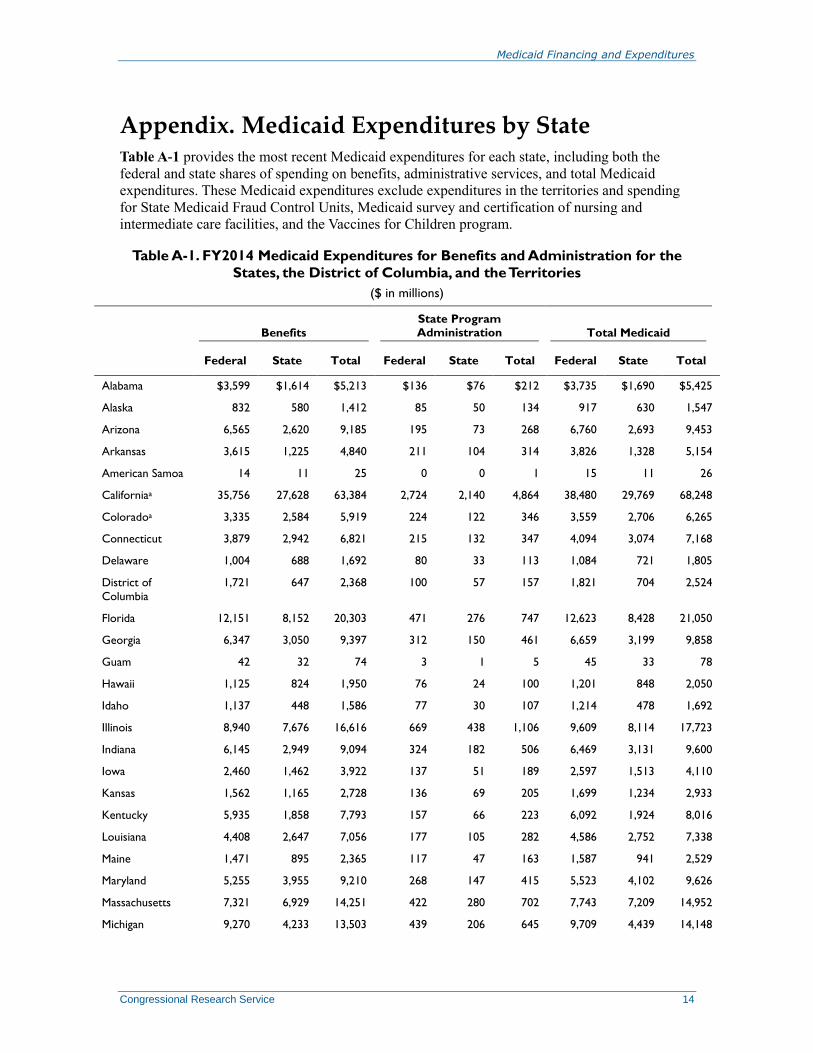
Appendix. Medicaid Expenditures by State Table A-1 provides the most recent Medicaid expenditures for each state, including both the
federal and state shares of spending on benefits, administrative services, and total Medicaid
expenditures. These Medicaid expenditures exclude expenditures in the territories and spending
for State Medicaid Fraud Control Units, Medicaid survey and certification of nursing and
intermediate care facilities, and the Vaccines for Children program.
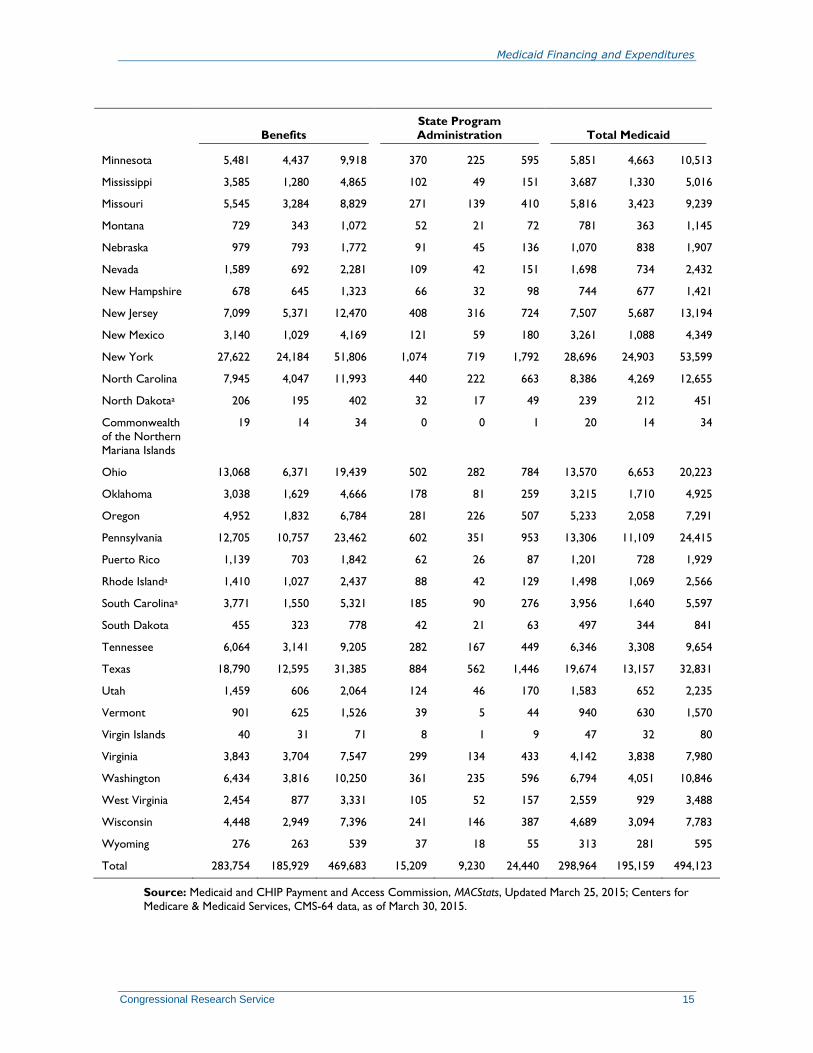
Table A-1. FY2014 Medicaid Expenditures for Benefits and Administration for the
States, the District of Columbia, and the Territories
($ in millions)
Benefits
State Program Administration Total Medicaid
Federal State Total Federal State Total Federal State Total
Alabama $3,599 $1,614 $5,213 $136 $76 $212 $3,735 $1,690 $5,425
Alaska 832 580 1,412 85 50 134 917 630 1,547
Arizona 6,565 2,620 9,185 195 73 268 6,760 2,693 9,453
Arkansas 3,615 1,225 4,840 211 104 314 3,826 1,328 5,154
American Samoa 14 11 25 0 0 1 15 11 26
Californiaa 35,756 27,628 63,384 2,724 2,140 4,864 38,480 29,769 68,248
Coloradoa 3,335 2,584 5,919 224 122 346 3,559 2,706 6,265
Connecticut 3,879 2,942 6,821 215 132 347 4,094 3,074 7,168
Delaware 1,004 688 1,692 80 33 113 1,084 721 1,805
District of
Columbia
1,721 647 2,368 100 57 157 1,821 704 2,524
Florida 12,151 8,152 20,303 471 276 747 12,623 8,428 21,050
Georgia 6,347 3,050 9,397 312 150 461 6,659 3,199 9,858
Guam 42 32 74 3 1 5 45 33 78
Hawaii 1,125 824 1,950 76 24 100 1,201 848 2,050
Idaho 1,137 448 1,586 77 30 107 1,214 478 1,692
Illinois 8,940 7,676 16,616 669 438 1,106 9,609 8,114 17,723
Indiana 6,145 2,949 9,094 324 182 506 6,469 3,131 9,600
Iowa 2,460 1,462 3,922 137 51 189 2,597 1,513 4,110
Kansas 1,562 1,165 2,728 136 69 205 1,699 1,234 2,933
Kentucky 5,935 1,858 7,793 157 66 223 6,092 1,924 8,016
Louisiana 4,408 2,647 7,056 177 105 282 4,586 2,752 7,338
Maine 1,471 895 2,365 117 47 163 1,587 941 2,529
Maryland 5,255 3,955 9,210 268 147 415 5,523 4,102 9,626
Massachusetts 7,321 6,929 14,251 422 280 702 7,743 7,209 14,952
Michigan 9,270 4,233 13,503 439 206 645 9,709 4,439 14,148
Medicaid Financing and Expenditures
Congressional Research Service 15
Benefits
State Program
Administration Total Medicaid
Minnesota 5,481 4,437 9,918 370 225 595 5,851 4,663 10,513
Mississippi 3,585 1,280 4,865 102 49 151 3,687 1,330 5,016
Missouri 5,545 3,284 8,829 271 139 410 5,816 3,423 9,239
Montana 729 343 1,072 52 21 72 781 363 1,145
Nebraska 979 793 1,772 91 45 136 1,070 838 1,907
Nevada 1,589 692 2,281 109 42 151 1,698 734 2,432
New Hampshire 678 645 1,323 66 32 98 744 677 1,421
New Jersey 7,099 5,371 12,470 408 316 724 7,507 5,687 13,194
New Mexico 3,140 1,029 4,169 121 59 180 3,261 1,088 4,349
New York 27,622 24,184 51,806 1,074 719 1,792 28,696 24,903 53,599
North Carolina 7,945 4,047 11,993 440 222 663 8,386 4,269 12,655
North Dakotaa 206 195 402 32 17 49 239 212 451
Commonwealth
of the Northern
Mariana Islands
19 14 34 0 0 1 20 14 34
Ohio 13,068 6,371 19,439 502 282 784 13,570 6,653 20,223
Oklahoma 3,038 1,629 4,666 178 81 259 3,215 1,710 4,925
Oregon 4,952 1,832 6,784 281 226 507 5,233 2,058 7,291
Pennsylvania 12,705 10,757 23,462 602 351 953 13,306 11,109 24,415
Puerto Rico 1,139 703 1,842 62 26 87 1,201 728 1,929
Rhode Islanda 1,410 1,027 2,437 88 42 129 1,498 1,069 2,566
South Carolinaa 3,771 1,550 5,321 185 90 276 3,956 1,640 5,597
South Dakota 455 323 778 42 21 63 497 344 841
Tennessee 6,064 3,141 9,205 282 167 449 6,346 3,308 9,654
Texas 18,790 12,595 31,385 884 562 1,446 19,674 13,157 32,831
Utah 1,459 606 2,064 124 46 170 1,583 652 2,235
Vermont 901 625 1,526 39 5 44 940 630 1,570
Virgin Islands 40 31 71 8 1 9 47 32 80
Virginia 3,843 3,704 7,547 299 134 433 4,142 3,838 7,980
Washington 6,434 3,816 10,250 361 235 596 6,794 4,051 10,846
West Virginia 2,454 877 3,331 105 52 157 2,559 929 3,488
Wisconsin 4,448 2,949 7,396 241 146 387 4,689 3,094 7,783
Wyoming 276 263 539 37 18 55 313 281 595
Total 283,754 185,929 469,683 15,209 9,230 24,440 298,964 195,159 494,123
Source: Medicaid and CHIP Payment and Access Commission, MACStats, Updated March 25, 2015; Centers for
Medicare & Medicaid Services, CMS-64 data, as of March 30, 2015.
Medicaid Financing and Expenditures
Congressional Research Service 16
Notes: May not sum to totals due to rounding.
a. Not all states had certified their CMS-64 Financial Management Report submissions as of February 25, 2015.
California’s and Colorado’s 2nd, 3rd, and 4th quarter submissions are not certified; North Dakota’s 3rd and 4th
quarter submissions are not certified; South Carolina’s 2nd quarter submission is not certified; Rhode
Island’s 4th quarter submission is not certified. Figures presented in this table may change if states revise
their expenditure data after this date.
Author Contact Information
Alison Mitchell
Analyst in Health Care Financing
[email protected], 7-0152