medco health solutions 2005 annual report
TRANSCRIPT

Back Cover Front Cover
2005 Annual Report
More than pillsMore than prescriptionsMore than a pharmacy
More than you think ...Medco Health Solutions, Inc.
AR 05
2005 AN
NU
AL REPO
RT MED
CO H
EALTH
SOLU
TION
S, INC.
© 2006 Medco Health Solutions, Inc. All rights reserved.®
2. | Medco Health Solutions, Inc.
From the time we first linked our technology, tools, pharmacy network, and know-how to pioneer the Pharmacy Benefit Management (PBM) industry in 1985, we have dedicated ourselves to the relentless pursuit of more. Today, in an era when rising healthcare costs are challenging consumers, employers, health plans, labor unions, and government entities of all sizes to make tough decisions, more means delivering innovative prescription drug benefit programs that help drive down the cost of pharmacy care.
Medco Health Solutions, Inc. | 01.
More means that Medco balances cost and care — without compromise — using technologically advanced mail-order pharmacies, advanced clinical review pharmacies, expansive retail networks, effective generics programs, and the nation’s largest specialty pharmacy. And more means that Medco, as one of only 10 Prescription Drug Plans (PDPs) approved to serve Medicare-eligible consumers nationwide, steps up to the challenge and opportunity linked to the most significant change in healthcare since the Medicare law was first enacted in 1965.
Our country, our clients, our clients’ members, and our employees demand more.
So Medco delivers more.
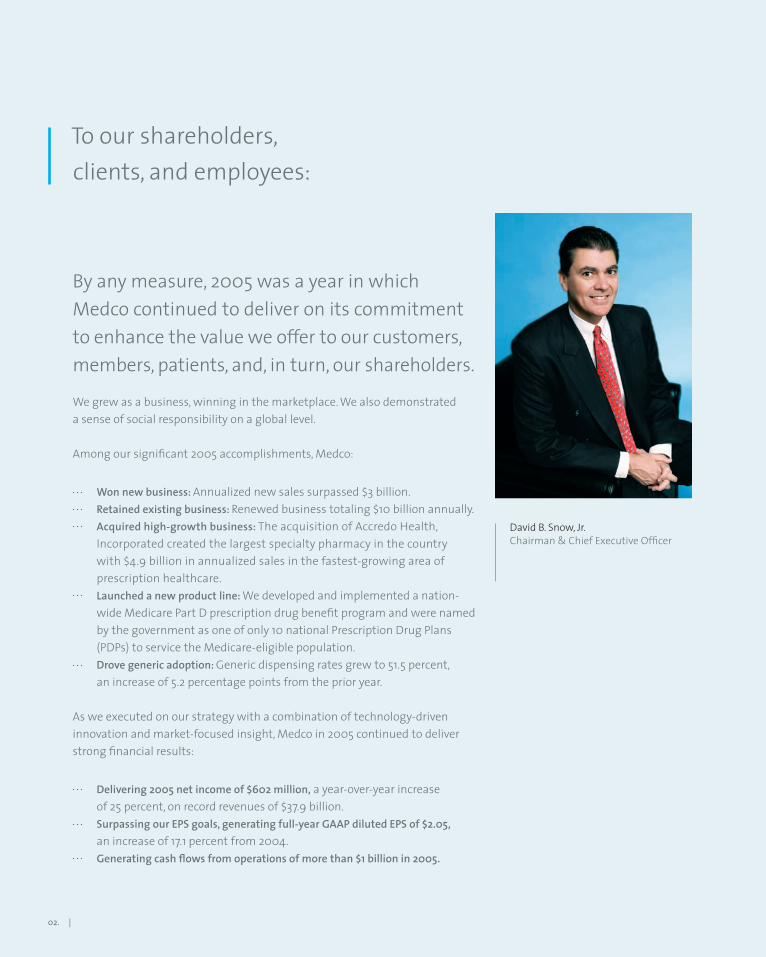
To our shareholders, clients, and employees:
By any measure, 2005 was a year in which Medco continued to deliver on its commitment to enhance the value we offer to our customers, members, patients, and, in turn, our shareholders.
We grew as a business, winning in the marketplace. We also demonstrated a sense of social responsibility on a global level.
Among our significant 2005 accomplishments, Medco:
Won new business: Annualized new sales surpassed $3 billion. Retained existing business: Renewed business totaling $10 billion annually. Acquired high-growth business: The acquisition of Accredo Health,
Incorporated created the largest specialty pharmacy in the country with $4.9 billion in annualized sales in the fastest-growing area of prescription healthcare.
Launched a new product line: We developed and implemented a nation-wide Medicare Part D prescription drug benefit program and were named by the government as one of only 10 national Prescription Drug Plans (PDPs) to service the Medicare-eligible population.
Drove generic adoption: Generic dispensing rates grew to 51.5 percent, an increase of 5.2 percentage points from the prior year.
As we executed on our strategy with a combination of technology-driven innovation and market-focused insight, Medco in 2005 continued to deliver strong financial results:
Delivering 2005 net income of $602 million, a year-over-year increase of 25 percent, on record revenues of $37.9 billion.
Surpassing our EPS goals, generating full-year GAAP diluted EPS of $2.05, an increase of 17.1 percent from 2004.
Generating cash flows from operations of more than $1 billion in 2005.
David B. Snow, Jr. Chairman & Chief Executive Officer
02. |
Medco Health Solutions, Inc. | 03.
Increasing shareholder value, ending the year with stock appreciation of 34.1 percent — a return of 134 percent since the company was taken public in August 2003. Medco market capitalization grew 48.6 percent, to $17.0 billion, up from $11.4 billion at year-end 2004.
Medco’s strong financial performance provided the flexibility to respond to a marketplace that is dynamic and competitive, as well as the wherewithal to return value to our shareholders through our share repurchase program. In August we implemented an initial $500 million stock repurchase program, with an incremental $1 billion approved in December. By year-end we had repurchased 7.7 million shares at an approximate total cost of $407 million.
Winning in the marketplaceWhen clients choose Medco, it’s more than just good business — it’s personal. We work with clients to lower costs and raise the standards for quality prescription healthcare. It’s the basis for a lasting relationship. In addition to the new business we won in 2005, we accelerated our momentum, entering the 2006 sales year with an additional $2.7 billion in annualized new business to date, placing the company in a net-new sales position of $700 million, to date, for 2006. We achieved these business results by developing a corporate culture that maintains an uncompromising focus on our clients and members. Ranked No. 48 in the Fortune 500, Medco in 2005 achieved standing as one of Fortune magazine’s Most Admired companies, and received the highest ranking of any pharmacy benefit manager. In 2005 we were rated No. 1 for a fifth straight year in the competitive WilsonRx Pharmacy Survey of customer satisfaction — a distinction that no competitor in our industry has ever attained.
An affordable, accessible pharmacy benefit for all AmericansAmerica’s gold standard of pharmacy care must be both affordable and accessible. Medco continues to invest in programs and services that are designed to ensure that high-quality care is available to larger numbers of people — by extending care to new, uncovered populations; encouraging the use of lower-cost therapies made available through more efficient channels; and leveraging technology systems to empower clients and members with information that enables informed healthcare decisions — frequently referred to as consumer-driven products. The development, positioning, and implementation of a Medicare products suite was a highlight in our series of 2005 accomplishments. Medco’s PDP, YOURx PLAN™, was one of only 10 nationwide plans approved by the Centers for Medicare and Medicaid Services (CMS). Medco was also selected to serve individuals automatically assigned to the program by the government in 19 out of 34 national CMS Medicare Part D regions.
$31 billionin client renewals over the past 2 years. This unprecedented amount of renewals allows us more focus on winning new business and developing new solutions for our clients.
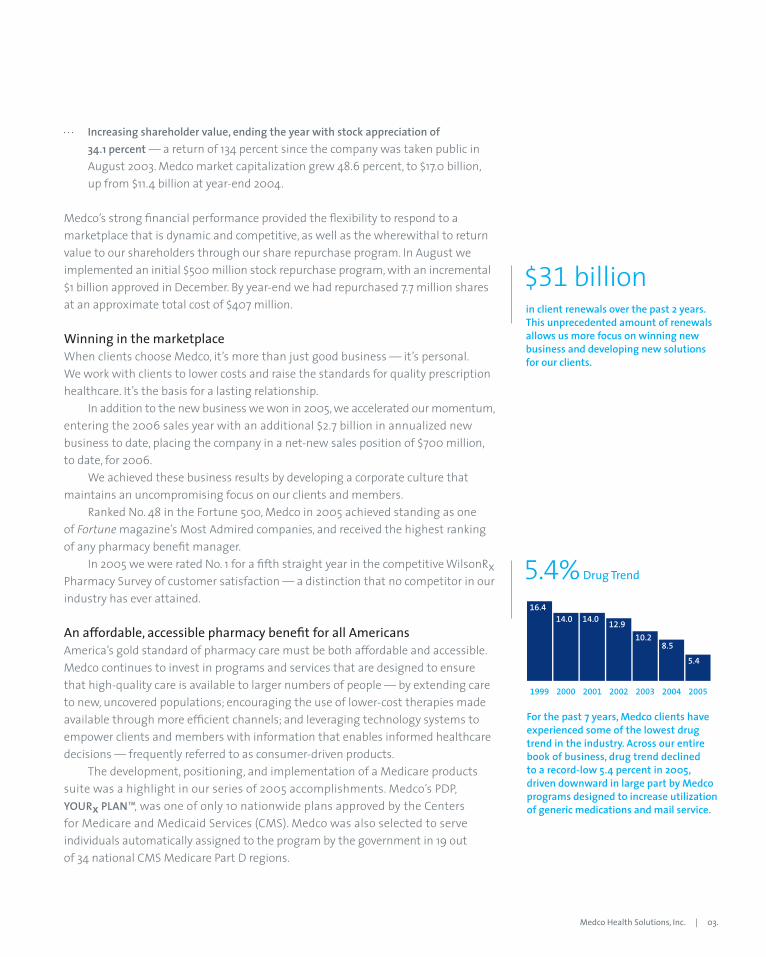
5.4% Drug Trend
For the past 7 years, Medco clients have experienced some of the lowest drug trend in the industry. Across our entire book of business, drug trend declined to a record-low 5.4 percent in 2005, driven downward in large part by Medco programs designed to increase utilization of generic medications and mail service.
2005 2004 2003 2002 2001 2000 1999
5.4
8.5
10.2
12.9 14.0 14.0
16.4
04. | Medco Health Solutions, Inc.
Response to Medco’s Medicare products has been exceptional — we retained 95 percent of the retirees enrolled through our pre-existing employer business and are on target with our initial enrollment expectations of 250,000 to 270,000 mem-bers by adding nearly 240,000 new YOURx PLAN members to date. In addition, more than 10 of our health plan clients elected to use Medco as the “PBM inside” of their plan. Medco estimates that the drug spend from these clients along with Medco’s YOURx PLAN will represent more than 9 percent of the projected $124 billion in over-all 2006 drug spend for U.S. Medicare-eligible retirees. As our clients increasingly provided incentives for their members to become more actively involved in economically advantaged choices, Medco’s generic dis-pensing rate increased 5.2 points to 51.5 percent in 2005. Medco is already one of the nation’s largest purchasers of generic medicines, and the increasing acceptance of generics reinforces our foundation for delivering even greater future savings as a new wave of generics hits the market — $46 billion over the next 5 years. Generics, combined with increasing use of our advanced mail-order pharmacy services, provide a convergence of interests that delivers significant cost reduction for our clients, high-quality therapy and service for members, and greater profitability for Medco. In 2005 Medco dispensed 87.3 million prescriptions through its mail-order pharmacies compared to 87.7 million in the prior year, representing a 12.6 percent increase when excluding the 10.2 million prescriptions associated with the Federal Employee Health Benefits Plan contract that expired in December 2004. As a result, drug trend — the rate at which prescription drug spend grows each year — dropped from 8.5 percent in 2004 to 5.4 percent in 2005 for Medco clients, its lowest level since this metric has been tracked. Indeed, some Medco clients that took full advantage of our plan design and management capabilities experienced reduction in their year-over-year drug spend.
Responding to new scienceToday, the specialty pharmacy industry is a rapidly expanding market. Spending on biotech and specialty pharmaceuticals is increasing at twice the rate of that for traditional medications, and some specialty therapies can exceed a quarter of a million dollars per patient, per year. As the nation’s largest specialty pharmacy operation by virtue of our Accredo acquisition, Medco has increased its specialty penetration by selling-in its specialty pharmacy services to clients representing more than 40 million eligible members. Medco expects $50 million in 2006 synergies from the integration of Accredo into our business. We expect the acquisition to be accretive to earnings per share by $0.05 to $0.08 in 2006. Our approach aligns specialty pharmacy and leverages proven techniques that have decreased drug trend across traditional pharmacy benefits management programs — leveraging the efficiencies of scale with our leading edge tools such as EXPERxT Advisor® and integrating medical data through RationalMed® to effect better overall health outcomes for patients. This improves safety and savings while offering a seamless continuum of care.
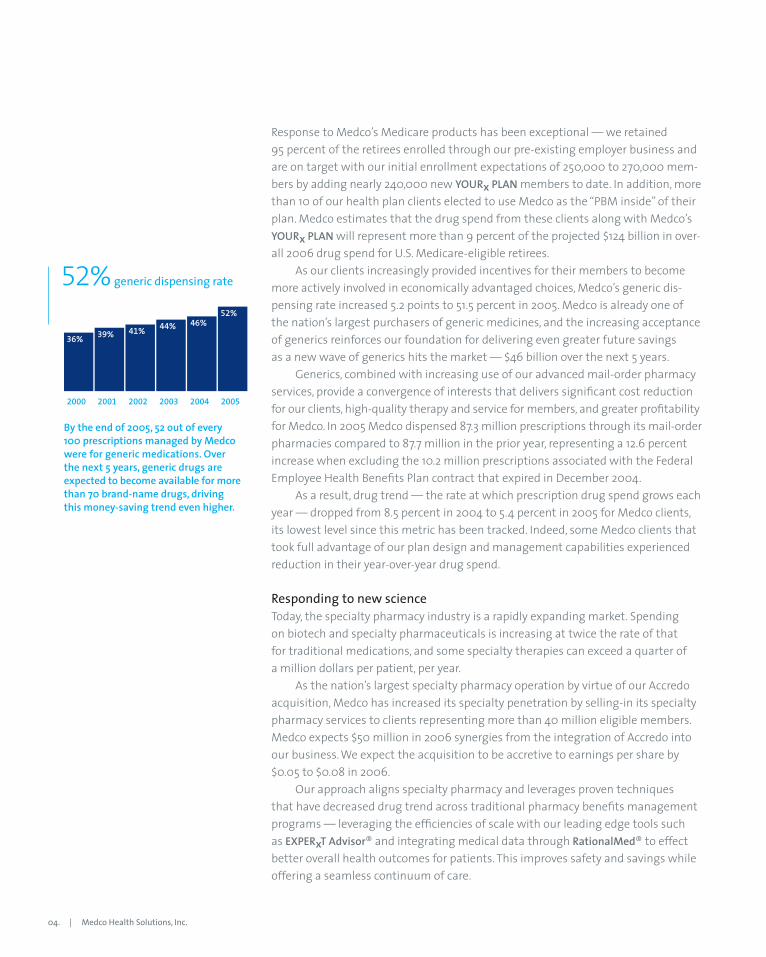
52% generic dispensing rate
By the end of 2005, 52 out of every 100 prescriptions managed by Medco were for generic medications. Over the next 5 years, generic drugs are expected to become available for more than 70 brand-name drugs, driving this money-saving trend even higher.
2005 2004 2003 2002 2001 2000
52%
46% 44%
39% 41%
36%
Doing well by doing good Two events, the South Asian tsunami and Hurricane Katrina, were sudden and devastating. Each of us at Medco was saddened by the loss of life, suffering, and devastation, and collectively our response was swift and appropriately reflected the values that are at the core of our company. As part of the tsunami relief effort, we committed to a donation of more than 13 million doses of critically needed generic medications. In New Orleans and Texas, the passion and professionalism of our employees drove many to an even deeper level of commitment, staffing evacuee shelters and spending days in a quickly crafted mobile pharmacy — in short, Medco people made a difference by offering their unique skills, expertise, and time. Each of these employees has my gratitude and admiration.
Momentum and growth in 2006As we reflect back on our success, we look forward to even greater opportunity in 2006. The historic wave of new generics coming to market enables us to help our clients manage the growing demand for pharmacy care. At the same time, our industry-leading specialty pharmacy operation will assist our clients in managing the high costs associated with today’s biotech treatments. We are poised to deliver a record 91 million prescriptions through our mail-order pharmacies, widely regarded as the most sophisticated in our industry, and delivering the benefits of cost efficiency and clinical effectiveness. As 2006 begins, enrollment in our Medicare programs enables us to extend proven clinical and management capabilities to new sectors of the population. And Medco intends to assert its clinical leadership with broad-based imple-mentation of our Therapeutic Resource Centers, launching what promises to become a new generation of pharmacy practice excellence. I invite you to read our annual report, which elaborates on the ways in which Medco continues to deliver more — building value and recalibrating the standards for quality and savings in prescription healthcare.
99.3%1 Client retention rate for 2005. High client retention reflects our commitment to service and value. Today, the average contract length across Medco’s largest clients is an impressive 4.5 years.
$2.7 billionAnnualized new business wins for 2006 to date, on the heels of $3 billion in new business for 2005.
1 Excludes loss of FEHBP in 12/04.
| 05.
Sincerely,
David B. Snow, Jr. Chairman & Chief Executive Officer
06. | Medco Health Solutions, Inc.
As the single largest dispenser of generic medications in North America, Medco has the scale that delivers purchasing power. On average, we can deliver generics for less. In 2005, the average generic fill rate for new generic medications at Medco’s mail-order pharmacies was nearly 95 percent within 1 month of introduction. Beginning in the second half of 2006, an unprecedented wave of brand-name patent expirations will accelerate generic drug opportunities — and the resultant savings for clients and members. Nearly 70 medications,
including 19 “blockbusters” such as Zocor®, Zoloft®, and Ambien®, are scheduled to become available in generic form between now and 2010. There is a growing acceptance by physicians to prescribe, pharmacists to dispense, and patients to use generic medications, when clinically appropriate. With the average cost of a generic drug up to 60 percent less than its brand-name counterpart, generics help to manage the high cost of prescription drugs. This is good news for Medco, our clients, and members, alike.
Medco is the
single largest dispenser of generic medications in North America.
$46 billionin brand-name drug spend expected to go off-patent between 2006 and 2010. For every $100 million in brand-name drug spend moving off-patent, Medco clients and members save an average of $45 million.
This is more than a pill This is a generic drug — the single most powerful tool to manage escalating prescription drug costs. By choosing generics over their brand-name counterparts, Medco’s clients and members saved over $9 billion in drug costs during 2005. Over the next 5 years, Medco estimates that patents will expire on medications representing more than $46 billion in brand-name sales — presenting an opportunity for savings of historic proportions.
| 07.
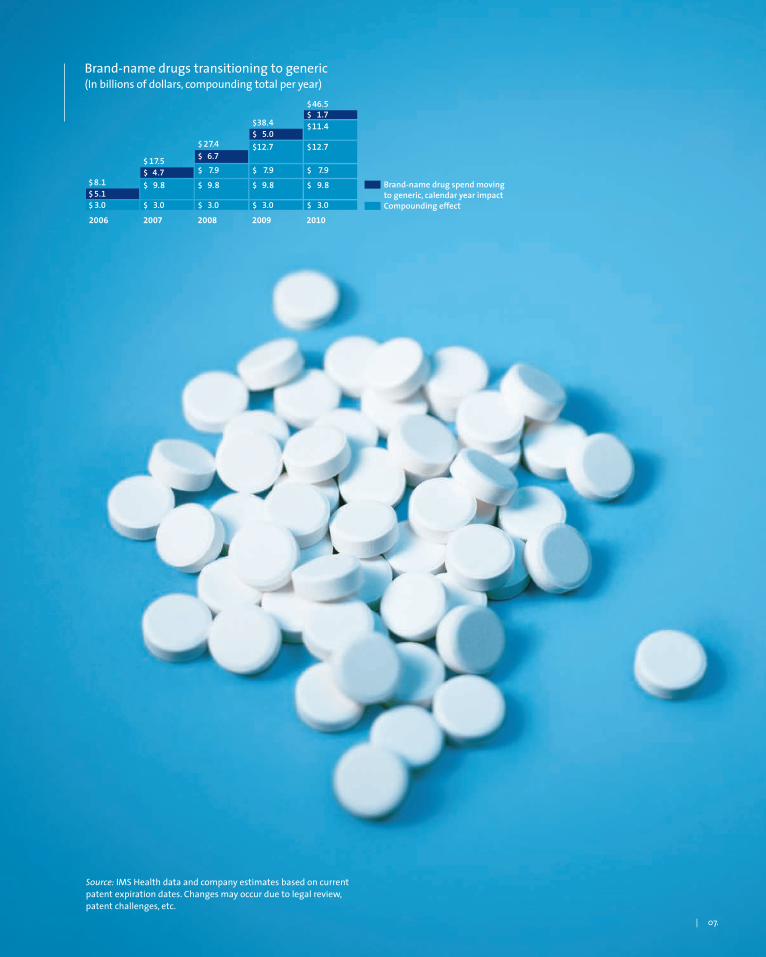
Source: IMS Health data and company estimates based on current patent expiration dates. Changes may occur due to legal review, patent challenges, etc.
Brand-name drugs transitioning to generic(In billions of dollars, compounding total per year)
Brand-name drug spend moving to generic, calendar year impact Compounding effect
$ 8.1 $ 5.1 $ 3.0
$ 17.5 $ 4.7 $ 9.8
$ 3.0
$ 27.4 $ 6.7 $ 7.9 $ 9.8
$ 3.0
$ 38.4 $ 5.0 $ 12.7
$ 7.9 $ 9.8
$ 3.0
$ 46.5 $ 1.7 $ 11.4
$ 12.7
$ 7.9 $ 9.8
$ 3.0
2010 2009 2008 2007 2006

08. |
As Americans grow older, the need for prescription medication increases. This sampling of Medco’s member base shows that annual drug costs for the average Medicare-eligible member are more than twice those of the average middle-aged (35- to 49- year-old) member.
Drug costs increase with age(Drug cost by age per member per year)
65-80+ 50-64 35-49 20-34 0-19
$1,867
$1,396
$387
$729
$255
Medco Health Solutions, Inc. | 09.
This is more than a memberThis is Ann, a Medicare-eligible consumer of prescription medications. She is among the 43 million Americans eligible to receive prescription drug coverage under the Medicare Part D program. She represents a growing population that is projected to spend more than $700 billion on prescription medications over the next 10 years. During 2006, Medco expects to manage more than 9 percent of the nation’s Medicare-eligible drug spend. On average, America’s seniors incur three times the claims for chronic-care therapies, and spend roughly two-and-a-half times more on prescription drugs than other consumers. Medco’s plan for Medicare-eligible consumers, known as YOURx PLAN, encourages the use of cost-saving generic medications and mail service. The plan, through its drug utilization program, also encourages patient compliance, thus minimizing the chance of unnecessary and costly hospitalizations. Cost, however, is but one concern. Seniors, on average, take eight different prescriptions per year, have prescriptions filled at three or more pharmacies, and about a quarter of them visit more than five physicians. As users of multiple
medications, multiple pharmacies, and multiple physicians, seniors are at greater risk for adverse drug interactions and misuse. Medco’s single-platform technology, robust database, and access to real-time data deliver improved patient safety. Medco supports our health plan and employer clients by offering an array of Medicare Part D products and services designed to best serve their Medicare-eligible members. Medco has a long history of serving America’s seniors. Through our health plan and employer clients, and as one of only 10 national Prescription Drug Plans (PDPs) named by CMS, Medco extends our decades of experience to offer all Medicare-eligible consumers safe, cost-effective, and convenient pharmacy care.
$700 billionCMS estimates that Medicare-related pharmaceutical spending could exceed $700 billion over the next 10 years.
9.1%Medco expects to cover more than 9 percent — more than $11 billion — of the nation’s total Medicare- eligible estimated 2006 drug spend of $124 billion.
10. | Medco Health Solutions, Inc.
Drug spend in the specialty pharmacy industry is growing at about 20 percent each year — and our clients are challenged to manage this spending not only today but into the future. Costs for specialty drugs range from $4,000 to $400,000 per patient per year and make up a disproportionate amount of a plan’s overall pharmacy costs. Spurred by advances in science and fed by a robust pipeline of more than 300 biotechnology drugs, specialty pharmacy spending represents an ever-increasing percentage of an already growing prescription drug industry.
For our clients, growth in spend and trend drives an urgent need to identify and manage costs. By capitalizing on Medco’s scale, streamlining delivery channels, and providing differentiated, high-touch patient care, Accredo can help clients ensure they are spending each pharmacy care dollar wisely. Today, there are new opportunities for Medco and Accredo to expand our respective product and service offerings across a broader client base. We expect that the operational efficiencies and sales opportunities resulting from the acquisition of Accredo will translate into $50 million in synergies during 2006.
This is more than a drugThis is one of nearly 150 specialty pharmacy drugs managed by Medco’s Specialty Pharmacy segment. When Medco acquired Accredo Health, Incorporated in August 2005, we created the nation’s largest and broadest specialty pharmacy under the Accredo brand. In a confluence of high touch and high tech, the addition optimized Medco’s technology infrastructure, expansive market reach, and offering of 125 specialty pharmacy drugs — by providing our clients with preferred access to an additional 23 proven and promising specialty drugs.
| 11.
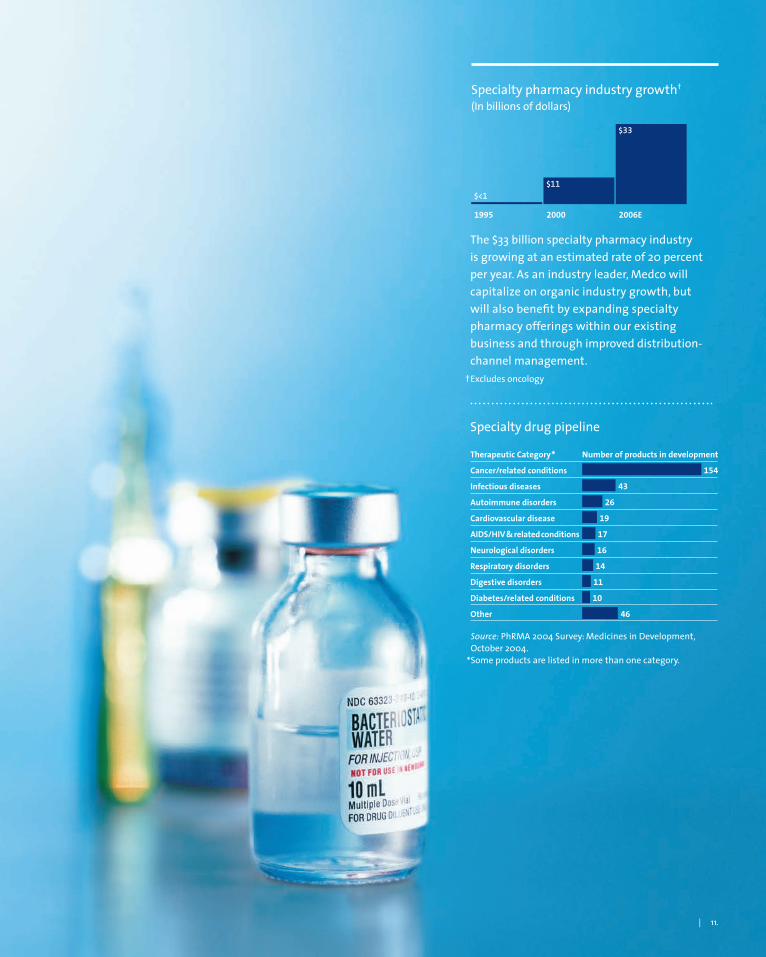
The $33 billion specialty pharmacy industry is growing at an estimated rate of 20 percent per year. As an industry leader, Medco will capitalize on organic industry growth, but will also benefit by expanding specialty pharmacy offerings within our existing business and through improved distribution-channel management. †Excludes oncology
Specialty drug pipeline
Specialty pharmacy industry growth† (In billions of dollars)
2006E 2000 1995
$33
$11 $<1
Therapeutic Category* Number of products in development
Cancer/related conditions 154
Infectious diseases 43
Autoimmune disorders 26
Cardiovascular disease 19
AIDS/HIV & related conditions 17
Neurological disorders 16
Respiratory disorders 14
Digestive disorders 11
Diabetes/related conditions 10
Other 46
Source: PhRMA 2004 Survey: Medicines in Development, October 2004.
* Some products are listed in more than one category.

12. |
91 million Rxsexpected in 2006. Mail order is the fastest growing delivery channel, expanding at nearly double the growth rate of the overall prescription drug market. With 91 million mail-order prescriptions expected for 2006, Medco remains the undisputed industry leader in mail-order prescription dispensing.
Mail-order prescription growth trend 2000–2006E (Unadjusted Rxs in millions)
2004 2002 2000
91 88 82
65
2006E
Medco Health Solutions, Inc. | 13.
In 2005, Medco dispensed 87.3 million mail-order prescriptions — more than any other mail-order pharmacy in the nation. In 2006, we expect to dispense 91 million mail-order prescriptions, reflecting growth from new client business, as well as our demonstrated ability to inspire members to use mail order. Today, Medco has 23 million members in mail-order conversion programs. Located in Willingboro, New Jersey, and Las Vegas, Nevada, our two fully automated dispensing pharmacies employ some of the industry’s most sophisticated robotics, powered by 1.7 million lines of computer code. Our mail-order pharmacies apply rigorous Six Sigma® quality disciplines. The result is accuracy that exceeds 99.9997 percent. Medco’s operational efficiency is further enhanced through use of our No. 1 ranked website,3 medco.com®, and sophisticated, automated phone-order sys-tems — together, these automated channels processed more than 60 percent of refill
prescriptions in 2005. No one in the industry has demonstrated the level of safety, efficiency, and accuracy of our automated pharmacies — where much of the proprietary technology was developed and patented by Medco. The prescription mail service industry grew at an average rate of 10.7 percent between 1995 and 2004. This trend continues as clients and members recognize and embrace the value, convenience, and safety of mail service.
1 Federal Trade Commission. Pharmacy Benefit Managers: Ownership of Mail-Order Pharmacies. Washington, DC: August, 2005. The report concludes that, in 2002 and 2003, prescription drug plan sponsors generally paid lower prices for drugs purchased through PBM-owned mail-order pharmacies than for drugs purchased through mail-order or retail pharmacies not owned by PBMs.
2 Teagarden JR, Nagle B, Aubert RE, et al. “Dispensing Error Rate in a Highly Automated Mail-Service Pharmacy Practice.” Pharmaco-therapy. 2005; 25: 1629–1635.
3 Customer Respect Group’s (CRG) 2005 Privacy Report. medco.com received the highest customer privacy ranking among all phar-maceutical and healthcare companies.
Six Sigma is a registered trademark and service mark of Motorola, Inc.
23 millionlives in Medco mail incentive programs, including retail refill allowance programs and Medco’s Mail Advantage program.
This is more than a prescriptionThis is a mail service prescription. It is less costly,1 more convenient, and safer, with a documented dispensing accuracy 23 times higher than a benchmark study of retail community pharmacies.2 Clients look to Medco for our industry-leading mail capabilities and the innovative and effective programs we’ve designed to introduce members to the many benefits of mail service.

14. | Medco Health Solutions, Inc.
Pharmacy practice is the core of our busi-ness — Medco has a history of pioneering innovative technology that enhances the safety of prescription drug dispensing, while also lowering costs. In 1996, we went a step further when Medco became the first in the industry to separate the dispensing and cognitive func-tions of pharmacy practice. In 2006, we’ll begin executing a new model for pharmacy, one where the pharmacist is a clinical specialist; armed with robust, real-time patient data and credentialed in the pharmaceutical treatment of specific disease states, with full access to patient plan and formulary data. Fifty percent of Medco’s patients account for nearly 96 percent of prescription costs. These are patients that suffer from a range of chronic conditions, including diabetes and heart
disease. On average, they require between 20 and 47 prescriptions per year. These patients know to seek treatment from physicians that specialize in their condition — but what about pharmacy care? The capability of extending specialized pharmacy care across tens of mil-lions of patients has never been a reality — until now. By the end of 2006, Medco’s Therapeutic Resource Centers will offer therapy-based and patient-centered pharmacy care for the treat-ment of diabetes, cardiovascular disease, neurological and psychological disorders, gastro-intestinal, pulmonary, hematology, oncology, and rare diseases. Through these Centers, our patients will become well-informed consumers, physician contacts will be streamlined, and our pharma-cists will be trained and technologically enabled to provide the best pharmacy care in the industry.
This is more than a pharmacistThis is Medco pharmacist Nancy Miller, R.Ph. She is representative of the many pharmacists spearheading the future of pharmacy practice at Medco’s new Therapeutic Resource Centers. Yesterday’s pharmacy revolved around dispensing and distribution. Today’s practice is centered on patients, not pills. Today’s pharmacy reaches out to patients — offering specialized therapy-based solutions designed to enhance safety, efficacy, and cost savings. The future is here, in Medco’s Therapeutic Resource Centers.

| 15.
21 millionMore than 21 million members — over one-third of Medco’s total membership — are being treated primarily for one of eight broad disease categories: diabetes, cardiovascular, neurology/psychiatry, hematology, oncology, pulmonary, gastroenterology, or rare diseases.
Chronic and complex patients account for over 90% of drug costs.
Patients suffering from multiple chronic conditions comprise 50 percent of the patient population, but 96 percent of the costs.
% of Cost% of Population
ComplexChronicAcuteHealthy
50% of the population
96% of the cost
16. | Medco Health Solutions, Inc.
Financial Highlights
16. | Medco Health Solutions, Inc.
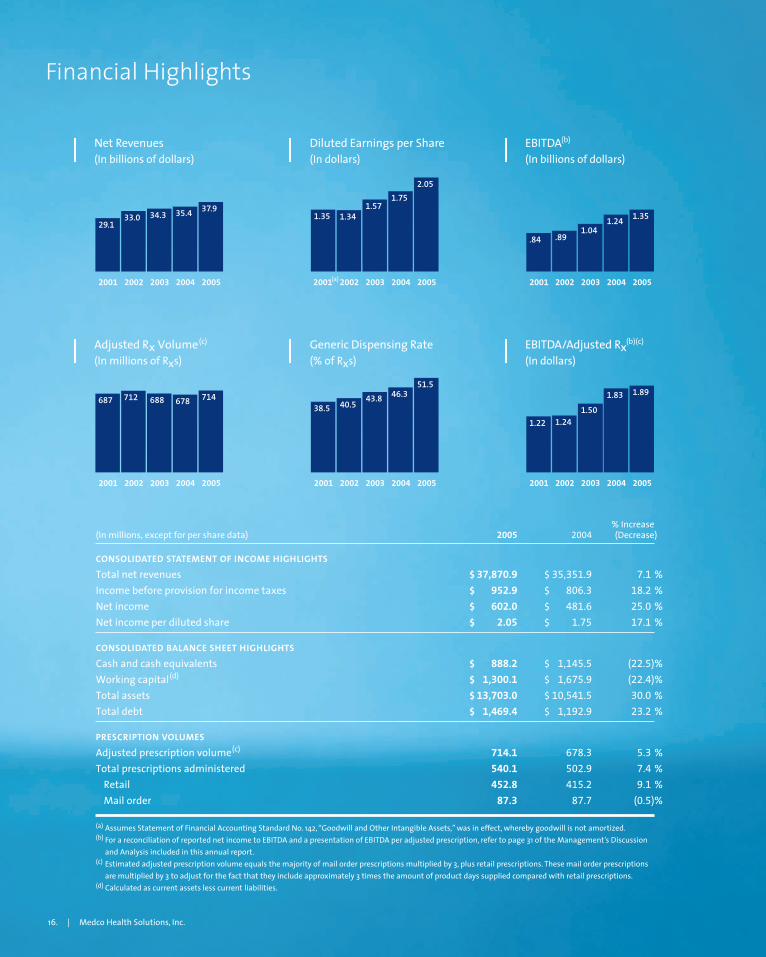
% Increase(In millions, except for per share data) 2005 2004 (Decrease)
CONSOLIDATED STATEMENT OF INCOME HIGHLIGHTS
Total net revenues $ 37,870.9 $ 35,351.9 7.1 %Income before provision for income taxes $ 952.9 $ 806.3 18.2 %Net income $ 602.0 $ 481.6 25.0 %Net income per diluted share $ 2.05 $ 1.75 17.1 %
CONSOLIDATED BALANCE SHEET HIGHLIGHTS
Cash and cash equivalents $ 888.2 $ 1,145.5 (22.5)%Working capital(d) $ 1,300.1 $ 1,675.9 (22.4)%Total assets $ 13,703.0 $ 10,541.5 30.0 %Total debt $ 1,469.4 $ 1,192.9 23.2 %
PRESCRIPTION VOLUMES
Adjusted prescription volume(c) 714.1 678.3 5.3 %Total prescriptions administered 540.1 502.9 7.4 % Retail 452.8 415.2 9.1 % Mail order 87.3 87.7 (0.5)%
(a) Assumes Statement of Financial Accounting Standard No. 142, “Goodwill and Other Intangible Assets,” was in effect, whereby goodwill is not amortized.(b) For a reconciliation of reported net income to EBITDA and a presentation of EBITDA per adjusted prescription, refer to page 31 of the Management’s Discussion
and Analysis included in this annual report.(c) Estimated adjusted prescription volume equals the majority of mail order prescriptions multiplied by 3, plus retail prescriptions. These mail order prescriptions
are multiplied by 3 to adjust for the fact that they include approximately 3 times the amount of product days supplied compared with retail prescriptions.(d) Calculated as current assets less current liabilities.
2005 2004 2003 2002 2001
37.9 34.3 35.4
29.1 33.0
2005 2004 2003 2002 2001(a)
2.05
1.57 1.75
1.35 1.34
2005 2004 2003 2002 2001
1.35 1.04
1.24
.84 .89
2005 2004 2003 2002 2001
714 688 678 687 712
2005 2004 2003 2002 2001
51.5 43.8 46.3
38.5 40.5
2005 2004 2003 2002 2001
1.89
1.50
1.83
1.22 1.24
EBITDA (b)
(In billions of dollars)
EBITDA/Adjusted R x (b)(c)
(In dollars)
Net Revenues (In billions of dollars)
Adjusted Rx Volume (c)
(In millions of R x s)
Diluted Earnings per Share (In dollars)
Generic Dispensing Rate (% of R x s)
Table of Contents
18 Management’s Discussion and Analysis 39 Management’s Reports 40 Report of Independent Registered Public Accounting Firm 41 Consolidated Balance Sheets 42 Consolidated Statements of Income 43 Consolidated Statements of Stockholders’ Equity 44 Consolidated Statements of Cash Flows 45 Notes to Consolidated Financial Statements 70 Selected Financial Data 72 Board of Directors, Executive Officers and Management
Committee, and Shareholder Information
Medco Health Solutions, Inc. | 17.
18. | Medco Health Solutions, Inc.
| OVERVIEW
We are one of the nation’s largest pharmacy benefit managers, and we provide sophisticated traditional and specialty pharmacy benefit programs and services for our clients, members of client-funded benefit plans, and individual patients. Our business model requires collaboration with retail pharmacies, physicians and, particularly in specialty pharmacy, Medicare, Medicaid and other payors such as insurers. Our programs and services help control the cost and enhance the quality of the prescription drug benefit. We accomplish this by providing pharmacy benefit management (“PBM”) services through our national networks of retail pharma-cies and our own mail order pharmacies, as well as through our specialty pharmacy operation, which became the nation’s larg-est specialty pharmacy based on revenues with the acquisition of Accredo Health, Incorporated (“Accredo”) on August 18, 2005 (the “Accredo acquisition”). When the term “mail order” is used, we mean Medco’s traditional pharmacy mail order operations, and subsequent to the Accredo acquisition, we mean Medco’s traditional pharmacy mail order operations, as well as Accredo’s specialty pharmacy operations. We have a large number of clients in each of the major industry categories, including Blue Cross/Blue Shield plans; managed care organizations; insurance carriers; third-party benefit plan administrators; employers; federal, state and local government agencies; and union-sponsored benefit plans. Our clients are generally entities that provide a pharmacy benefit to their underlying membership, such as members of their plan or their employees, as examples. We have been an indepen-dent, publicly traded enterprise since we were spun off by Merck & Co., Inc. (“Merck”) on August 19, 2003. From November 18, 1993 until the spin-off, we were a wholly-owned subsidiary of Merck.
We operate in a competitive market as clients seek to control the growth in the cost of providing prescription drug benefits. Prescription drug costs have risen considerably over the past sev-eral years, largely as a result of inflation on brand-name drugs and increases in the number of prescriptions utilized, including the introduction of new products from brand-name pharmaceutical manufacturers. These prescription drug cost increases, known as drug trend, have garnered significant attention throughout the United States as they contribute to the rise in the national cost of healthcare. Our business model is designed to reduce this rate of drug trend for our PBM clients, whose drug trend has declined steadily to 5.4% in 2005, compared to 8.5% in 2004 and 10.2% in 2003. Specialty drug spending is growing at more than 20% each year and provides us with further opportunity to reduce overall drug trend for our clients and specialty payors.
The complicated environment in which we operate presents us with opportunities, challenges and risks. Our clients are para-mount to our success; the retention of these clients and winning new clients poses the greatest opportunity, and the loss thereof represents an ongoing risk. The preservation of our relationships with pharmaceutical manufacturers, biopharmaceutical manufac-turers and retail pharmacies is very important to the execution of our business strategies. Our future success will hinge on our abil-ity to drive generic utilization from the over $46 billion in expected patent expirations from 2006 through 2010, our ability to continue to provide innovative and competitive clinical and other services to our clients and patients, including our active participation in the Medicare Part D benefit and the rapidly growing specialty phar-macy industry.
On August 18, 2005, we acquired all of the outstanding common stock of Accredo, as further described in Note 3, “Acquisitions of Businesses,” to our consolidated financial statements included in this annual report.
| KEY INDICATORS REVIEWED BY MANAGEMENT
Management reviews the following indicators in analyzing our consolidated financial performance: net revenues, with a partic-ular focus on mail order revenue; adjusted prescription volume; generic dispensing rate; gross margin percentage; diluted earn-ings per share; Specialty Pharmacy segment operating income; Earnings before Interest Income/Expense, Taxes, Depreciation, and Amortization (“EBITDA”); and EBITDA per adjusted prescription. See “— Liquidity and Capital Resources — EBITDA” further below for a definition of EBITDA per adjusted prescription. We believe these measures highlight key business trends and are important in evaluating our overall performance. These measures are also reflective of the success of our execution of strategic objectives.
| 2005 FINANCIAL PERFORMANCE SUMMARY
Our net income increased 25.0% to $602 million and diluted earn-ings per share increased 17.1% to $2.05 in 2005. These increases reflect higher generic dispensing rates, improved service margins, the addition of Accredo, a nonrecurring income tax benefit of $25.7 million in the third quarter of 2005, and the inclusion of 53 weeks in fiscal 2005 compared with 52 weeks in fiscal 2004. The diluted weighted average shares outstanding were 293.5 million for 2005 and 274.7 million for 2004, representing an increase of 6.8%. This increase results from shares issued in connection with the Accredo acquisition and the effect of stock options partially offset by the purchase of 7.7 million shares of stock in connection with the share repurchase program announced on August 22, 2005. Accredo’s results were dilutive to 2005 earnings by $0.03 per share.
Management’s Discussion and Analysis
Medco Health Solutions, Inc. | 19.
Net revenues increased 7.1% to $37,871 million in 2005. This increase reflects higher prices charged by pharmaceutical manufacturers and higher retail volumes, including the effect of new clients and the extra week of volume in fiscal 2005, as well as the Accredo acquisition, partially offset by higher generic dispensing rates. The higher generic dispensing rates, which contribute to lower costs for clients and their members, resulted in a reduction of approxi-mately $1,960 million in net revenues for 2005. Total prescription volume, adjusted for the difference in days supply between mail and retail, increased by 5.3% to 714.1 million for 2005 as a result of the aforementioned higher retail volumes and the extra week in fiscal 2005. The mail order penetration rate on an adjusted basis declined to 36.6% for 2005, compared to 38.8% for 2004, reflecting the higher retail volumes and the loss of a large mail-order-only client at the end of 2004.
Our generic dispensing rate increased to 51.5% in 2005 compared to 46.3% in 2004 as a result of significant drugs that have lost patent protection at the end of 2004 and additional patent expira-tions during 2005. Brand-name pharmaceutical rebates increased for 2005 as a result of improved formulary management and compliance, and favorable pharmaceutical manufacturer rebate contract revisions, partially offset by decreased brand-name pre-scription volume. The percentage of rebates shared with clients increased to approximately 74% in 2005, compared to approxi-mately 56% in 2004. This percentage increase primarily relates to a higher representation of clients participating in transparent pric-ing arrangements whereby a greater portion of rebates are shared in exchange for other elements of pricing, including higher claims processing administrative fees. Our service margin improved in 2005 as compared with 2004, reflecting these increased client and other administrative and service revenues.
The increase in overall gross margin to 5.1% in 2005 from 4.9% in 2004 was driven by our increased generic dispensing rate and higher gross margins experienced in our specialty pharmacy busi-ness, as well as the higher service margin, partially offset by the net effect of higher client rebate sharing levels.
Selling, general and administrative expenses of $758 million for 2005 increased from 2004 by $81 million, or 12.0%. The increase reflects Accredo expenses of $57 million, Medicare Part D prepara-tion expenses of $18 million, the favorable closure of an operating tax exposure of $16 million recorded as a nonrecurring item in 2004, $10 million in increased legal fees, litigation expenses of $8 million related to the Ohio State Teachers Retirement System settlement charge recorded in the fourth quarter of 2005, and various other increased expenses of $3 million including the effect of the extra week in fiscal 2005. These were partially offset by the
effect of decreased litigation expenses of $21 million related to the multistate taskforce of attorneys general settlement charge recorded in 2004, and higher 2004 branding campaign expenses of $10 million.
Amortization of intangible assets of $193 million for 2005 increased $13 million compared to 2004, primarily associated with the intangible assets acquired in the Accredo acquisition. Interest and other (income) expense, net, of $40 million decreased $20 mil-lion in 2005 compared to 2004. The variance primarily reflects higher interest income from higher average daily cash balances and higher interest rates.
| KEY FINANCIAL STATEMENT COMPONENTS
Consolidated Statements of Income. Our net revenues are com-prised primarily of product net revenues and are derived from the sale of prescription drugs through our networks of contrac-tually affiliated retail pharmacies and through our mail order pharmacies, and are recorded net of certain discounts, rebates and guarantees payable to clients. Specialty pharmacy product net revenues represent revenues from the sale of primarily bio-pharmaceutical drugs and are reported at the net amount billed to third-party payors and patients. Service revenues consist prin-cipally of administrative fees and clinical program fees earned from clients and other non-product related revenues, sales of prescription services and data to pharmaceutical manufacturers and other parties, and performance-oriented fees paid by spe-cialty pharmacy manufacturers. For further details see our critical accounting policies included in “— Use of Estimates and Critical Accounting Policies and Estimates” below and Note 2, “Summary of Significant Accounting Policies,” to our consolidated financial statements included in this annual report.
Cost of revenues is comprised primarily of cost of product net revenues and is principally attributable to the dispensing of pre-scription drugs. Cost of product net revenues for prescriptions dispensed through our network of retail pharmacies includes the contractual cost of drugs dispensed by, and professional fees paid to, retail pharmacies in the networks. Our cost of product net rev-enues relating to drugs dispensed by our mail order pharmacies consists primarily of the cost of inventory dispensed and our costs incurred to process and dispense the prescriptions, including the associated fixed asset depreciation. The operating costs of our call center pharmacies are also included in cost of product net reve-nues. In addition, cost of product net revenues includes a credit for rebates earned from brand-name pharmaceutical manufac-turers whose drugs are included in our formularies. These rebates generally take the form of formulary rebates, which are earned
20. | Medco Health Solutions, Inc.
based on the volume of a specific drug dispensed, or market share rebates, which are earned based on the achievement of contractu-ally specified market share levels. Cost of service revenues consist principally of labor and operating costs for delivery of services pro-vided, costs associated with member communication materials, and certain information acquisition costs.
Selling, general and administrative expenses reflect the costs of operations dedicated to overall corporate governance and general management, generating new sales, maintaining existing client relationships, managing clinical programs, enhancing technology capabilities, directing pharmacy operations, performing reim-bursement activities, finance, legal and other staff activities.
Interest and other (income) expense, net, primarily includes inter-est expense on our senior unsecured term loan facility, senior notes, and accounts receivable financing facility, net of interest rate swap agreements on $200 million of the senior notes, par-tially offset by interest income generated by overnight deposits and short-term investments in marketable securities.
Consolidated Balance Sheets. Our key assets include cash and short-term investments, accounts receivable, inventories, fixed assets, deferred tax assets, goodwill and intangibles. Cash reflects the accumulation of positive cash flows from our opera-tions. Accounts receivable balances primarily include amounts due from brand-name pharmaceutical manufacturers for earned rebates and other prescription services. The accounts receivable balances also represent amounts due from clients, other payors and patients for prescriptions dispensed from retail pharmacies in our networks or from our mail order pharmacies, including fees due to us, net of allowances for doubtful accounts and contrac-tual allowances, and any applicable rebate liabilities or payments due to clients under guarantees. When rebates due to be passed back to clients are greater than the corresponding client accounts receivable balances, the net liability is reclassified to claims and other accounts payable. Inventories reflect the cost of prescrip-tion products held for dispensing by our mail order pharmacies and are recorded on a first-in, first-out basis, net of allowances for losses. Fixed assets include investments in our corporate head-quarters, mail order pharmacies, call center pharmacies, account service offices, and information technology, including capitalized software development. Deferred tax assets primarily represent temporary differences between the financial statement basis and the tax basis of certain accrued expenses and client rebate pass-back liabilities. Goodwill and intangible assets are comprised primarily of the push-down of goodwill and intangibles related to our acquisition in 1993 by Merck, goodwill for the excess of the Accredo purchase price over net assets acquired, and intangible assets recorded from our acquisition of Accredo.
Our primary liabilities include claims and other accounts payable, accrued expenses and other current liabilities, debt and deferred tax liabilities. Claims and other accounts payable primarily consist of amounts payable to retail network pharmacies for prescriptions dispensed and services rendered, amounts payable for mail order prescription inventory purchases, and reclassified net client rebate pass-back liabilities. Accrued expenses and other current liabilities primarily consist of employee- and facility-related cost accru-als incurred in the normal course of business, as well as income taxes payable. Our debt is primarily comprised of a senior unse-cured term loan facility, senior notes and an accounts receivable financing facility. In addition, we have a net deferred tax liability primarily associated with our recorded intangible assets. We do not have any material off-balance sheet financing arrangements.
Our stockholders’ equity includes an offset for net unearned com-pensation, representing the market value at the time of grant of restricted stock and restricted stock units granted to our employ-ees and directors less the amount of compensation expense amortized over the associated vesting period. Stockholders’ equity as of December 31, 2005 also includes an offset for treasury stock purchases under our share repurchase program announced on August 22, 2005.
Consolidated Statements of Cash Flows. An important element of our operating cash flows is the timing of billing cycles, which are two-week periods of accumulated billings for retail and mail order prescriptions. We bill the cycle activity to clients on this bi-weekly schedule and generally collect from our clients before we pay our obligations to the retail pharmacies for that same cycle. At the end of any given reporting period, unbilled PBM receivables can represent up to two weeks of dispensing activity and will fluctuate at the end of a fiscal month depending on the timing of these billing cycles. A portion of the specialty pharmacy business includes reimbursement by payors, such as insurance companies, under a medical benefit, or by Medicare or Medicaid. These trans-actions involve higher patient co-payments than experienced in the PBM business. As a result, this portion of the specialty pharmacy business, which yields a higher margin than the PBM business, experiences slower accounts receivable turnover than in the aforementioned PBM cycle.
We pay for our mail order prescription drug inventory in accordance with payment terms offered by our suppliers to take advantage of appropriate discounts. Effective mail order inventory manage-ment generates further positive cash flows. Earned brand-name pharmaceutical manufacturers’ rebates are recorded monthly based upon prescription dispensing, with actual bills rendered on a quarterly basis and paid by the manufacturers within an agreed-upon term. Payments of rebates to clients are generally made after
Medco Health Solutions, Inc. | 21.
our receipt of the rebates from the brand-name pharmaceutical manufacturers, although some clients may receive more acceler-ated rebate payments in exchange for other elements of pricing in their contracts.
Prior to the spin-off, Merck managed our cash, which was reflected in our consolidated statements of cash flows in intercompany transfer from (to) Merck. We have managed our own cash and investments since the spin-off. Our cash primarily includes time deposits with banks or other financial institutions. Our short-term investments include U.S. government securities that have average maturities of less than one year and that are held to satisfy statu-tory capital requirements for our insurance subsidiaries.
Ongoing cash outflows are associated with expenditures to support our mail order, retail pharmacy network operations, call-center pharmacies and other selling, general and administrative functions. The largest components of these expenditures include mail order inventory purchases, payments to retail pharmacies, rebate and guarantee payments to clients, employee payroll and benefits, facility operating expenses, capital expenditures includ-ing technology investments, interest and principal payments on our outstanding debt, and income taxes. Share repurchases and acquisitions also represent an occasional cause of cash outflows.
| CLIENT-RELATED INFORMATION
Revenues from UnitedHealth Group, which is currently our largest client, amounted to approximately $8,800 million, or 23% of our net revenues in 2005, $6,500 million, or 18%, of our net revenues in 2004, and approximately $6,100 million, or 18%, of our net rev-enues in 2003. The increase in 2005 reflects the inclusion of Oxford Health Plans, Inc., which was a pre-existing Medco client that was acquired by UnitedHealth Group in 2004, under the UnitedHealth Group contract effective January 2005. None of our other clients individually represented more than 10% of our net revenues in 2005, 2004 or 2003.
| SEGMENT DISCUSSION
As a result of our acquisition of Accredo, we now have two report-able segments, PBM and Specialty Pharmacy. The PBM segment involves sales of traditional prescription drugs to our clients and their members, either through our networks of contractually affili-ated retail pharmacies or our mail order pharmacies. The Specialty Pharmacy segment, which was formed upon the Accredo acqui-sition, includes the sale of higher margin specialty pharmacy products and services for the treatment of chronic and potentially life-threatening diseases. The results of Accredo are included in the Specialty Pharmacy segment results and the consolidated
statements of income effective with the August 18, 2005 acquisi-tion. The Specialty Pharmacy segment also includes the specialty pharmacy activity previously included in our PBM business. We define the Specialty Pharmacy segment based on a product set and associated services, broadly characterized to include drugs that are high-cost, usually developed by biotechnology companies and often injectable, and which require elevated patient support. When dispensed, these products frequently require a significant amount of ancillary administration equipment, special packaging, and a much higher level of patient-oriented customer service than is normally required in the PBM business model. In addition, spe-cialty pharmacy products and services are often covered through medical benefit programs with the primary payors being insur-ance companies and government programs, along with patients, with a smaller but growing percentage of PBM clients as payors.
The Specialty Pharmacy segment was formed as a result of the Accredo acquisition on August 18, 2005 in response to a manage-ment desire to manage the acquired business together with our pre-existing specialty pharmacy activity as a separate business from our PBM operations. This acquisition complemented our pre-existing Medco specialty pharmacy operations, which were evolving beginning in 2004 and, to a greater extent in 2005.
The PBM segment is measured and managed on an integrated basis, and there is no distinct measurement that separates the performance and profitability of mail order and retail. We offer fully integrated PBM services to virtually all of our PBM clients and their members. The PBM services we provide to our clients are generally delivered and managed under a single contract for each client. PBM rebate contracts with pharmaceutical manufac-turers of brand-name drugs are negotiated on an enterprise-wide level based on our consolidated retail and mail order prescription volumes. We believe the level of rebates we are able to negotiate is significantly enhanced by our substantial mail order volume because we are able to achieve a higher level of formulary compli-ance in mail order than in retail. As a result, although the rebate contracts generate rebates on retail and mail order prescriptions equally on the basis of drug cost, it is not practicable to determine the true value of rebates earned specifically on retail or mail order prescription volume.
Both the PBM and the Specialty Pharmacy segments operate in one geographic region, which includes the United States and Puerto Rico.
As a result of the nature of our integrated PBM services and con-tracts, the chief operating decision maker views Medco’s PBM operations as a single segment for purposes of making decisions about resource allocations and in assessing our performance.
Management’s Discussion and Analysis
| RESULTS OF OPERATIONS
The following table presents selected comparative results of operations and volume performance ($ and volumes in millions):
December 31, Increase December 25, Increase December 27, For Fiscal Years Ended 2005 (1) (2) (Decrease) 2004 (Decrease) 2003
NET REVENUES
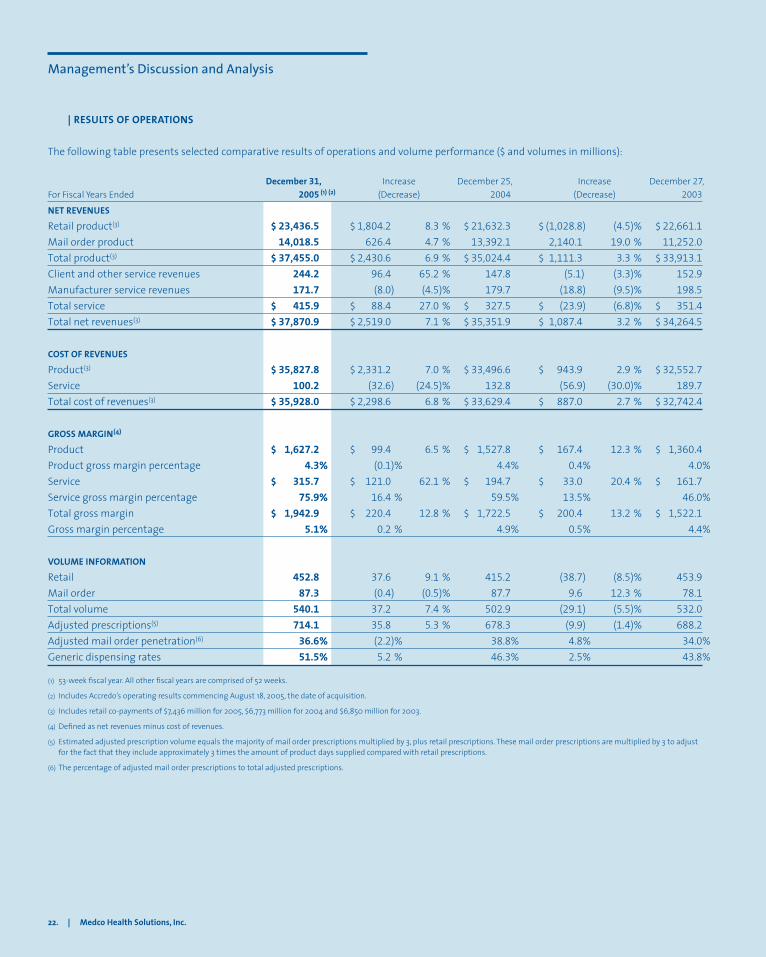
Retail product(3) $ 23,436.5 $ 1,804.2 8.3 % $ 21,632.3 $ (1,028.8) (4.5)% $ 22,661.1Mail order product 14,018.5 626.4 4.7 % 13,392.1 2,140.1 19.0 % 11,252.0Total product(3) $ 37,455.0 $ 2,430.6 6.9 % $ 35,024.4 $ 1,111.3 3.3 % $ 33,913.1Client and other service revenues 244.2 96.4 65.2 % 147.8 (5.1) (3.3)% 152.9Manufacturer service revenues 171.7 (8.0) (4.5)% 179.7 (18.8) (9.5)% 198.5Total service $ 415.9 $ 88.4 27.0 % $ 327.5 $ (23.9) (6.8)% $ 351.4Total net revenues(3) $ 37,870.9 $ 2,519.0 7.1 % $ 35,351.9 $ 1,087.4 3.2 % $ 34,264.5
COST OF REVENUES
Product(3) $ 35,827.8 $ 2,331.2 7.0 % $ 33,496.6 $ 943.9 2.9 % $ 32,552.7Service 100.2 (32.6) (24.5)% 132.8 (56.9) (30.0)% 189.7Total cost of revenues(3) $ 35,928.0 $ 2,298.6 6.8 % $ 33,629.4 $ 887.0 2.7 % $ 32,742.4
GROSS MARGIN(4)
Product $ 1,627.2 $ 99.4 6.5 % $ 1,527.8 $ 167.4 12.3 % $ 1,360.4Product gross margin percentage 4.3% (0.1)% 4.4% 0.4% 4.0%Service $ 315.7 $ 121.0 62.1 % $ 194.7 $ 33.0 20.4 % $ 161.7Service gross margin percentage 75.9% 16.4 % 59.5% 13.5% 46.0%Total gross margin $ 1,942.9 $ 220.4 12.8 % $ 1,722.5 $ 200.4 13.2 % $ 1,522.1Gross margin percentage 5.1% 0.2 % 4.9% 0.5% 4.4%
VOLUME INFORMATION
Retail 452.8 37.6 9.1 % 415.2 (38.7) (8.5)% 453.9Mail order 87.3 (0.4) (0.5)% 87.7 9.6 12.3 % 78.1Total volume 540.1 37.2 7.4 % 502.9 (29.1) (5.5)% 532.0Adjusted prescriptions(5) 714.1 35.8 5.3 % 678.3 (9.9) (1.4)% 688.2Adjusted mail order penetration(6) 36.6% (2.2)% 38.8% 4.8% 34.0%Generic dispensing rates 51.5% 5.2 % 46.3% 2.5% 43.8%
(1) 53-week fiscal year. All other fiscal years are comprised of 52 weeks.
(2) Includes Accredo’s operating results commencing August 18, 2005, the date of acquisition.
(3) Includes retail co-payments of $7,436 million for 2005, $6,773 million for 2004 and $6,850 million for 2003.
(4) Defined as net revenues minus cost of revenues.
(5) Estimated adjusted prescription volume equals the majority of mail order prescriptions multiplied by 3, plus retail prescriptions. These mail order prescriptions are multiplied by 3 to adjust for the fact that they include approximately 3 times the amount of product days supplied compared with retail prescriptions.
(6) The percentage of adjusted mail order prescriptions to total adjusted prescriptions.
22. | Medco Health Solutions, Inc.
Medco Health Solutions, Inc. | 23.
Net Revenues. The $1,804 million increase in retail net revenues in 2005 is primarily attributable to volume increases. Retail volume increased 9.1% in 2005, with a 13.1% increase from new clients and increased utilization, including 2.1% from the extra week of volume in fiscal 2005, partially offset by a 4.0% decline from client ter-minations. Retail net revenues also reflect higher levels of rebate sharing with clients, further discussed in the gross margin section, as well as a decrease of approximately $1,410 million from a greater representation of generic drugs in 2005, which are more steeply discounted for our clients than brand-name drugs. These were offset by higher prices charged by pharmaceutical manufacturers, including the effect of new and higher-cost brand-name drugs.
The $1,029 million decrease in retail net revenues in 2004 was pri-marily attributable to volume declines. Retail volume decreased 8.5% in 2004 and reflects a 12.0% reduction resulting from cli-ent terminations and lower prescription drug utilization from plan design changes in support of mail order, partially offset by an increase of 3.5% from new client volumes. Retail net revenues also reflect higher levels of rebate sharing with clients, as well as a decrease from a greater representation of generic drugs, partially offset by higher prices charged by pharmaceutical manufacturers.
The $626 million increase in mail order net revenues in 2005 reflects the addition of the Accredo business and higher prices charged by pharmaceutical manufacturers. This was partially offset by higher levels of rebate sharing with clients and a $550 million decrease from a higher representation of generic drugs, as well as a slight volume decrease. Mail order volume decreased 0.5% in 2005, with a 13.9% decline resulting from client terminations including the loss of a large mail-order-only client at the end of 2004, offset by an increase of 13.4% primarily from higher utilization for clients with plan designs favoring the use of mail order and new client vol-umes, including 1.9% from the extra week of volume in fiscal 2005. Mail order penetration on an adjusted basis was 36.6% for 2005, below the 38.8% for 2004, reflecting the increased retail volume.
The $2,140 million increase in mail order net revenues in 2004 reflects volume increases and higher prices charged by pharma-ceutical manufacturers, partially offset by higher levels of rebate sharing with clients, as well as a decrease from a higher represen-tation of generic drugs. Mail order volume increased 12.3% in 2004 with 17.0% higher utilization from plan design changes encour-aging the use of mail order, as well as volumes from new clients, partially offset by a 4.7% decrease from client terminations. Client plan design changes drove an increase in mail order penetration on an adjusted basis to 38.8% in 2004 from 34.0% in 2003.
Our generic dispensing rate increased to 51.5% in 2005, compared to 46.3% in 2004 and 43.8% in 2003. These increases reflect the
introduction of new generic products during these periods, the effect of client plan design changes promoting the use of lower-cost and more steeply discounted generics, and our programs designed to encourage generic utilization.
Service revenues of $416 million increased $88 million in 2005 as a result of higher client and other service revenues of $96 million partially offset by lower manufacturer service revenues of $8 mil-lion. The higher client and other service revenues reflect higher claims processing administrative fees, including higher fees on a per prescription basis as compensation for higher rebate-sharing arrangements with our clients, and the aforementioned overall higher retail volumes, as well as client revenues generated from our clinical programs, Medicare discount card administrative and enrollment fees, and other fees. The lower manufacturer revenues result from the termination of a manufacturer-sponsored patient assistance program at the end of 2004 partially offset by Accredo manufacturer service fees of $15 million.
Service revenues of $328 million declined $24 million in 2004 as a result of lower manufacturer service revenues of $19 million and lower client and other service revenues of $5 million. The lower manufacturer service revenues were primarily due to the termina-tion of certain manufacturer contracts. The decrease in client and other service revenues was attributable to lower client administra-tive fees resulting from decreased fees on a per prescription basis and lower retail volumes, offset by other client program revenues, and Medicare discount card administrative and enrollment fees.
Gross Margin. Our client contracts include several pricing vari-ables, such as price discounts for brand-name drugs, generic drugs and specialty drugs, separate price discounts for mail order and retail prescriptions, fees for various administrative and clinical services, and terms regarding levels of rebate sharing and other guarantees. Clients have varied preferences regarding the pricing model best suited to their needs, and we negotiate these variables to generate an appropriate aggregate level of gross margin. As an example, certain clients may prefer a transparent model whereby more rebates are shared in exchange for higher fees or lower price discounts, while others may prefer steeper price discounts in exchange for lower rebates. We experienced a year-over-year decline in rebate retention reflecting changes in the pricing composition within our contracts, resulting from client contract renewals for approximately 85% of our book of business over the past two years, and the loss of a large mail-order-only client at the end of 2004 which had steeper price discounts and guarantees in lieu of rebate sharing. Gross margin reflects these changes, as well as changes in the generic drug representation, mail or retail com-position in our prescription base, and specialty drug content.
Our product gross margin percentage was 4.3% in 2005 and 4.4% in 2004, with 2005 including four months of Accredo product gross margin. The rate of change in cost of product net revenues was con-sistent with the rate of change in product net revenues for 2005. The consistent rates reflect higher prescription prices charged by pharmaceutical manufacturers offset by the greater utiliza-tion of lower-cost generic products, higher purchasing discounts and operational efficiencies, as well as productivity yielded from our investments in pharmacy and call center technologies. These factors are partially offset in our gross margin percentage by the higher levels of rebate sharing with our clients. The slightly lower product gross margin percentage in 2005 from 2004 also reflects the effect of increased retail volumes with slightly lower mail order volume and the significant level of client contract renewals.
Our product gross margin percentage improved to 4.4% in 2004 from 4.0% in 2003. The lower rate of increase in the cost of product net revenues compared with product net revenues is principally due to higher mail order volumes and greater utilization of lower-cost generic products, operational efficiencies, productivity yielded from our investments in pharmacy and Internet technologies, and increased brand-name pharmaceutical rebates. Our total cost of revenues reflects $27 million in 2004 and $46 million in 2003, pri-marily for additional depreciation and other facility closing costs associated with management decisions in 2003 to realign phar-macy operations.
Rebates from brand-name pharmaceutical manufacturers, which are reflected as a reduction in cost of product net revenues, totaled $3,233 million in 2005, $3,005 million in 2004 and $2,970 million
in 2003, with formulary rebates representing 50.8%, 47.3% and 49.6% of total rebates, respectively. The increase in rebates earned in 2005 reflects improved formulary management and patient compliance, and favorable pharmaceutical manufacturer rebate contract revisions, partially offset by decreased brand-name pre-scription volume. The increase in rebates earned in 2004 reflects the achievement of certain market share requirements in pharma-ceutical manufacturer rebate contracts, partially offset by lower brand-name prescription volume. We retained approximately $855 million, or 26.5% of total rebates in 2005, $1,324 million, or 44.1% in 2004, and $1,593 million, or 53.6% in 2003. The gross margin effect of overall higher rebate sharing levels is partially mitigated by other elements of pricing including higher claims processing, administrative and other client service fees, higher generic dispensing rates, and increased specialty drug volumes.
The service gross margin percentage improved to 75.9% in 2005 from 59.5% in 2004. This variance reflects the increase in service revenues of 27.0% driven by the aforementioned client and other service revenue increases and Accredo manufacturer revenues, partially offset by the termination of a manufacturer-sponsored patient assistance program, as well as a decrease in cost of ser-vice revenues of 24.5%. The decrease in cost of service revenues is primarily related to the terminated patient assistance program, which yielded only marginal profitability. The service gross mar-gin percentage improved to 59.5% in 2004 from 46.0% in 2003, reflecting service revenue decreases of 6.8%, as discussed in the above net revenue analysis, and decreases in cost of service rev-enues of 30.0%. The decrease in cost of service revenues reflects lower prescription information acquisition costs.
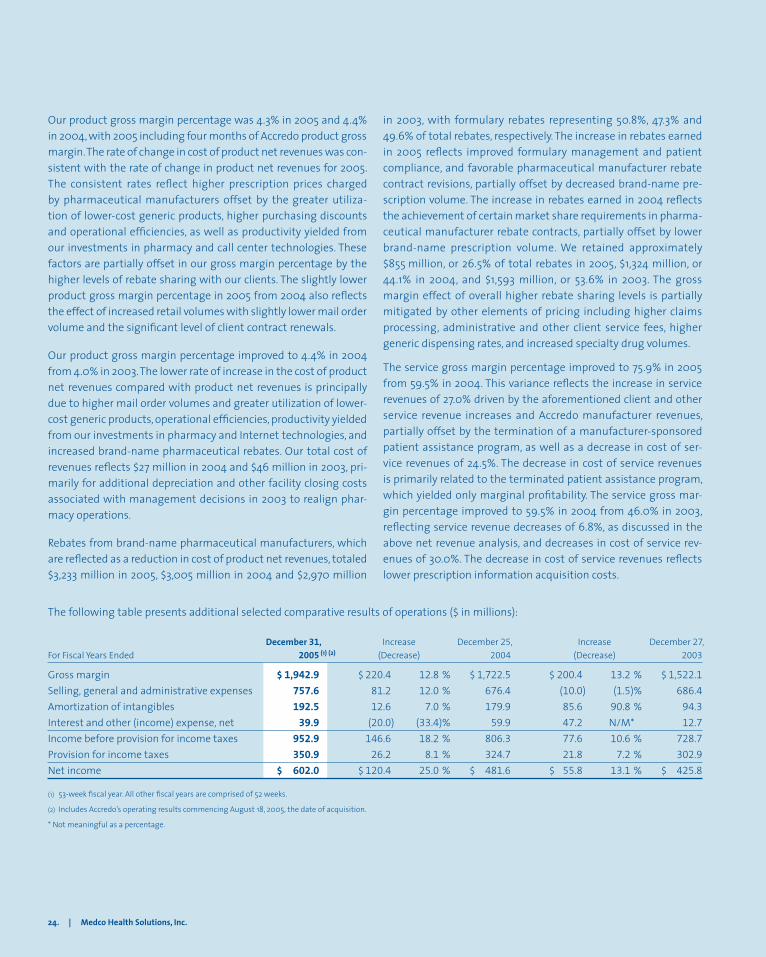
The following table presents additional selected comparative results of operations ($ in millions):
December 31, Increase December 25, Increase December 27, For Fiscal Years Ended 2005 (1) (2) (Decrease) 2004 (Decrease) 2003
Gross margin $ 1,942.9 $ 220.4 12.8 % $ 1,722.5 $ 200.4 13.2 % $ 1,522.1Selling, general and administrative expenses 757.6 81.2 12.0 % 676.4 (10.0) (1.5)% 686.4Amortization of intangibles 192.5 12.6 7.0 % 179.9 85.6 90.8 % 94.3Interest and other (income) expense, net 39.9 (20.0) (33.4)% 59.9 47.2 N/M* 12.7Income before provision for income taxes 952.9 146.6 18.2 % 806.3 77.6 10.6 % 728.7Provision for income taxes 350.9 26.2 8.1 % 324.7 21.8 7.2 % 302.9Net income $ 602.0 $ 120.4 25.0 % $ 481.6 $ 55.8 13.1 % $ 425.8
(1) 53-week fiscal year. All other fiscal years are comprised of 52 weeks.
(2) Includes Accredo’s operating results commencing August 18, 2005, the date of acquisition.
* Not meaningful as a percentage.
24. | Medco Health Solutions, Inc.
Medco Health Solutions, Inc. | 25.
Selling, General and Administrative Expenses. Selling, general and administrative expenses of $758 million for 2005 increased from 2004 by $81 million, or 12.0%. This increase reflects Accredo expenses of $57 million, Medicare Part D preparation expenses of $18 million, the favorable closure of an operating tax exposure of $16 million recorded as a nonrecurring item in 2004, $10 million in increased legal fees, increased litigation expenses of $8 million related to the Ohio State Teachers Retirement System settlement charge recorded in the fourth quarter of 2005, and various other increased expenses of $3 million including the effect of the extra week in fiscal 2005. These were partially offset by the effect of decreased litigation expenses of $21 million related to the multi-state taskforce of attorneys general settlement charge recorded in 2004 and higher 2004 branding campaign expenses of $10 million.
Selling, general and administrative expenses for 2004 of $676 mil-lion decreased from 2003 by $10 million, or 1.5%. This decrease reflects lower corporate severance costs of $22 million associ-ated with the streamlining of certain corporate functions, the aforementioned $16 million favorable closure of an operating tax exposure, reduced expenses for client and third-party litigation of $15 million and other reduced expenses of $4 million. These are partially offset by the aforementioned $21 million recorded in 2004 for the state Attorneys General settlement, as well as increased legal fees of $16 million and the aforementioned branding cam-paign expenses of $10 million.
Amortization of Intangibles. Amortization of intangible assets of $193 million for 2005 increased by $13 million from 2004, primarily reflecting the additional intangible amortization associated with the intangible assets acquired in the Accredo acquisition. Amortization of intangible assets of $180 million for 2004 increased $86 million from 2003 resulting from a re-evaluation of the useful life of the intangible asset that arose in connection with our acquisition by Merck in 1993. In the first quar-ter of 2004, we were notified of client decisions to transition their business to other PBMs by the end of 2004. Because these clients were in our client base at the time of the Merck acquisition and therefore were included in the recorded intangible asset, we re-evaluated the weighted average useful life of the asset. Effective as of the beginning of the 2004 fiscal year, the weighted average useful life was revised from 35 years to 23 years.
Interest and Other (Income) Expense, Net. Interest and other (income) expense, net, for 2005 decreased $20 million from 2004. The variance results from higher interest income of $25 million partially offset by higher interest expense of $5 million. The higher interest income is attributable to higher average daily cash bal-ances resulting from positive operating cash flows and higher interest rates in 2005. The higher interest expense reflects elevated debt levels from a debt refinancing related to the Accredo acqui-sition and higher interest rates on floating rate debt. The 2005 interest expense includes the write-off of $2.7 million of previously deferred debt issuance costs associated with the debt refinancing and discretionary term loan pay downs. Total debt amounted to $1,469 million as of December 31, 2005 compared to $1,193 million as of December 25, 2004. The estimated weighted average interest rate on our indebtedness was approximately 5.7% for 2005 com-pared to 4.7% for 2004 due to increases in the London Interbank Offered Rate (“LIBOR”) on our outstanding debt.
Interest and other (income) expense, net, for 2004 increased $47 million from 2003. The increase reflects higher 2004 interest expense of $40 million and a one-time gain of $11 million from the sale in 2003 of a minority equity investment in a nonpublic com-pany, partially offset by higher 2004 interest income of $4 million. The interest expense variance reflects interest on the debt incurred in connection with the spin-off in August of 2003 and includes a $5.5 million write-off of previously deferred debt issuance costs as the original term loan debt was extinguished and refinanced in March of 2004. The weighted average borrowing rate of the debt outstanding was approximately 4.7% in 2004 and 5.1% in 2003.
Provision for Income Taxes. Our effective tax rate (defined as the percentage relationship of provision for income taxes to income before provision for income taxes) decreased to 36.8% in 2005 compared with 40.3% in 2004 and 41.6% in 2003. The 2005 reduc-tion reflects a $25.7 million nonrecurring tax benefit recorded in the third quarter of 2005 associated with a reduction in our mar-ginal state income tax rate resulting primarily from an enacted change in a state income tax law and the receipt of a favorable state income tax ruling. A reduction in our marginal state income tax rate creates a benefit via a corresponding reduction of our net deferred tax liabilities principally from our net intangible assets, partially offset by our deferred tax assets primarily from client
26. | Medco Health Solutions, Inc.
rebates payable and other accruals. In addition, and largely as a result of state filing positions available as a stand-alone taxpayer as opposed to filing as a member of the Merck consolidated group, the Company expects to achieve additional state income tax savings some of which relate to state income tax payables pro-vided for at the spin-off date from Merck. To the extent that these state tax savings are realized, they will be recorded as a reduction of state income taxes at the time approval is received from the respective state taxing jurisdiction or the applicable statute of limitation has expired.
The 2004 reduction results from the completion during the second quarter of 2004 of a post spin-off study of our state tax position for the apportionment of our income based on our business activi-ties and tax strategies existing as of the date of the spin-off as a stand-alone taxpayer. The study included formalization of our state income tax position through rulings from and discussions with taxing authorities in key selected states.
Net Income and Earnings per Share. Net income as a percentage of net revenues was 1.6% in 2005, 1.4% in 2004 and 1.2% in 2003, as a result of the aforementioned factors.
Basic earnings per share increased 18.1% for 2005. The weighted average shares outstanding were 288.1 million for 2005 and 271.9 million for 2004. Diluted earnings per share increased 17.1% for 2005. The diluted weighted average shares outstanding were 293.5 million for 2005 and 274.7 million for 2004. The increase in the weighted average shares outstanding and diluted weighted average shares outstanding reflect approximately 24 million shares issued in August 2005 for the Accredo acquisition, as well as the issuance of stock under employee stock plans and the dilu-tive effect of outstanding stock options, partially offset by the repurchase of 7.7 million shares.
Specialty Pharmacy Segment. As a result of our acquisition of Accredo on August 18, 2005, we have two reportable segments, PBM and Specialty Pharmacy. Prior to the Accredo acquisition, Medco’s pre-existing specialty pharmacy operations were man-aged as a part of the overall PBM business. For fiscal years 2005,
2004 and 2003, Medco has identified the revenues associated with the specialty pharmacy business based on a data extract of sales for the specialty product set. Specialty Pharmacy total net revenues of approximately $3.6 billion in fiscal 2005 increased by $1.0 billion compared to fiscal 2004 primarily as a result of the Accredo acquisition and volumes from the pre-acquisition spe-cialty pharmacy agreement with Accredo, which commenced in February 2004 and continued through the acquisition. Specialty Pharmacy total net revenues of $2.6 billion in fiscal 2004 increased by $0.8 billion reflecting Medco’s evolving pre-acquisition specialty pharmacy operations including the addition of new products, as well as the Accredo agreement.
Medco has also calculated the estimated Specialty Pharmacy full year operating income for fiscal year 2005 based on the best infor-mation available for the pre-acquisition period and the detailed post-acquisition segment results. In estimating the 2004 and 2003 Specialty Pharmacy operating income, Medco utilized the overall PBM operating income as a percentage to revenue. For 2005, oper-ating income increased $34 million to $99 million reflecting the increased revenue, as well as the higher margin Accredo business. Operating income in 2004 was $65 million compared to $39 mil-lion in 2003.
| BUSINESS TRANSACTIONS WITH MERCK DURING THE MERCK OWNERSHIP PERIOD
We were a wholly-owned subsidiary of Merck from November 18, 1993, through August 19, 2003, the spin-off date. For the major-ity of the period during which we were owned by Merck, Merck provided us with various services, including finance, legal, public affairs, executive oversight, human resources, procurement and other services. Our historical consolidated financial statements for 2003 and prior years include expense allocations related to these services, which diminished as we prepared for the spin-off. These expense allocations are reflected in selling, general and adminis-trative expenses and amounted to $0.4 million for the year-to-date through August 19, 2003 (all of which was recorded in the first quarter of 2003). We consider these allocations to be reasonable
Medco Health Solutions, Inc. | 27.
reflections of the utilization of services provided. We assumed full responsibility for these services and the related expenses prior to the completion of the spin-off.
Prescription drugs purchased from Merck that are dispensed by our mail order pharmacies are included in cost of product net revenues, or in inventory if not yet dispensed. During the periods prior to the spin-off, this inventory from Merck was recorded at a price that we believe approximated the price an unrelated third party would pay. During these periods, purchases from Merck as a percentage of our total cost of revenues remained consistently in the 4% to 5% range. In addition, we record rebates from Merck in cost of revenues based upon the volume of Merck prescription drugs dispensed through our retail pharmacy networks and by our mail order pharmacies. The accounting treatment for the histori-cal transactions with Merck is consistent with how transactions with other third parties have been and continue to be treated.
Our revenues from sales to Merck for PBM and other services were not material in relation to overall revenues during 2003.
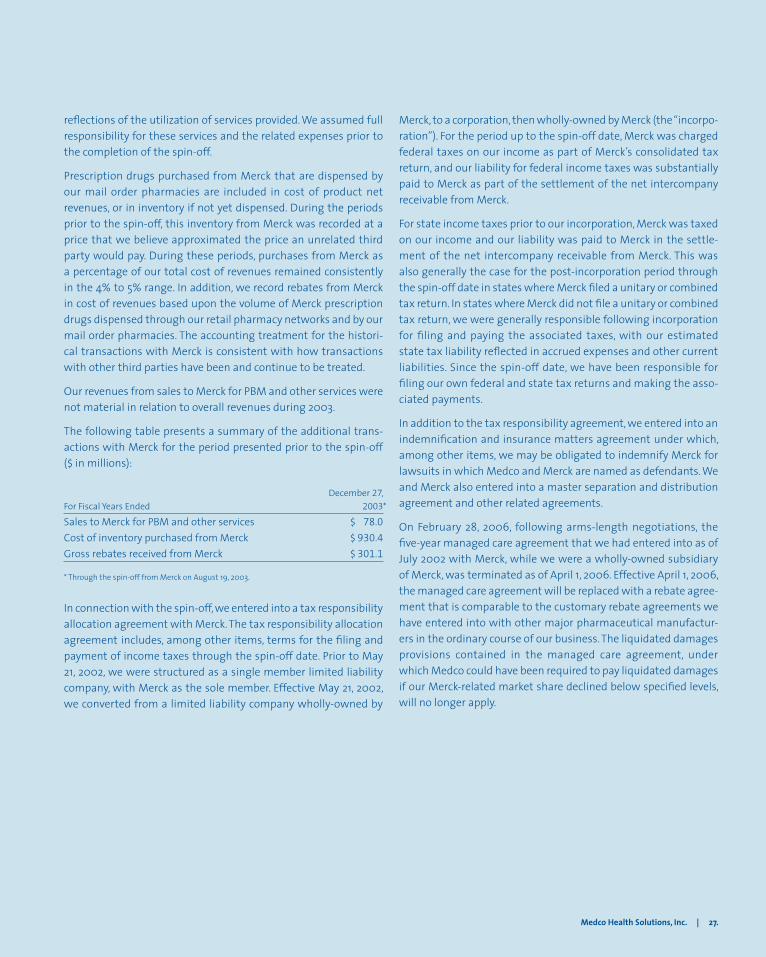
The following table presents a summary of the additional trans-actions with Merck for the period presented prior to the spin-off ($ in millions):
December 27, For Fiscal Years Ended 2003*
Sales to Merck for PBM and other services $ 78.0Cost of inventory purchased from Merck $ 930.4Gross rebates received from Merck $ 301.1
* Through the spin-off from Merck on August 19, 2003.
In connection with the spin-off, we entered into a tax responsibility allocation agreement with Merck. The tax responsibility allocation agreement includes, among other items, terms for the filing and payment of income taxes through the spin-off date. Prior to May 21, 2002, we were structured as a single member limited liability company, with Merck as the sole member. Effective May 21, 2002, we converted from a limited liability company wholly-owned by
Merck, to a corporation, then wholly-owned by Merck (the “incorpo-ration”). For the period up to the spin-off date, Merck was charged federal taxes on our income as part of Merck’s consolidated tax return, and our liability for federal income taxes was substantially paid to Merck as part of the settlement of the net intercompany receivable from Merck.
For state income taxes prior to our incorporation, Merck was taxed on our income and our liability was paid to Merck in the settle-ment of the net intercompany receivable from Merck. This was also generally the case for the post-incorporation period through the spin-off date in states where Merck filed a unitary or combined tax return. In states where Merck did not file a unitary or combined tax return, we were generally responsible following incorporation for filing and paying the associated taxes, with our estimated state tax liability reflected in accrued expenses and other current liabilities. Since the spin-off date, we have been responsible for filing our own federal and state tax returns and making the asso-ciated payments.
In addition to the tax responsibility agreement, we entered into an indemnification and insurance matters agreement under which, among other items, we may be obligated to indemnify Merck for lawsuits in which Medco and Merck are named as defendants. We and Merck also entered into a master separation and distribution agreement and other related agreements.
On February 28, 2006, following arms-length negotiations, the five-year managed care agreement that we had entered into as of July 2002 with Merck, while we were a wholly-owned subsidiary of Merck, was terminated as of April 1, 2006. Effective April 1, 2006, the managed care agreement will be replaced with a rebate agree-ment that is comparable to the customary rebate agreements we have entered into with other major pharmaceutical manufactur-ers in the ordinary course of our business. The liquidated damages provisions contained in the managed care agreement, under which Medco could have been required to pay liquidated damages if our Merck-related market share declined below specified levels, will no longer apply.
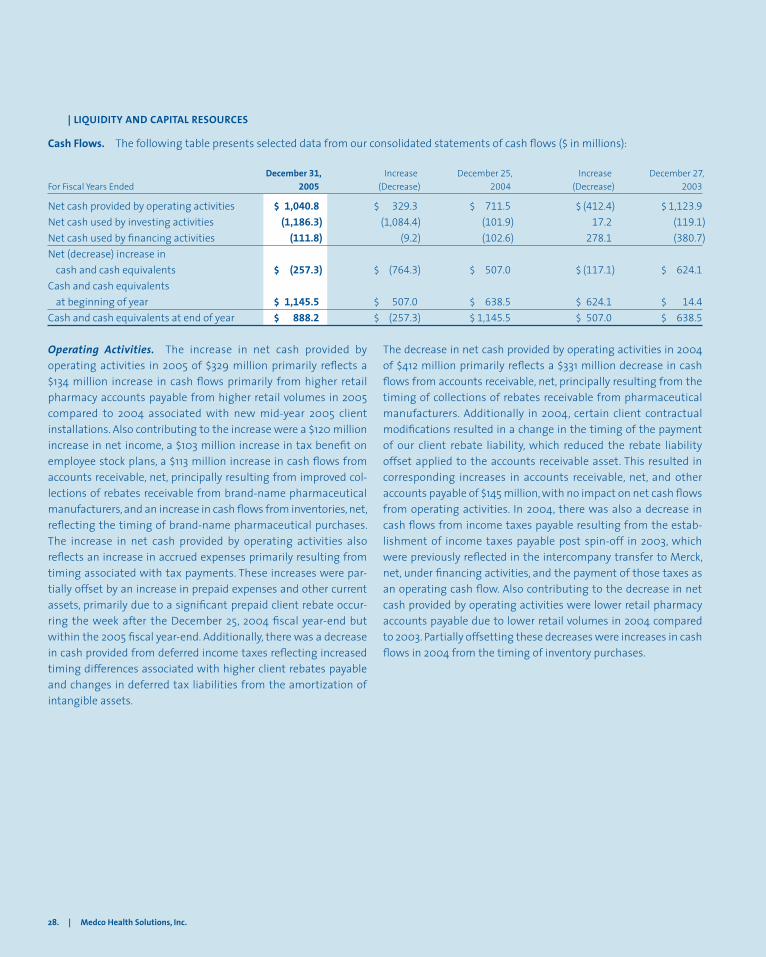
28. | Medco Health Solutions, Inc.
Operating Activities. The increase in net cash provided by operating activities in 2005 of $329 million primarily reflects a $134 million increase in cash flows primarily from higher retail pharmacy accounts payable from higher retail volumes in 2005 compared to 2004 associated with new mid-year 2005 client installations. Also contributing to the increase were a $120 million increase in net income, a $103 million increase in tax benefit on employee stock plans, a $113 million increase in cash flows from accounts receivable, net, principally resulting from improved col-lections of rebates receivable from brand-name pharmaceutical manufacturers, and an increase in cash flows from inventories, net, reflecting the timing of brand-name pharmaceutical purchases. The increase in net cash provided by operating activities also reflects an increase in accrued expenses primarily resulting from timing associated with tax payments. These increases were par-tially offset by an increase in prepaid expenses and other current assets, primarily due to a significant prepaid client rebate occur-ring the week after the December 25, 2004 fiscal year-end but within the 2005 fiscal year-end. Additionally, there was a decrease in cash provided from deferred income taxes reflecting increased timing differences associated with higher client rebates payable and changes in deferred tax liabilities from the amortization of intangible assets.
The decrease in net cash provided by operating activities in 2004 of $412 million primarily reflects a $331 million decrease in cash flows from accounts receivable, net, principally resulting from the timing of collections of rebates receivable from pharmaceutical manufacturers. Additionally in 2004, certain client contractual modifications resulted in a change in the timing of the payment of our client rebate liability, which reduced the rebate liability offset applied to the accounts receivable asset. This resulted in corresponding increases in accounts receivable, net, and other accounts payable of $145 million, with no impact on net cash flows from operating activities. In 2004, there was also a decrease in cash flows from income taxes payable resulting from the estab-lishment of income taxes payable post spin-off in 2003, which were previously reflected in the intercompany transfer to Merck, net, under financing activities, and the payment of those taxes as an operating cash flow. Also contributing to the decrease in net cash provided by operating activities were lower retail pharmacy accounts payable due to lower retail volumes in 2004 compared to 2003. Partially offsetting these decreases were increases in cash flows in 2004 from the timing of inventory purchases.
| LIQUIDITY AND CAPITAL RESOURCES
Cash Flows. The following table presents selected data from our consolidated statements of cash flows ($ in millions):
December 31, Increase December 25, Increase December 27, For Fiscal Years Ended 2005 (Decrease) 2004 (Decrease) 2003
Net cash provided by operating activities $ 1,040.8 $ 329.3 $ 711.5 $ (412.4) $ 1,123.9Net cash used by investing activities (1,186.3) (1,084.4) (101.9) 17.2 (119.1)Net cash used by financing activities (111.8) (9.2) (102.6) 278.1 (380.7)Net (decrease) increase in cash and cash equivalents $ (257.3) $ (764.3) $ 507.0 $ (117.1) $ 624.1Cash and cash equivalents at beginning of year $ 1,145.5 $ 507.0 $ 638.5 $ 624.1 $ 14.4Cash and cash equivalents at end of year $ 888.2 $ (257.3) $ 1,145.5 $ 507.0 $ 638.5
Medco Health Solutions, Inc. | 29.
Through the spin-off date of August 19, 2003, net cash from oper-ating activities excluded various items paid to or by Merck on our behalf, such as tax payments made by Merck, and other items, which are reflected in the intercompany transfer from (to) Merck, net, in our cash flows from financing activities for 2003. Amounts so reflected for taxes paid by Merck, which represent our federal income tax provision and state income tax provision in states where Merck filed a unitary or combined return, were $137 million through the spin-off date of August 19, 2003. Accordingly, our net cash from operating activities does not fully reflect what our cash flows would have been had we been a separate company prior to August 19, 2003. Subsequent to August 19, 2003, tax payments are reflected in our net cash flows from operating activities.
Investing Activities. The increase in net cash used by investing activities in 2005 of $1,084 million is primarily due to $989 mil-lion paid (net of cash acquired) for the Accredo acquisition and $72.5 million paid for selected assets of Pediatric Services of America, Inc. (“Pediatric Services”). Capital expenditures increased by $34.0 million in 2005 primarily due to capitalized software development for client-related programs and strategic initiatives, Accredo-related fixed assets, and investments in our business recovery systems. The decrease in net cash used by investing activ-ities in 2004 of $17 million primarily results from reduced capital expenditures of $27 million, which reflects the further leveraging of capital investments made in previous years.
Purchases and proceeds from securities and other investments, which relate to investment activities of our insurance companies, are balanced in all years presented.
Financing Activities. The increase in net cash used by financing activities in 2005 of $9 million is primarily due to $407 million in treasury stock repurchases, and higher debt pay downs of $265 million, partially offset by a net increase in proceeds on debt of $400 million, as well as an increase in proceeds from employee stock plans of $262 million.
Net cash used by financing activities in 2005 reflects the Accredo acquisition and the related refinancing of the bank credit facilities, which included an extinguishment of the existing $460 million senior secured credit facility and proceeds from a new $750 mil-lion senior unsecured term loan under a $1.25 billion senior unsecured credit agreement. Net cash used by financing activities also reflects a $450 million short-term debt draw down under the accounts receivable financing facility, also in connection with the Accredo acquisition. The proceeds from the new term loan and the draw down under the accounts receivable financing facility comprised the financed portion of the $1.1 billion cash component of the Accredo purchase price. We also paid down $346 million of acquired Accredo debt. Prior to the acquisition date, we paid down $240 million of the existing term loans, including additional discre-tionary payments of $180 million. Subsequent to the acquisition date we paid down $219 million of the new term loans, including additional discretionary payments of $200 million.
The decrease in net cash used by financing activities in 2004 of $278 million primarily results from 2003 transactions associated with the spin-off, including the payment of a $2.0 billion parting cash dividend to Merck, net proceeds from debt of $1,496 million and the settlement of the intercompany receivable from Merck. In addition, during 2004, we paid down $200 million of the out-standing debt, which was partially offset by proceeds from stock issued under employee stock plans.
In 2004, we entered into interest rate swap agreements on $200 million of the $500 million in 7.25% senior notes. These swap agreements were entered into as an effective hedge to (i) convert a portion of the senior note fixed rate debt into floating rate debt; (ii) maintain a capital structure containing appropriate amounts of fixed and floating rate debt; and (iii) lower the interest expense on these notes in the near term. There are no current plans to enter into further swap agreements. We do not expect our cash flows to be affected to any significant degree by a sudden change in market interest rates.
30. | Medco Health Solutions, Inc.
The estimated weighted average annual interest rate on our indebtedness was approximately 5.7% in 2005, 4.7% in 2004 and 5.1% in 2003. Several factors could change the weighted average annual interest rate, including but not limited to a change in refer-ence rates used under our credit facilities and swap agreements. A 25 basis point change in the weighted average annual interest rate relating to the credit facilities’ balances outstanding and interest rate swap agreements as of December 31, 2005, which are subject to variable interest rates based on the LIBOR and the commercial paper rate, would yield a $3.0 million change in annual interest expense.
Our senior unsecured credit facility, senior notes and accounts receivable financing facility contain covenants, including, among other items, minimum interest coverage, maximum leverage ratios, as well as restrictions on dividends, share repurchases, and asset sales and liens. We were in compliance with all finan-cial covenants at December 31, 2005. We may incur additional indebtedness by drawing down under our senior unsecured revolving credit facility or accounts receivable financing facility. At December 31, 2005, we had approximately $484.6 million available for borrowing under our senior unsecured revolving credit facility, exclusive of approximately $15.4 million in issued letters of credit, and $50 million available for borrowing under our accounts receiv-able financing facility.
Total cash and short-term investments as of December 31, 2005 were $945 million, including $888 million in cash and cash equiv-alents. Total cash and short-term investments as of December 25, 2004 were $1,211 million, including $1,146 million in cash and cash equivalents. The decrease of $266 million in cash and short-term investments in 2005 reflects the purchase of Accredo and, to a significantly lesser extent, the purchase of selected assets of
Pediatric Services and share repurchase activity, partially offset by positive cash flows from operations and proceeds from employee stock plans.
| EBITDA
We calculate and use EBITDA and EBITDA per adjusted prescrip-tion as indicators of our ability to generate cash from our reported operating results. These measurements are used in concert with net income and cash flows from operations, which measure actual cash generated in the period. In addition, we believe that EBITDA and EBITDA per adjusted prescription are supplemental measure-ment tools used by analysts and investors to help evaluate overall operating performance and the ability to incur and service debt and make capital expenditures. EBITDA does not represent funds avail-able for our discretionary use and is not intended to represent or to be used as a substitute for net income or cash flows from opera-tions data as measured under U.S. generally accepted accounting principles (“GAAP”). The items excluded from EBITDA but included in the calculation of our reported net income are significant com-ponents of our consolidated statements of income, and must be considered in performing a comprehensive assessment of our overall financial performance. EBITDA, and the associated year-to-year trends, should not be considered in isolation. Our calculation of EBITDA may not be consistent with calculations of EBITDA used by other companies.
EBITDA per adjusted prescription is calculated by dividing EBITDA by the adjusted prescription volume for the period. This measure is used as an indicator of our EBITDA performance on a per-unit basis, providing insight into the cash-generating potential of each prescription. EBITDA per adjusted prescription reflects the level of efficiency in the business and is affected by changes in prescription
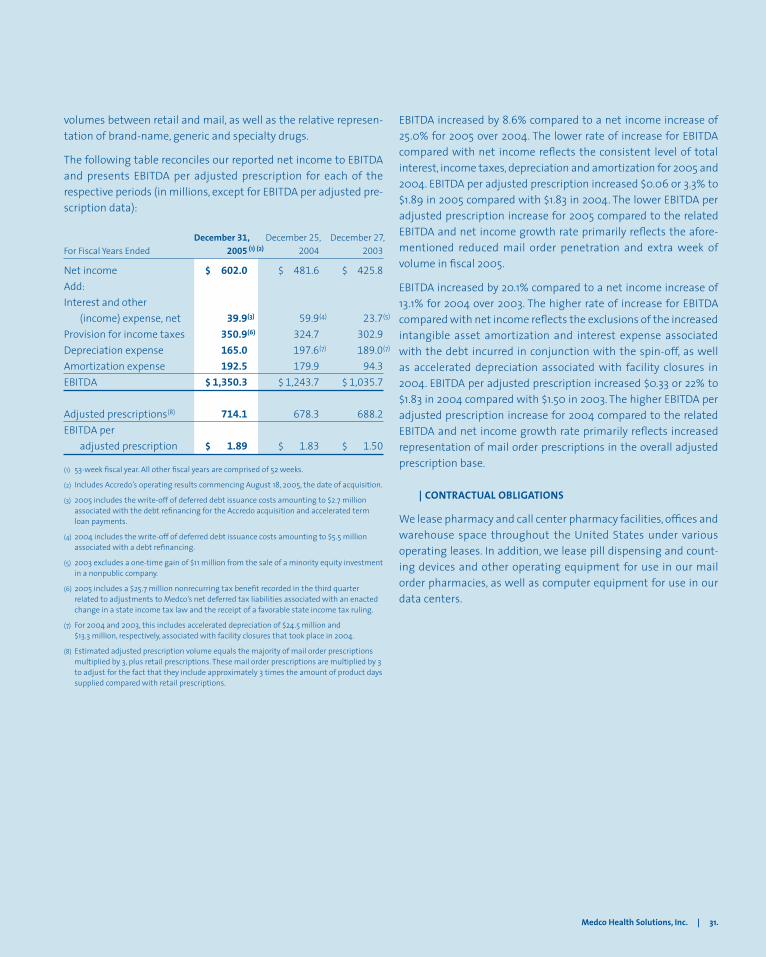
Medco Health Solutions, Inc. | 31.
EBITDA increased by 8.6% compared to a net income increase of 25.0% for 2005 over 2004. The lower rate of increase for EBITDA compared with net income reflects the consistent level of total interest, income taxes, depreciation and amortization for 2005 and 2004. EBITDA per adjusted prescription increased $0.06 or 3.3% to $1.89 in 2005 compared with $1.83 in 2004. The lower EBITDA per adjusted prescription increase for 2005 compared to the related EBITDA and net income growth rate primarily reflects the afore-mentioned reduced mail order penetration and extra week of volume in fiscal 2005.
EBITDA increased by 20.1% compared to a net income increase of 13.1% for 2004 over 2003. The higher rate of increase for EBITDA compared with net income reflects the exclusions of the increased intangible asset amortization and interest expense associated with the debt incurred in conjunction with the spin-off, as well as accelerated depreciation associated with facility closures in 2004. EBITDA per adjusted prescription increased $0.33 or 22% to $1.83 in 2004 compared with $1.50 in 2003. The higher EBITDA per adjusted prescription increase for 2004 compared to the related EBITDA and net income growth rate primarily reflects increased representation of mail order prescriptions in the overall adjusted prescription base.
| CONTRACTUAL OBLIGATIONS
We lease pharmacy and call center pharmacy facilities, offices and warehouse space throughout the United States under various operating leases. In addition, we lease pill dispensing and count-ing devices and other operating equipment for use in our mail order pharmacies, as well as computer equipment for use in our data centers.
volumes between retail and mail, as well as the relative represen-tation of brand-name, generic and specialty drugs.
The following table reconciles our reported net income to EBITDA and presents EBITDA per adjusted prescription for each of the respective periods (in millions, except for EBITDA per adjusted pre-scription data):
December 31, December 25, December 27, For Fiscal Years Ended 2005 (1) (2) 2004 2003
Net income $ 602.0 $ 481.6 $ 425.8Add:Interest and other (income) expense, net 39.9(3) 59.9(4) 23.7(5)
Provision for income taxes 350.9(6) 324.7 302.9Depreciation expense 165.0 197.6(7) 189.0(7)
Amortization expense 192.5 179.9 94.3EBITDA $ 1,350.3 $ 1,243.7 $ 1,035.7
Adjusted prescriptions(8) 714.1 678.3 688.2EBITDA per adjusted prescription $ 1.89 $ 1.83 $ 1.50
(1) 53-week fiscal year. All other fiscal years are comprised of 52 weeks.
(2) Includes Accredo’s operating results commencing August 18, 2005, the date of acquisition.
(3) 2005 includes the write-off of deferred debt issuance costs amounting to $2.7 million associated with the debt refinancing for the Accredo acquisition and accelerated term loan payments.
(4) 2004 includes the write-off of deferred debt issuance costs amounting to $5.5 million associated with a debt refinancing.
(5) 2003 excludes a one-time gain of $11 million from the sale of a minority equity investment in a nonpublic company.
(6) 2005 includes a $25.7 million nonrecurring tax benefit recorded in the third quarter related to adjustments to Medco’s net deferred tax liabilities associated with an enacted change in a state income tax law and the receipt of a favorable state income tax ruling.
(7) For 2004 and 2003, this includes accelerated depreciation of $24.5 million and $13.3 million, respectively, associated with facility closures that took place in 2004.
(8) Estimated adjusted prescription volume equals the majority of mail order prescriptions multiplied by 3, plus retail prescriptions. These mail order prescriptions are multiplied by 3 to adjust for the fact that they include approximately 3 times the amount of product days supplied compared with retail prescriptions.
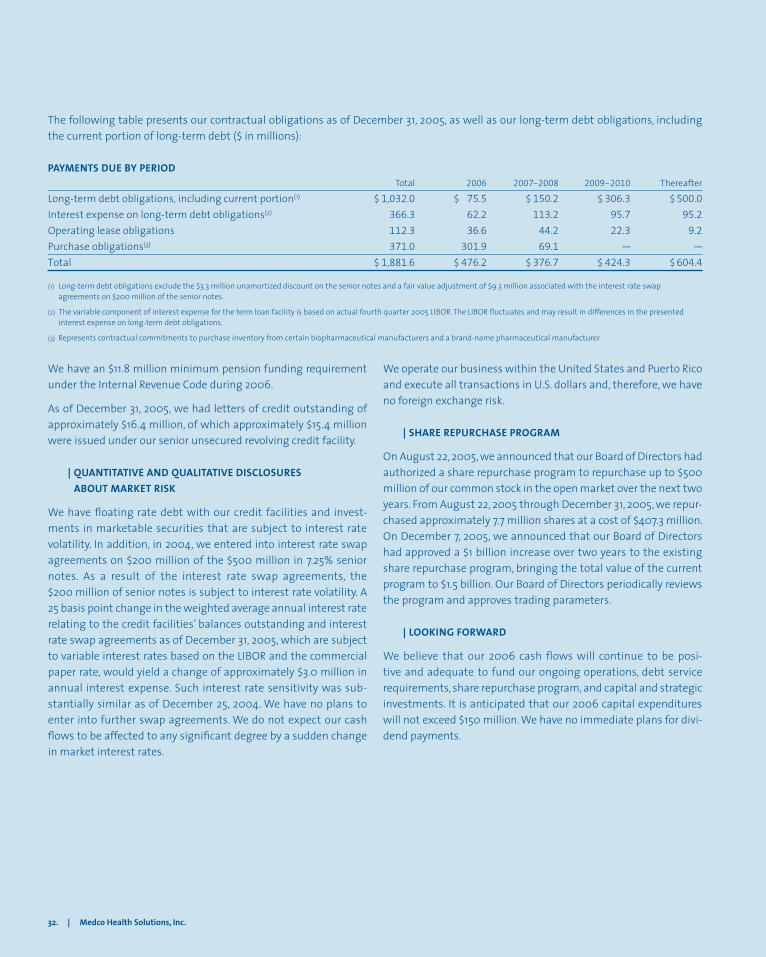
32. | Medco Health Solutions, Inc.
We have an $11.8 million minimum pension funding requirement under the Internal Revenue Code during 2006.
As of December 31, 2005, we had letters of credit outstanding of approximately $16.4 million, of which approximately $15.4 million were issued under our senior unsecured revolving credit facility.
| QUANTITATIVE AND QUALITATIVE DISCLOSURES ABOUT MARKET RISK
We have floating rate debt with our credit facilities and invest-ments in marketable securities that are subject to interest rate volatility. In addition, in 2004, we entered into interest rate swap agreements on $200 million of the $500 million in 7.25% senior notes. As a result of the interest rate swap agreements, the $200 million of senior notes is subject to interest rate volatility. A 25 basis point change in the weighted average annual interest rate relating to the credit facilities’ balances outstanding and interest rate swap agreements as of December 31, 2005, which are subject to variable interest rates based on the LIBOR and the commercial paper rate, would yield a change of approximately $3.0 million in annual interest expense. Such interest rate sensitivity was sub-stantially similar as of December 25, 2004. We have no plans to enter into further swap agreements. We do not expect our cash flows to be affected to any significant degree by a sudden change in market interest rates.
We operate our business within the United States and Puerto Rico and execute all transactions in U.S. dollars and, therefore, we have no foreign exchange risk.
| SHARE REPURCHASE PROGRAM
On August 22, 2005, we announced that our Board of Directors had authorized a share repurchase program to repurchase up to $500 million of our common stock in the open market over the next two years. From August 22, 2005 through December 31, 2005, we repur-chased approximately 7.7 million shares at a cost of $407.3 million. On December 7, 2005, we announced that our Board of Directors had approved a $1 billion increase over two years to the existing share repurchase program, bringing the total value of the current program to $1.5 billion. Our Board of Directors periodically reviews the program and approves trading parameters.
| LOOKING FORWARD
We believe that our 2006 cash flows will continue to be posi-tive and adequate to fund our ongoing operations, debt service requirements, share repurchase program, and capital and strategic investments. It is anticipated that our 2006 capital expenditures will not exceed $150 million. We have no immediate plans for divi-dend payments.
The following table presents our contractual obligations as of December 31, 2005, as well as our long-term debt obligations, including the current portion of long-term debt ($ in millions):
PAYMENTS DUE BY PERIOD Total 2006 2007-2008 2009-2010 Thereafter
Long-term debt obligations, including current portion(1) $ 1,032.0 $ 75.5 $ 150.2 $ 306.3 $ 500.0Interest expense on long-term debt obligations(2) 366.3 62.2 113.2 95.7 95.2Operating lease obligations 112.3 36.6 44.2 22.3 9.2Purchase obligations(3) 371.0 301.9 69.1 — — Total $ 1,881.6 $ 476.2 $ 376.7 $ 424.3 $ 604.4
(1) Long-term debt obligations exclude the $3.3 million unamortized discount on the senior notes and a fair value adjustment of $9.3 million associated with the interest rate swap agreements on $200 million of the senior notes.
(2) The variable component of interest expense for the term loan facility is based on actual fourth quarter 2005 LIBOR. The LIBOR fluctuates and may result in differences in the presented interest expense on long-term debt obligations.
(3) Represents contractual commitments to purchase inventory from certain biopharmaceutical manufacturers and a brand-name pharmaceutical manufacturer.
Medco Health Solutions, Inc. | 33.
| USE OF ESTIMATES AND CRITICAL ACCOUNTING POLICIES AND ESTIMATES
Use of Estimates. The preparation of consolidated financial state-ments requires companies to include certain amounts that are based on management’s best estimates and judgments. In prepar-ing the consolidated financial statements, management reviewed its accounting policies and believes that these accounting policies are appropriate for a fair presentation of our financial position, results of operations and of cash flows. Several of these account-ing policies contain estimates, the most significant of which are discussed below. Actual results may differ from those estimates, and it is possible that future results of operations for any particu-lar quarterly or annual period could be materially affected by the ultimate actual results. We discuss the impact and any associated risks related to these policies on our business operations through-out this “Management’s Discussion and Analysis” section.
Critical Accounting Policies and Estimates. We describe below what we believe to be our critical accounting policies. (See also Note 2, “Summary of Significant Accounting Policies,” to our con-solidated financial statements included in this annual report.)
Revenue Recognition. Our product net revenues are derived prin-cipally from sales of prescription drugs to our clients and members, either through our networks of contractually affiliated retail phar-macies or our mail order pharmacies. Specialty pharmacy product net revenues represent revenues from the sale of primarily bio-pharmaceutical drugs and are reported at the net amount billed to third-party payors and patients. We recognize product revenues when the prescriptions are dispensed through retail pharmacies in our contractually affiliated networks or our mail order pharma-cies and received by members and patients. We have determined that our responsibilities under our client contracts to adjudicate member claims properly and control clients’ drug spend, our sepa-rate contractual pricing relationships and responsibilities to the retail pharmacies in our networks, and our interaction with clients’ members, among other indicators, qualify us as the principal under the indicators set forth in EITF 99-19, “Reporting Gross Revenue as a Principal vs. Net as an Agent,” in most of our transactions with clients. Our responsibilities under our client contracts include vali-dating that the patient is a member of the client’s plan and that the prescription drug is in the applicable formulary, instructing the pharmacist as to the prescription price and the co-payment due from the patient who is a member of a client’s plan, identifying possible adverse drug interactions for the pharmacist to address
with the physician prior to dispensing, suggesting medically appropriate generic alternatives to control drug cost to our clients and their members, and approving the prescription for dispensing. We recognize revenues from our retail network contracts where we are the principal, and our mail order pharmacies, on a gross reporting basis, in accordance with EITF 99-19 at the prescription price (ingredient cost plus dispensing fee) negotiated with our clients, including the portion of the price to be settled directly by the member (co-payment) plus our administrative fees. Although we do not have credit risk with respect to retail co-payments, all of the above indicators of gross treatment are present. In addi-tion, we view these co-payments as a plan design mechanism that we evaluate in concert with our clients to help them manage their retained prescription drug spending costs, and the level of co-payments does not affect our rebates or margin on the transac-tion. In the limited instances where the terms of our contracts and nature of our involvement in the prescription fulfillment process do not qualify us as a principal under EITF 99-19, our revenues on those transactions consist of the administrative fee paid to us by our clients.
We deduct from our revenues the manufacturers’ rebates that are earned by our clients based on their members’ utilization of brand-name formulary drugs. We estimate these rebates at period-end based on actual and estimated claims data and our estimates of the manufacturers’ rebates earned by our clients. We base our estimates on the best available data at period-end and recent his-tory for the various factors that can affect the amount of rebates due to the client. We adjust our rebates payable to clients to the actual amounts paid when these rebates are paid, generally on a quarterly basis, or as significant events occur. We record any cumu-lative effect of these adjustments against revenues as identified, and adjust our estimates prospectively to consider recurring mat-ters. Adjustments generally result from contract changes with our clients, differences between the estimated and actual product mix subject to rebates or whether the product was included in the applicable formulary. Adjustments to our estimates have not been material to our quarterly or annual results of operations. We also deduct from our revenues discounts offered and guarantees regarding the level of service the Company will provide to the cli-ent or member or the minimum level of rebates or discounts the client will receive, as well as other payments made to our clients. Other payments include, for example, implementation allowances and payments related to performance guarantees. Where we pro-vide implementation or other allowances to clients upon contract
34. | Medco Health Solutions, Inc.
initiation, we capitalize these payments and amortize them, gen-erally on a straight-line basis, over the life of the contract as a reduction of revenue. These payments are capitalized only in cases where they are refundable upon cancellation or relate to noncan-celable contracts.
Service revenues consist principally of administrative fees and clini-cal program fees earned from clients and other non-product related revenues, sales of prescription services and data to pharmaceuti-cal manufacturers and other parties, and performance-oriented fees paid by specialty pharmacy manufacturers. Client adminis-trative fees are earned for services that are comprised of claims processing, eligibility management, benefits management, phar-macy network management and other related customer services. Service revenues are recorded when performance occurs and col-lectibility is assured.
Rebates Receivable and Payable. Rebates receivable from phar-maceutical manufacturers are earned based upon the dispensing of prescriptions at either pharmacies in our retail networks or our mail order pharmacies, are recorded as a reduction of cost of revenues and are included in accounts receivable, net. We accrue rebates receivable by multiplying estimated rebatable prescription drugs dispensed by the pharmacies in our retail networks, or dis-pensed by our mail order pharmacies, by the contractually agreed manufacturer rebate amount, which in certain cases may be based on estimated market share data. We revise rebates receivable esti-mates to actual, with the difference recorded to cost of revenues, when third party market share data is available and final rebatable prescriptions are calculated, and rebates are billed to the manu-facturer, generally 30 to 90 days subsequent to the end of the applicable quarter. Historically, the effect of adjustments result-ing from the reconciliation of our estimated rebates recognized and recorded to actual amounts billed has not been material to our results of operations. Rebates payable to clients are estimated and accrued based upon the prescription drugs dispensed by the pharmacies in our retail networks or by our mail order pharmacies. Rebates are generally paid to clients on a quarterly basis after col-lection of rebates receivable from manufacturers, at which time rebates payable are revised to reflect amounts due. Certain cli-ents prefer to receive their rebates on a more accelerated basis in exchange for other pricing elements. Typically, our client contracts give the client the right to audit our calculation of pharmaceuti-cal manufacturers’ rebates passed back to them. In addition, our contracts with pharmaceutical manufacturers generally give the
manufacturer the right to audit our calculation of amounts billed to them. Historically, adjustments related to these audits have not been material.
Contract Profitability. We perform detailed client profitability modeling prior to finalizing pricing terms with our clients and monitor contract profitability periodically throughout the term of each contract. If the contract would result in a loss over its dura-tion, we would record a charge to earnings immediately for the entire amount of the loss.
Allowance for Doubtful Accounts and Contractual Allowances. Historically, our PBM allowance for doubtful accounts has been negligible because of the contractual obligation for clients to pay outstanding accounts receivable in short duration. The Accredo specialty business has a different accounts receivable profile than our traditional PBM business and is characterized by slower accounts receivable turnover. The products and services are often covered through medical benefit programs with the primary payors being insurance companies and government programs. These payors typically have a longer claims processing cycle and the ultimate payor may not be initially identified until after sev-eral iterations with government and private payors. Additionally, patient co-payments and deductibles are typically higher reflect-ing the higher product costs. As a result, there is a higher risk profile to Accredo’s accounts receivable than the PBM accounts receivable profile.
We estimate the allowance for doubtful accounts based upon a variety of factors including the age of the outstanding receiv-ables, trends of cash collections and bad debt write-offs, and our historical experience of collecting the patient co-payments and deductibles. We apply these factors to the methodology we believe is best suited for each identifiable pool of receivables. These meth-odologies are applied on a consistent basis and include a write-off model, specific account reviews and a lagged historical collection model. Also, we validate the results of the historical collection and write-off method by using a comparison of subsequent cash receipts to the net book value of our accounts receivable. In addi-tion, for all of our accounts, we consider current qualitative and quantitative market factors that could impact their net realiz-able value. Economic, patient, payor changes in reimbursement and other factors could result in collections that differ from our estimates. Based on these factors, we continually review the esti-mation process and make changes to the estimates as necessary.
Medco Health Solutions, Inc. | 35.
Income Taxes. As described previously in our “Business Transac-tions with Merck during the Merck Ownership Period” section, Merck was responsible through the spin-off date for the filing of federal income taxes, and state income taxes where Merck filed a unitary or combined return. As described further in Note 9, “Taxes on Income,” to our consolidated financial statements included in this annual report, under the terms of the tax responsibility alloca-tion agreement with Merck, we are responsible for the payment of federal income taxes and all state income taxes on income earned subsequent to the spin-off date, except that we are also generally responsible for state income taxes on income earned subsequent to the May 2002 date of the incorporation in states where Merck did not file a unitary or combined return. These federal and state income tax liabilities are reflected in accrued expenses and other current liabilities. Merck is responsible for the payment of federal and state income taxes on income earned prior to the afore-mentioned transition dates. We record deferred tax assets and liabilities based on temporary differences between the financial statement basis and the tax basis of assets and liabilities using presently enacted tax rates.
As a result of our incorporation in May 2002 and our spin-off from Merck in August 2003, we do not have substantial tax filing history as an independent company. Our taxable income and apportion-ment rates by state represent significant estimates reflected in our tax provision.
Property and Equipment. We state property and equipment at cost less accumulated depreciation and amortization. We calcu-late depreciation using the straight-line method for assets with useful lives ranging from three to 45 years. We amortize leasehold improvements over the shorter of the remaining life of the lease or the useful lives of the assets.
Software Developed for Internal Use. We invest significantly in developing software to enhance operations and meet the needs of our clients. We apply the American Institute of Certified Public Accountants Statement of Position 98-1, “Accounting for the Costs of Computer Software Developed or Obtained for Internal Use.” Certain costs of computer software developed or obtained for internal use are capitalized and amortized on a straight-line basis over three to five years. Costs for general and administrative expenses, overhead, maintenance and training, as well as the cost of software coding that does not add functionality to the existing system, are expensed as incurred.
Goodwill and Intangible Assets. Goodwill primarily represents the push-down of the excess of acquisition costs over the fair value of our net assets from our acquisition by Merck in 1993, the excess of the Accredo purchase price over net assets acquired, and, to a significantly lesser extent, our acquisition of ProVantage Health Services, Inc. in 2000 and selected assets of Pediatric Services of America, Inc. in 2005. We test our goodwill for impairment on an annual basis, or whenever events, such as a protracted decline in our stock price or other changes in circumstances indicate that the carrying amount may not be recoverable, using a two-step fair-value based test. The most recent assessment of goodwill impairment for each of the designated reporting units was per-formed as of September 24, 2005, and the recorded goodwill was determined not to be impaired.
Our intangible assets primarily represent the value of client rela-tionships that was recorded upon our acquisition in 1993 by Merck and intangible assets recorded from our acquisition of Accredo. These assets are reviewed for impairment whenever events, such as losses of significant clients or biopharmaceutical manufacturer contracts, or other changes in circumstances indicate that the car-rying amount may not be recoverable. When these events occur, we compare the carrying amount of the assets to the undiscounted pre-tax expected future cash flows derived from the lowest appro-priate asset grouping. If this comparison indicates that there is an impairment, the amount of the impairment is calculated using discounted expected future cash flows. We continually assess the useful lives of our intangible assets, taking into account historical client turnover experience, including recent losses of clients and expected future losses. Effective as of the beginning of fiscal year 2003, we revised the weighted average useful life of the Merck intangible asset from 38 to 35 years, with the annual intangible asset amortization expense increasing by $9.4 million compared to 2002. Effective as of the beginning of the 2004 fiscal year, the weighted average useful life was revised from 35 years to 23 years, with the annual intangible asset amortization expense increasing to $179.9 million from $94.3 million in 2003. Amortization of intan-gible assets of $192.5 million for 2005 increased by $12.6 million as a result of additional amortization primarily associated with the intangible assets acquired in the Accredo acquisition.
Pension and Other Postretirement Benefit Plans. Pension and other postretirement benefit plan information for financial report-ing purposes is calculated using actuarial assumptions, including a discount rate for plan benefit obligations and an expected rate of return on pension plan assets.
36. | Medco Health Solutions, Inc.
We reassess our benefit plan assumptions on a regular basis. For both the pension and other postretirement benefit plans, the discount rate is evaluated annually and modified to reflect the prevailing market rate at the end of our fiscal year of a portfolio of high quality (AA and above) fixed-income debt instruments that would provide the future cash flows needed to pay the benefits included in the benefit obligation as they come due. At December 31, 2005, we changed the discount rate to 5.5% from 5.75% for our pension and other postretirement benefit plans to reflect the prevailing market interest rate environment. The discount rate assumption is determined by considering a portfolio of high-quality corporate bond investments that would provide the future cash flows needed to settle benefit obligations as they came due.
The expected rate of return for the pension plan represents the average rate of return to be earned on the plan assets over the period the benefits included in the benefit obligation are to be paid. In developing the expected rate of return, we consider long-term compounded annualized returns of historical market data, as well as historical actual returns on our plan assets. Using this reference information, we develop forward-looking return expec-tations for each asset category and a weighted average expected long-term rate of return for a targeted portfolio allocated across these investment categories. As a result of this analysis, for 2006, we will maintain the expected rate of return assumption of 8.0% for our pension plan.
Actuarial assumptions are based on management’s best estimates and judgment. A reasonably possible change of plus (minus) 25 basis points in the discount rate assumption, with other assump-tions held constant, would have an estimated $0.6 million favorable (unfavorable) impact on net pension and postretire-ment benefit cost. A reasonably possible change of plus (minus) 25 basis points in the expected rate of return assumption, with other assumptions held constant, would have an estimated $0.25 mil-lion favorable (unfavorable) impact on net pension cost.
We amended the postretirement healthcare benefit plan in 2003, which reduced benefit obligations, the effect of which is reflected in the amortization of prior service costs component of the net postretirement benefit cost.
For additional information on pension and other postretirement benefit plans, see Note 8, “Pension and Other Postretirement Benefits,” to our consolidated financial statements included in this annual report.
Contingencies. We are currently involved in various legal proceed-ings and other disputes with third parties that arise from time to time in the ordinary course of business. We have considered these proceedings and disputes in determining the necessity of any reserves for losses that are probable and reasonably estimable in accordance with SFAS No. 5, “Accounting for Contingencies.” Our recorded reserves are based on estimates developed with consider-ation given to the potential merits of claims, the range of possible settlements, advice from outside counsel, and management’s strategy with regard to the settlement of such claims or defense against such claims. For additional information on contingencies, see Note 14, “Commitments and Contingencies,” to our consoli-dated financial statements included in this annual report.
| EFFECTS OF RECENT ACCOUNTING PRONOUNCEMENTS
In December 2004, the Financial Accounting Standards Board issued Statement of Financial Accounting Standards No. 123R, “Share-Based Payment” (“SFAS 123R”), which supersedes Accounting Principles Board Opinion No. 25, “Accounting for Stock Issued to Employees,” and its related implementation guidance. SFAS 123R requires companies to include compensation expense from stock options granted to employees in the consolidated statements of income. In March 2005, the SEC issued Staff Accounting Bulletin No. 107, which provides interpretative guidance in applying the provisions of SFAS 123R. In April 2005, the SEC adopted a rule that amended the compliance date of SFAS 123R whereby we are required to adopt this pronouncement no later than the first quarter of 2006. We expect to adopt the new requirements in the first quarter of 2006 using the modified prospective method available under SFAS 123R. As disclosed in Note 10, “Stock-Based Compensation,” to our consolidated financial statements included in this annual report, we would have recorded $60.2 million of additional after-tax expense if the provisions of SFAS 123R were applied in 2005. Based on the remaining vesting for stock options outstanding, as well as our expected future option grants, we expect our full year 2006 compensation expense related to stock options and other forms of stock-based compensation to be approximately $40 million to $50 million on an after-tax basis upon adoption of SFAS 123R.
Medco Health Solutions, Inc. | 37.
| CAUTIONARY NOTE REGARDING FORWARD-LOOKING STATEMENTS
This annual report contains “forward-looking statements” as that term is defined in the Private Securities Litigation Reform Act of 1995. These statements involve risks and uncertainties that may cause results to differ materially from those set forth in the state-ments. No forward-looking statement can be guaranteed, and actual results may differ materially from those projected. We undertake no obligation to publicly update any forward-looking statement, whether as a result of new information, future events, or otherwise. The forward-looking statements are not historical facts, but rather are based on current expectations, estimates, assumptions and projections about the business and future finan-cial results of the PBM and specialty pharmacy industries and other legal, regulatory and economic developments. We use words such as “anticipates,” “believes,” “plans,” “expects,” “future,” “intends,” “may,” “will,” “should,” “could,” “estimates,” “predicts,” “potential,” “continue” and similar expressions to identify these forward-looking statements. Our actual results could differ materially from the results contemplated by these forward-looking state-ments due to a number of factors. These factors include:
Competition in the PBM and specialty pharmacy industries and in the healthcare industry generally;
Our ability to obtain new clients and the possible termination of, or unfavorable modification to, contracts with key clients;
Risks and uncertainties regarding the implementation and the ultimate terms of the Medicare Part D prescription drug benefit;
Governmental investigations, and governmental, qui tam and other liability claims asserted against us;
Possible regulatory changes affecting pricing, rebates, dis-counts or other practices of pharmaceutical manufacturers;
Risks associated with our recent acquisition of Accredo Health, Incorporated, including the risk that we may fail to realize the anticipated synergies, cost savings and other benefits, and an increase in credit risk resulting from the payment streams associated with specialty pharmacy accounts receivable;
The dependency of our specialty pharmacy business on our relationships with a limited number of biopharmaceutical suppliers;
Threats to the security of our information systems and tech-nology infrastructure;
Risks associated with our indebtedness and debt service obligations;
Pressure on discounts and rebates from pharmaceutical man-ufacturers and margins in the PBM industry;
Developments in the healthcare industry, including the effect of increases in overall healthcare costs, changes in drug utilization and cost patterns and the introduction of new brand-name and/or generic drugs;
New or existing governmental regulations or legislation and changes in, or the failure to comply with, governmental regu-lations or legislation;
The possibility of a material non-cash charge to income if our recorded intangible assets are impaired or require accelerated amortization from a change in the remaining useful life; and
General economic and business conditions.
The foregoing list is not exhaustive. You should carefully consider the foregoing factors and the other uncertainties and potential events described in our Annual Report on Form 10-K and other documents filed from time to time with the Securities and Exchange Commission.
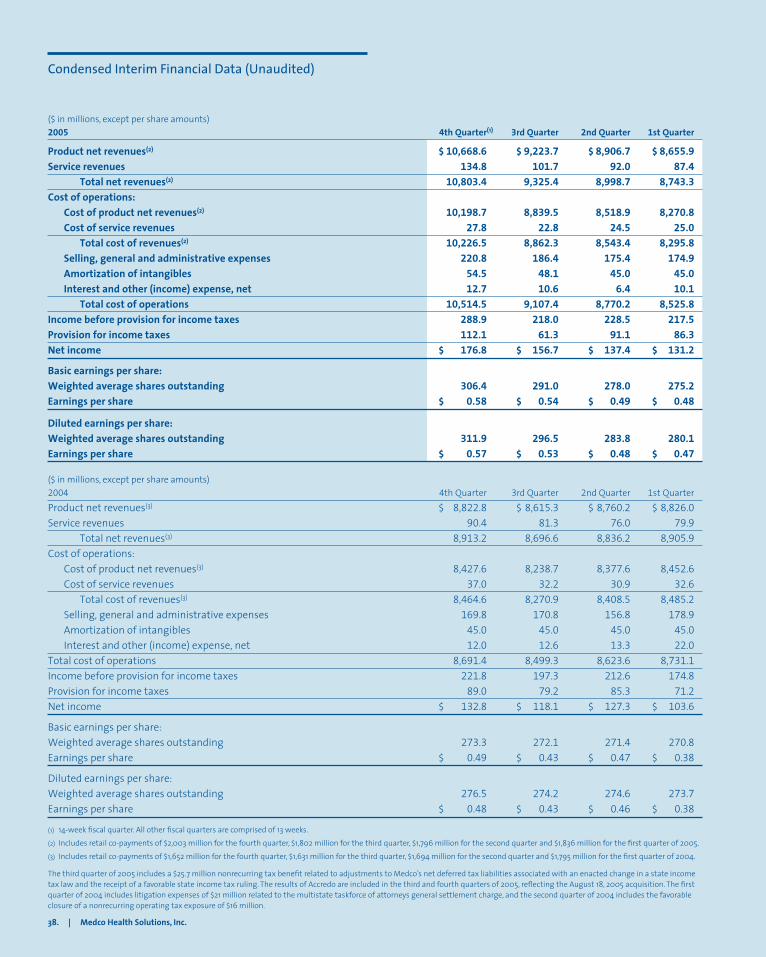
Condensed Interim Financial Data (Unaudited)
($ in millions, except per share amounts) 2005 4th Quarter(1) 3rd Quarter 2nd Quarter 1st Quarter
Product net revenues(2) $ 10,668.6 $ 9,223.7 $ 8,906.7 $ 8,655.9Service revenues 134.8 101.7 92.0 87.4 Total net revenues(2) 10,803.4 9,325.4 8,998.7 8,743.3Cost of operations: Cost of product net revenues(2) 10,198.7 8,839.5 8,518.9 8,270.8 Cost of service revenues 27.8 22.8 24.5 25.0 Total cost of revenues(2) 10,226.5 8,862.3 8,543.4 8,295.8 Selling, general and administrative expenses 220.8 186.4 175.4 174.9 Amortization of intangibles 54.5 48.1 45.0 45.0 Interest and other (income) expense, net 12.7 10.6 6.4 10.1 Total cost of operations 10,514.5 9,107.4 8,770.2 8,525.8Income before provision for income taxes 288.9 218.0 228.5 217.5Provision for income taxes 112.1 61.3 91.1 86.3Net income $ 176.8 $ 156.7 $ 137.4 $ 131.2
Basic earnings per share:Weighted average shares outstanding 306.4 291.0 278.0 275.2Earnings per share $ 0.58 $ 0.54 $ 0.49 $ 0.48
Diluted earnings per share:Weighted average shares outstanding 311.9 296.5 283.8 280.1Earnings per share $ 0.57 $ 0.53 $ 0.48 $ 0.47
($ in millions, except per share amounts) 2004 4th Quarter 3rd Quarter 2nd Quarter 1st Quarter
Product net revenues(3) $ 8,822.8 $ 8,615.3 $ 8,760.2 $ 8,826.0Service revenues 90.4 81.3 76.0 79.9 Total net revenues(3) 8,913.2 8,696.6 8,836.2 8,905.9Cost of operations: Cost of product net revenues(3) 8,427.6 8,238.7 8,377.6 8,452.6 Cost of service revenues 37.0 32.2 30.9 32.6 Total cost of revenues(3) 8,464.6 8,270.9 8,408.5 8,485.2 Selling, general and administrative expenses 169.8 170.8 156.8 178.9 Amortization of intangibles 45.0 45.0 45.0 45.0 Interest and other (income) expense, net 12.0 12.6 13.3 22.0Total cost of operations 8,691.4 8,499.3 8,623.6 8,731.1Income before provision for income taxes 221.8 197.3 212.6 174.8Provision for income taxes 89.0 79.2 85.3 71.2Net income $ 132.8 $ 118.1 $ 127.3 $ 103.6
Basic earnings per share:Weighted average shares outstanding 273.3 272.1 271.4 270.8Earnings per share $ 0.49 $ 0.43 $ 0.47 $ 0.38
Diluted earnings per share:Weighted average shares outstanding 276.5 274.2 274.6 273.7Earnings per share $ 0.48 $ 0.43 $ 0.46 $ 0.38
(1) 14-week fiscal quarter. All other fiscal quarters are comprised of 13 weeks.
(2) Includes retail co-payments of $2,003 million for the fourth quarter, $1,802 million for the third quarter, $1,796 million for the second quarter and $1,836 million for the first quarter of 2005.
(3) Includes retail co-payments of $1,652 million for the fourth quarter, $1,631 million for the third quarter, $1,694 million for the second quarter and $1,795 million for the first quarter of 2004.
The third quarter of 2005 includes a $25.7 million nonrecurring tax benefit related to adjustments to Medco’s net deferred tax liabilities associated with an enacted change in a state income tax law and the receipt of a favorable state income tax ruling. The results of Accredo are included in the third and fourth quarters of 2005, reflecting the August 18, 2005 acquisition. The first quarter of 2004 includes litigation expenses of $21 million related to the multistate taskforce of attorneys general settlement charge, and the second quarter of 2004 includes the favorable closure of a nonrecurring operating tax exposure of $16 million.
38. | Medco Health Solutions, Inc.
Medco Health Solutions, Inc. | 39.
Management’s Reports
| MANAGEMENT’S RESPONSIBILITY FOR FINANCIAL STATEMENTS
Our management is responsible for the integrity and objectivity of all information presented in this annual report. The consolidated financial statements were prepared in conformity with account-ing principles generally accepted in the United States of America and include amounts based on management’s best estimates and judgments. Management believes the consolidated financial statements fairly reflect the form and substance of transactions and that the financial statements present fairly, in all material respects, the Company’s financial position, results of operations and cash flows.
The Audit Committee of the Board of Directors, which is comprised solely of independent directors, meets regularly with our independent registered public accounting firm, PricewaterhouseCoopers LLP, the internal auditors and representatives of management to review accounting, financial reporting, internal control and audit matters, as well as the nature and extent of the audit effort. The Audit Committee is responsible for the engagement of our inde-pendent registered public accounting firm. Our independent registered public accounting firm and internal auditors have free access to the Audit Committee.
| MANAGEMENT’S REPORT ON INTERNAL CONTROL OVER FINANCIAL REPORTING
The Company’s management is responsible for establishing and maintaining adequate internal control over financial reporting.
Because of its inherent limitations, internal control over financial reporting may not prevent or detect misstatements. Projections of any evaluation of effectiveness to future periods are subject to the risk that controls may become inadequate because of changes in conditions, or that the degree of compliance with the policies or procedures may deteriorate.
The Company’s management, with the participation of its Chief Executive Officer and Chief Financial Officer, assessed the effective-ness of the Company’s internal control over financial reporting as of December 31, 2005. In making this assessment, the Company’s management used the criteria set forth by the Committee of Sponsoring Organizations of the Treadway Commission in Internal Control — Integrated Framework (the “COSO criteria”).
In conducting Medco’s evaluation of the effectiveness of its internal control over financial reporting, Medco has excluded the acquisition of Accredo Health, Incorporated (“Accredo”), which was completed by Medco on August 18, 2005. The total assets and total revenues associated with transactions and balances accounted for under Accredo’s internal controls over financial reporting represent 16% and 1.6%, respectively, of the related consolidated financial state-ment amounts as of and for the year ended December 31, 2005.
Based on its assessment, management has concluded that, as of December 31, 2005, the Company’s internal control over financial reporting is effective based on the COSO criteria.
The Company’s management’s assessment of the effectiveness of the Company’s internal control over financial reporting as of December 31, 2005 has been audited by PricewaterhouseCoopers LLP, an independent registered public accounting firm, as stated in their report, which is included on page 40 of this annual report.
David B. Snow, Jr. JoAnn A. Reed Chairman & Senior Vice President, Finance Chief Executive Officer & Chief Financial Officer
Report of Independent Registered Public Accounting Firm
To the Shareholders and Board of Directors of Medco Health Solutions, Inc.:
We have completed integrated audits of Medco Health Solutions, Inc.’s 2005 and 2004 consolidated financial statements and of its internal control over financial reporting as of December 31, 2005, and an audit of its 2003 consolidated financial statements in accordance with the standards of the Public Company Accounting Oversight Board (United States). Our opinions, based on our audits, are presented below.
| CONSOLIDATED FINANCIAL STATEMENTS
In our opinion, the consolidated financial statements present fairly, in all material respects, the financial position of Medco Health Solutions, Inc. and its subsidiaries (the “Company”) at December 31, 2005 and December 25, 2004, and the results of their operations and their cash flows for each of the three years in the period ended December 31, 2005 in con-formity with accounting principles generally accepted in the United States of America. These financial statements are the responsibility of the Company’s management. Our responsibility is to express an opin-ion on these financial statements based on our audits. We conducted our audits of these statements in accordance with the standards of the Public Company Accounting Oversight Board (United States). Those stan-dards require that we plan and perform the audit to obtain reasonable assurance about whether the financial statements are free of material misstatement. An audit of financial statements includes examining, on a test basis, evidence supporting the amounts and disclosures in the finan-cial statements, assessing the accounting principles used and significant estimates made by management, and evaluating the overall financial statement presentation. We believe that our audits provide a reasonable basis for our opinion.
| INTERNAL CONTROL OVER FINANCIAL REPORTING
Also, in our opinion, management’s assessment, included in Manage-ment’s Report on Internal Control Over Financial Reporting appearing on page 39, that the Company maintained effective internal control over financial reporting as of December 31, 2005 based on criteria established in Internal Control — Integrated Framework issued by the Committee of Sponsoring Organizations of the Treadway Commission (COSO), is fairly stated, in all material respects, based on those criteria. Furthermore, in our opinion, the Company maintained, in all material respects, effective internal control over financial reporting as of December 31, 2005, based on criteria established in Internal Control — Integrated Framework issued by the COSO. The Company’s management is responsible for maintaining effective internal control over financial reporting and for its assessment of the effectiveness of internal control over financial reporting. Our responsibility is to express opinions on management’s assessment and on the effectiveness of the Company’s internal control over financial reporting based on our audit. We conducted our audit of internal con-trol over financial reporting in accordance with the standards of the
Public Company Accounting Oversight Board (United States). Those stan-dards require that we plan and perform the audit to obtain reasonable assurance about whether effective internal control over financial report-ing was maintained in all material respects. An audit of internal control over financial reporting includes obtaining an understanding of internal control over financial reporting, evaluating management’s assessment, testing and evaluating the design and operating effectiveness of internal control, and performing such other procedures as we consider necessary in the circumstances. We believe that our audit provides a reasonable basis for our opinions.
A company’s internal control over financial reporting is a process designed to provide reasonable assurance regarding the reliability of financial reporting and the preparation of financial statements for external pur-poses in accordance with generally accepted accounting principles. A company’s internal control over financial reporting includes those poli-cies and procedures that (i) pertain to the maintenance of records that, in reasonable detail, accurately and fairly reflect the transactions and dispositions of the assets of the company; (ii) provide reasonable assur-ance that transactions are recorded as necessary to permit preparation of financial statements in accordance with generally accepted account-ing principles, and that receipts and expenditures of the company are being made only in accordance with authorizations of management and directors of the company; and (iii) provide reasonable assurance regard-ing prevention or timely detection of unauthorized acquisition, use, or disposition of the company’s assets that could have a material effect on the financial statements.
Because of its inherent limitations, internal control over financial reporting may not prevent or detect misstatements. Also, projections of any evaluation of effectiveness to future periods are subject to the risk that controls may become inadequate because of changes in condi-tions, or that the degree of compliance with the policies or procedures may deteriorate.
As described in Management’s Report on Internal Control Over Financial Reporting, management has excluded Accredo Health, Incorporated (“Accredo”), a wholly-owned subsidiary, from its assessment of internal control over financial reporting as of December 31, 2005 because it was acquired by the Company in a purchase business combination during 2005. We have also excluded Accredo from our audit of internal control over financial reporting. The total assets and total revenues associated with transactions and balances accounted for under Accredo’s internal controls over financial reporting represent 16% and 1.6%, respectively, of the related consolidated financial statement amounts as of and for the year ended December 31, 2005.
Florham Park, NJ March 1, 2006
40. | Medco Health Solutions, Inc.
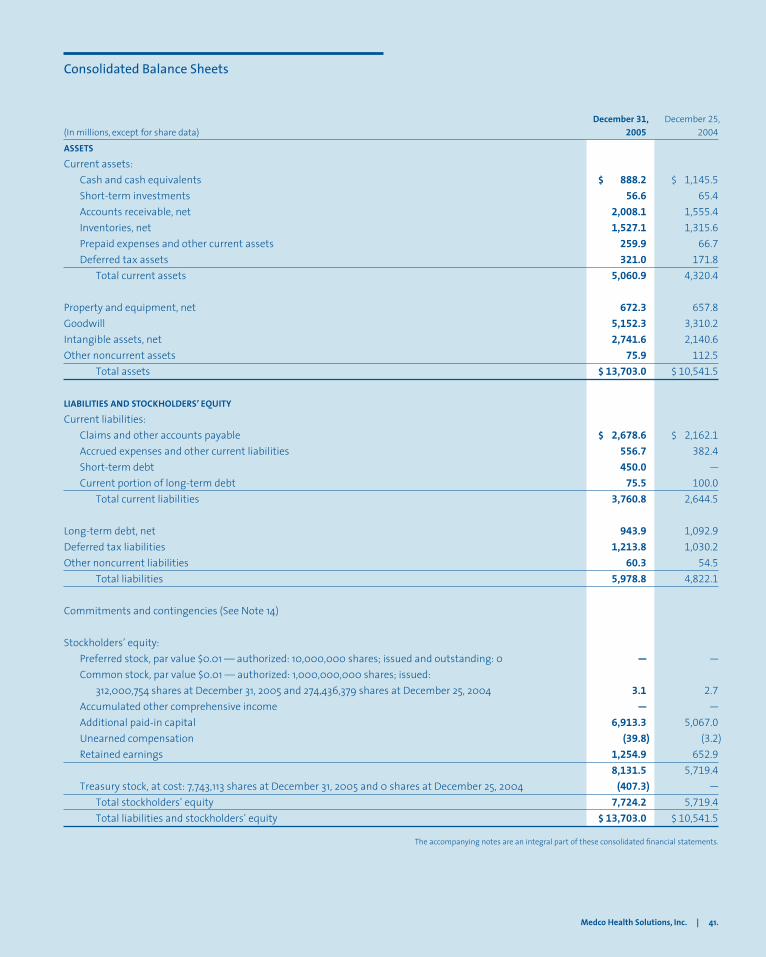
Medco Health Solutions, Inc. | 41.
Consolidated Balance Sheets
December 31, December 25, (In millions, except for share data) 2005 2004
ASSETS
Current assets: Cash and cash equivalents $ 888.2 $ 1,145.5 Short-term investments 56.6 65.4 Accounts receivable, net 2,008.1 1,555.4 Inventories, net 1,527.1 1,315.6 Prepaid expenses and other current assets 259.9 66.7 Deferred tax assets 321.0 171.8 Total current assets 5,060.9 4,320.4
Property and equipment, net 672.3 657.8Goodwill 5,152.3 3,310.2Intangible assets, net 2,741.6 2,140.6Other noncurrent assets 75.9 112.5 Total assets $ 13,703.0 $ 10,541.5
LIABILITIES AND STOCKHOLDERS’ EQUITY
Current liabilities: Claims and other accounts payable $ 2,678.6 $ 2,162.1 Accrued expenses and other current liabilities 556.7 382.4 Short-term debt 450.0 — Current portion of long-term debt 75.5 100.0 Total current liabilities 3,760.8 2,644.5
Long-term debt, net 943.9 1,092.9Deferred tax liabilities 1,213.8 1,030.2Other noncurrent liabilities 60.3 54.5 Total liabilities 5,978.8 4,822.1
Commitments and contingencies (See Note 14)
Stockholders’ equity: Preferred stock, par value $0.01 — authorized: 10,000,000 shares; issued and outstanding: 0 — — Common stock, par value $0.01 — authorized: 1,000,000,000 shares; issued: 312,000,754 shares at December 31, 2005 and 274,436,379 shares at December 25, 2004 3.1 2.7 Accumulated other comprehensive income — — Additional paid-in capital 6,913.3 5,067.0 Unearned compensation (39.8) (3.2) Retained earnings 1,254.9 652.9 8,131.5 5,719.4 Treasury stock, at cost: 7,743,113 shares at December 31, 2005 and 0 shares at December 25, 2004 (407.3) — Total stockholders’ equity 7,724.2 5,719.4 Total liabilities and stockholders’ equity $ 13,703.0 $ 10,541.5
The accompanying notes are an integral part of these consolidated financial statements.
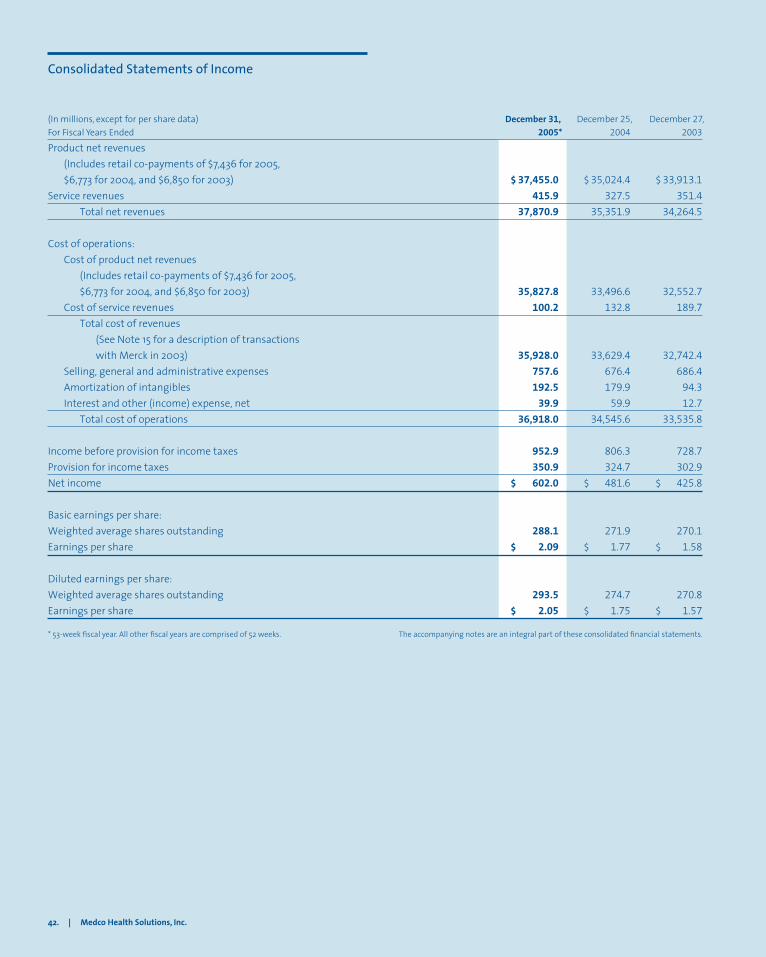
42. | Medco Health Solutions, Inc.
Consolidated Statements of Income
(In millions, except for per share data) December 31, December 25, December 27, For Fiscal Years Ended 2005* 2004 2003
Product net revenues (Includes retail co-payments of $7,436 for 2005, $6,773 for 2004, and $6,850 for 2003) $ 37,455.0 $ 35,024.4 $ 33,913.1Service revenues 415.9 327.5 351.4 Total net revenues 37,870.9 35,351.9 34,264.5
Cost of operations: Cost of product net revenues (Includes retail co-payments of $7,436 for 2005, $6,773 for 2004, and $6,850 for 2003) 35,827.8 33,496.6 32,552.7 Cost of service revenues 100.2 132.8 189.7 Total cost of revenues (See Note 15 for a description of transactions with Merck in 2003) 35,928.0 33,629.4 32,742.4 Selling, general and administrative expenses 757.6 676.4 686.4 Amortization of intangibles 192.5 179.9 94.3 Interest and other (income) expense, net 39.9 59.9 12.7 Total cost of operations 36,918.0 34,545.6 33,535.8
Income before provision for income taxes 952.9 806.3 728.7Provision for income taxes 350.9 324.7 302.9Net income $ 602.0 $ 481.6 $ 425.8
Basic earnings per share:Weighted average shares outstanding 288.1 271.9 270.1Earnings per share $ 2.09 $ 1.77 $ 1.58
Diluted earnings per share:Weighted average shares outstanding 293.5 274.7 270.8Earnings per share $ 2.05 $ 1.75 $ 1.57
* 53-week fiscal year. All other fiscal years are comprised of 52 weeks. The accompanying notes are an integral part of these consolidated financial statements.
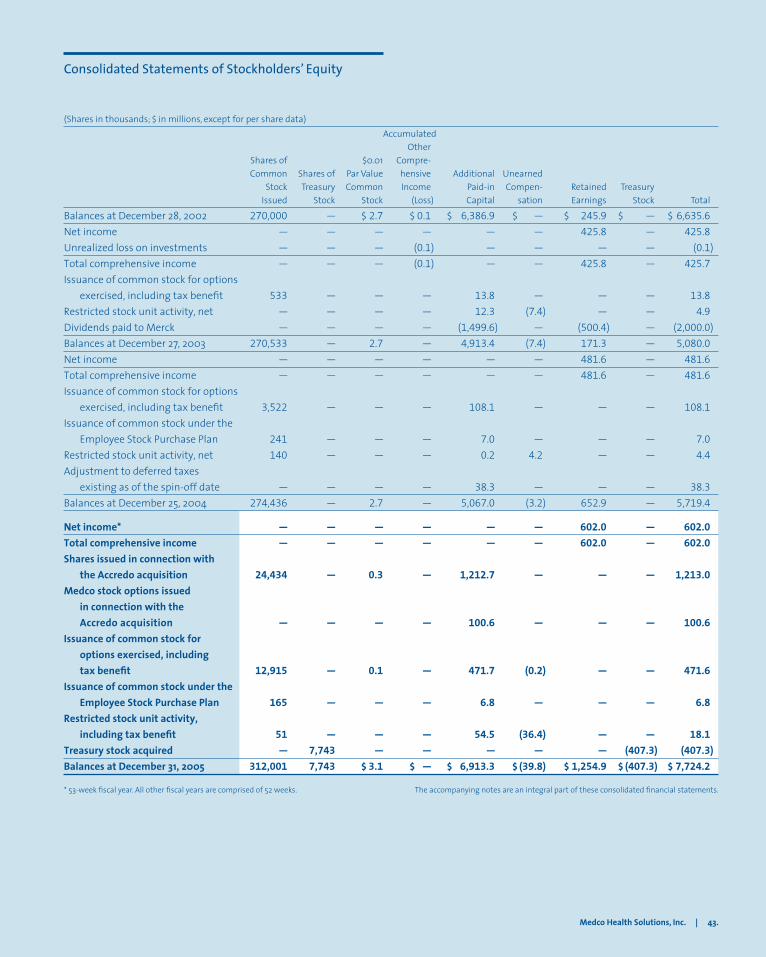
Medco Health Solutions, Inc. | 43.
Consolidated Statements of Stockholders’ Equity
(Shares in thousands; $ in millions, except for per share data) Accumulated Other Shares of $0.01 Compre- Common Shares of Par Value hensive Additional Unearned Stock Treasury Common Income Paid-in Compen- Retained Treasury Issued Stock Stock (Loss) Capital sation Earnings Stock Total
Balances at December 28, 2002 270,000 — $ 2.7 $ 0.1 $ 6,386.9 $ — $ 245.9 $ — $ 6,635.6Net income — — — — — — 425.8 — 425.8Unrealized loss on investments — — — (0.1) — — — — (0.1)Total comprehensive income — — — (0.1) — — 425.8 — 425.7Issuance of common stock for options exercised, including tax benefit 533 — — — 13.8 — — — 13.8Restricted stock unit activity, net — — — — 12.3 (7.4) — — 4.9Dividends paid to Merck — — — — (1,499.6) — (500.4) — (2,000.0)Balances at December 27, 2003 270,533 — 2.7 — 4,913.4 (7.4) 171.3 — 5,080.0Net income — — — — — — 481.6 — 481.6Total comprehensive income — — — — — — 481.6 — 481.6Issuance of common stock for options exercised, including tax benefit 3,522 — — — 108.1 — — — 108.1Issuance of common stock under the Employee Stock Purchase Plan 241 — — — 7.0 — — — 7.0Restricted stock unit activity, net 140 — — — 0.2 4.2 — — 4.4Adjustment to deferred taxes existing as of the spin-off date — — — — 38.3 — — — 38.3Balances at December 25, 2004 274,436 — 2.7 — 5,067.0 (3.2) 652.9 — 5,719.4
Net income* — — — — — — 602.0 — 602.0Total comprehensive income — — — — — — 602.0 — 602.0Shares issued in connection with the Accredo acquisition 24,434 — 0.3 — 1,212.7 — — — 1,213.0Medco stock options issued in connection with the Accredo acquisition — — — — 100.6 — — — 100.6Issuance of common stock for options exercised, including tax benefit 12,915 — 0.1 — 471.7 (0.2) — — 471.6Issuance of common stock under the Employee Stock Purchase Plan 165 — — — 6.8 — — — 6.8Restricted stock unit activity, including tax benefit 51 — — — 54.5 (36.4) — — 18.1Treasury stock acquired — 7,743 — — — — — (407.3) (407.3)Balances at December 31, 2005 312,001 7,743 $ 3.1 $ — $ 6,913.3 $ (39.8) $ 1,254.9 $ (407.3) $ 7,724.2
* 53-week fiscal year. All other fiscal years are comprised of 52 weeks. The accompanying notes are an integral part of these consolidated financial statements.
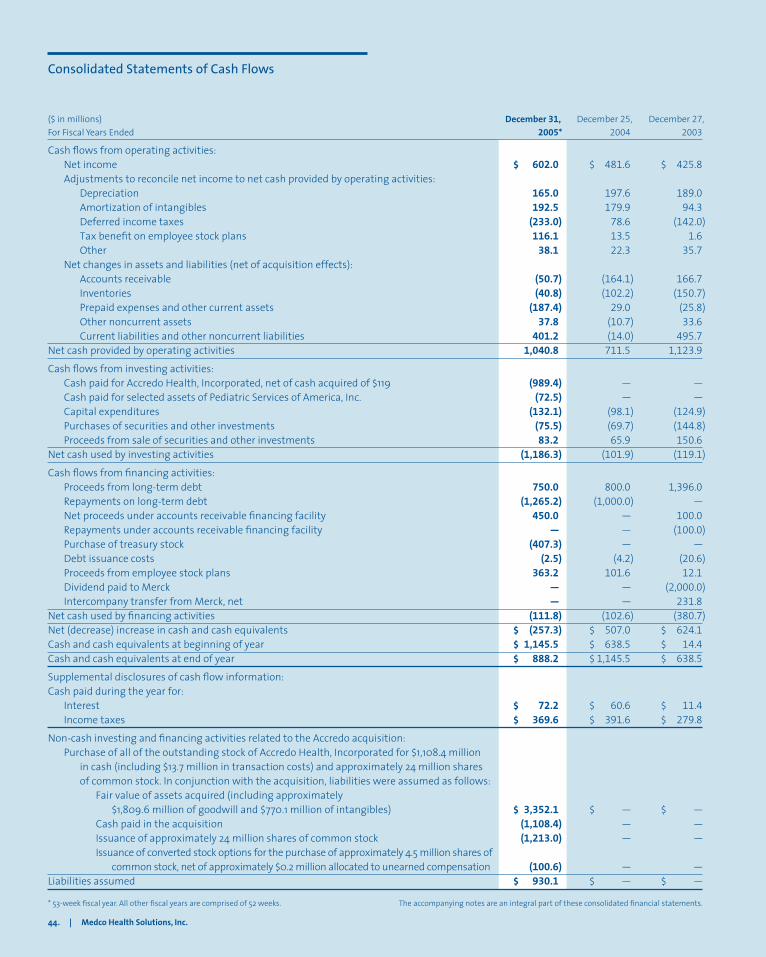
Consolidated Statements of Cash Flows
($ in millions) December 31, December 25, December 27,For Fiscal Years Ended 2005* 2004 2003
Cash flows from operating activities: Net income $ 602.0 $ 481.6 $ 425.8 Adjustments to reconcile net income to net cash provided by operating activities: Depreciation 165.0 197.6 189.0 Amortization of intangibles 192.5 179.9 94.3 Deferred income taxes (233.0) 78.6 (142.0) Tax benefit on employee stock plans 116.1 13.5 1.6 Other 38.1 22.3 35.7 Net changes in assets and liabilities (net of acquisition effects): Accounts receivable (50.7) (164.1) 166.7 Inventories (40.8) (102.2) (150.7) Prepaid expenses and other current assets (187.4) 29.0 (25.8) Other noncurrent assets 37.8 (10.7) 33.6 Current liabilities and other noncurrent liabilities 401.2 (14.0) 495.7Net cash provided by operating activities 1,040.8 711.5 1,123.9
Cash flows from investing activities: Cash paid for Accredo Health, Incorporated, net of cash acquired of $119 (989.4) — — Cash paid for selected assets of Pediatric Services of America, Inc. (72.5) — — Capital expenditures (132.1) (98.1) (124.9) Purchases of securities and other investments (75.5) (69.7) (144.8) Proceeds from sale of securities and other investments 83.2 65.9 150.6Net cash used by investing activities (1,186.3) (101.9) (119.1)
Cash flows from financing activities: Proceeds from long-term debt 750.0 800.0 1,396.0 Repayments on long-term debt (1,265.2) (1,000.0) — Net proceeds under accounts receivable financing facility 450.0 — 100.0 Repayments under accounts receivable financing facility — — (100.0) Purchase of treasury stock (407.3) — — Debt issuance costs (2.5) (4.2) (20.6) Proceeds from employee stock plans 363.2 101.6 12.1 Dividend paid to Merck — — (2,000.0) Intercompany transfer from Merck, net — — 231.8Net cash used by financing activities (111.8) (102.6) (380.7)Net (decrease) increase in cash and cash equivalents $ (257.3) $ 507.0 $ 624.1Cash and cash equivalents at beginning of year $ 1,145.5 $ 638.5 $ 14.4Cash and cash equivalents at end of year $ 888.2 $ 1,145.5 $ 638.5
Supplemental disclosures of cash flow information:Cash paid during the year for: Interest $ 72.2 $ 60.6 $ 11.4 Income taxes $ 369.6 $ 391.6 $ 279.8
Non-cash investing and financing activities related to the Accredo acquisition: Purchase of all of the outstanding stock of Accredo Health, Incorporated for $1,108.4 million in cash (including $13.7 million in transaction costs) and approximately 24 million shares of common stock. In conjunction with the acquisition, liabilities were assumed as follows: Fair value of assets acquired (including approximately $1,809.6 million of goodwill and $770.1 million of intangibles) $ 3,352.1 $ — $ — Cash paid in the acquisition (1,108.4) — — Issuance of approximately 24 million shares of common stock (1,213.0) — — Issuance of converted stock options for the purchase of approximately 4.5 million shares of common stock, net of approximately $0.2 million allocated to unearned compensation (100.6) — —Liabilities assumed $ 930.1 $ — $ —
* 53-week fiscal year. All other fiscal years are comprised of 52 weeks. The accompanying notes are an integral part of these consolidated financial statements.
44. | Medco Health Solutions, Inc.
Medco Health Solutions, Inc. | 45.
Notes to Consolidated Financial Statements
| 1. BACKGROUND AND BASIS OF PRESENTATION
Medco Health Solutions, Inc., (“Medco” or the “Company”), is a lead-ing pharmacy benefit manager (“PBM”) with the nation’s largest mail order pharmacy operations based on prescriptions dispensed. Medco assists its clients to moderate the cost and enhance the quality of prescription drug benefits to their members nationwide. The Company’s clients include private- and public-sector employ-ers and healthcare organizations. On August 18, 2005, the Company acquired Accredo Health, Incorporated (“Accredo”), as further dis-cussed in Note 3, “Acquisitions of Businesses.” With the acquisition of Accredo, Medco created the nation’s largest specialty pharmacy based on revenues.
Medco was spun off as an independent publicly traded enterprise on August 19, 2003, prior to which it was a wholly-owned subsid-iary of Merck & Co., Inc. (“Merck”) since November 18, 1993.
| 2. SUMMARY OF SIGNIFICANT ACCOUNTING POLICIES
Fiscal Years. The Company’s fiscal years ended on the last Saturday in December. Fiscal year 2005 is comprised of 53 weeks and 2004 and 2003 each are comprised of 52 weeks. Unless oth-erwise stated, references to years in the consolidated financial statements relate to fiscal years.
Principles of Consolidation. The consolidated financial state-ments include the accounts of the Company and all of its subsidiaries. Investments in affiliates over which the Company has significant influence, but neither a controlling interest nor a major-ity interest in the risks or rewards of the investee, are accounted for using the equity method. The Company’s equity investments are not significant. Intercompany accounts have been eliminated in consolidation.
Cash and Cash Equivalents. Cash includes currency on hand and demand deposits with banks or other financial institutions. Cash equivalents are comprised of certain highly liquid invest-ments with original maturities of less than three months. As a result of the Company’s normal payment cycle, cash disbursement accounts carrying negative book balances of $1,067.9 million and $692.2 million (representing outstanding checks not yet presented for payment) have been reclassified to claims and other accounts payable at December 31, 2005 and December 25, 2004, respectively. This reclassification restores balances to cash and current liabili-ties for checks to the Company’s vendors, clients and members which have not cleared. No overdraft or unsecured short-term loan exists in relation to these negative balances.
Short-Term Investments. The Company has investments in cer-tificates of deposit and U.S. government securities that are carried at fair value and classified as available for sale, with unrealized gains and losses included as a separate component of equity, net of tax. These investments, totaling $56.6 million and $65.4 mil-lion as of December 31, 2005 and December 25, 2004, respectively, have maturities of less than one year and are held to satisfy the statutory capital and other requirements for the Company’s insur-ance subsidiaries.
Financial Instruments. The carrying amount of cash, short-term investments in marketable securities, trade accounts receivable and claims and other accounts payable approximated fair values as of December 31, 2005 and December 25, 2004. The Company estimates fair market value for these assets and liabilities based on their market values or estimates of the present value of their cash flows. The fair value of the Company’s senior notes was $548.4 mil-lion and $559.4 million at December 31, 2005 and December 25, 2004, respectively, and was estimated based on quoted market prices. The fair value of the term loan obligations outstanding under the Company’s senior unsecured bank credit facility approxi-mates its carrying value and was estimated using current interbank market prices. The fair value of the Company’s obligation under its interest rate swap agreements was $9.3 million and $3.4 million at December 31, 2005 and December 25, 2004, respectively, and was based on quoted market prices that reflect the present values of the differences between future fixed rate payments and estimated future variable rate receipts. The fair value of the accounts receiv-able financing facility approximates its market value. See Note 7, “Debt and Refinancing,” for additional information.
Accounts Receivable, Net. Accounts receivable, net, includes billed and estimated unbilled receivables from manufacturers, clients and other payors, including patient accounts receivable. In addition, rebates payable to clients are estimated and accrued as a reduction in accounts receivable, net, based upon the prescrip-tion drugs dispensed by the pharmacies in the Company’s retail networks, or dispensed by the Company’s mail order pharmacies. When rebates due to be passed back to clients are greater than the corresponding client accounts receivable balances, the net liability is reclassified to claims and other accounts payable. Unbilled PBM receivables from manufacturers are generally billed beginning 30 days from the end of each quarter. Unbilled PBM receivables from clients are typically billed within 14 days based on the contractual billing schedule agreed upon with each client. At the end of any given reporting period, unbilled PBM receivables from clients may
46. | Medco Health Solutions, Inc.
represent up to two weeks of dispensing activity and will fluctu-ate at the end of a fiscal month depending on the timing of these billing cycles. Certain specialty pharmacy bills are sent to payors within two days of product shipment. A portion of the specialty pharmacy business includes reimbursement by payors, such as insurance companies, under a medical benefit, or by Medicare or Medicaid. These transactions involve higher patient co-payments than experienced in the PBM business. As a result, this portion of the specialty pharmacy business, which yields a higher margin than the PBM business, experiences slower accounts receivable turnover than in the aforementioned PBM cycle.
As of December 31, 2005 and December 25, 2004, respectively, total unbilled client, other payor and manufacturer receivables amounted to $2,182.6 million and $1,324.4 million. Specialty phar-macy accounts receivable from payors and patients amounted to $461.6 million at December 31, 2005. Accounts receivable are presented net of allowance for doubtful accounts and contrac-tual allowances of $67.3 million at December 31, 2005 (which includes $62.0 million for specialty pharmacy) and $5.5 million at December 25, 2004. The relatively higher allowance for certain specialty pharmacy accounts reflects a different credit risk profile than the PBM business, characterized by reimbursement through medical coverage, including government agencies, and higher patient co-payments. The Company regularly reviews and analyzes the adequacy of the allowances based on a variety of factors, includ-ing the age of the outstanding receivable and the collection history. When circumstances related to specific collection patterns change, estimates of the recoverability of receivables are adjusted.
Concentrations of Risks. In 2005, the Company had one cli-ent that represented 23% of net revenues, which is substantially reported within the PBM segment. In each of 2004 and 2003, this client represented 18% of net revenues. None of the Company’s other clients individually represented more than 10% of net revenues in 2005, 2004 or 2003. The Company has credit risk asso-ciated with certain accounts receivable, which consists of amounts owed by various governmental agencies, insurance companies and private patients. Concentration of credit risk relating to these accounts receivable is limited to some extent by the diversity and number of patients and payors.
The Company derives a substantial portion of its specialty segment revenue from the sale of specialty drugs provided by a limited number of single-source biopharmaceutical manufacturers.
Inventories, Net. Inventories, net, are located in the Company’s mail order pharmacies and in warehouses, consist solely of fin-ished product (primarily prescription drugs), and are valued at the lower of first-in, first-out (FIFO) cost or market.
Property and Equipment, Net. Property and equipment, net, is stated at cost, less accumulated depreciation and amortization. Depreciation is calculated using the straight-line method for assets with useful lives ranging from three to 45 years. Leasehold improvements are amortized over the shorter of the remaining life of the lease or the useful lives of the assets. In accordance with the provisions of the American Institute of Certified Public Accountants Statement of Position (“SOP”) 98-1, “Accounting for the Costs of Computer Software Developed or Obtained for Internal Use,” certain costs of computer software developed or obtained for internal use are capitalized and amortized on a straight-line basis over three to five years. Costs for general and administrative expenses, overhead, maintenance and training, as well as the cost of software coding that does not add functionality to the existing system, are expensed as incurred.
Net Revenues. Product net revenues consist principally of sales of prescription drugs to clients and members, either through the Company’s networks of contractually affiliated retail pharma-cies or through the Company’s mail order pharmacies. Specialty pharmacy product net revenues represent revenues from the sale of primarily biopharmaceutical drugs and are reported at the net amount billed to third-party payors, patients and others. The Company recognizes these revenues when the prescriptions are dispensed through retail pharmacies in the Company’s networks of contractually affiliated retail pharmacies or the Company’s mail order pharmacies and received by the members and patients. The Company evaluates client contracts using the indicators of Emerging Issues Task Force (“EITF”) No. 99-19, “Reporting Gross Revenue as a Principal vs. Net as an Agent,” to determine whether the Company acts as a principal or as an agent in the fulfillment of prescriptions through the retail pharmacy network. The Company acts as a principal in most of its transactions with clients and rev-enues are recognized at the prescription price (ingredient cost plus dispensing fee) negotiated with clients, including the portion of the price allocated by the client to be settled directly by the mem-ber (co-payment), as well as the Company’s administrative fees (“Gross Reporting”). Gross reporting is appropriate because the Company (a) has separate contractual relationships with clients and with pharmacies, (b) is responsible to validate and economi-cally manage a claim through its claims adjudication process, (c) commits to set prescription prices for the pharmacy, including instructing the pharmacy as to how that price is to be settled (co-payment requirements), (d) manages the overall prescription drug relationship with the patients, who are members of clients’ plans, and (e) has credit risk for the price due from the client. In limited instances where the Company adjudicates prescriptions at phar-macies that are under contract directly with the client and there
Medco Health Solutions, Inc. | 47.
are no financial risks to the Company, such revenue is recorded at the amount of the administrative fee earned by the Company for processing the claim (“Net Reporting”).
Rebates and guarantees regarding the level of service the Company will provide to the client or member or the minimum level of rebates or discounts the client will receive are deducted from product net revenue as they are earned by the client. Rebates are generally paid to clients subsequent to collections from phar-maceutical manufacturers, although there are certain instances where rebates are paid to clients on a more accelerated basis. Other contractual payments made to clients are generally made upon initiation of contracts as implementation allowances, which may, for example, be designated by clients as funding for their costs to transition their plans to the Company or as compensation for certain information or licensing rights granted by the client to the Company. The Company considers these payments to be an integral part of the Company’s pricing of a contract and believes that they represent only a variability in the timing of cash flows that does not change the underlying economics of the contract. Accordingly, these payments are capitalized and amortized as a reduction of product net revenue, generally on a straight-line basis, over the life of the contract where the payments are refund-able upon cancellation of the contract or relate to noncancelable contracts. Amounts capitalized are assessed periodically for recov-erability based on the profitability of the contract.
Service revenues consist principally of administrative fees and clinical program fees earned from clients and other non-product related revenues, sales of prescription services and data to phar-maceutical manufacturers and other parties, and performance-oriented fees paid by specialty pharmacy manufacturers. Client administrative fees are earned for services that are comprised of claims processing, eligibility management, benefits management, pharmacy network management and other related customer services. Service revenues are recorded by the Company when performance occurs and collectibility is assured.
Cost of Revenues. Cost of product net revenues includes the cost of inventory dispensed from the mail order pharmacies, along with direct dispensing costs and associated depreciation. Cost of prod-uct net revenues also includes ingredient costs of drugs dispensed by and professional fees paid to retail network pharmacies. In addition, cost of product net revenues includes the operating costs of the Company’s call center pharmacies, which primarily respond to member and retail pharmacist inquiries regarding member prescriptions, as well as physician calls. Cost of product net rev-enues also includes an offsetting credit for rebates earned from
pharmaceutical manufacturers whose drugs are included on the Company’s preferred drug lists, which are also known as formu-laries. These rebates generally take the form of formulary rebates, which are earned based on the volume of a specific drug dispensed under formularies, and market share rebates, which are based on the achievement of contractually specified market share levels for a specific drug. Rebates receivable from pharmaceutical manufac-turers are accrued in the period earned by multiplying estimated rebatable prescription drugs dispensed through the Company’s retail network and through the Company’s mail order pharmacies by the contractually agreed manufacturer rebate amount.
Rebates receivable estimates are revised to actual, with the differ-ence recorded to cost of revenues, upon billing to the manufacturer, generally 30 to 90 days subsequent to the end of the applicable quarter. These billings are not issued until the necessary specific eligible claims and third party market share data is received and thoroughly analyzed. Historically, the effect of adjustments result-ing from the reconciliation of rebates recognized and recorded to actual amounts billed has not been material to the Company’s results of operations.
Cost of service revenues consists principally of labor and operat-ing costs for delivery of services provided, costs associated with member communication materials, and certain information acquisition costs.
Goodwill. Goodwill of $5,152.3 million at December 31, 2005 and $3,310.2 million at December 25, 2004 represents, for the PBM business, the push-down of the excess of acquisition costs over the fair value of the Company’s net assets from the acquisition of the Company by Merck in 1993, and, to a significantly lesser extent, the Company’s acquisition of ProVantage Health Services, Inc. (“ProVantage”), in 2000. The balance at December 31, 2005 also includes a portion of the excess of the Accredo purchase price over tangible net assets acquired, which has been allocated to good-will and, to a significantly lesser extent, the acquisition of selected assets of Pediatric Services of America, Inc. (“Pediatric Services”) in November 2005. See Note 3, “Acquisitions of Businesses,” for more information. The Company tests its goodwill for impairment on an annual basis, or whenever events, such as a protracted decline in the Company’s stock price or other changes in circumstances indicate that the carrying amount may not be recoverable, using a two-step fair-value based test. The most recent assessment of goodwill impairment for each of the designated reporting units was performed as of September 24, 2005, and the recorded good-will was determined not to be impaired.
48. | Medco Health Solutions, Inc.
Intangible Assets, Net. Intangible assets, net, of $2,741.6 mil-lion at December 31, 2005 and $2,140.6 million at December 25, 2004, (net of accumulated amortization of $1,224.1 million at December 31, 2005 and $1,031.6 million at December 25, 2004) primarily reflect, for the PBM business, the value of client rela-tionships that arose in connection with the acquisition of the Company by Merck in 1993 and that have been pushed down to the consolidated balance sheets of the Company. The balance at December 31, 2005 also includes the portion of the excess of the Accredo purchase price over tangible net assets acquired that has been allocated to intangible assets. See Note 3, “Acquisitions of Businesses,” for more information. These intangible assets are recorded at cost and are reviewed for impairment whenever events, such as losses of significant clients or biotechnology man-ufacturer contracts, or other changes in circumstances indicate that the carrying amount may not be recoverable. When these events occur, the carrying amount of the assets is compared to the pre-tax undiscounted expected future cash flows derived from the lowest appropriate asset groupings. If this comparison indicates that there is an impairment, the amount of the impairment would be calculated using discounted expected future cash flows.
The Company continually assesses the useful lives of the intangible assets, taking into account historical client turnover experience, including recent losses of clients and expected future losses, to ensure they reflect current circumstances. Effective as of the begin-ning of the 2004 fiscal year, the weighted average useful life was revised from 35 years to 23 years, with the annual intangible asset amortization expense increasing to $179.9 million from $94.3 mil-lion in 2003. Effective as of the Accredo acquisition on August 18, 2005, the weighted average useful life of intangible assets sub-ject to amortization is 23 years in total and by major asset class are approximately 23 years for the PBM client relationships and approximately 22 years for the Accredo intangibles, with the annual intangible amortization expense increasing to $218.5 million.
Stock-Based Compensation. The Company grants options to employees to purchase shares of Medco common stock at the fair market value on the date of grant. The options generally vest over three years and expire within 10 years from the date of the grant. Under the terms of the Medco Health Solutions, Inc., 2002 Stock Incentive Plan, as of December 31, 2005, 22.6 million shares of the Company’s common stock are available for awards under the plan. As of December 31, 2005, under the terms of the Accredo Health 2002 Long Term Incentive Plan as amended and restated on August 18, 2005, there are 0.8 million shares of the Company’s common stock available for awards under the plan. Prior to the spin-off from Merck, the Company’s employees had participated
in Merck stock option plans under which employees were granted options to purchase shares of Merck common stock at the fair market value on the date of grant. These options generally were exercisable in three to five years and expired within five to 15 years from the date of grant. Certain Merck stock options granted in 2002 and 2003 converted to Medco options upon the spin-off (the “Converted Options”). The rate of conversion was determined based on a formula that preserved the economic position of the option holder immediately before and after the spin-off.
The Company accounts for employee options to purchase stock, and for employee participation in the Medco Health Solutions, Inc., 2003 Employee Stock Purchase Plan (“2003 ESPP”) and the Medco Health Solutions, Inc., 2001 Employee Stock Purchase Plan (“2001 ESPP”), under the intrinsic value method of expense recog-nition in Accounting Principles Board (“APB”) No. 25, “Accounting for Stock Issued to Employees” (“APB 25”), as permitted by SFAS No. 123, “Accounting for Stock-Based Compensation” (“SFAS 123”). See “— Recent Accounting Pronouncements” below for a discussion of SFAS No. 123 (revised 2004), “Share-Based Payment” (“SFAS 123R”) which revises SFAS No. 123 and supersedes APB 25, and its related implementation guidance. Under the intrinsic value method, com-pensation expense is the amount by which the market price of the underlying stock exceeds the exercise price of an option on the date of grant. Because employee stock options are granted to pur-chase shares of stock at the fair market value on the date of grant, no compensation expense has been recognized in the Company’s consolidated statements of income for any stock options granted, or shares issued under the 2003 ESPP.
If the fair value method of accounting had been applied for stock options and shares issued under the 2003 ESPP, net income in 2005, 2004 and 2003 would have been reduced. The fair value method under SFAS 123 requires recognition of compensation expense ratably over the vesting period. In January 2004, the Company revised the assumptions utilized by the Black-Scholes model in determining pro forma compensation expense, based on updated option exercise data, such that the expense is attributed under the method prescribed in Financial Accounting Standards Board (“FASB”) Interpretation No. 28, “Accounting for Stock Appreciation Rights and Other Variable Stock Option or Award Plans” (“FIN 28”) as this was considered the preferred method before final issuance of SFAS 123R. As a result, beginning in January 2004, the Company has calculated pro forma compensation expense for any stock options granted since that time using the FIN 28 methodology. The Company recognizes pro forma compensation expense under the straight-line method of amortization for stock options granted prior to January 2004.
Medco Health Solutions, Inc. | 49.
The pro forma effect on net income and earnings per share if the Company had applied the fair value method for recognizing employee stock-based compensation to stock options and for shares issued under the 2003 ESPP and the 2001 ESPP is as follows ($ in millions, except for per share data):
Fiscal Years 2005(1) 2004 2003
Net income, as reported(2) $ 602.0 $ 481.6 $ 425.8Medco stock-based compensation expense, net of tax(3) (60.2) (89.0) (43.1)Pro forma net income including Medco stock-based compensation expense 541.8 392.6 382.7Merck stock-based compensation expense, net of tax(4) — — (98.3)Pro forma net income including all stock-based compensation expense $ 541.8 $ 392.6 $ 284.4
Basic earnings per share: As reported $ 2.09 $ 1.77 $ 1.58 Pro forma (SFAS 123) $ 1.88 $ 1.44 $ 1.05Diluted earnings per share: As reported $ 2.05 $ 1.75 $ 1.57 Pro forma (SFAS 123) $ 1.85 $ 1.43 $ 1.05
(1) 53-week fiscal year. All other fiscal years are comprised of 52 weeks.
(2) The Company grants restricted stock units and restricted stock to employees and directors, generally vesting over two or three years. The Company records unearned compensation within stockholders’ equity at an amount equivalent to the market value on the date of grant and amortizes such amount to compensation expense over the vesting period. Net income, as reported, includes stock-based compensation expense related to the restricted stock units and restricted stock for the year ended December 31, 2005 of $10.4 million ($17.2 million pre-tax) and for the year ended December 25, 2004 of $2.6 million ($4.4 million pre-tax) and for the year ended December 27, 2003, $2.9 million ($5.0 million pre-tax). At December 31, 2005, the net unearned compensation recorded within stockholders’ equity is $39.8 million.
(3) For the year ended December 31, 2005, the Medco pro forma stock-based compensation expense, determined using the fair value method for stock-based awards, net of tax, includes $59.5 million ($98.7 million pre-tax) for the stock options and $0.7 million ($1.2 million pre-tax) for the 2003 ESPP. For the year ended December 25, 2004, the Medco pro forma stock-based compensation expense, determined using the fair value method for stock-based awards, net of tax, includes $88.3 million ($147.7 million pre-tax) for the stock options and $0.7 million ($1.2 million pre-tax) for the 2003 ESPP. For the year ended December 27, 2003, the Medco pro forma stock-based compensation expense, determined using the fair value method for stock-based awards, net of tax, includes $42.9 million ($73 million pre-tax) for the stock options and $0.2 million ($0.3 million pre-tax) for the 2003 ESPP.
(4) The Company is reflecting the Merck stock-based compensation for its employees in the pro forma net income for the periods the Company was wholly-owned by Merck. Upon spin-off from Merck, the Company’s employees had no remaining service requirements to Merck and the Merck stock options became fully vested, with the 2003 compensation expense of $98.3 million reflecting the accelerated vesting. There has been no impact on the Company’s post spin-off pro forma earnings, nor will there be any impact on future pro forma earnings relating to the Merck options.
The fair value of options granted is estimated on the date of grant using the Black-Scholes option-pricing model. The Medco volatility assumption is based on the volatility of the largest com-petitors within the PBM industry combined with the Company’s stock price volatility for the period the Company has been pub-licly traded. The weighted average fair value of options granted for the years ended December 31, 2005, December 25, 2004 and December 27, 2003 was $17.78, $14.69 and $12.31, respectively. The historical Merck assumptions relate to Merck stock and were therefore based on Merck’s valuation assumptions. The weighted average option assumptions utilized for options granted during the years presented are as follows:
Fiscal Years 2005 2004 2003
Medco stock options Black-Scholes assumptions (weighted average): Expected dividend yield — — — Risk-free interest rate 4.0% 3.1% 3.0% Expected volatility 35.0% 45.0% 45.0% Expected life (years) 5.3 5.5 4.6Merck stock options Black-Scholes assumptions (weighted average): Expected dividend yield — — 2.6% Risk-free interest rate — — 2.4% Expected volatility — — 31.0% Expected life (years) — — 5.1
See Note 10, “Stock Based Compensation,” for additional informa-tion concerning the Company’s stock-based compensation plans.
Income Taxes. The Company accounts for income taxes under SFAS No. 109, “Accounting for Income Taxes.” Prior to the date of its incorporation on May 25, 2002, the Company was structured as a single member limited liability company with Merck as the sole member. As described further in Note 9, “Taxes on Income,” under the terms of the tax responsibility allocation agreement, the Company is responsible for the payment of federal income taxes and all state income taxes on income earned subsequent to the date of the spin-off, except that the Company is also generally responsible for state income taxes on income earned subsequent to the date of incorporation in states where Merck did not file a unitary or combined return. These federal and state income tax liabilities are reflected in accrued expenses and other current liabilities. The Company records deferred tax assets and liabilities based on temporary differences between the financial statement basis and the tax basis of assets and liabilities using presently enacted tax rates.
50. | Medco Health Solutions, Inc.
Use of Estimates. The consolidated financial statements include certain amounts that are based on management’s best estimates and judgments. Estimates are used in determining such items as accruals for rebates receivable and payable, depreciable/useful lives, allowance for doubtful accounts, testing for impairment of long-lived assets, income taxes, pension and other postretirement benefit plan assumptions, amounts recorded for contingencies, and other reserves. Because of the uncertainty inherent in such estimates, actual results may differ from these estimates.
Operating Segments. In accordance with SFAS No. 131, “Disclosures about Segments of an Enterprise and Related Information,” the Company has two reportable segments, PBM and Specialty Pharmacy. See Note 13, “Segment Reporting,” for more information. Both the PBM and Specialty Pharmacy segments operate in one geo-graphic region, which includes the United States and Puerto Rico.
Earnings per Share. The Company reports earnings per share (“EPS”) in accordance with SFAS No. 128, “Earnings per Share” (“SFAS 128”). Basic EPS are computed by dividing net income by the weighted average number of shares of common stock issued and outstanding during the reporting period. Diluted EPS are calcu-lated to give effect to all potentially dilutive common shares that were outstanding during the reporting period. The dilutive effect of outstanding options, and their equivalents, as well as restricted stock units, is reflected in diluted EPS by application of the trea-sury stock method. From February 26, 2002 to June 28, 2003, Merck granted under its employee stock options plans, options that con-verted into 10.9 million Medco options on August 19, 2003. The rate of conversion was determined based on a formula that preserved the economic position of the option holder immediately before and after the spin-off.
For purposes of calculating fiscal year 2003 diluted EPS, the Converted Options were assumed to have converted to Medco options on their original date of grant. Subsequent to the spin-off in August 2003, the Company granted options of 12.5 million shares in fiscal 2003, 6.6 million shares in fiscal 2004 and 8.4 million shares in fiscal 2005, inclusive of 4.6 million shares as the result of the conversion of the Accredo options outstanding, at the fair market value on the date of grant. These options may have a dilu-tive effect on future EPS if the exercise price of the options is less than the market price during a future reporting period. Options granted by Merck to Medco employees prior to February 26, 2002 remain options to purchase Merck stock and became fully vested upon the spin-off. These Merck options have no impact on Medco share dilution. For the years ended December 31, 2005, December 25, 2004 and December 27, 2003, there were outstand-ing options to purchase 1.1 million, 1.4 million and 0.6 million shares of Medco stock, respectively, where the exercise price of
the options exceeded the average stock price, which is calculated as the average of the NYSE price for each trading day in the fiscal period. Accordingly, these options are excluded from the diluted EPS calculations.
The following is a reconciliation of the number of weighted aver-age shares used in the basic and diluted EPS calculation (amounts in millions):
Fiscal Years 2005 2004 2003
Weighted average shares outstanding 288.1 271.9 270.1Dilutive common stock equivalents: Outstanding stock options and restricted stock units 5.4 2.8 0.7Weighted average shares outstanding assuming dilution 293.5 274.7 270.8
Other Comprehensive Income (Loss). Total comprehensive income includes, in addition to net income, unrealized investment gains and losses and changes in the minimum pension liability excluded from the consolidated statements of income that were recorded directly into a separate section of stockholders’ equity on the consolidated balance sheets. These items are referred to as accumulated other comprehensive income.
Pension and Other Postretirement Benefits. The determination of the Company’s obligation and expense for pension and other postretirement benefits is based on assumptions used by actuaries including an appropriate discount rate, expected long-term rate of return on plan assets, and rates of increase in compensation and healthcare costs. See Note 8, “Pension and Other Postretirement Benefits,” for more information concerning the Company’s pen-sion and other postretirement benefits assumptions.
Contingencies. The Company is currently involved in various legal proceedings and other disputes with third parties that arise from time to time in the ordinary course of business. The Company has considered these proceedings and disputes in determining the necessity of any reserves for losses that are probable and rea-sonably estimable in accordance with SFAS No. 5, “Accounting for Contingencies”. The Company’s recorded reserves are based on estimates developed with consideration given to the potential merits of claims, the range of possible settlements, advice from outside counsel, and management’s strategy with regard to the settlement of such claims or defense against such claims.
Medco Health Solutions, Inc. | 51.
Recent Accounting Pronouncements. In December 2004, the FASB issued SFAS 123R, which supersedes APB Opinion No. 25, “Accounting for Stock Issued to Employees,” and its related imple-mentation guidance. SFAS 123R requires companies to include compensation expense from stock options granted to employees in the consolidated statements of income. In March 2005, the SEC issued Staff Accounting Bulletin No. 107, which provides interpreta-tive guidance in applying the provisions of SFAS 123R. In April 2005, the SEC adopted a rule that amended the compliance date of SFAS 123R whereby the Company is required to adopt this pronounce-ment no later than the first quarter of 2006. The Company expects to adopt the new requirements in the first quarter of 2006 using the modified prospective method available under SFAS 123R. As disclosed above, the Company would have recorded $60.2 million of additional after-tax expense if the provisions of SFAS 123R were applied in 2005. Based on the remaining vestings for stock options outstanding, as well as the Company’s expected future option grants, the Company expects the full year 2006 compensation expense related to stock options and other forms of stock-based compensation to be approximately $40 million to $50 million on an after-tax basis upon adoption of SFAS 123R.
Reclassifications. Certain prior year amounts have been reclassi-fied to conform to the current year presentation.
| 3. ACQUISITIONS OF BUSINESSES
Accredo. On August 18, 2005, the Company acquired all of the outstanding common stock of Accredo. Accredo offers a limited number of high cost drugs that are primarily injectable for the recurring treatment of chronic and potentially life threatening diseases. Accredo’s services include specialty pharmacy, clinical, delivery and reimbursement services. Accredo primarily provides overnight, temperature-controlled delivery of all drugs and sup-plies necessary for patients to self-administer their drug dosages safely and effectively in the privacy of their homes. Additionally, there are instances where drugs dispensed by Accredo are administered at physicians’ offices or other alternative sites. On February 10, 2004, Accredo and Medco entered into what was a ten-year strategic alliance pursuant to which Accredo became the preferred retail and mail order pharmacy provider to members of Medco-administered health plans for the specialty pharmacy products dispensed by Accredo. The Company acquired Accredo because it anticipates that the combination of the two compa-nies will accelerate its growth in the rapidly growing specialty pharmacy industry.
Under the terms of the Agreement and Plan of Merger dated February 22, 2005 (the “Merger Agreement”), Accredo sharehold-ers received $22.00 in cash plus 0.49107 of a share of Medco common stock for each outstanding share of Accredo common stock. Approximately 24 million shares of Medco common stock were issued in connection with the acquisition. The aggregate purchase price amounted to $2.4 billion, including $1.2 billion in Medco common stock, $1.1 billion in cash and $0.1 billion of con-verted options. The $0.1 billion of converted options represents the acquisition date fair value of the Medco options issued in exchange for the outstanding Accredo options under the terms of the Merger Agreement. The transaction was accounted for under the provisions of SFAS No. 141, “Business Combinations.” The purchase price has been allocated based upon the estimated fair value of net assets acquired at the date of the acquisition. A por-tion of the excess of the purchase price over tangible net assets acquired has been allocated to intangible assets, consisting of manufacturer relationships of $357.5 million, payor relationships of $204.6 million, trade names of $153.2 million, patient relation-ships of $50.9 million, non-compete agreements of $2.9 million and lease agreements of $1.0 million, which are being amortized using the straight-line method over an estimated weighted aver-age useful life of approximately 22 years. These assets are included in intangible assets, net, in the consolidated balance sheet as of December 31, 2005.
The purchase price reflects the fair value of Medco common stock issued in connection with the acquisition based on the Medco com-mon stock average closing price for the three trading days including August 18, 2005, which was $49.64. The purchase price for Accredo was primarily determined on the basis of management’s expecta-tions of future earnings and cash flows, including synergies, and resulted in the recording of goodwill of $1.8 billion, which is not tax deductible. In accordance with SFAS No. 142, “Goodwill and Other Intangible Assets,” the goodwill is not being amortized. The $1.1 bil-lion cash component of the purchase price was financed with cash on hand, a new $750 million term loan facility, and a $450 million draw-down under an existing accounts receivable financing facil-ity, partially offset by extinguishments of existing debt. See Note 7, “Debt and Refinancing,” for more information.
Accredo’s operating results from August 18, 2005, the date of acquisition, through December 31, 2005, are included in the accompanying consolidated financial statements. The unaudited pro forma results of operations of the Company and Accredo, pre-pared based on the purchase price allocation for Accredo described
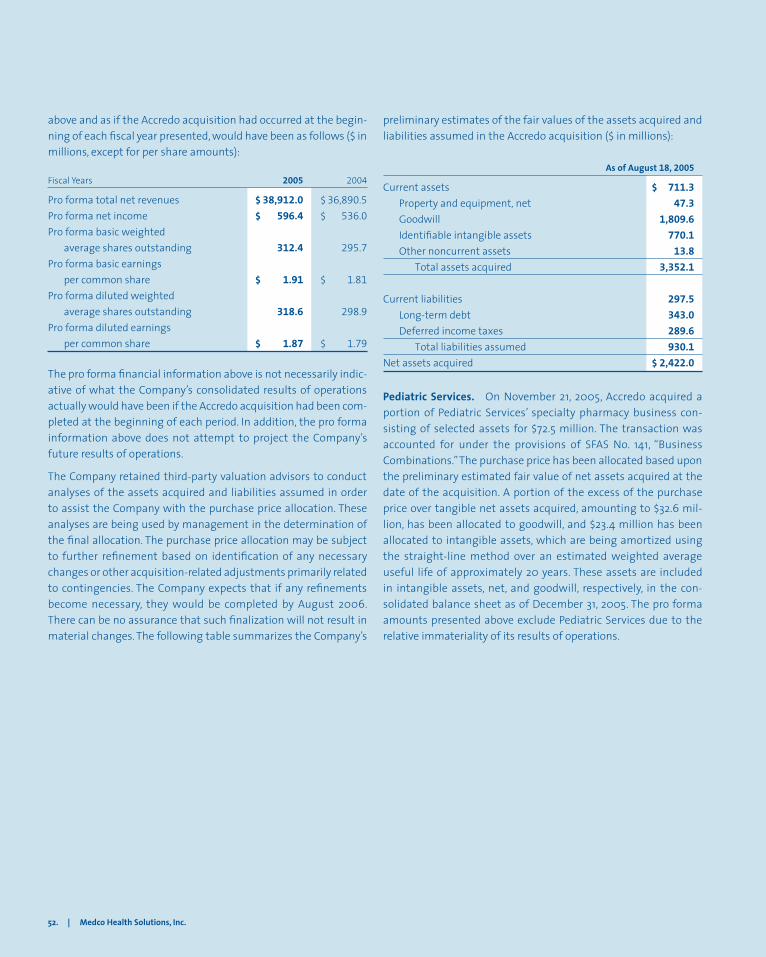
52. | Medco Health Solutions, Inc.
above and as if the Accredo acquisition had occurred at the begin-ning of each fiscal year presented, would have been as follows ($ in millions, except for per share amounts):
Fiscal Years 2005 2004
Pro forma total net revenues $ 38,912.0 $ 36,890.5Pro forma net income $ 596.4 $ 536.0Pro forma basic weighted average shares outstanding 312.4 295.7Pro forma basic earnings per common share $ 1.91 $ 1.81Pro forma diluted weighted average shares outstanding 318.6 298.9Pro forma diluted earnings per common share $ 1.87 $ 1.79
The pro forma financial information above is not necessarily indic-ative of what the Company’s consolidated results of operations actually would have been if the Accredo acquisition had been com-pleted at the beginning of each period. In addition, the pro forma information above does not attempt to project the Company’s future results of operations.
The Company retained third-party valuation advisors to conduct analyses of the assets acquired and liabilities assumed in order to assist the Company with the purchase price allocation. These analyses are being used by management in the determination of the final allocation. The purchase price allocation may be subject to further refinement based on identification of any necessary changes or other acquisition-related adjustments primarily related to contingencies. The Company expects that if any refinements become necessary, they would be completed by August 2006. There can be no assurance that such finalization will not result in material changes. The following table summarizes the Company’s
preliminary estimates of the fair values of the assets acquired and liabilities assumed in the Accredo acquisition ($ in millions):
As of August 18, 2005
Current assets $ 711.3 Property and equipment, net 47.3 Goodwill 1,809.6 Identifiable intangible assets 770.1 Other noncurrent assets 13.8 Total assets acquired 3,352.1
Current liabilities 297.5 Long-term debt 343.0 Deferred income taxes 289.6 Total liabilities assumed 930.1Net assets acquired $ 2,422.0
Pediatric Services. On November 21, 2005, Accredo acquired a portion of Pediatric Services’ specialty pharmacy business con-sisting of selected assets for $72.5 million. The transaction was accounted for under the provisions of SFAS No. 141, “Business Combinations.” The purchase price has been allocated based upon the preliminary estimated fair value of net assets acquired at the date of the acquisition. A portion of the excess of the purchase price over tangible net assets acquired, amounting to $32.6 mil-lion, has been allocated to goodwill, and $23.4 million has been allocated to intangible assets, which are being amortized using the straight-line method over an estimated weighted average useful life of approximately 20 years. These assets are included in intangible assets, net, and goodwill, respectively, in the con-solidated balance sheet as of December 31, 2005. The pro forma amounts presented above exclude Pediatric Services due to the relative immateriality of its results of operations.
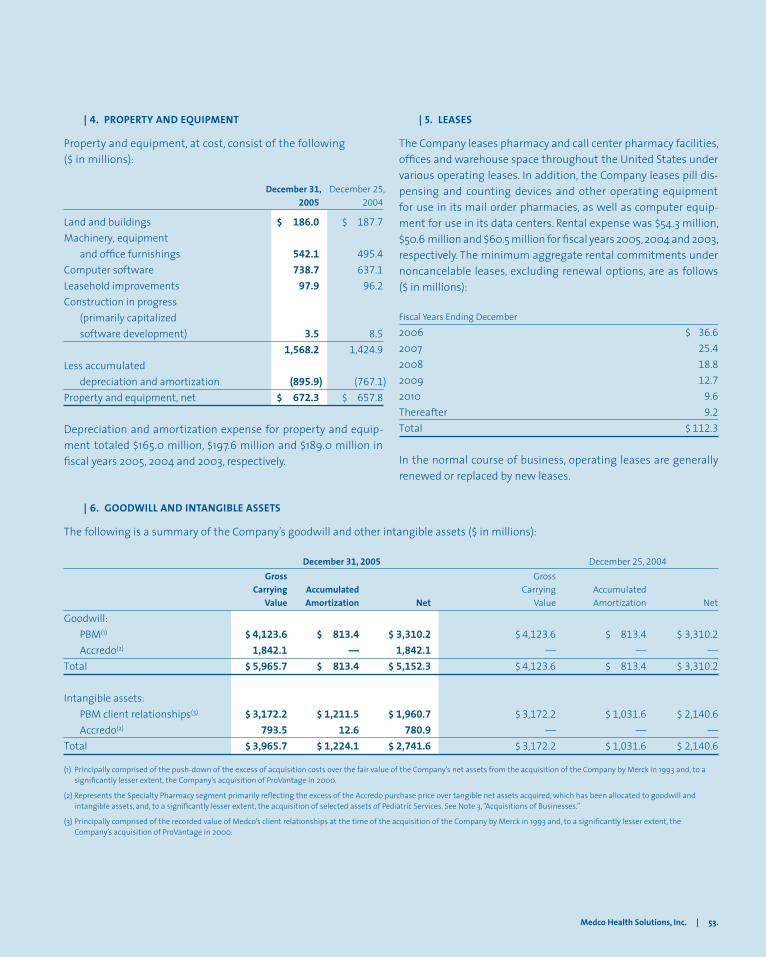
Medco Health Solutions, Inc. | 53.
| 5. LEASES
The Company leases pharmacy and call center pharmacy facilities, offices and warehouse space throughout the United States under various operating leases. In addition, the Company leases pill dis-pensing and counting devices and other operating equipment for use in its mail order pharmacies, as well as computer equip-ment for use in its data centers. Rental expense was $54.3 million, $50.6 million and $60.5 million for fiscal years 2005, 2004 and 2003, respectively. The minimum aggregate rental commitments under noncancelable leases, excluding renewal options, are as follows ($ in millions):
Fiscal Years Ending December
2006 $ 36.62007 25.42008 18.82009 12.72010 9.6Thereafter 9.2Total $ 112.3
In the normal course of business, operating leases are generally renewed or replaced by new leases.
| 4. PROPERTY AND EQUIPMENT
Property and equipment, at cost, consist of the following ($ in millions):
December 31, December 25, 2005 2004
Land and buildings $ 186.0 $ 187.7Machinery, equipment and office furnishings 542.1 495.4Computer software 738.7 637.1Leasehold improvements 97.9 96.2Construction in progress (primarily capitalized software development) 3.5 8.5 1,568.2 1,424.9Less accumulated depreciation and amortization (895.9) (767.1)Property and equipment, net $ 672.3 $ 657.8
Depreciation and amortization expense for property and equip-ment totaled $165.0 million, $197.6 million and $189.0 million in fiscal years 2005, 2004 and 2003, respectively.
| 6. GOODWILL AND INTANGIBLE ASSETS
The following is a summary of the Company’s goodwill and other intangible assets ($ in millions):
December 31, 2005 December 25, 2004 Gross Gross Carrying Accumulated Carrying Accumulated Value Amortization Net Value Amortization Net
Goodwill: PBM(1) $ 4,123.6 $ 813.4 $ 3,310.2 $ 4,123.6 $ 813.4 $ 3,310.2 Accredo(2) 1,842.1 — 1,842.1 — — — Total $ 5,965.7 $ 813.4 $ 5,152.3 $ 4,123.6 $ 813.4 $ 3,310.2
Intangible assets: PBM client relationships(3) $ 3,172.2 $ 1,211.5 $ 1,960.7 $ 3,172.2 $ 1,031.6 $ 2,140.6 Accredo(2) 793.5 12.6 780.9 — — — Total $ 3,965.7 $ 1,224.1 $ 2,741.6 $ 3,172.2 $ 1,031.6 $ 2,140.6
(1) Principally comprised of the push-down of the excess of acquisition costs over the fair value of the Company’s net assets from the acquisition of the Company by Merck in 1993 and, to a significantly lesser extent, the Company’s acquisition of ProVantage in 2000.
(2) Represents the Specialty Pharmacy segment primarily reflecting the excess of the Accredo purchase price over tangible net assets acquired, which has been allocated to goodwill and intangible assets, and, to a significantly lesser extent, the acquisition of selected assets of Pediatric Services. See Note 3, “Acquisitions of Businesses.”
(3) Principally comprised of the recorded value of Medco’s client relationships at the time of the acquisition of the Company by Merck in 1993 and, to a significantly lesser extent, the Company’s acquisition of ProVantage in 2000.
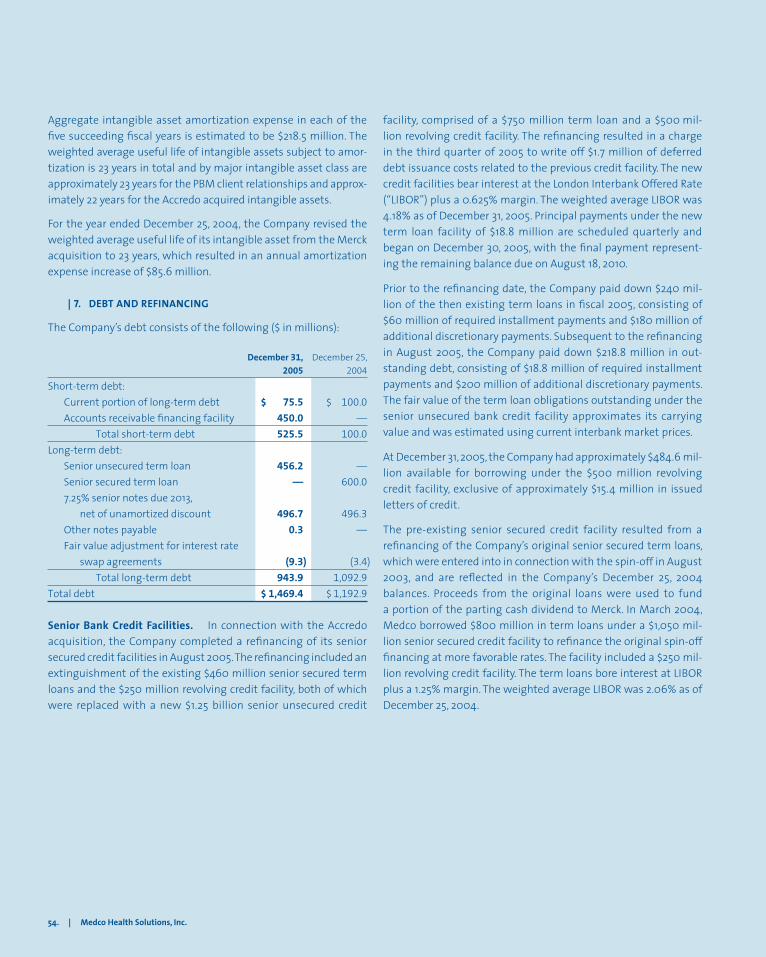
54. | Medco Health Solutions, Inc.
facility, comprised of a $750 million term loan and a $500 mil-lion revolving credit facility. The refinancing resulted in a charge in the third quarter of 2005 to write off $1.7 million of deferred debt issuance costs related to the previous credit facility. The new credit facilities bear interest at the London Interbank Offered Rate (“LIBOR”) plus a 0.625% margin. The weighted average LIBOR was 4.18% as of December 31, 2005. Principal payments under the new term loan facility of $18.8 million are scheduled quarterly and began on December 30, 2005, with the final payment represent-ing the remaining balance due on August 18, 2010.
Prior to the refinancing date, the Company paid down $240 mil-lion of the then existing term loans in fiscal 2005, consisting of $60 million of required installment payments and $180 million of additional discretionary payments. Subsequent to the refinancing in August 2005, the Company paid down $218.8 million in out-standing debt, consisting of $18.8 million of required installment payments and $200 million of additional discretionary payments. The fair value of the term loan obligations outstanding under the senior unsecured bank credit facility approximates its carrying value and was estimated using current interbank market prices.
At December 31, 2005, the Company had approximately $484.6 mil-lion available for borrowing under the $500 million revolving credit facility, exclusive of approximately $15.4 million in issued letters of credit.
The pre-existing senior secured credit facility resulted from a refinancing of the Company’s original senior secured term loans, which were entered into in connection with the spin-off in August 2003, and are reflected in the Company’s December 25, 2004 balances. Proceeds from the original loans were used to fund a portion of the parting cash dividend to Merck. In March 2004, Medco borrowed $800 million in term loans under a $1,050 mil-lion senior secured credit facility to refinance the original spin-off financing at more favorable rates. The facility included a $250 mil-lion revolving credit facility. The term loans bore interest at LIBOR plus a 1.25% margin. The weighted average LIBOR was 2.06% as of December 25, 2004.
Aggregate intangible asset amortization expense in each of the five succeeding fiscal years is estimated to be $218.5 million. The weighted average useful life of intangible assets subject to amor-tization is 23 years in total and by major intangible asset class are approximately 23 years for the PBM client relationships and approx-imately 22 years for the Accredo acquired intangible assets.
For the year ended December 25, 2004, the Company revised the weighted average useful life of its intangible asset from the Merck acquisition to 23 years, which resulted in an annual amortization expense increase of $85.6 million.
| 7. DEBT AND REFINANCING
The Company’s debt consists of the following ($ in millions):
December 31, December 25, 2005 2004
Short-term debt: Current portion of long-term debt $ 75.5 $ 100.0 Accounts receivable financing facility 450.0 — Total short-term debt 525.5 100.0Long-term debt: Senior unsecured term loan 456.2 — Senior secured term loan — 600.0 7.25% senior notes due 2013, net of unamortized discount 496.7 496.3 Other notes payable 0.3 — Fair value adjustment for interest rate swap agreements (9.3) (3.4) Total long-term debt 943.9 1,092.9Total debt $ 1,469.4 $ 1,192.9
Senior Bank Credit Facilities. In connection with the Accredo acquisition, the Company completed a refinancing of its senior secured credit facilities in August 2005. The refinancing included an extinguishment of the existing $460 million senior secured term loans and the $250 million revolving credit facility, both of which were replaced with a new $1.25 billion senior unsecured credit
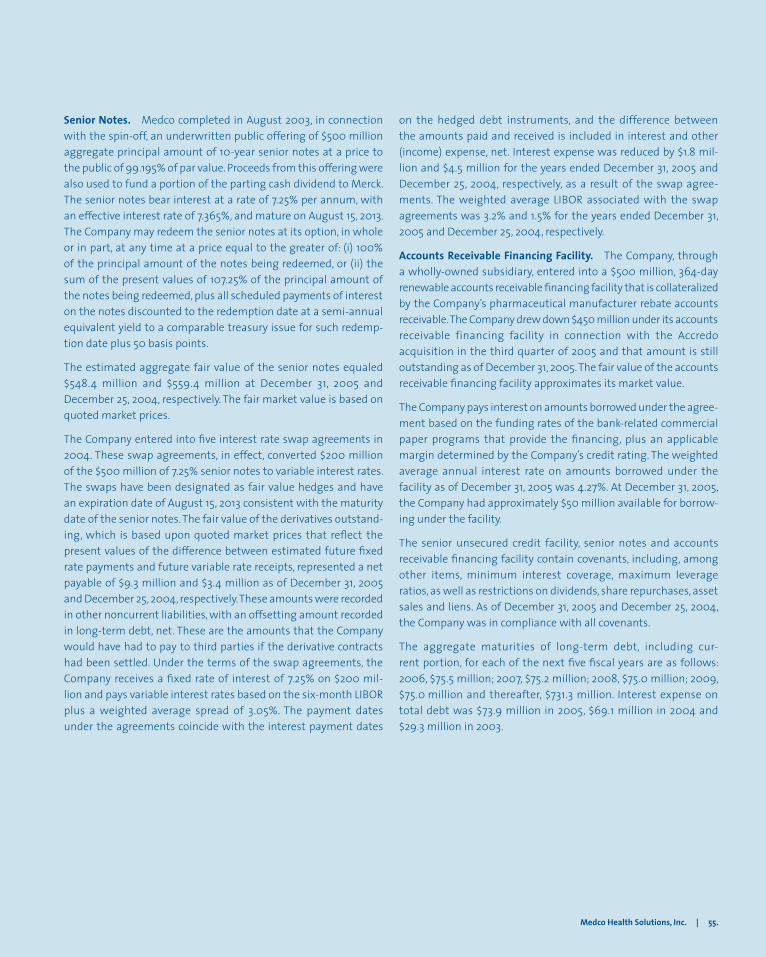
Medco Health Solutions, Inc. | 55.
Senior Notes. Medco completed in August 2003, in connection with the spin-off, an underwritten public offering of $500 million aggregate principal amount of 10-year senior notes at a price to the public of 99.195% of par value. Proceeds from this offering were also used to fund a portion of the parting cash dividend to Merck. The senior notes bear interest at a rate of 7.25% per annum, with an effective interest rate of 7.365%, and mature on August 15, 2013. The Company may redeem the senior notes at its option, in whole or in part, at any time at a price equal to the greater of: (i) 100% of the principal amount of the notes being redeemed, or (ii) the sum of the present values of 107.25% of the principal amount of the notes being redeemed, plus all scheduled payments of interest on the notes discounted to the redemption date at a semi-annual equivalent yield to a comparable treasury issue for such redemp-tion date plus 50 basis points.
The estimated aggregate fair value of the senior notes equaled $548.4 million and $559.4 million at December 31, 2005 and December 25, 2004, respectively. The fair market value is based on quoted market prices.
The Company entered into five interest rate swap agreements in 2004. These swap agreements, in effect, converted $200 million of the $500 million of 7.25% senior notes to variable interest rates. The swaps have been designated as fair value hedges and have an expiration date of August 15, 2013 consistent with the maturity date of the senior notes. The fair value of the derivatives outstand-ing, which is based upon quoted market prices that reflect the present values of the difference between estimated future fixed rate payments and future variable rate receipts, represented a net payable of $9.3 million and $3.4 million as of December 31, 2005 and December 25, 2004, respectively. These amounts were recorded in other noncurrent liabilities, with an offsetting amount recorded in long-term debt, net. These are the amounts that the Company would have had to pay to third parties if the derivative contracts had been settled. Under the terms of the swap agreements, the Company receives a fixed rate of interest of 7.25% on $200 mil-lion and pays variable interest rates based on the six-month LIBOR plus a weighted average spread of 3.05%. The payment dates under the agreements coincide with the interest payment dates
on the hedged debt instruments, and the difference between the amounts paid and received is included in interest and other (income) expense, net. Interest expense was reduced by $1.8 mil-lion and $4.5 million for the years ended December 31, 2005 and December 25, 2004, respectively, as a result of the swap agree-ments. The weighted average LIBOR associated with the swap agreements was 3.2% and 1.5% for the years ended December 31, 2005 and December 25, 2004, respectively.
Accounts Receivable Financing Facility. The Company, through a wholly-owned subsidiary, entered into a $500 million, 364-day renewable accounts receivable financing facility that is collateralized by the Company’s pharmaceutical manufacturer rebate accounts receivable. The Company drew down $450 million under its accounts receivable financing facility in connection with the Accredo acquisition in the third quarter of 2005 and that amount is still outstanding as of December 31, 2005. The fair value of the accounts receivable financing facility approximates its market value.
The Company pays interest on amounts borrowed under the agree-ment based on the funding rates of the bank-related commercial paper programs that provide the financing, plus an applicable margin determined by the Company’s credit rating. The weighted average annual interest rate on amounts borrowed under the facility as of December 31, 2005 was 4.27%. At December 31, 2005, the Company had approximately $50 million available for borrow-ing under the facility.
The senior unsecured credit facility, senior notes and accounts receivable financing facility contain covenants, including, among other items, minimum interest coverage, maximum leverage ratios, as well as restrictions on dividends, share repurchases, asset sales and liens. As of December 31, 2005 and December 25, 2004, the Company was in compliance with all covenants.
The aggregate maturities of long-term debt, including cur-rent portion, for each of the next five fiscal years are as follows: 2006, $75.5 million; 2007, $75.2 million; 2008, $75.0 million; 2009, $75.0 million and thereafter, $731.3 million. Interest expense on total debt was $73.9 million in 2005, $69.1 million in 2004 and $29.3 million in 2003.
56. | Medco Health Solutions, Inc.
| 8. PENSION AND OTHER POSTRETIREMENT BENEFITS
Net Pension and Postretirement Benefit Cost. The Company has various plans covering the majority of its employees. The Company uses its fiscal year-end date as the measurement date for most of its plans. The majority of the net cost for the Company’s pension plans consisted of the following components ($ in millions):
Fiscal Years 2005 2004 2003
Service cost $ 16.2 $ 15.3 $ 15.6Interest cost 5.9 5.6 5.2Expected return on plan assets (8.0) (7.6) (6.9)Net amortization of actuarial losses 0.3 0.4 2.2Net pension cost $ 14.4 $ 13.7 $ 16.1
The Company maintains an unfunded postretirement healthcare benefit plan covering the majority of its employees. The net cost of these postretirement benefits consisted of the following com-ponents ($ in millions):
Fiscal Years 2005 2004 2003
Service cost $ 1.8 $ 2.1 $ 12.9Interest cost 1.8 2.2 5.9Amortization of prior service costs (4.3) (4.4) 0.8Net amortization of actuarial losses 1.7 2.4 1.8Net postretirement benefit cost $ 1.0 $ 2.3 $ 21.4
The Company amended the postretirement healthcare benefit plan in 2003, which reduced benefit obligations, the effect of which is reflected in the amortization of prior service costs com-ponent of the net postretirement benefit cost.
Pension Plan Assets. The Company’s pension plan asset alloca-tion at December 31, 2005, December 25, 2004 and target allocation for 2006 by asset category are as follows:
Percentage of Plan Assets at Target Allocation December 31, December 25, Asset Category 2006 2005 2004
U.S. equity securities 50-60% 51% 55%International equity securities 12-18% 15% 15%Fixed income* 27-33% 34% 30%Total 100% 100%
* Includes cash.
The investment objectives of the Company’s qualified pension plan are designed to generate asset returns that will enable the plan to meet its future benefit obligations. The precise amount for which these obligations will be settled depends on future events, including interest rates, salary increases, and the life expectancy of the plan’s members. The obligations are estimated using actuarial assumptions, based on the current economic environment.
The pension plan seeks to achieve total returns both sufficient to meet expected future obligations, as well as returns greater than its policy benchmark reflecting the target weights of the asset classes used in its targeted strategic asset allocation. The plan’s targeted strategic allocation to each asset class was determined through an asset/liability modeling study. The currently adopted strategic asset allocation targets 70% in equity securities and 30% in fixed income and diversification within specific asset classes of these broad categories. The Company believes that the portfolio’s equity weighting strategy is consistent with investment goals and risk management practices applicable to the long-term nature of the plan’s benefit obligation.
Medco Health Solutions, Inc. | 57.
Unrecognized net (loss) gain amounts reflect experience differen-tials relating to differences between expected and actual returns on plan assets, differences between expected and actual healthcare cost increases, and the effects of changes in actuarial assumptions. Expected returns are based on the market value of assets. Total unrecognized net (loss) gain amounts in excess of certain thresh-olds are amortized into net pension and other postretirement benefit costs over the average remaining service life of employees.
The accumulated benefit obligation for all defined benefit plans was $112.4 million and $98.9 million at December 31, 2005 and December 25, 2004, respectively, and the projected benefit obligation for all defined benefit plans was $123.5 million and $107.4 million at December 31, 2005 and December 25, 2004, respectively. The projected benefit obligation amounts are higher because they include projected future salary increases through expected retirement.
Changes in Plan Assets and Benefit Obligation. Summarized information about the changes in plan assets and benefit obligation is as follows ($ in millions):
Pension Benefits Other Postretirement BenefitsFiscal Years 2005 2004 2005 2004
Fair value of plan assets at beginning of year $ 105.5 $ 96.5 $ — $ — Actual return on plan assets 5.6 9.6 — — Company contributions 11.0 9.3 1.9 2.6Employee contributions — — 1.3 0.7Benefits paid (8.2) (9.9) (3.2) (3.3)Fair value of plan assets at end of year $ 113.9 $ 105.5 $ — $ —
Benefit obligation at beginning of year(1) $ 107.4 $ 94.3 $ 41.4 $ 28.5Service cost 16.4 15.4 1.8 2.1Interest cost 6.0 5.6 1.8 2.2Employee contributions — — 1.3 0.7Actuarial (gains) losses 1.9 2.0 (9.9) 11.2Benefits paid (8.2) (9.9) (3.2) (3.3)Benefit obligation at end of year(1) $ 123.5 $ 107.4 $ 33.2 $ 41.4
(1) Represents the projected benefit obligation for pension benefits and the accumulated benefit obligation for other postretirement benefits.
A reconciliation of the plans’ funded status to the net asset (liability) recognized at year-end 2005 and 2004 is as follows ($ in millions):
Pension Benefits Other Postretirement Benefits 2005 2004 2005 2004
Plan assets in excess of (less than) benefit obligation $ (9.6) $ (1.9) $ (33.2) $ (41.4)Unrecognized net loss 17.2 13.0 33.8 47.1Unrecognized prior service benefit (0.1) (0.1) (53.5) (59.5)Net asset (liability) $ 7.5 $ 11.0 $ (52.9) $ (53.8)
Recognized as:Other current assets $ 8.1 $ 11.5 $ — $ — Other current liabilities (0.6) (0.5) (2.1) (2.7)Other noncurrent liabilities — — (50.8) (51.1)Net asset (liability) $ 7.5 $ 11.0 $ (52.9) $ (53.8)
58. | Medco Health Solutions, Inc.
The Company reassesses its benefit plan assumptions on a regular basis. For 2005, the Company maintained its expected long-term rate of return on plan assets of 8.0% for pension benefits, and at December 31, 2005, changed its discount rates for pension benefits and other postretirement benefits from 5.75% to 5.50% to reflect the prevailing market interest rate environment. The discount rate assumption is determined by considering a portfolio of high-quality corporate bond investments that would provide the future cash flows needed to settle benefit obligations as they came due.
The expected rate of return for the pension plan represents the average rate of return to be earned on the plan assets over the period that the benefits included in the benefit obligation are to be paid. In developing the expected rate of return, the Company considers long-term compound annualized returns of historical market data, as well as historical actual returns on the Company’s plan assets. Using this reference information, the Company devel-ops forward-looking return expectations for each asset category and a weighted average expected long-term rate of return for a targeted portfolio allocated across these investment categories.
Actuarial assumptions are based on management’s best estimates and judgment. A reasonably possible change of plus (minus) 25 basis points in the discount rate assumption, with other assumptions held constant, would have an estimated $0.6 million
favorable (unfavorable) impact on net pension and postretirement benefit cost. A reasonably possible change of plus (minus) 25 basis points in the expected rate of return assumption, with other assumptions held constant, would have an estimated $0.25 mil-lion favorable (unfavorable) impact on net pension cost.
The amended postretirement benefit healthcare plan resulted in future costs being capped based on 2004 costs. As a result, employer liability is not affected by healthcare cost trend after 2004.
The Company will have a minimum pension funding require-ment of $11.8 million under the Internal Revenue Code (“IRC”) during 2006. The preceding hypothetical changes in discount rate and expected rate of return assumptions would not impact the Company’s funding requirements.
Cash Flows.
Employer Contributions. The Company expects to contribute an additional amount up to $5.0 million to its pension plans above the aforementioned minimum pension funding requirement. The expected contributions to the pension plans during 2006 are estimated to reflect amounts necessary to satisfy minimum fund-ing requirements or Medco’s discretion in bringing the plans to a fully funded accumulated benefit obligation status. The Company anticipates that contributions will consist solely of cash.
Actuarial Assumptions. Actuarial weighted average assumptions used in determining plan information are as follows:
Pension Benefits Other Postretirement Benefits 2005 2004 2003 2005 2004 2003
Weighted average assumptions used to determine benefit obligations at fiscal year-end: Discount rate 5.50% 5.75% 6.00% 5.50% 5.75% 6.00% Salary growth rate 4.50% 4.50% 4.50% — — — Weighted average assumptions used to determine net cost for the fiscal year ended: Discount rate 5.75% 6.00% 6.50% 5.75% 6.00% 6.50% Expected long-term rate of return on plan assets 8.00% 8.00% 8.75% — — — Salary growth rate 4.50% 4.50% 4.50% — — —
Medco Health Solutions, Inc. | 59.
Estimated Future Benefit Payments. The following benefit pay-ments, which reflect expected future service, as appropriate, are expected to be paid ($ in millions):
Other Pension Postretirement Fiscal Years Benefits Benefits
2006 $ 7.7 $ 2.12007 $ 8.9 $ 2.02008 $ 10.0 $ 1.92009 $ 11.0 $ 1.92010 $ 12.1 $ 1.82011–2015 $ 77.9 $ 9.3
Other Plans. The Company participates in a multi-employer defined benefit retirement plan that covers certain union employ-ees. The Company made contributions to the plan of $0.2 million in 2005, $0.5 million in 2004 and $1.0 million in 2003.
The Company sponsors defined contribution retirement plans for all eligible employees, as defined in the plan documents. These plans are qualified under Section 401(k) of the IRC. Contributions to the plans are based on employee contributions and a Company matching contribution. The Company’s matching contributions to the plans were $22.4 million in 2005, $20.0 million in 2004 and $17.6 million in 2003.
| 9. TAXES ON INCOME
The components of the provision for income taxes are as follows ($ in millions):
Fiscal Years 2005 2004 2003
Current provision: Federal $ 486.3 $ 209.1 $ 356.6 State 97.7 37.0 88.3 Total 584.0 246.1 444.9Deferred provision (benefit): Federal (172.2) 59.3 (124.0) State (60.9) 19.3 (18.0) Total (233.1) 78.6 (142.0)Total provision for income taxes $ 350.9 $ 324.7 $ 302.9
A reconciliation between the Company’s effective tax rate and the U.S. statutory rate is as follows:
Fiscal Years 2005 2004 2003
U.S. statutory rate applied to pretax income 35.0% 35.0% 35.0%Differential arising from: State taxes 2.5 4.6 6.2 Other (0.7) 0.7 0.4Effective tax rate 36.8% 40.3% 41.6%
The Company’s effective tax rate decreased to 36.8% for the year ended December 31, 2005 compared to 40.3% for the year ended December 25, 2004. The decrease in the effective rate for the year reflects a $25.7 million nonrecurring benefit recorded in the third quarter of 2005 associated with a reduction in the Company’s mar-ginal state income tax rate resulting primarily from an enacted change in a state income tax law and the receipt of a favorable state income tax ruling. A reduction in the Company’s marginal state income tax rate creates a benefit via a corresponding reduc-tion of the Company’s net deferred tax liabilities, principally on its net intangible assets, partially offset by deferred tax assets pri-marily from client rebates payable and other accruals.
During 2004, the Company completed a study of its state tax posi-tion for the apportionment of its income, based on its business activities and tax strategies existing as of the spin-off date from Merck. The study included formalization during the second quarter of its state income tax position through rulings from and discus-sions with taxing authorities in key selected states. As a result of the outcome of the study, the Company has determined that its income taxes as a stand-alone taxpayer should be provided at a lower effective rate than the rate it used as a member of the Merck consolidated group. For all periods presented, the Company’s con-solidated balance sheets reflect a net deferred tax liability, which arises from its deferred tax liabilities, principally on its intangible assets being only partially offset by its deferred tax assets, prin-cipally on client rebates payable and other accruals. Accordingly, a reduction in the Company’s effective tax rate results in a ben-efit from the reduction of that net deferred tax liability. As a result of the study, the Company expects to settle its net deferred tax liability as a stand-alone taxpayer at an effective rate lower than it
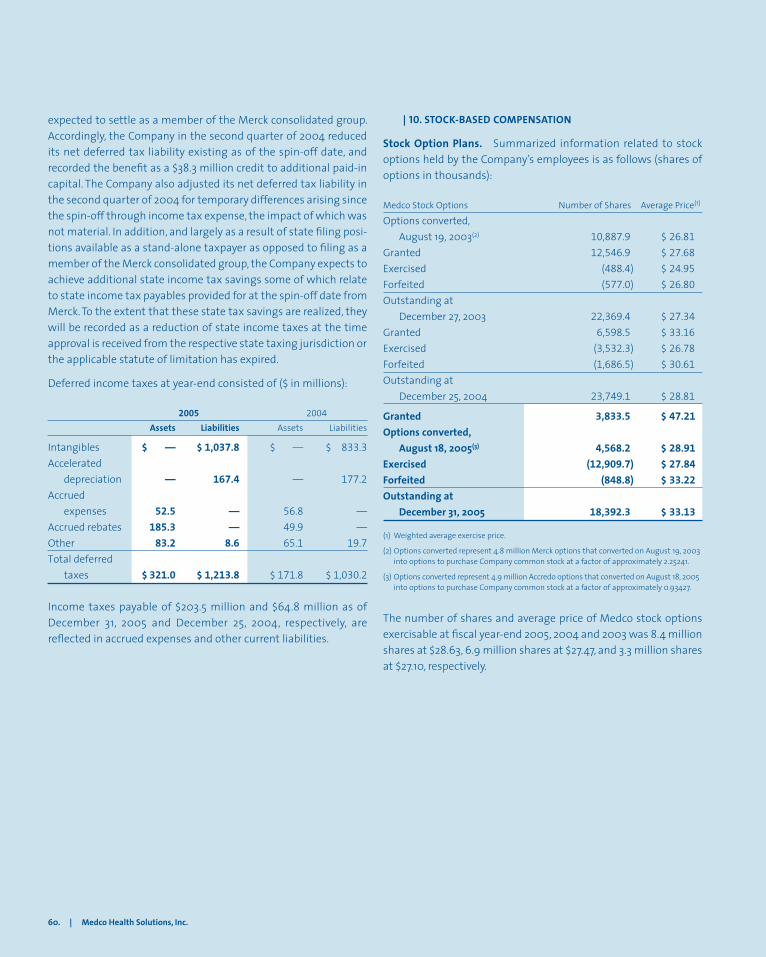
60. | Medco Health Solutions, Inc.
expected to settle as a member of the Merck consolidated group. Accordingly, the Company in the second quarter of 2004 reduced its net deferred tax liability existing as of the spin-off date, and recorded the benefit as a $38.3 million credit to additional paid-in capital. The Company also adjusted its net deferred tax liability in the second quarter of 2004 for temporary differences arising since the spin-off through income tax expense, the impact of which was not material. In addition, and largely as a result of state filing posi-tions available as a stand-alone taxpayer as opposed to filing as a member of the Merck consolidated group, the Company expects to achieve additional state income tax savings some of which relate to state income tax payables provided for at the spin-off date from Merck. To the extent that these state tax savings are realized, they will be recorded as a reduction of state income taxes at the time approval is received from the respective state taxing jurisdiction or the applicable statute of limitation has expired.
Deferred income taxes at year-end consisted of ($ in millions):
2005 2004 Assets Liabilities Assets Liabilities
Intangibles $ — $ 1,037.8 $ — $ 833.3Accelerated depreciation — 167.4 — 177.2Accrued expenses 52.5 — 56.8 —Accrued rebates 185.3 — 49.9 —Other 83.2 8.6 65.1 19.7Total deferred taxes $ 321.0 $ 1,213.8 $ 171.8 $ 1,030.2
Income taxes payable of $203.5 million and $64.8 million as of December 31, 2005 and December 25, 2004, respectively, are reflected in accrued expenses and other current liabilities.
| 10. STOCK-BASED COMPENSATION
Stock Option Plans. Summarized information related to stock options held by the Company’s employees is as follows (shares of options in thousands):
Medco Stock Options Number of Shares Average Price(1)
Options converted, August 19, 2003(2) 10,887.9 $ 26.81Granted 12,546.9 $ 27.68Exercised (488.4) $ 24.95Forfeited (577.0) $ 26.80Outstanding at December 27, 2003 22,369.4 $ 27.34Granted 6,598.5 $ 33.16Exercised (3,532.3) $ 26.78Forfeited (1,686.5) $ 30.61Outstanding at December 25, 2004 23,749.1 $ 28.81
Granted 3,833.5 $ 47.21Options converted, August 18, 2005(3) 4,568.2 $ 28.91Exercised (12,909.7) $ 27.84Forfeited (848.8) $ 33.22Outstanding at December 31, 2005 18,392.3 $ 33.13
(1) Weighted average exercise price.
(2) Options converted represent 4.8 million Merck options that converted on August 19, 2003 into options to purchase Company common stock at a factor of approximately 2.25241.
(3) Options converted represent 4.9 million Accredo options that converted on August 18, 2005 into options to purchase Company common stock at a factor of approximately 0.93427.
The number of shares and average price of Medco stock options exercisable at fiscal year-end 2005, 2004 and 2003 was 8.4 million shares at $28.63, 6.9 million shares at $27.47, and 3.3 million shares at $27.10, respectively.
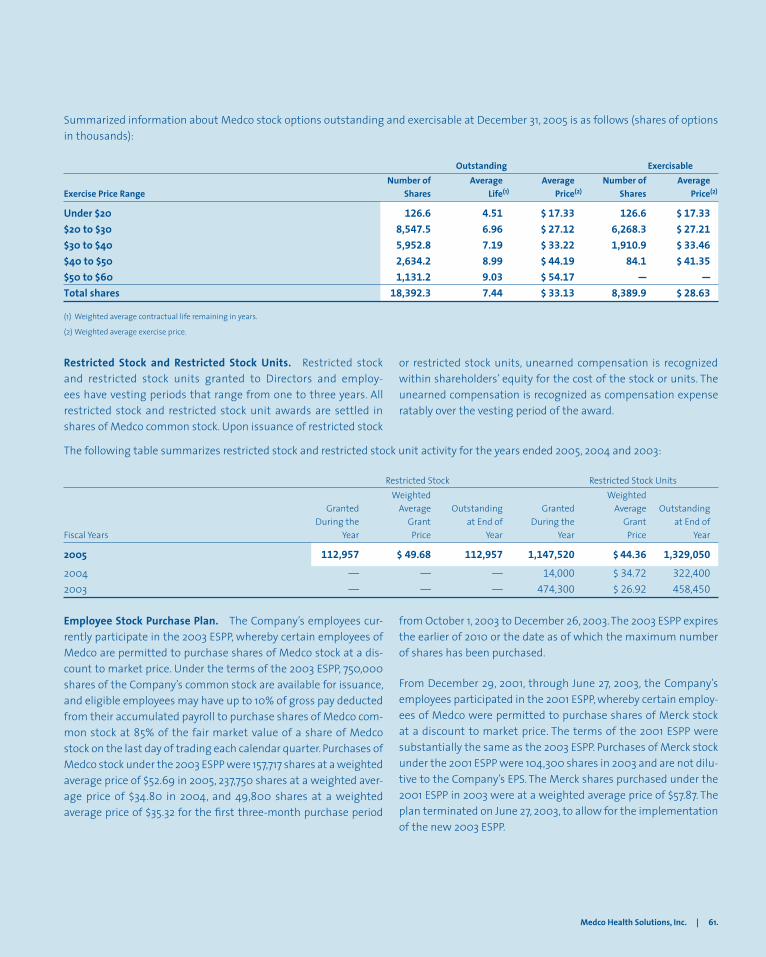
Medco Health Solutions, Inc. | 61.
Employee Stock Purchase Plan. The Company’s employees cur-rently participate in the 2003 ESPP, whereby certain employees of Medco are permitted to purchase shares of Medco stock at a dis-count to market price. Under the terms of the 2003 ESPP, 750,000 shares of the Company’s common stock are available for issuance, and eligible employees may have up to 10% of gross pay deducted from their accumulated payroll to purchase shares of Medco com-mon stock at 85% of the fair market value of a share of Medco stock on the last day of trading each calendar quarter. Purchases of Medco stock under the 2003 ESPP were 157,717 shares at a weighted average price of $52.69 in 2005, 237,750 shares at a weighted aver-age price of $34.80 in 2004, and 49,800 shares at a weighted average price of $35.32 for the first three-month purchase period
from October 1, 2003 to December 26, 2003. The 2003 ESPP expires the earlier of 2010 or the date as of which the maximum number of shares has been purchased.
From December 29, 2001, through June 27, 2003, the Company’s employees participated in the 2001 ESPP, whereby certain employ-ees of Medco were permitted to purchase shares of Merck stock at a discount to market price. The terms of the 2001 ESPP were substantially the same as the 2003 ESPP. Purchases of Merck stock under the 2001 ESPP were 104,300 shares in 2003 and are not dilu-tive to the Company’s EPS. The Merck shares purchased under the 2001 ESPP in 2003 were at a weighted average price of $57.87. The plan terminated on June 27, 2003, to allow for the implementation of the new 2003 ESPP.
Summarized information about Medco stock options outstanding and exercisable at December 31, 2005 is as follows (shares of options in thousands):
Outstanding ExercisableExercise Price Range Number of Average Average Number of Average Exercise Price Range Shares Life(1) Price(2) Shares Price(2)
Under $20 126.6 4.51 $ 17.33 126.6 $ 17.33$20 to $30 8,547.5 6.96 $ 27.12 6,268.3 $ 27.21$30 to $40 5,952.8 7.19 $ 33.22 1,910.9 $ 33.46$40 to $50 2,634.2 8.99 $ 44.19 84.1 $ 41.35$50 to $60 1,131.2 9.03 $ 54.17 — —Total shares 18,392.3 7.44 $ 33.13 8,389.9 $ 28.63
(1) Weighted average contractual life remaining in years.
(2) Weighted average exercise price.
Restricted Stock and Restricted Stock Units. Restricted stock and restricted stock units granted to Directors and employ-ees have vesting periods that range from one to three years. All restricted stock and restricted stock unit awards are settled in shares of Medco common stock. Upon issuance of restricted stock
or restricted stock units, unearned compensation is recognized within shareholders’ equity for the cost of the stock or units. The unearned compensation is recognized as compensation expense ratably over the vesting period of the award.
The following table summarizes restricted stock and restricted stock unit activity for the years ended 2005, 2004 and 2003:
Restricted Stock Restricted Stock Units Weighted Weighted Granted Average Outstanding Granted Average Outstanding During the Grant at End of During the Grant at End of Fiscal Years Year Price Year Year Price Year
2005 112,957 $ 49.68 112,957 1,147,520 $ 44.36 1,329,0502004 — — — 14,000 $ 34.72 322,4002003 — — — 474,300 $ 26.92 458,450
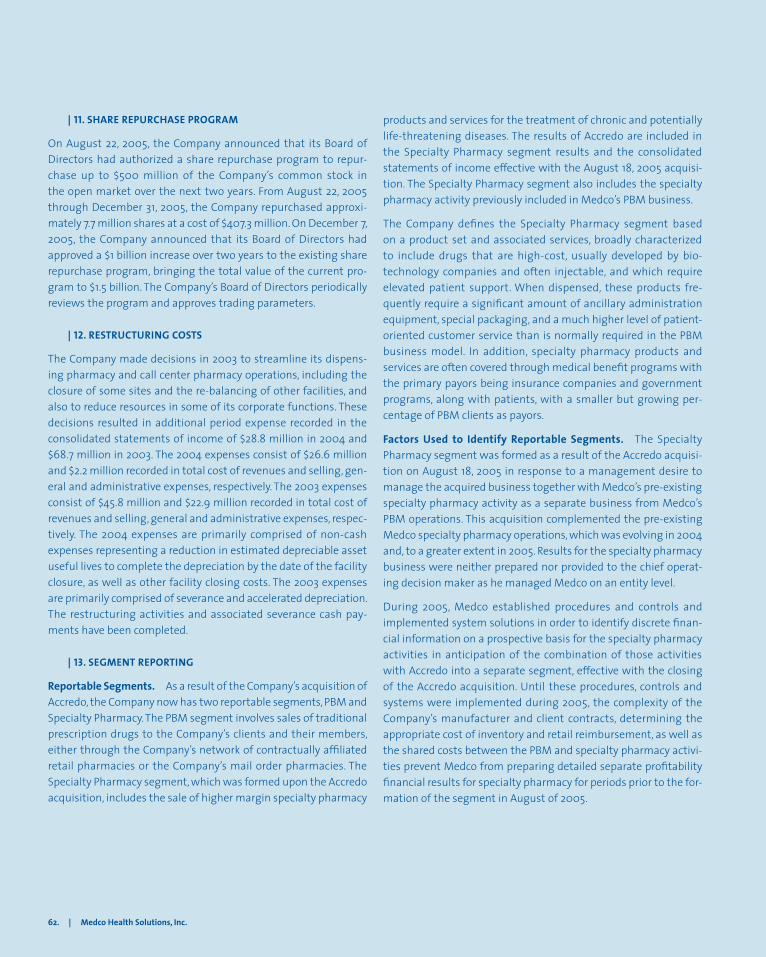
62. | Medco Health Solutions, Inc.
| 11. SHARE REPURCHASE PROGRAM
On August 22, 2005, the Company announced that its Board of Directors had authorized a share repurchase program to repur-chase up to $500 million of the Company’s common stock in the open market over the next two years. From August 22, 2005 through December 31, 2005, the Company repurchased approxi-mately 7.7 million shares at a cost of $407.3 million. On December 7, 2005, the Company announced that its Board of Directors had approved a $1 billion increase over two years to the existing share repurchase program, bringing the total value of the current pro-gram to $1.5 billion. The Company’s Board of Directors periodically reviews the program and approves trading parameters.
| 12. RESTRUCTURING COSTS
The Company made decisions in 2003 to streamline its dispens-ing pharmacy and call center pharmacy operations, including the closure of some sites and the re-balancing of other facilities, and also to reduce resources in some of its corporate functions. These decisions resulted in additional period expense recorded in the consolidated statements of income of $28.8 million in 2004 and $68.7 million in 2003. The 2004 expenses consist of $26.6 million and $2.2 million recorded in total cost of revenues and selling, gen-eral and administrative expenses, respectively. The 2003 expenses consist of $45.8 million and $22.9 million recorded in total cost of revenues and selling, general and administrative expenses, respec-tively. The 2004 expenses are primarily comprised of non-cash expenses representing a reduction in estimated depreciable asset useful lives to complete the depreciation by the date of the facility closure, as well as other facility closing costs. The 2003 expenses are primarily comprised of severance and accelerated depreciation. The restructuring activities and associated severance cash pay-ments have been completed.
| 13. SEGMENT REPORTING
Reportable Segments. As a result of the Company’s acquisition of Accredo, the Company now has two reportable segments, PBM and Specialty Pharmacy. The PBM segment involves sales of traditional prescription drugs to the Company’s clients and their members, either through the Company’s network of contractually affiliated retail pharmacies or the Company’s mail order pharmacies. The Specialty Pharmacy segment, which was formed upon the Accredo acquisition, includes the sale of higher margin specialty pharmacy
products and services for the treatment of chronic and potentially life-threatening diseases. The results of Accredo are included in the Specialty Pharmacy segment results and the consolidated statements of income effective with the August 18, 2005 acquisi-tion. The Specialty Pharmacy segment also includes the specialty pharmacy activity previously included in Medco’s PBM business.
The Company defines the Specialty Pharmacy segment based on a product set and associated services, broadly characterized to include drugs that are high-cost, usually developed by bio-technology companies and often injectable, and which require elevated patient support. When dispensed, these products fre-quently require a significant amount of ancillary administration equipment, special packaging, and a much higher level of patient-oriented customer service than is normally required in the PBM business model. In addition, specialty pharmacy products and services are often covered through medical benefit programs with the primary payors being insurance companies and government programs, along with patients, with a smaller but growing per-centage of PBM clients as payors.
Factors Used to Identify Reportable Segments. The Specialty Pharmacy segment was formed as a result of the Accredo acquisi-tion on August 18, 2005 in response to a management desire to manage the acquired business together with Medco’s pre-existing specialty pharmacy activity as a separate business from Medco’s PBM operations. This acquisition complemented the pre-existing Medco specialty pharmacy operations, which was evolving in 2004 and, to a greater extent in 2005. Results for the specialty pharmacy business were neither prepared nor provided to the chief operat-ing decision maker as he managed Medco on an entity level.
During 2005, Medco established procedures and controls and implemented system solutions in order to identify discrete finan-cial information on a prospective basis for the specialty pharmacy activities in anticipation of the combination of those activities with Accredo into a separate segment, effective with the closing of the Accredo acquisition. Until these procedures, controls and systems were implemented during 2005, the complexity of the Company’s manufacturer and client contracts, determining the appropriate cost of inventory and retail reimbursement, as well as the shared costs between the PBM and specialty pharmacy activi-ties prevent Medco from preparing detailed separate profitability financial results for specialty pharmacy for periods prior to the for-mation of the segment in August of 2005.
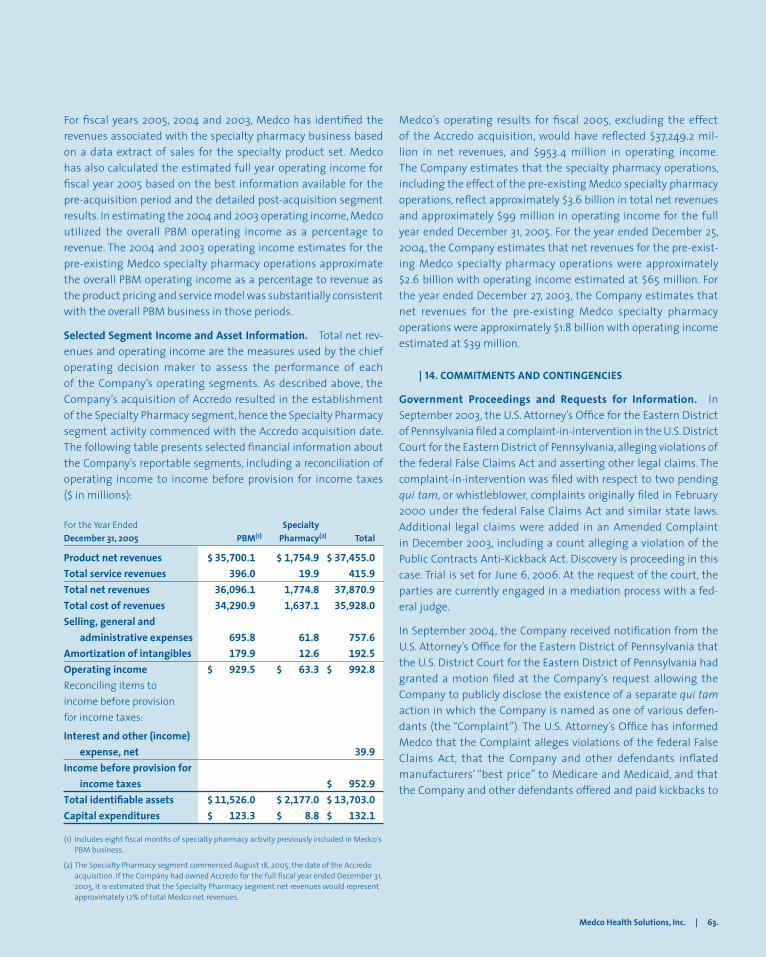
Medco Health Solutions, Inc. | 63.
Medco’s operating results for fiscal 2005, excluding the effect of the Accredo acquisition, would have reflected $37,249.2 mil-lion in net revenues, and $953.4 million in operating income. The Company estimates that the specialty pharmacy operations, including the effect of the pre-existing Medco specialty pharmacy operations, reflect approximately $3.6 billion in total net revenues and approximately $99 million in operating income for the full year ended December 31, 2005. For the year ended December 25, 2004, the Company estimates that net revenues for the pre-exist-ing Medco specialty pharmacy operations were approximately $2.6 billion with operating income estimated at $65 million. For the year ended December 27, 2003, the Company estimates that net revenues for the pre-existing Medco specialty pharmacy operations were approximately $1.8 billion with operating income estimated at $39 million.
| 14. COMMITMENTS AND CONTINGENCIES
Government Proceedings and Requests for Information. In September 2003, the U.S. Attorney’s Office for the Eastern District of Pennsylvania filed a complaint-in-intervention in the U.S. District Court for the Eastern District of Pennsylvania, alleging violations of the federal False Claims Act and asserting other legal claims. The complaint-in-intervention was filed with respect to two pending qui tam, or whistleblower, complaints originally filed in February 2000 under the federal False Claims Act and similar state laws. Additional legal claims were added in an Amended Complaint in December 2003, including a count alleging a violation of the Public Contracts Anti-Kickback Act. Discovery is proceeding in this case. Trial is set for June 6, 2006. At the request of the court, the parties are currently engaged in a mediation process with a fed-eral judge.
In September 2004, the Company received notification from the U.S. Attorney’s Office for the Eastern District of Pennsylvania that the U.S. District Court for the Eastern District of Pennsylvania had granted a motion filed at the Company’s request allowing the Company to publicly disclose the existence of a separate qui tam action in which the Company is named as one of various defen-dants (the “Complaint”). The U.S. Attorney’s Office has informed Medco that the Complaint alleges violations of the federal False Claims Act, that the Company and other defendants inflated manufacturers’ “best price” to Medicare and Medicaid, and that the Company and other defendants offered and paid kickbacks to
For fiscal years 2005, 2004 and 2003, Medco has identified the revenues associated with the specialty pharmacy business based on a data extract of sales for the specialty product set. Medco has also calculated the estimated full year operating income for fiscal year 2005 based on the best information available for the pre-acquisition period and the detailed post-acquisition segment results. In estimating the 2004 and 2003 operating income, Medco utilized the overall PBM operating income as a percentage to revenue. The 2004 and 2003 operating income estimates for the pre-existing Medco specialty pharmacy operations approximate the overall PBM operating income as a percentage to revenue as the product pricing and service model was substantially consistent with the overall PBM business in those periods.
Selected Segment Income and Asset Information. Total net rev-enues and operating income are the measures used by the chief operating decision maker to assess the performance of each of the Company’s operating segments. As described above, the Company’s acquisition of Accredo resulted in the establishment of the Specialty Pharmacy segment, hence the Specialty Pharmacy segment activity commenced with the Accredo acquisition date. The following table presents selected financial information about the Company’s reportable segments, including a reconciliation of operating income to income before provision for income taxes ($ in millions):
For the Year Ended Specialty December 31, 2005 PBM(1) Pharmacy(2) Total
Product net revenues $ 35,700.1 $ 1,754.9 $ 37,455.0Total service revenues 396.0 19.9 415.9Total net revenues 36,096.1 1,774.8 37,870.9Total cost of revenues 34,290.9 1,637.1 35,928.0Selling, general and administrative expenses 695.8 61.8 757.6Amortization of intangibles 179.9 12.6 192.5Operating income $ 929.5 $ 63.3 $ 992.8Reconciling items to income before provision for income taxes:
Interest and other (income) expense, net 39.9Income before provision for income taxes $ 952.9Total identifiable assets $ 11,526.0 $ 2,177.0 $ 13,703.0Capital expenditures $ 123.3 $ 8.8 $ 132.1
(1) Includes eight fiscal months of specialty pharmacy activity previously included in Medco’s PBM business.
(2) The Specialty Pharmacy segment commenced August 18, 2005, the date of the Accredo acquisition. If the Company had owned Accredo for the full fiscal year ended December 31, 2005, it is estimated that the Specialty Pharmacy segment net revenues would represent approximately 12% of total Medco net revenues.
64. | Medco Health Solutions, Inc.
third parties to induce the placement on formularies and promo-tion of certain drugs. In January 2005, Medco received a subpoena from the Department of Health and Human Services Office of Inspector General (“OIG”) requesting documents that relate to this Complaint. The government agreed to suspend enforcement of the OIG subpoena until October 1, 2005. After discussions with the government, Medco has agreed to turn over documents sub-ject to negotiated protections.
In January 2005, the Company received a letter from the U.S. Attorney’s Office for the Eastern District of Pennsylvania request-ing information and representations regarding Medco’s Medicare coordination of benefits recovery program. The Company and the U.S. Attorney’s Office are in discussions regarding the request.
In December 2005, the District Court for the Eastern District of Pennsylvania ordered unsealed a qui tam complaint naming the Company as a defendant that alleged, inter alia, violations of performance guarantees in contracts with the government. The complaint was largely duplicative of the above-discussed action. The U.S. Attorney’s Office for the Eastern District of Pennsylvania later filed a motion declining to intervene. Subsequently, in January 2006, the plaintiff filed a motion to dismiss the complaint without prejudice, which the court granted.
On December 22, 2003, the Board of the State Teachers Retirement System of Ohio (“STRS”), a former client, filed a complaint against Merck and the Company in the Ohio Court of Common Pleas, alleging, among other things, violations of the contract between STRS and Medco and other state law claims. This case was tried before a jury in November and December 2005. The jury did not reach a verdict on whether Medco violated its contract with STRS. It rendered a verdict in favor of STRS on two counts for a total of $7.8 million. It rendered a verdict in favor of Merck on a claim of tortious interference with the contract. Medco has accrued for the amount of the jury verdict and plans to appeal the unfavorable components of the verdict.
On April 13, 2005, the Company received a request for information from the Attorney General of the State of Texas in connection with the Attorney General’s investigation of whether PBMs are enforc-ing or relying on certain plan limitations to reject, deny or reduce payment on requests for Medicaid reimbursement made to PBMs by or on behalf of a state Medicaid agency.
The Company continues to believe that its business practices com-ply in all material respects with applicable laws and regulations and it will continue to vigorously defend itself in these actions.
ERISA and Similar Litigation. In December 1997, a lawsuit cap-tioned Gruer v. Merck-Medco Managed Care, L.L.C. was filed in the U.S. District Court for the Southern District of New York against Merck and the Company. The suit alleges that the Company should be treated as a “fiduciary” under the provisions of ERISA (the Employee Retirement Income Security Act of 1974) and that the Company has breached fiduciary obligations under ERISA in a vari-ety of ways. After the Gruer case was filed, a number of other cases were filed in the same court asserting similar claims. In December 2002, Merck and the Company agreed to settle the Gruer series of lawsuits on a class action basis for $42.5 million, and agreed to certain business practice changes, to avoid the significant cost and distraction of protracted litigation. The release of claims under the settlement applies to plans for which the Company has adminis-tered a pharmacy benefit at any time between December 17, 1994 and the date of final approval. It does not involve the release of any potential antitrust claims. The plaintiff in one of the cases discussed above, Blumenthal v. Merck-Medco Managed Care, L.L.C., et al. has elected to opt out of the settlement. In May 2004, the district court granted final approval to the settlement and a Final Judgment was entered in June 2004. The settlement becomes final only after all appeals have been exhausted. Two appeals were filed. On December 8, 2005, the U.S. Court of Appeals for the Second Circuit vacated the district court’s Final Judgment and ordered the district court to consider whether the plaintiffs representing the settlement class had legal standing to assert their claims. The Court of Appeals declined to address other issues raised in the appeals until after the district court ruled on the standing issue.
Similar ERISA-based complaints against the Company and Merck were filed in eight additional actions by ERISA plan participants, purportedly on behalf of their plans, and, in some of the actions, similarly situated self-funded plans. The ERISA plans themselves, which were not parties to these lawsuits, had elected to partici-pate in the settlement discussed above and, accordingly, seven of these actions had been dismissed pursuant to the Final Judgment discussed above. The plaintiff in another action, Betty Jo Jones v. Merck-Medco Managed Care, L.L.C., et al., has filed a Second Amended Complaint, in which she seeks to represent a class of all
Medco Health Solutions, Inc. | 65.
participants and beneficiaries of ERISA plans that required such participants to pay a percentage co-payment on prescription drugs. The effect of the release under the settlement discussed above on the Jones action has not yet been litigated. In addition to these cases, a proposed class action complaint against Merck and the Company has been filed by trustees of another benefit plan, the United Food and Commercial Workers Local Union No. 1529 and Employers Health and Welfare Plan Trust, in the U.S. District Court for the Northern District of California. This plan has elected to opt out of the settlement. The United Food action has been transferred and consolidated in the U.S. District Court for the Southern District of New York by order of the Judicial Panel on Multidistrict Litigation.
In April 2003, a lawsuit captioned Peabody Energy Corporation v. Medco Health Solutions, Inc., et al. was filed in the U.S. District Court for the Eastern District of Missouri. The complaint, filed by one of the Company’s former clients, relies on allegations similar to those in the ERISA cases discussed above, in addition to allega-tions relating specifically to Peabody, which has elected to opt out of the settlement described above. In December 2003, Peabody filed a similar action against Merck in the U.S. District Court for the Eastern District of Missouri. Both of these actions have been transferred to the U.S. District Court for the Southern District of New York to be consolidated with the ERISA cases pending against Merck and the Company in that court.
In March 2003, a lawsuit captioned American Federation of State, County and Municipal Employees (AFSCME) v. AdvancePCS et al. based on allegations similar to those in the ERISA cases discussed above, was filed against the Company and other major PBMs in the Superior Court of California. The theory of liability in this action is based on a California law prohibiting unfair business practices. The plaintiff, which purports to sue on behalf of itself, California non-ERISA health plans, and all individual participants in such plans, seeks injunctive relief and disgorgement of revenues that were allegedly improperly received by the Company. In March 2005, the court in the AFSCME case dismissed that action with prejudice. That ruling is being appealed.
In September 2002, a lawsuit captioned Miles v. Merck-Medco Managed Care, L.L.C., based on allegations similar to those in the ERISA cases discussed above, was filed against Merck and the Company in the Superior Court of California. The theory of liability
in this action is based on a California law prohibiting unfair busi-ness practices. The Miles case was removed to the U.S. District Court for the Southern District of California and was later trans-ferred to the U.S. District Court for the Southern District of New York and consolidated with the ERISA cases pending against Merck and the Company in that court.
In October 2002, the Company filed a declaratory judgment action, captioned Medco Health Solutions, Inc. v. West Virginia Public Employees Insurance Agency, in the Circuit Court of Kanawha County, West Virginia, asserting the Company’s right to retain certain cost savings in accordance with the Company’s written agreement with the West Virginia Public Employees Insurance Agency, or PEIA. In November 2002, the State of West Virginia and PEIA filed a separate lawsuit against Merck and the Company in the same court. This action was premised on several state law theories, including violations of the West Virginia Consumer Credit and Protection Act, conspiracy, tortious interference, unjust enrich-ment, accounting, fraud and breach of contract. PEIA later filed a counter claim in the declaratory judgment action and the State of West Virginia, which was joined as a party, filed a third-party com-plaint against the Company and Merck. This case continues with a variety of motions and rulings by the court, including dismissal of some of PEIA’s and the State’s claims. The litigation is progressing with fact discovery.
In July 2003, a lawsuit captioned Group Hospitalization and Medical Services v. Merck-Medco Managed Care, L.L.C., et al. was filed against the Company in the Superior Court of New Jersey. In this action, the Company’s former client, CareFirst Blue Cross Blue Shield, asserts claims for violation of fiduciary duty under state law; breach of contract; negligent misrepresentation; unjust enrichment; violations of certain District of Columbia laws regard-ing consumer protection and restraint of trade; and violation of a New Jersey law prohibiting racketeering. The plaintiff demands compensatory damages, punitive damages, treble damages for certain claims, and restitution.
The Company does not believe that it is a fiduciary, and believes that its business practices comply with all applicable laws and regulations. The Company has denied all allegations of wrongdo-ing and is vigorously defending all of the lawsuits described above, although the Company has proposed to settle some of them as described above.
66. | Medco Health Solutions, Inc.
Antitrust and Related Litigation. In August, 2003, a lawsuit cap-tioned Brady Enterprises, Inc., et al. v. Medco Health Solutions, Inc., et al. was filed in the U.S. District Court for the Eastern District of Pennsylvania against Merck and the Company. The plaintiffs, who seek to represent a national class of retail pharmacies that have contracted with the Company, allege that the Company has conspired with, acted as the common agent for, and used the com-bined bargaining power of plan sponsors to restrain competition in the market for the dispensing and sale of prescription drugs. The plaintiffs allege that, through the alleged conspiracy, the Company has engaged in various forms of anticompetitive conduct, includ-ing, among other things, setting artificially low reimbursement rates to such pharmacies. The plaintiffs assert claims for violation of the Sherman Act and seek treble damages and injunctive relief. The plaintiffs’ motion for class certification is currently pending.
In October 2003, a lawsuit captioned North Jackson Pharmacy, Inc., et al. v. Medco Health Solutions, Inc., et al. was filed in the U.S. District Court for the Northern District of Alabama against Merck and the Company. In their Second Amended Complaint, the plain-tiffs allege that Merck and the Company have engaged in price fixing and other unlawful concerted actions with others, includ-ing other PBMs, to restrain trade in the dispensing and sale of prescription drugs to customers of retail pharmacies who par-ticipate in programs or plans that pay for all or part of the drugs dispensed, and have conspired with, acted as the common agent for, and used the combined bargaining power of plan sponsors to restrain competition in the market for the dispensing and sale of prescription drugs. The plaintiffs allege that, through such con-certed action, Merck and the Company have engaged in various forms of anticompetitive conduct, including, among other things, setting reimbursement rates to such pharmacies at unreasonably low levels. The plaintiffs assert claims for violation of the Sherman Act and seek treble damages and injunctive relief. The plaintiffs’ motion for class certification is currently pending.
In January 2004, a lawsuit captioned Alameda Drug Company, Inc., et al. v. Medco Health Solutions, Inc., et al. was filed against the Company and Merck in the Superior Court of California. The plaintiffs, which seek to represent a class of all California phar-macies that have contracted with the Company and that have indirectly purchased prescription drugs from Merck, allege, among
other things, that since the expiration of a 1995 consent injunc-tion entered by the U.S. District Court for the Northern District of California, if not earlier, the Company has failed to maintain an Open Formulary (as defined in the consent injunction), and that the Company and Merck had failed to prevent nonpublic informa-tion received from competitors of Merck and the Company from being disclosed to each other. The complaint also copies verbatim many of the allegations in the Amended Complaint filed by the U.S. Attorney for the Eastern District of Pennsylvania, discussed above. The plaintiffs further allege that, as a result of these alleged prac-tices, the Company has been able to increase its market share and artificially reduce the level of reimbursement to the retail phar-macy class members, and that the prices of prescription drugs from Merck and other pharmaceutical manufacturers that do business with the Company have been fixed and raised above competitive levels. The plaintiffs assert claims for violation of California anti-trust law and California law prohibiting unfair business practices. The plaintiffs demand, among other things, compensatory dam-ages, restitution, disgorgement of unlawfully obtained profits, and injunctive relief. In an Amended Complaint, the plaintiff further alleges, among other things, that the Company acts as a purchas-ing agent for its plan sponsor customers, resulting in a system that serves to suppress competition.
In December 2005, a lawsuit captioned Mike’s Medical Center Pharmacy, et al. v. Medco Health Solutions, Inc., et al. was filed against the Company and Merck in the U.S. District Court for the Northern District of California. The plaintiffs seek to represent a class of all pharmacies and pharmacists that have contracted with the Company and California pharmacies that have indirectly purchased prescription drugs from Merck and make factual alle-gations similar to those in the Alameda Drug Company action discussed above. The plaintiffs assert claims for violation of the Sherman Act, California antitrust law, and California law prohibit-ing unfair business practices. The plaintiffs demand, among other things, treble damages, restitution, disgorgement of unlawfully obtained profits, and injunctive relief.
In February 2006, a lawsuit captioned Chelsea Family Pharmacy, PLLC v. Medco Health Solutions, Inc., was filed in the U.S. District Court for the Northern District of Oklahoma. The plaintiff, which seeks to represent a class of Oklahoma pharmacies that have
Medco Health Solutions, Inc. | 67.
contracted with the Company within the last three years, alleges, among other things, that the Company has contracted with retail pharmacies at rates that are less than the prevailing rates paid by ordinary consumers and has denied consumers their choice of pharmacy by placing restrictions on the plaintiff’s ability to dis-pense pharmaceutical goods and services. The plaintiff asserts that the Company’s activities violate the Oklahoma Third Party Prescription Act, and seeks, among other things, compensatory damages, attorney’s fees, and injunctive relief.
The Company denies all allegations of wrongdoing and intends to vigorously defend these cases.
Contract Litigation. In September 2004, the Company’s former client, Horizon Blue Cross Blue Shield of New Jersey (“Horizon”), filed an action in the Superior Court of New Jersey, Bergen County, alleging, among other things, that the Company breached its contract with Horizon in various respects, breached the implied covenant of good faith and fair dealing, and was unjustly enriched. The Company has denied Horizon’s allegations and is vigorously defending itself in this action. The Company has filed counter-claims against Horizon.
In February 2005, a lawsuit captioned CAM Enterprises, Inc. v. Merck & Co., Inc. and Medco Health Solutions, Inc., et al. was filed in the Circuit Court of Jefferson County, Alabama. The plaintiff, which seeks to represent a national class of independent retail phar-macies that have contracted with the Company under a formula that included the Average Wholesale Price (“AWP”) as a method of reimbursement, alleges, among other things, that the Company has refused to reimburse the plaintiff using the correct AWP and has deceptively misled the plaintiff regarding the nature of the Company’s AWP reimbursement methodology for brand-name prescriptions. The plaintiff asserts claims for misrepresentation/suppression, breach of contract, unjust enrichment, and conspir-acy. The plaintiff seeks compensatory damages, punitive damages, imposition of a constructive trust, and injunctive relief.
The Company denies all allegations of wrongdoing and intends to vigorously defend these cases.
Accredo. As previously disclosed by Accredo, Accredo and an 80%-owned subsidiary of Accredo (the “Joint Venture”) provided
contract pharmacy and related billing services to a third-party pharmacy (the “Local Pharmacy”) that was the subject of a cer-tain state agency audit. The state agency temporarily withheld payments from the Local Pharmacy and alleged, among other things, overbilling and false claims. In December 2005, the par-ties finalized a settlement involving a civil payment by Accredo of $30 million, which Accredo had accrued in its financial statements prior to the acquisition.
Separately, Accredo and the Joint Venture sold clotting factor to a second third-party pharmacy that is the subject of a similar state agency audit. On January 20, 2006, the agency issued a preliminary assessment of its findings, which included allegations of overbill-ing and false claims. Since that time, Accredo has been involved in a dialogue with the agency and is in the process of providing additional information and documents for the agency to consider in connection with its ultimate findings.
Accredo and two of its officers are defendants in a class action lawsuit filed in the United States District Court for the Western District of Tennessee. Certain Accredo officers and former direc-tors are defendants in a related stockholders derivative suit filed in the Circuit Court of Shelby County, Tennessee. Plaintiffs in the class action lawsuit allege that the officer’s actions and omissions con-stitute violations of various sections of the Securities Exchange Act of 1934. Plaintiffs in the derivative suit allege that the officers and former directors have breached their fiduciary duty to Accredo.
Other. The Company entered into an indemnification and insur-ance matters agreement with Merck in connection with the spin-off. To the extent that the Company is required to indemnify Merck for liabilities arising out of a lawsuit, an adverse outcome with respect to Merck could result in the Company making indem-nification payments in amounts that could be material, in addition to any damages that the Company is required to pay.
In 2003, the State of Maine enacted a statute entitled the Unfair Prescription Drug Practices Act (the “MUPDPA”), which imposed fiduciary obligations upon pharmacy benefit managers. In September 2003, the PBM trade association, Pharmaceutical Care Management Association (“PCMA”), of which the Company is a member, filed an action in the U.S. District Court for the District of Maine, challenging the validity of the MUPDPA on various
68. | Medco Health Solutions, Inc.
grounds. In April 2005, the district court granted summary judg-ment in favor of the Maine Attorney General ruling, among other things, that ERISA did not pre-empt the MUPDPA, and allowing the law to take effect. PCMA appealed the ruling to the United States Court of Appeals for the First Circuit and, on November 8, 2005, the Court of Appeals affirmed the district court’s ruling. PCMA plans to petition the United States Supreme Court to review the case. If the Supreme Court declines to review the case or the judgment is upheld, it could have an adverse effect on the Company’s ability to conduct its business on commercially reasonable terms in Maine.
The Company is also involved in various claims and legal proceed-ings of a nature considered normal to the Company’s business, principally employment and commercial matters.
The various lawsuits described above arise in an environment of rising costs for prescription drugs and heightened public scrutiny of the pharmaceutical industry, including the PBM and specialty pharmacy industries and their practices. This public scrutiny is characterized by extensive press coverage, ongoing attention in various state and federal government branches, and investiga-tions and public statements by government officials. These factors contribute to the uncertainty regarding the possible course and outcome of the proceedings discussed above. An adverse outcome in any one of the lawsuits described above could result in material fines and damages; changes to the Company’s business practices; loss of (or litigation with) clients; and other penalties. Moreover, an adverse outcome in any one of these lawsuits could have a mate-rial adverse effect on the Company’s business, financial condition, liquidity and operating results. The Company is vigorously defend-ing each of the pending lawsuits described above.
Although the range of loss for many of the unresolved matters above is not subject to reasonable estimation and it is not fea-sible to predict or determine the final outcome of any of the above proceedings with certainty, the Company’s management does not believe that they will have a material adverse effect on the Company’s financial position or liquidity, either individually or in the aggregate. It is possible, however, that future results of operations for any particular quarterly or annual period could be materially adversely affected by the ultimate resolutions of one or more of these matters, or changes in the Company’s assumptions or
its strategies related to these proceedings. The Company believes that most of the claims made in these legal proceedings and gov-ernment investigations would not likely be covered by insurance.
Purchase Obligations. The Company has entered into agree-ments with certain biopharmaceutical manufacturers and a brand-name pharmaceutical manufacturer that contain mini-mum purchasing volume commitments. As of December 31, 2005, these purchase obligations amounted to $301.9 million for 2006 and $69.1 million for 2007, the majority of which is associated with Accredo’s specialty pharmacy business.
| 15. BUSINESS TRANSACTIONS WITH MERCK DURING THE MERCK OWNERSHIP PERIOD
The Company was a wholly-owned subsidiary of Merck from November 18, 1993 through August 19, 2003, the spin-off date, and during this period it entered into intercompany transactions with Merck for items such as the daily transfer of cash collections; cash borrowings to be used in operations as necessary; mail order inventory transactions; sales of PBM and other services; recording of rebates; taxes paid by Merck on behalf of the Company, and allocations of corporate charges. For the majority of the period during which the Company was owned by Merck, Merck provided the Company with various services, including finance, legal, public affairs, executive oversight, human resources, procurement and other services. The historical consolidated financial statements for 2003 and prior years include expense allocations related to these services, which diminished as the Company prepared for the spin-off. These expense allocations are reflected in selling, general and administrative expenses and amounted to $0.4 million for the year-to-date through August 19, 2003 (all of which was recorded in the first quarter of 2003). The Company considers these allocations to be reasonable reflections of the utilization of services provided. The Company assumed full responsibility for these services and the related expenses prior to the completion of the spin-off.
On August 8, 2003, the Company received $564.7 million in settle-ment of the recorded amount of the net intercompany receivable due from Merck arising from intercompany transactions from December 31, 2001, to July 31, 2003. The Company completed its spin-off from Merck on August 19, 2003. As a result, the Company
Medco Health Solutions, Inc. | 69.
no longer has intercompany transactions with Merck, and it treats its transactions for items such as mail order inventory, sales of PBM and other services, and rebates receivable as third-party transactions.
Prescription drugs purchased from Merck that are dispensed by the Company’s mail order pharmacies are included in cost of product net revenues, or in inventory if not yet dispensed. During the peri-ods prior to the spin-off, this inventory from Merck was recorded at a price that management believes approximated the price that an unrelated third party would pay. During fiscal 2003 through the spin-off date, purchases from Merck as a percentage of the Company’s total cost of revenues remained consistently in the 4% to 5% range. In addition, the Company records rebates from Merck in cost of revenues based on the volume of Merck prescription drugs dispensed through its retail pharmacy network and by its mail order pharmacies. The accounting treatment for the histori-cal transactions with Merck is consistent with how transactions with other third parties have been and continue to be treated.
The following table presents a summary of the additional trans-actions with Merck for the period presented prior to the spin-off ($ in millions):
December 27, For Fiscal Year Ended 2003*Sales to Merck for PBM and other services $ 78.0Cost of inventory purchased from Merck $ 930.4Gross rebates received from Merck $ 301.1
* Through the spin-off from Merck on August 19, 2003.
As part of the spin-off transaction in 2003, Medco incurred debt in the amount of $1,499.6 million, and used the proceeds from the debt and intercompany settlement to pay a $2.0 billion parting cash dividend to Merck. The Company began recording retained earnings subsequent to May 25, 2002, when it converted from a limited liability company to a corporation. Of the $2.0 billion parting cash dividend paid to Merck, $500.4 million, representing the accumulated retained earnings from May 25, 2002, through August 19, 2003, was charged to retained earnings and the bal-ance of $1,499.6 million was charged to additional paid-in capital.
In connection with the spin-off, the Company also entered into a tax responsibility allocation agreement with Merck. The tax respon-sibility allocation agreement includes, among other items, terms for the filing and payment of income taxes through the spin-off date. For the period up to the spin-off date, Merck incurred federal taxes on the Company’s income as part of Merck’s consolidated tax return. For state income taxes prior to the Company’s incorporation, Merck was taxed on the Company’s income. This is also the case for the post-incorporation period through the spin-off date in states where Merck filed a unitary or combined tax return. In states where Merck did not file a unitary or combined tax return, the Company is responsible since incorporation for filing and paying the associated taxes, with the estimated state tax liability reflected in accrued expenses and other current liabilities. Subsequent to the spin-off, the Company is responsible for filing its own federal and state tax returns and making the associated payments.
In addition, the Company entered into an indemnification and insurance matters agreement, as well as a master separation and distribution agreement, and other related agreements. The indem-nification and insurance matters agreement covers the Company’s indemnification of Merck for, among other matters, the outcome of certain types of litigation and claims.
In connection with the spin-off, the Company and Merck entered into a managed care agreement that was subsequently termi-nated. See Note 16, “Subsequent Event,” for more information.
| 16. SUBSEQUENT EVENT
On February 28, 2006, following arms-length negotiations, the five-year managed care agreement that the Company had entered into as of July 2002 with Merck, while it was a wholly-owned subsidiary of Merck, was terminated as of April 1, 2006. Effective April 1, 2006, the managed care agreement will be replaced with a rebate agreement that is comparable to the customary rebate agreements the Company has entered into with other major phar-maceutical manufacturers in the ordinary course of our business. The liquidated damages provisions contained in the managed care agreement, under which the Company could have been required to pay liquidated damages if the Company’s Merck-related market share declined below specified levels, will no longer apply.
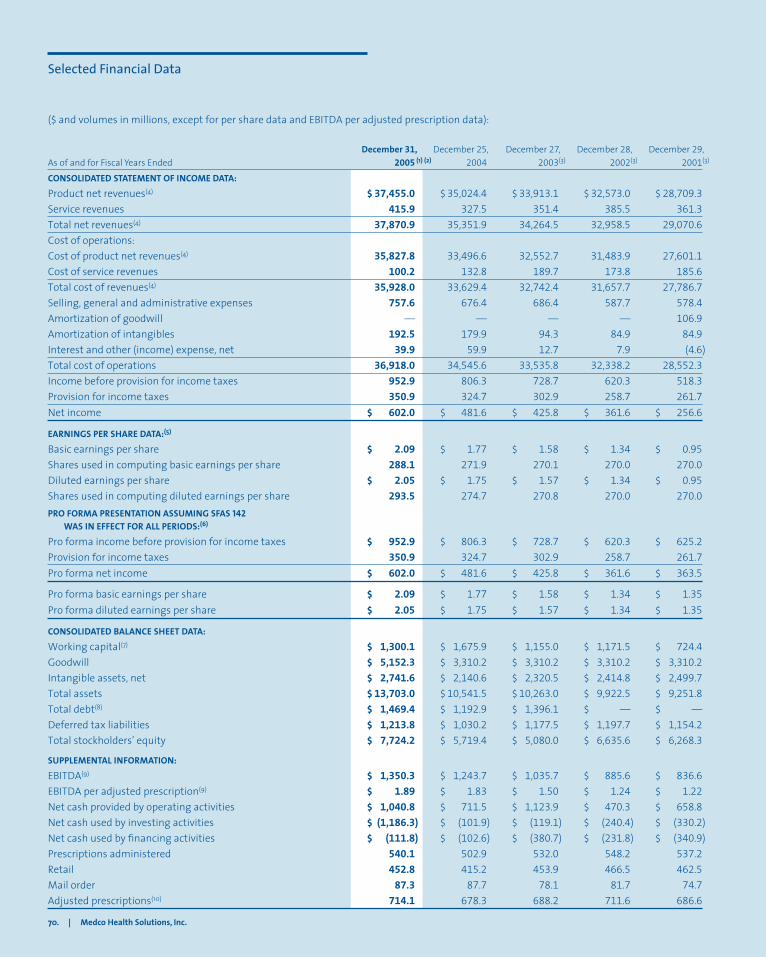
70. | Medco Health Solutions, Inc.
Selected Financial Data
($ and volumes in millions, except for per share data and EBITDA per adjusted prescription data):
December 31, December 25, December 27, December 28, December 29,As of and for Fiscal Years Ended 2005 (1) (2) 2004 2003(3) 2002(3) 2001(3)
CONSOLIDATED STATEMENT OF INCOME DATA:
Product net revenues(4) $ 37,455.0 $ 35,024.4 $ 33,913.1 $ 32,573.0 $ 28,709.3Service revenues 415.9 327.5 351.4 385.5 361.3Total net revenues(4) 37,870.9 35,351.9 34,264.5 32,958.5 29,070.6Cost of operations:Cost of product net revenues(4) 35,827.8 33,496.6 32,552.7 31,483.9 27,601.1Cost of service revenues 100.2 132.8 189.7 173.8 185.6Total cost of revenues(4) 35,928.0 33,629.4 32,742.4 31,657.7 27,786.7Selling, general and administrative expenses 757.6 676.4 686.4 587.7 578.4Amortization of goodwill — — — — 106.9Amortization of intangibles 192.5 179.9 94.3 84.9 84.9Interest and other (income) expense, net 39.9 59.9 12.7 7.9 (4.6)Total cost of operations 36,918.0 34,545.6 33,535.8 32,338.2 28,552.3Income before provision for income taxes 952.9 806.3 728.7 620.3 518.3Provision for income taxes 350.9 324.7 302.9 258.7 261.7Net income $ 602.0 $ 481.6 $ 425.8 $ 361.6 $ 256.6
EARNINGS PER SHARE DATA:(5)
Basic earnings per share $ 2.09 $ 1.77 $ 1.58 $ 1.34 $ 0.95Shares used in computing basic earnings per share 288.1 271.9 270.1 270.0 270.0Diluted earnings per share $ 2.05 $ 1.75 $ 1.57 $ 1.34 $ 0.95Shares used in computing diluted earnings per share 293.5 274.7 270.8 270.0 270.0PRO FORMA PRESENTATION ASSUMING SFAS 142 WAS IN EFFECT FOR ALL PERIODS:(6)
Pro forma income before provision for income taxes $ 952.9 $ 806.3 $ 728.7 $ 620.3 $ 625.2Provision for income taxes 350.9 324.7 302.9 258.7 261.7Pro forma net income $ 602.0 $ 481.6 $ 425.8 $ 361.6 $ 363.5
Pro forma basic earnings per share $ 2.09 $ 1.77 $ 1.58 $ 1.34 $ 1.35Pro forma diluted earnings per share $ 2.05 $ 1.75 $ 1.57 $ 1.34 $ 1.35
CONSOLIDATED BALANCE SHEET DATA:
Working capital(7) $ 1,300.1 $ 1,675.9 $ 1,155.0 $ 1,171.5 $ 724.4Goodwill $ 5,152.3 $ 3,310.2 $ 3,310.2 $ 3,310.2 $ 3,310.2Intangible assets, net $ 2,741.6 $ 2,140.6 $ 2,320.5 $ 2,414.8 $ 2,499.7Total assets $ 13,703.0 $ 10,541.5 $ 10,263.0 $ 9,922.5 $ 9,251.8Total debt(8) $ 1,469.4 $ 1,192.9 $ 1,396.1 $ — $ — Deferred tax liabilities $ 1,213.8 $ 1,030.2 $ 1,177.5 $ 1,197.7 $ 1,154.2Total stockholders’ equity $ 7,724.2 $ 5,719.4 $ 5,080.0 $ 6,635.6 $ 6,268.3
SUPPLEMENTAL INFORMATION:
EBITDA(9) $ 1,350.3 $ 1,243.7 $ 1,035.7 $ 885.6 $ 836.6EBITDA per adjusted prescription(9) $ 1.89 $ 1.83 $ 1.50 $ 1.24 $ 1.22Net cash provided by operating activities $ 1,040.8 $ 711.5 $ 1,123.9 $ 470.3 $ 658.8Net cash used by investing activities $ (1,186.3) $ (101.9) $ (119.1) $ (240.4) $ (330.2)Net cash used by financing activities $ (111.8) $ (102.6) $ (380.7) $ (231.8) $ (340.9)Prescriptions administered 540.1 502.9 532.0 548.2 537.2Retail 452.8 415.2 453.9 466.5 462.5Mail order 87.3 87.7 78.1 81.7 74.7Adjusted prescriptions(10) 714.1 678.3 688.2 711.6 686.6
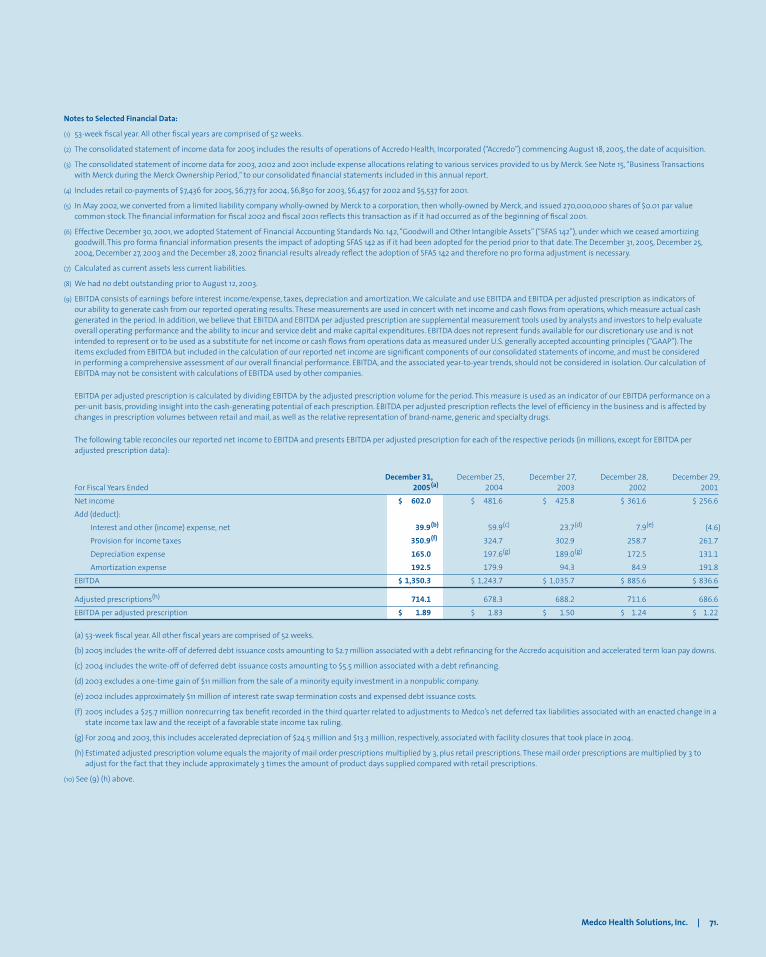
Medco Health Solutions, Inc. | 71.
Notes to Selected Financial Data:
(1) 53-week fiscal year. All other fiscal years are comprised of 52 weeks.
(2) The consolidated statement of income data for 2005 includes the results of operations of Accredo Health, Incorporated (“Accredo”) commencing August 18, 2005, the date of acquisition.
(3) The consolidated statement of income data for 2003, 2002 and 2001 include expense allocations relating to various services provided to us by Merck. See Note 15, “Business Transactions with Merck during the Merck Ownership Period,” to our consolidated financial statements included in this annual report.
(4) Includes retail co-payments of $7,436 for 2005, $6,773 for 2004, $6,850 for 2003, $6,457 for 2002 and $5,537 for 2001.
(5) In May 2002, we converted from a limited liability company wholly-owned by Merck to a corporation, then wholly-owned by Merck, and issued 270,000,000 shares of $0.01 par value common stock. The financial information for fiscal 2002 and fiscal 2001 reflects this transaction as if it had occurred as of the beginning of fiscal 2001.
(6) Effective December 30, 2001, we adopted Statement of Financial Accounting Standards No. 142, “Goodwill and Other Intangible Assets” (“SFAS 142”), under which we ceased amortizing goodwill. This pro forma financial information presents the impact of adopting SFAS 142 as if it had been adopted for the period prior to that date. The December 31, 2005, December 25, 2004, December 27, 2003 and the December 28, 2002 financial results already reflect the adoption of SFAS 142 and therefore no pro forma adjustment is necessary.
(7) Calculated as current assets less current liabilities.
(8) We had no debt outstanding prior to August 12, 2003.
(9) EBITDA consists of earnings before interest income/expense, taxes, depreciation and amortization. We calculate and use EBITDA and EBITDA per adjusted prescription as indicators of our ability to generate cash from our reported operating results. These measurements are used in concert with net income and cash flows from operations, which measure actual cash generated in the period. In addition, we believe that EBITDA and EBITDA per adjusted prescription are supplemental measurement tools used by analysts and investors to help evaluate overall operating performance and the ability to incur and service debt and make capital expenditures. EBITDA does not represent funds available for our discretionary use and is not intended to represent or to be used as a substitute for net income or cash flows from operations data as measured under U.S. generally accepted accounting principles (“GAAP”). The items excluded from EBITDA but included in the calculation of our reported net income are significant components of our consolidated statements of income, and must be considered in performing a comprehensive assessment of our overall financial performance. EBITDA, and the associated year-to-year trends, should not be considered in isolation. Our calculation of EBITDA may not be consistent with calculations of EBITDA used by other companies.
EBITDA per adjusted prescription is calculated by dividing EBITDA by the adjusted prescription volume for the period. This measure is used as an indicator of our EBITDA performance on a per-unit basis, providing insight into the cash-generating potential of each prescription. EBITDA per adjusted prescription reflects the level of efficiency in the business and is affected by changes in prescription volumes between retail and mail, as well as the relative representation of brand-name, generic and specialty drugs.
The following table reconciles our reported net income to EBITDA and presents EBITDA per adjusted prescription for each of the respective periods (in millions, except for EBITDA per adjusted prescription data):
December 31, December 25, December 27, December 28, December 29,For Fiscal Years Ended 2005(a) 2004 2003 2002 2001
Net income $ 602.0 $ 481.6 $ 425.8 $ 361.6 $ 256.6
Add (deduct):
Interest and other (income) expense, net 39.9(b) 59.9(c) 23.7(d) 7.9(e) (4.6)
Provision for income taxes 350.9(f) 324.7 302.9 258.7 261.7
Depreciation expense 165.0 197.6(g) 189.0(g) 172.5 131.1
Amortization expense 192.5 179.9 94.3 84.9 191.8
EBITDA $ 1,350.3 $ 1,243.7 $ 1,035.7 $ 885.6 $ 836.6
Adjusted prescriptions(h) 714.1 678.3 688.2 711.6 686.6
EBITDA per adjusted prescription $ 1.89 $ 1.83 $ 1.50 $ 1.24 $ 1.22
(a) 53-week fiscal year. All other fiscal years are comprised of 52 weeks.
(b) 2005 includes the write-off of deferred debt issuance costs amounting to $2.7 million associated with a debt refinancing for the Accredo acquisition and accelerated term loan pay downs.
(c) 2004 includes the write-off of deferred debt issuance costs amounting to $5.5 million associated with a debt refinancing.
(d) 2003 excludes a one-time gain of $11 million from the sale of a minority equity investment in a nonpublic company.
(e) 2002 includes approximately $11 million of interest rate swap termination costs and expensed debt issuance costs.
(f) 2005 includes a $25.7 million nonrecurring tax benefit recorded in the third quarter related to adjustments to Medco’s net deferred tax liabilities associated with an enacted change in a state income tax law and the receipt of a favorable state income tax ruling.
(g) For 2004 and 2003, this includes accelerated depreciation of $24.5 million and $13.3 million, respectively, associated with facility closures that took place in 2004.
(h) Estimated adjusted prescription volume equals the majority of mail order prescriptions multiplied by 3, plus retail prescriptions. These mail order prescriptions are multiplied by 3 to adjust for the fact that they include approximately 3 times the amount of product days supplied compared with retail prescriptions.
(10) See (9) (h) above.
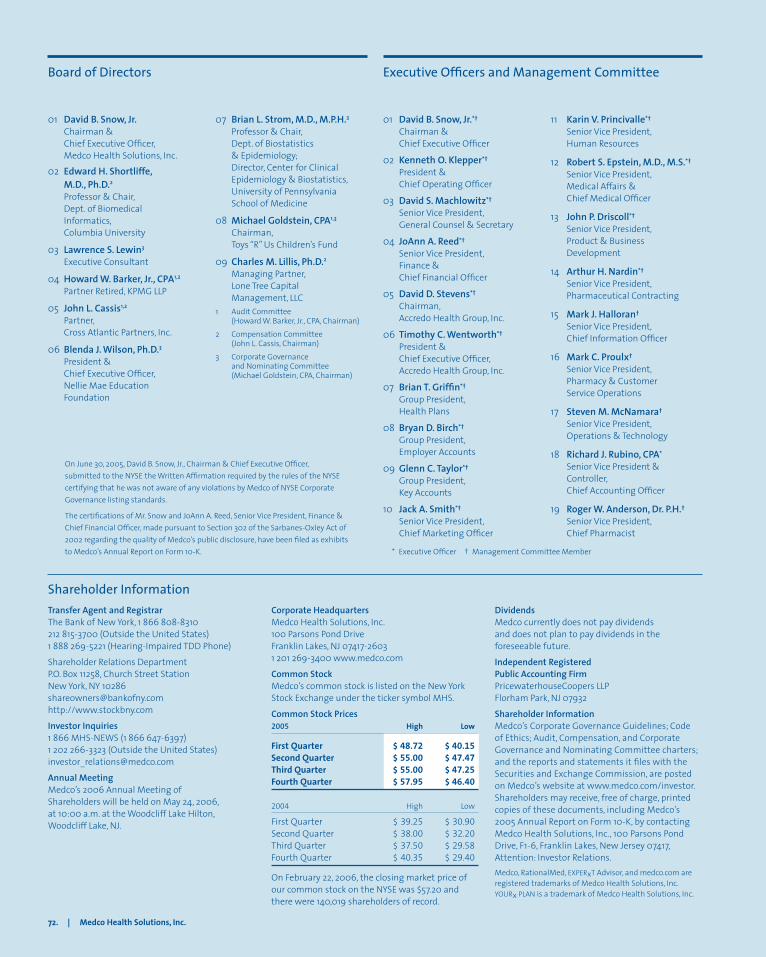
72. | Medco Health Solutions, Inc.
01 David B. Snow, Jr.*† Chairman & Chief Executive Officer
02 Kenneth O. Klepper*† President & Chief Operating Officer
03 David S. Machlowitz*† Senior Vice President, General Counsel & Secretary
04 JoAnn A. Reed*† Senior Vice President, Finance & Chief Financial Officer
05 David D. Stevens*† Chairman, Accredo Health Group, Inc.
06 Timothy C. Wentworth*† President & Chief Executive Officer, Accredo Health Group, Inc.
07 Brian T. Griffin*† Group President, Health Plans
08 Bryan D. Birch*† Group President, Employer Accounts
09 Glenn C. Taylor*† Group President, Key Accounts
10 Jack A. Smith*† Senior Vice President, Chief Marketing Officer
11 Karin V. Princivalle*† Senior Vice President, Human Resources
12 Robert S. Epstein, M.D., M.S.*† Senior Vice President, Medical Affairs & Chief Medical Officer
13 John P. Driscoll*† Senior Vice President, Product & Business Development
14 Arthur H. Nardin*† Senior Vice President, Pharmaceutical Contracting
15 Mark J. Halloran† Senior Vice President, Chief Information Officer
16 Mark C. Proulx† Senior Vice President, Pharmacy & Customer Service Operations
17 Steven M. McNamara† Senior Vice President, Operations & Technology
18 Richard J. Rubino, CPA* Senior Vice President & Controller, Chief Accounting Officer
19 Roger W. Anderson, Dr. P.H.† Senior Vice President, Chief Pharmacist
01 David B. Snow, Jr. Chairman & Chief Executive Officer, Medco Health Solutions, Inc.
02 Edward H. Shortliffe, M.D., Ph.D.2 Professor & Chair, Dept. of Biomedical Informatics, Columbia University
03 Lawrence S. Lewin3 Executive Consultant
04 Howard W. Barker, Jr., CPA1,2 Partner Retired, KPMG LLP
05 John L. Cassis1,2 Partner, Cross Atlantic Partners, Inc.
06 Blenda J. Wilson, Ph.D.3 President & Chief Executive Officer, Nellie Mae Education Foundation
07 Brian L. Strom, M.D., M.P.H.3 Professor & Chair, Dept. of Biostatistics & Epidemiology; Director, Center for Clinical Epidemiology & Biostatistics, University of Pennsylvania School of Medicine
08 Michael Goldstein, CPA1,3 Chairman, Toys “R” Us Children’s Fund
09 Charles M. Lillis, Ph.D.2 Managing Partner, Lone Tree Capital Management, LLC
1 Audit Committee (Howard W. Barker, Jr., CPA, Chairman)
2 Compensation Committee (John L. Cassis, Chairman)
3 Corporate Governance and Nominating Committee (Michael Goldstein, CPA, Chairman)
Transfer Agent and RegistrarThe Bank of New York, 1 866 808-8310 212 815-3700 (Outside the United States) 1 888 269-5221 (Hearing-Impaired TDD Phone)
Shareholder Relations Department P.O. Box 11258, Church Street Station New York, NY 10286 [email protected] http://www.stockbny.com
Investor Inquiries1 866 MHS-NEWS (1 866 647-6397) 1 202 266-3323 (Outside the United States) [email protected]
Annual MeetingMedco’s 2006 Annual Meeting of Shareholders will be held on May 24, 2006, at 10:00 a.m. at the Woodcliff Lake Hilton, Woodcliff Lake, NJ.
DividendsMedco currently does not pay dividends and does not plan to pay dividends in the foreseeable future.
Independent Registered Public Accounting FirmPricewaterhouseCoopers LLP Florham Park, NJ 07932
Shareholder InformationMedco’s Corporate Governance Guidelines; Code of Ethics; Audit, Compensation, and Corporate Governance and Nominating Committee charters; and the reports and statements it files with the Securities and Exchange Commission, are posted on Medco’s website at www.medco.com/investor. Shareholders may receive, free of charge, printed copies of these documents, including Medco’s 2005 Annual Report on Form 10-K, by contacting Medco Health Solutions, Inc., 100 Parsons Pond Drive, F1-6, Franklin Lakes, New Jersey 07417, Attention: Investor Relations.Medco, RationalMed, EXPERxT Advisor, and medco.com are registered trademarks of Medco Health Solutions, Inc. YOURx PLAN is a trademark of Medco Health Solutions, Inc.
Executive Officers and Management Committee
Shareholder Information
Board of Directors
On June 30, 2005, David B. Snow, Jr., Chairman & Chief Executive Officer, submitted to the NYSE the Written Affirmation required by the rules of the NYSE certifying that he was not aware of any violations by Medco of NYSE Corporate Governance listing standards.
The certifications of Mr. Snow and JoAnn A. Reed, Senior Vice President, Finance & Chief Financial Officer, made pursuant to Section 302 of the Sarbanes-Oxley Act of 2002 regarding the quality of Medco’s public disclosure, have been filed as exhibits to Medco’s Annual Report on Form 10-K. * Executive Officer † Management Committee Member
Corporate HeadquartersMedco Health Solutions, Inc. 100 Parsons Pond Drive Franklin Lakes, NJ 07417-2603 1 201 269-3400 www.medco.com
Common StockMedco’s common stock is listed on the New York Stock Exchange under the ticker symbol MHS.
Common Stock Prices2005 High Low
First Quarter $ 48.72 $ 40.15 Second Quarter $ 55.00 $ 47.47 Third Quarter $ 55.00 $ 47.25 Fourth Quarter $ 57.95 $ 46.40
2004 High Low
First Quarter $ 39.25 $ 30.90 Second Quarter $ 38.00 $ 32.20 Third Quarter $ 37.50 $ 29.58 Fourth Quarter $ 40.35 $ 29.40
On February 22, 2006, the closing market price of our common stock on the NYSE was $57.20 and there were 140,019 shareholders of record.

1510
11
12
13
14
18
17
1916
06
01
02
03
04
0507
09
08
IBC
01 02 03 04 05
06 07 08 09
Board of Directors
Executive Offi cers and Management Committee
Des
ign:
Seq
uel S
tudi
o, N
ew Y
ork
Prin
cipa
l pho
togr
aphy
: Ash
ton
Wor
thin
gton
; exe
cutiv
e ph
otog
raph
y: T
ed K
awal
ersk
i

Back Cover Front Cover
2005 Annual Report
More than pillsMore than prescriptionsMore than a pharmacy
More than you think ...Medco Health Solutions, Inc.
AR 05
2005 AN
NU
AL REPO
RT MED
CO H
EALTH
SOLU
TION
S, INC.
© 2006 Medco Health Solutions, Inc. All rights reserved.®