medco is a registered trademark of medco health solutions, inc. © 2006 medco health solutions, inc....
TRANSCRIPT
Medco is a registered trademark of Medco Health Solutions, Inc.© 2006 Medco Health Solutions, Inc. All rights reserved.
Goldman Sachs Twenty -Seventh Annual Global Healthcare Conference
Medco Health Solutions, Inc.
David B. Snow, Jr.Chairman & Chief Executive Officer
June 14, 2006
2
© 2006 Medco Health Solutions, Inc. All rights reserved.
Forward-looking statements
This presentation contains “forward-looking statements” as that term is defined in the Private Securities Litigation Reform Act of 1995. These statements involve risks and uncertainties that may cause results to differ materially from those set forth in the statements. No forward-looking statement can be guaranteed, and actual results may differ materially from those projected. We undertake no obligation to publicly update any forward-looking statement, whether as a result of new information, future events, or otherwise. Forward-looking statements in this presentation should be evaluated together with the many uncertainties that affect our business, particularly those described in the risk factors section of the Company’s Annual Report on Form 10-K filed with the Securities and Exchange Commission.
3
© 2006 Medco Health Solutions, Inc. All rights reserved.
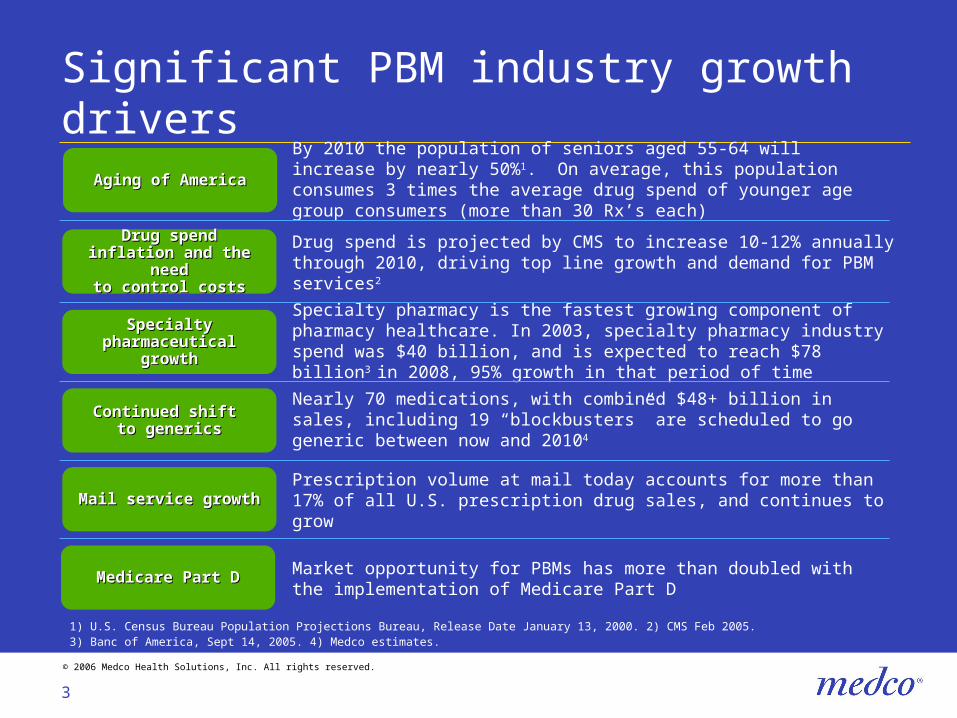
Significant PBM industry growth drivers
Aging of AmericaAging of AmericaBy 2010 the population of seniors aged 55-64 will increase by nearly 50%1. On average, this population consumes 3 times the average drug spend of younger age group consumers (more than 30 Rx’s each)
Specialty Specialty pharmaceutical pharmaceutical
growthgrowth
Specialty pharmacy is the fastest growing component of pharmacy healthcare. In 2003, specialty pharmacy industry spend was $40 billion, and is expected to reach $78 billion3 in 2008, 95% growth in that period of time
Mail service growthMail service growth Prescription volume at mail today accounts for more than 17% of all U.S. prescription drug sales, and continues to grow
Medicare Part DMedicare Part D Market opportunity for PBMs has more than doubled with the implementation of Medicare Part D
Continued shift Continued shift to genericsto generics
Nearly 70 medications, with combined $48+ billion in sales, including 19 “blockbusters” are scheduled to go generic between now and 20104
Drug spend inflation Drug spend inflation and the needand the need
to control coststo control costs
Drug spend is projected by CMS to increase 10-12% annually through 2010, driving top line growth and demand for PBM services2
1) U.S. Census Bureau Population Projections Bureau, Release Date January 13, 2000. 2) CMS Feb 2005. 3) Banc of America, Sept 14, 2005. 4) Medco estimates.
4
© 2006 Medco Health Solutions, Inc. All rights reserved.
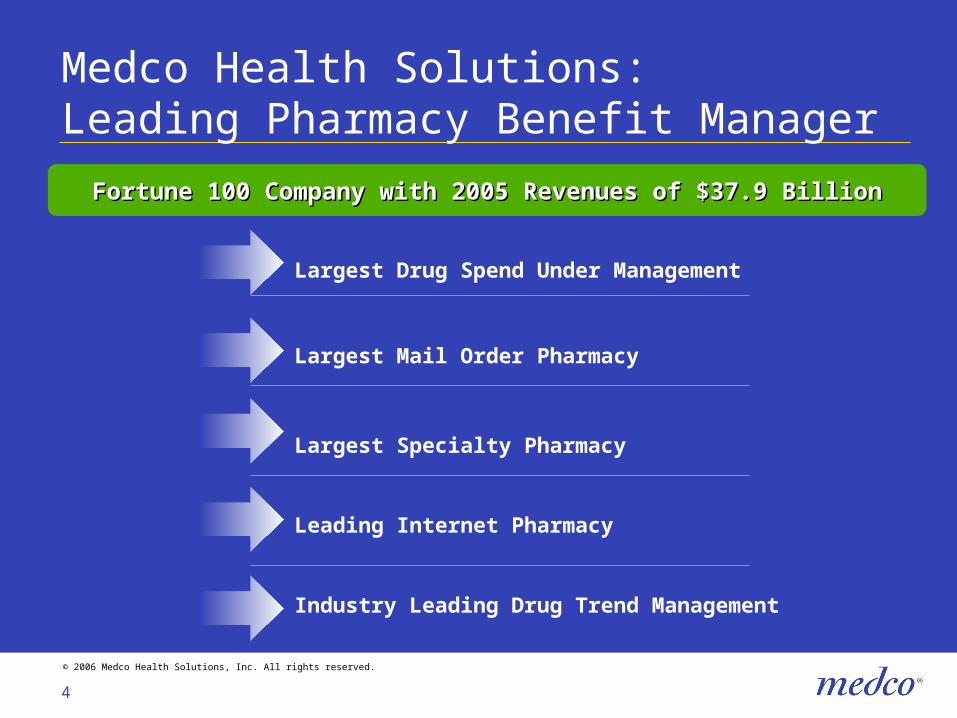
Medco Health Solutions: Leading Pharmacy Benefit Manager
Largest Drug Spend Under Management
Largest Mail Order Pharmacy
Largest Specialty Pharmacy
Leading Internet Pharmacy
Industry Leading Drug Trend Management
Fortune 100 Company with 2005 Revenues of $37.9 BillionFortune 100 Company with 2005 Revenues of $37.9 Billion
5
© 2006 Medco Health Solutions, Inc. All rights reserved.
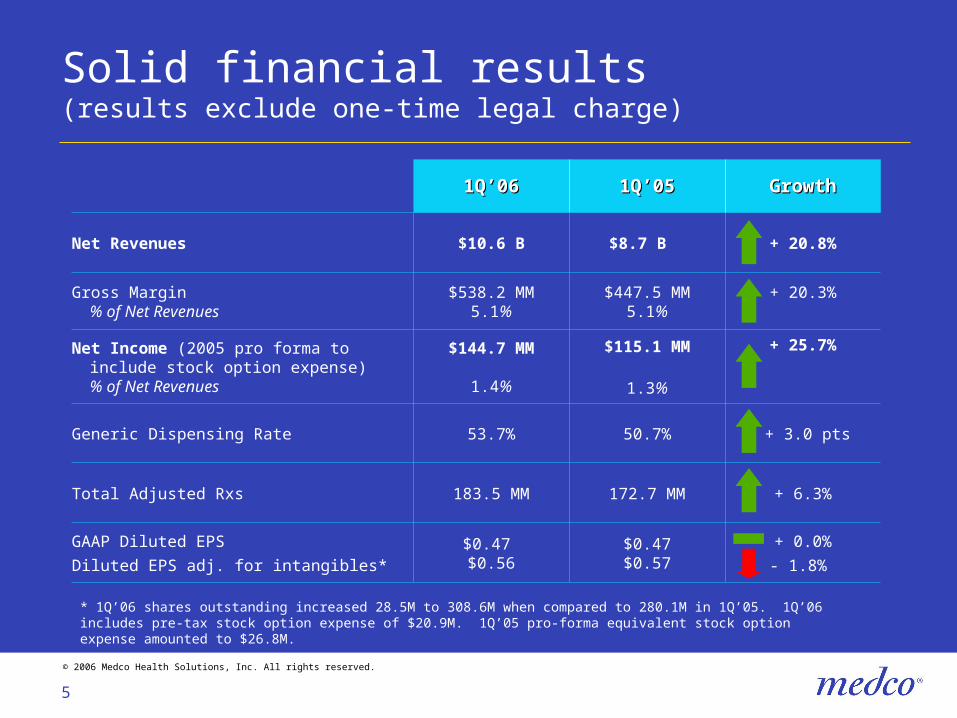
Solid financial results(results exclude one-time legal charge)
1Q’061Q’06 1Q’051Q’05 GrowthGrowth
Net Revenues $10.6 B $8.7 B + 20.8%
Gross Margin% of Net Revenues
$538.2 MM5.1%
$447.5 MM5.1%
+ 20.3%
Net Income (2005 pro forma to include stock option expense)% of Net Revenues
$144.7 MM
1.4%
$115.1 MM
1.3%
+ 25.7%
Generic Dispensing Rate 53.7% 50.7% + 3.0 pts
Total Adjusted Rxs 183.5 MM 172.7 MM + 6.3%
GAAP Diluted EPS
Diluted EPS adj. for intangibles*$0.47 $0.56
$0.47$0.57
+ 0.0%
- 1.8%
* 1Q’06 shares outstanding increased 28.5M to 308.6M when compared to 280.1M in 1Q’05. 1Q’06 includes pre-tax stock option expense of $20.9M. 1Q’05 pro-forma equivalent stock option expense amounted to $26.8M.
6
© 2006 Medco Health Solutions, Inc. All rights reserved.
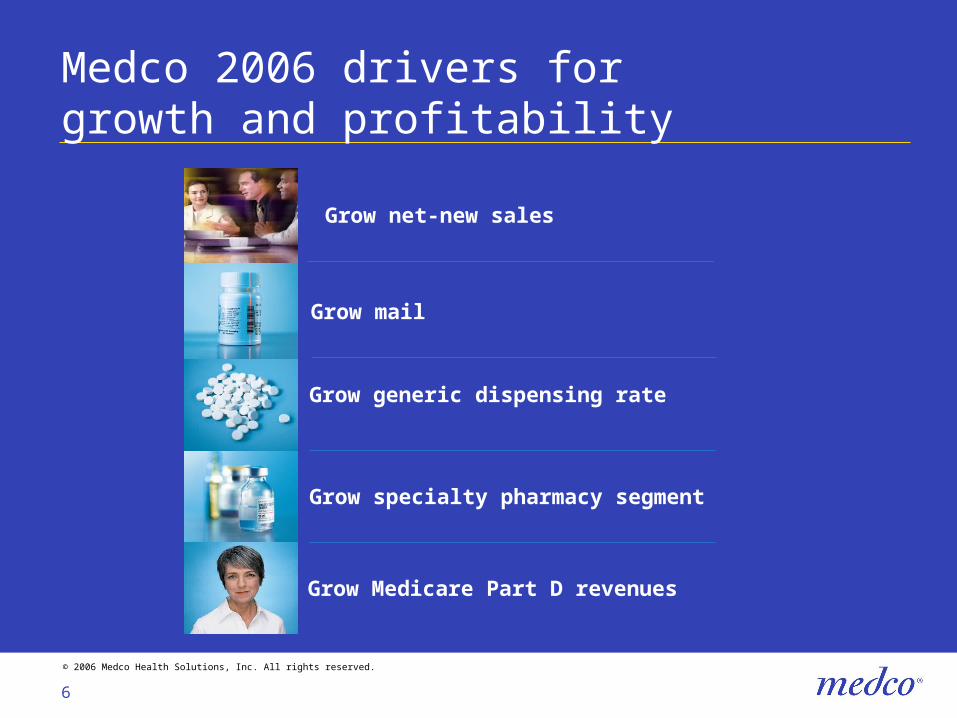
Grow Medicare Part D revenues
Medco 2006 drivers for growth and profitability
Grow specialty pharmacy segment
Grow mail
Grow generic dispensing rate
Grow net-new sales
7
© 2006 Medco Health Solutions, Inc. All rights reserved.
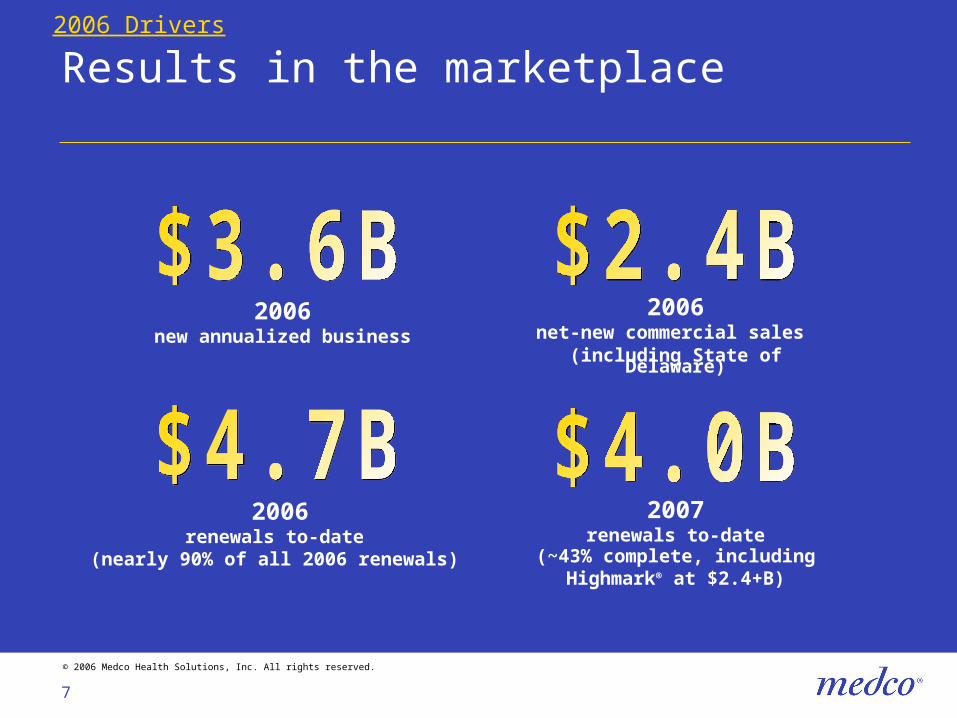
Results in the marketplace
2006renewals to-date
(nearly 90% of all 2006 renewals)
2006new annualized business
2006net-new commercial sales
(including State of Delaware)
2007renewals to-date
(~43% complete, including Highmark® at $2.4+B)
2006 Drivers
8
© 2006 Medco Health Solutions, Inc. All rights reserved.
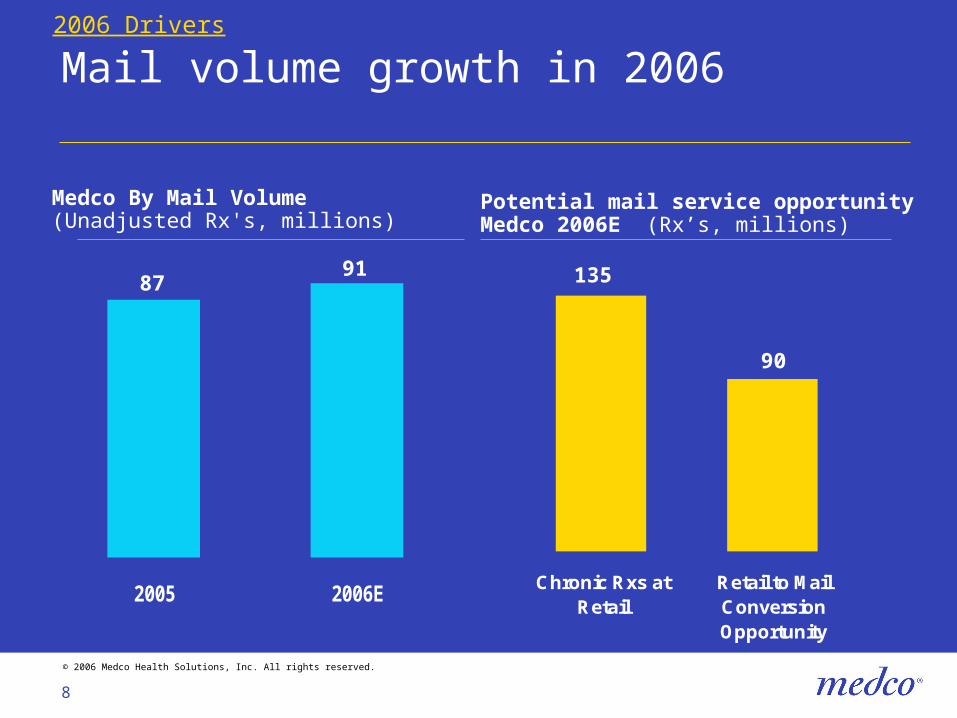
Chronic Rxs atRetail
Retail to MailConversionOpportunity
Mail volume growth in 2006
135
90
Potential mail service opportunity Medco 2006E (Rx’s, millions)
2005 2006E
8791
Medco By Mail Volume(Unadjusted Rx's, millions)
2006 Drivers
9
© 2006 Medco Health Solutions, Inc. All rights reserved.
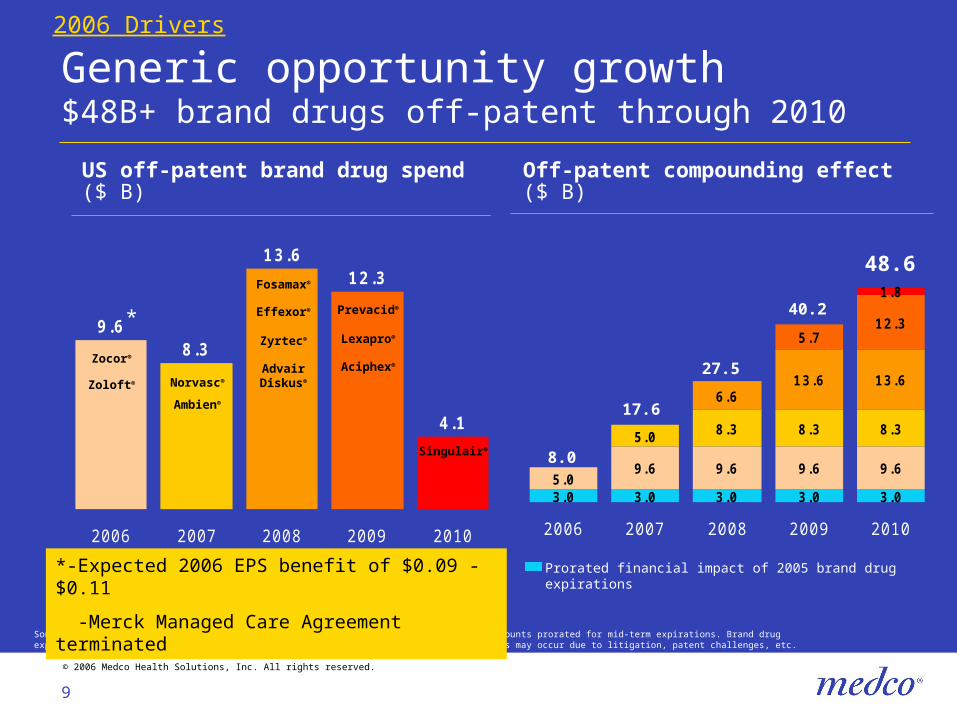
Generic opportunity growth $48B+ brand drugs off-patent through 2010
Off-patent compounding effect ($ B)
Source: U.S. Drug spend estimates are based on IMS Health data for 2004, compounded amounts prorated for mid-term expirations. Brand drug expirations based on expected patent expiration dates current as of March 2006. Changes may occur due to litigation, patent challenges, etc.
9.68.3
13.612.3
4.1
2006 2007 2008 2009 2010
US off-patent brand drug spend ($ B)
Zocor®
Zoloft® Norvasc®
Ambien®
Fosamax®
Effexor®
Zyrtec®
AdvairDiskus®
Prevacid®
Lexapro®
Aciphex®
Singulair®
Prorated financial impact of 2005 brand drug expirations
48.6
3.05.0
5.0 8.3
6.613.6
1.8
3.03.03.0 3.0
9.6 9.69.69.6
8.38.3
13.6
5.712.3
2006 2007 2008 2009 2010
17.6
27.5
40.2
8.0
*-Expected 2006 EPS benefit of $0.09 - $0.11
-Merck Managed Care Agreement terminated
*
2006 Drivers
10
© 2006 Medco Health Solutions, Inc. All rights reserved.
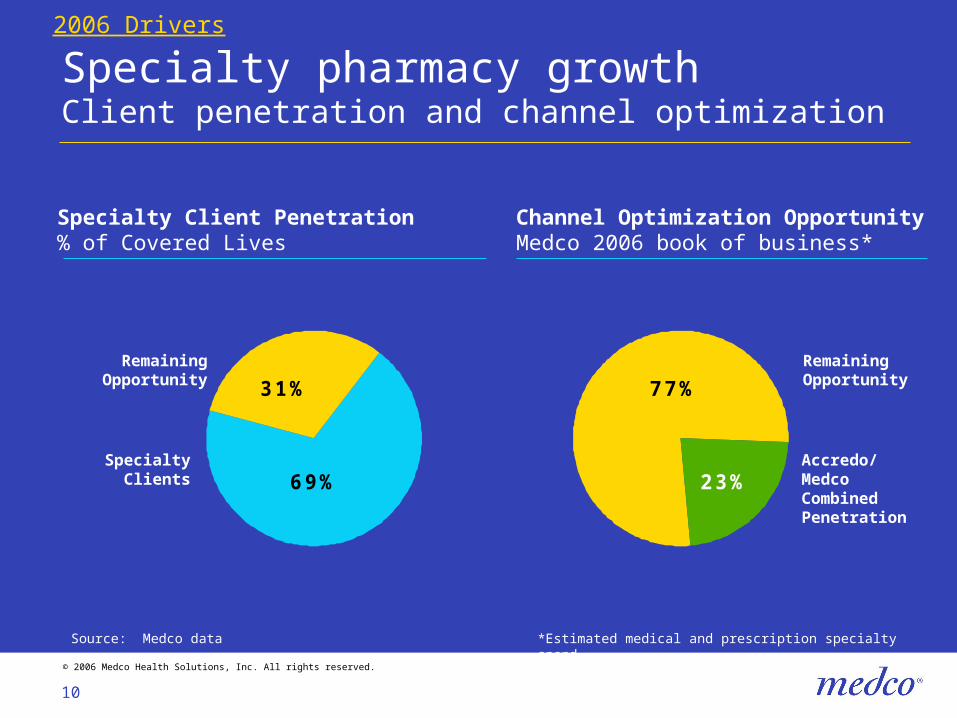
77%
23%
Specialty pharmacy growth Client penetration and channel optimization
69%
31%
Channel Optimization OpportunityMedco 2006 book of business*
Source: Medco data
Specialty Client Penetration% of Covered Lives
*Estimated medical and prescription specialty spend
SpecialtyClients
Accredo/Medco Combined Penetration
RemainingOpportunity
RemainingOpportunity
2006 Drivers
11
© 2006 Medco Health Solutions, Inc. All rights reserved.
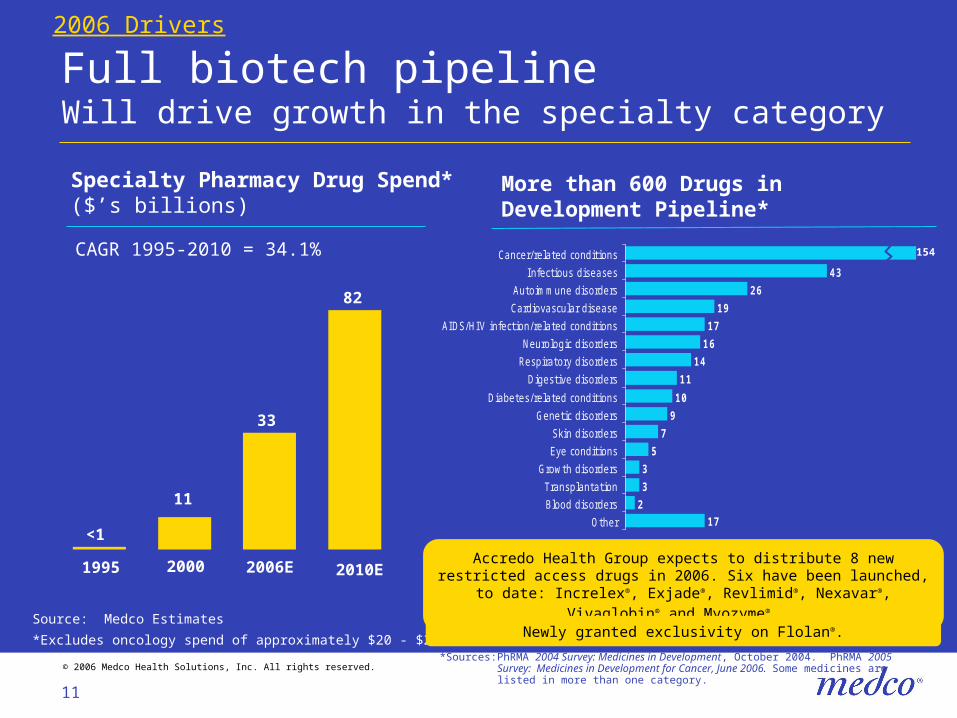
26
19
17
14
11
10
9
7
5
3
3
217
16
43
Cancer/related conditions
I nfectious diseases
Autoimmune disorders
Cardiovascular disease
AIDS/HIV infection/related conditions
Neurologic disorders
Respiratory disorders
Digestive disorders
Diabetes/related conditions
Genetic disorders
Skin disorders
Eye conditions
Growth disorders
Transplantation
Blood disorders
Other
Full biotech pipeline Will drive growth in the specialty category
<1
11
33
82
Source: Medco Estimates
*Excludes oncology spend of approximately $20 - $25B
1995 2000 2006E 2010E
Specialty Pharmacy Drug Spend*($’s billions)
CAGR 1995-2010 = 34.1%
More than 600 Drugs inDevelopment Pipeline*
*Sources:PhRMA 2004 Survey: Medicines in Development, October 2004. PhRMA 2005 Survey: Medicines in Development for Cancer, June 2006. Some medicines are listed in more than one category.
Accredo Health Group expects to distribute 8 new restricted access drugs in 2006. Six have been launched, to date: Increlex®,
Exjade®, Revlimid®, Nexavar®, Vivaglobin® and Myozyme®.
Newly granted exclusivity on Flolan®.
2006 Drivers
154
12
© 2006 Medco Health Solutions, Inc. All rights reserved.
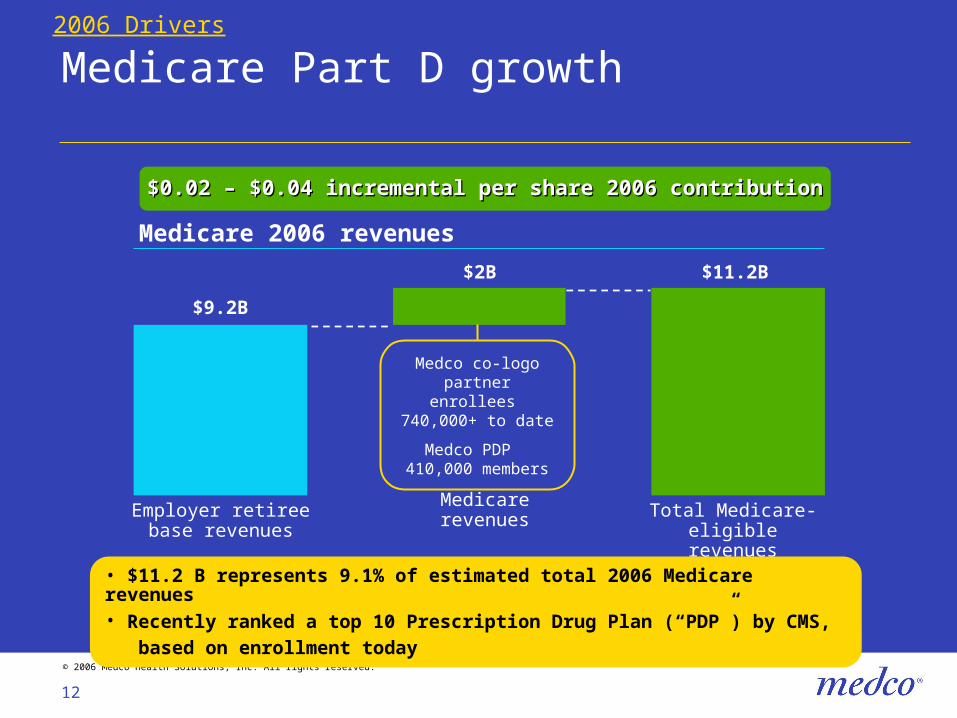
Medicare Part D growth
Employer retiree base revenues
Medicarerevenues Total Medicare-
eligible revenues
$2B
$9.2B
$11.2B
Medicare 2006 revenues
$0.02 – $0.04 incremental per share 2006 contribution$0.02 – $0.04 incremental per share 2006 contribution
Medco co-logo partner enrollees 740,000+ to date
Medco PDP 410,000 members
• $11.2 B represents 9.1% of estimated total 2006 Medicare revenues• Recently ranked a top 10 Prescription Drug Plan (“PDP”) by CMS, based on enrollment today
2006 Drivers
13
© 2006 Medco Health Solutions, Inc. All rights reserved.
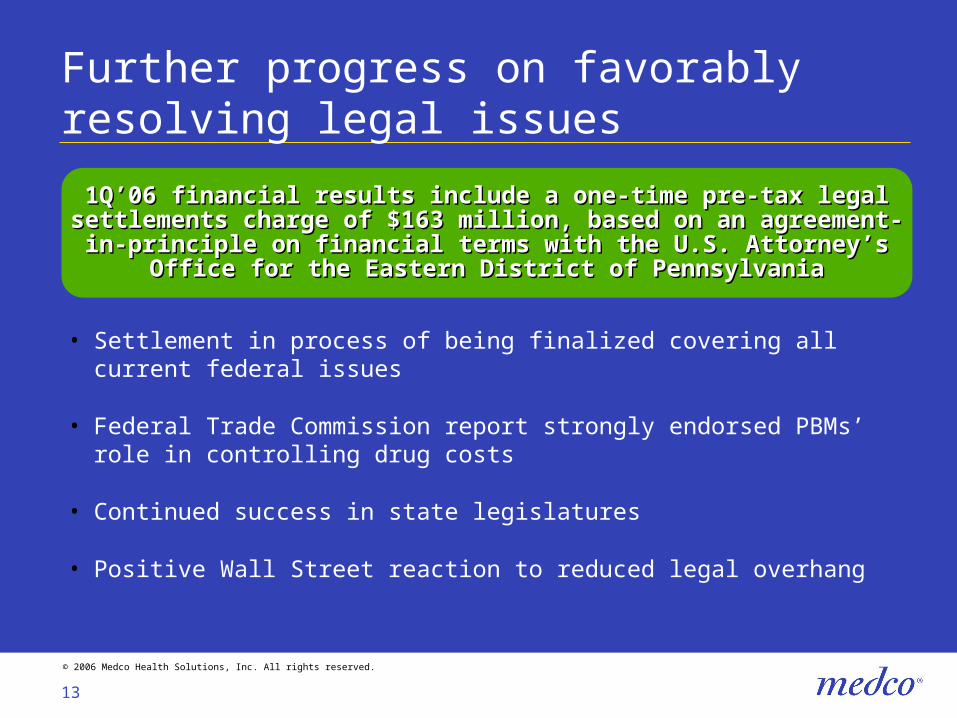
Further progress on favorably resolving legal issues
1Q’06 financial results include a one-time pre-tax legal 1Q’06 financial results include a one-time pre-tax legal settlements charge of $163 million, based on an agreement-settlements charge of $163 million, based on an agreement-in-principle on financial terms with the U.S. Attorney’s Office in-principle on financial terms with the U.S. Attorney’s Office
for the Eastern District of Pennsylvaniafor the Eastern District of Pennsylvania
• Settlement in process of being finalized covering all current federal issues
• Federal Trade Commission report strongly endorsed PBMs’ role in controlling drug costs
• Continued success in state legislatures
• Positive Wall Street reaction to reduced legal overhang
14
© 2006 Medco Health Solutions, Inc. All rights reserved.
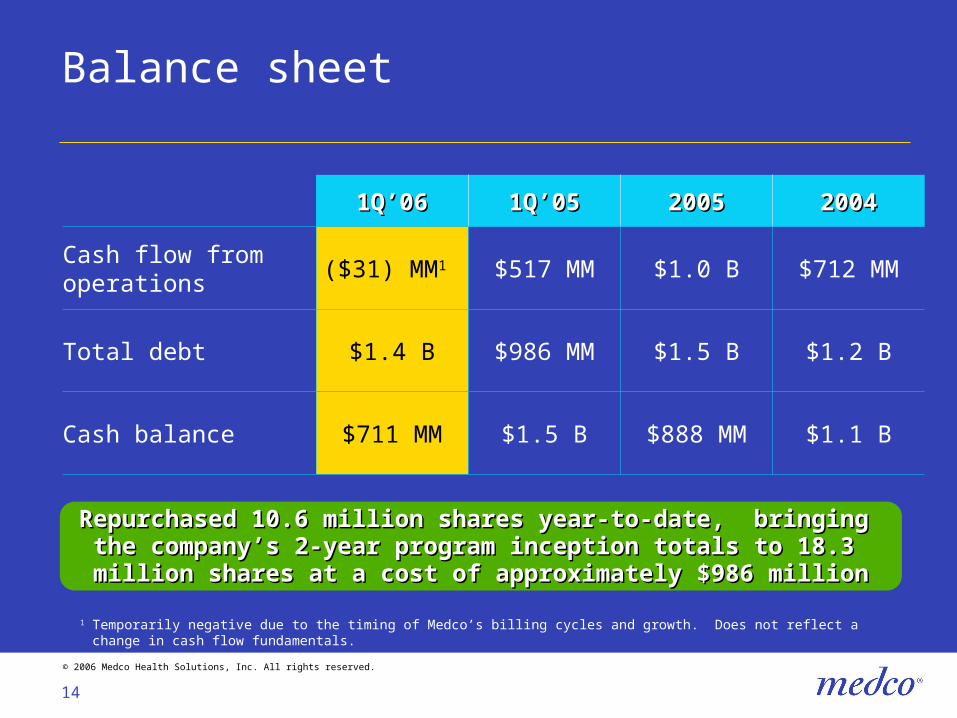
Balance sheet
1Q’061Q’06 1Q’051Q’05 20052005 20042004
Cash flow from operations
($31) MM1 $517 MM $1.0 B $712 MM
Total debt $1.4 B $986 MM $1.5 B $1.2 B
Cash balance $711 MM $1.5 B $888 MM $1.1 B
1 Temporarily negative due to the timing of Medco’s billing cycles and growth. Does not reflect a change in cash flow fundamentals.
Repurchased 10.6 million shares year-to-date, bringing Repurchased 10.6 million shares year-to-date, bringing the company’s 2-year program inception totals to 18.3 the company’s 2-year program inception totals to 18.3 million shares at a cost of approximately $986 millionmillion shares at a cost of approximately $986 million
15
© 2006 Medco Health Solutions, Inc. All rights reserved.
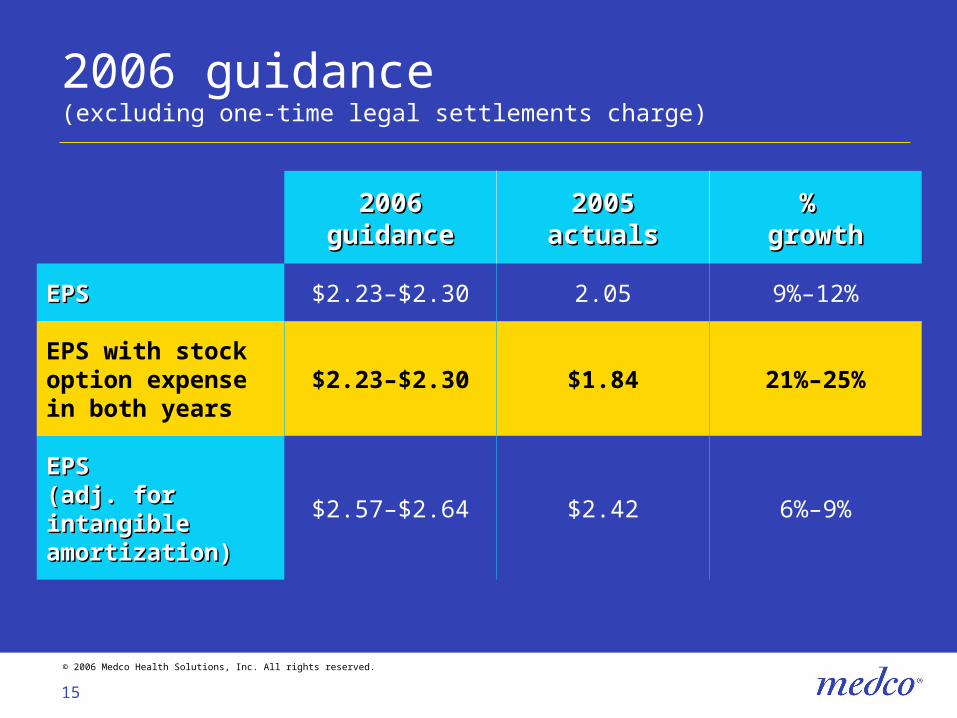
2006 guidance(excluding one-time legal settlements charge)
20062006guidanceguidance
20052005actualsactuals
% % growthgrowth
EPSEPS $2.23–$2.30 2.05 9%–12%
EPS with stock option expense in both years
$2.23–$2.30 $1.84 21%–25%
EPS EPS (adj. for (adj. for intangible intangible amortization)amortization)
$2.57–$2.64 $2.42 6%–9%

16
© 2006 Medco Health Solutions, Inc. All rights reserved.
®
17
© 2006 Medco Health Solutions, Inc. All rights reserved.
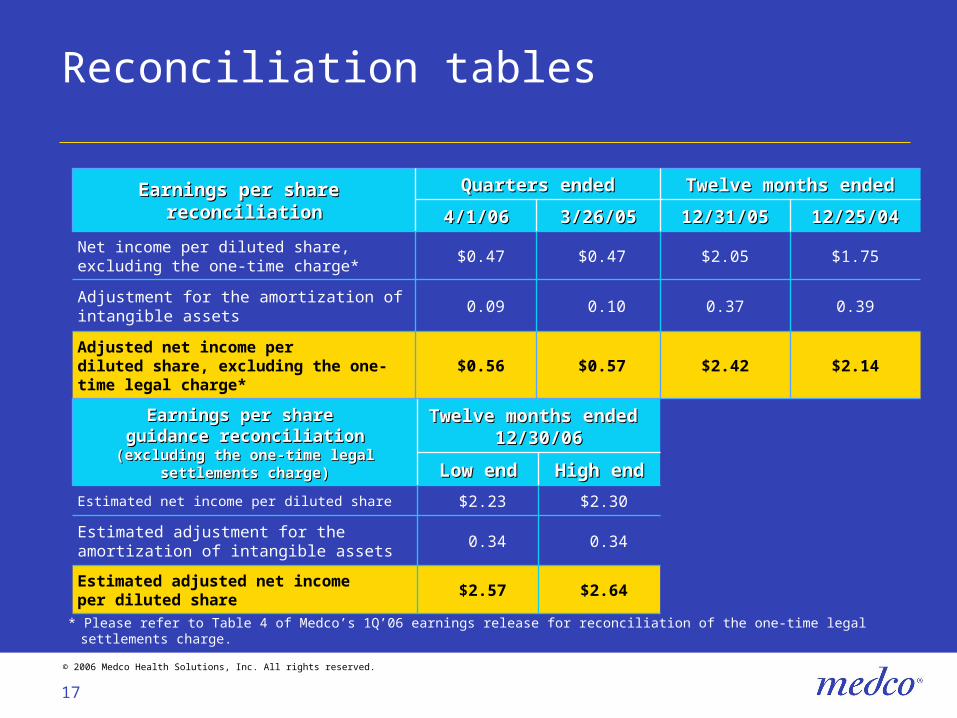
Reconciliation tables
$2.64
0.34
$2.30
High endHigh end
$2.57
0.34
$2.23
Low endLow end
Twelve months ended Twelve months ended 12/30/0612/30/06
Estimated net income per diluted share
Estimated adjusted net income per diluted share
Estimated adjustment for the amortization of intangible assets
Earnings per share Earnings per share guidance reconciliationguidance reconciliation
(excluding the one-time legal (excluding the one-time legal settlements charge)settlements charge)
$0.57
0.10
$0.47
3/26/053/26/05
$0.56
0.09
$0.47
4/1/064/1/06
Quarters endedQuarters ended
$1.75$2.05Net income per diluted share, excluding the one-time charge*
Twelve months endedTwelve months ended
$2.14
0.39
12/25/0412/25/04
$2.42Adjusted net income per diluted share, excluding the one-time legal charge*
0.37Adjustment for the amortization of intangible assets
12/31/0512/31/05Earnings per share Earnings per share
reconciliationreconciliation
* Please refer to Table 4 of Medco’s 1Q’06 earnings release for reconciliation of the one-time legal settlements charge.
18
© 2006 Medco Health Solutions, Inc. All rights reserved.
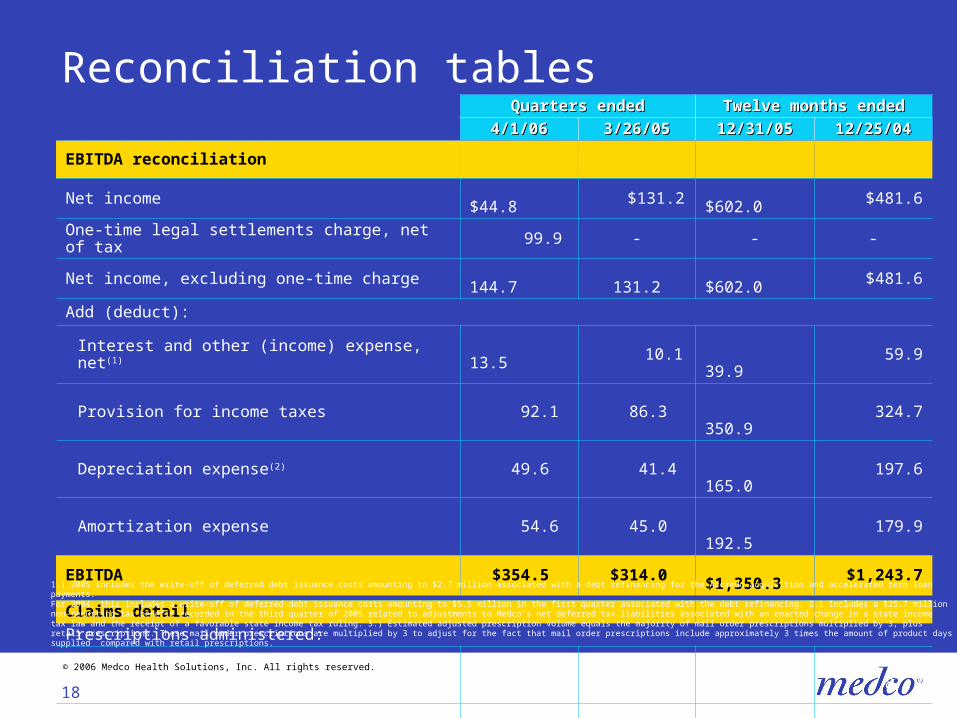
Reconciliation tablesQuarters endedQuarters ended Twelve months endedTwelve months ended
4/1/064/1/06 3/26/053/26/05 12/31/0512/31/05 12/25/0412/25/04
EBITDA reconciliation
Net income $44.8 $131.2 $602.0 $481.6
One-time legal settlements charge, net of tax 99.9 - - -Net income, excluding one-time charge 144.7 131.2 $602.0 $481.6
Add (deduct):
Interest and other (income) expense, net(1) 13.5 10.1
39.9 59.9
Provision for income taxes 92.1 86.3
350.9 324.7
Depreciation expense(2) 49.6 41.4
165.0 197.6
Amortization expense 54.6 45.0
192.5 179.9
EBITDA $354.5 $314.0 $1,350.3 $1,243.7
Claims detail
Prescriptions administered:
Mail order 22.0 20.9
87.3 87.7
Retail 117.9 110.0
452.8 415.2
Total 139.9 130.9
540.1 502.9
Adjusted prescriptions(3) 183.5 172.7
714.1 678.3
EBITDA per adjusted prescription $1.93 $1.82
$1.89 $1.83
1.) 2005 includes the write-off of deferred debt issuance costs amounting to $2.7 million associated with a debt refinancing for the Accredo acquisition and accelerated term loan payments. For 2004, this includes a write-off of deferred debt issuance costs amounting to $5.5 million in the first quarter associated with the debt refinancing. 2.) Includes a $25.7 million non-recurring tax benefit recorded in the third quarter of 2005 related to adjustments to Medco's net deferred tax liabilities associated with an enacted change in a state income tax law and the receipt of a favorable state income tax ruling. 3.) Estimated adjusted prescription volume equals the majority of mail order prescriptions multiplied by 3, plus retail prescriptions. These mail order prescriptions are multiplied by 3 to adjust for the fact that mail order prescriptions include approximately 3 times the amount of product days supplied compared with retail prescriptions.
19
© 2006 Medco Health Solutions, Inc. All rights reserved.
Use of non-GAAP measures
Medco calculates and uses EBITDA and EBITDA per adjusted prescription as indicators of its ability to generate cash from reported operating results. These measurements are used in concert with net income and cash flows from operations, which measure actual cash generated in the period. In addition, the company believes that EBITDA and EBITDA per adjusted prescription are supplemental measurement tools used by analysts and investors to help evaluate overall operating performance and the ability to incur and service debt and make capital expenditures. EBITDA does not represent funds available for the company's discretionary use and is not intended to represent or to be used as a substitute for net income or cash flows from operations data as measured under U.S. generally accepted accounting principles ("GAAP"). The items excluded from EBITDA but included in the calculation of the company's reported net income are significant components of the consolidated statements of income, and must be considered in performing a comprehensive assessment of overall financial performance. EBITDA, and the associated year- to-year trends, should not be considered in isolation. Medco's calculation of EBITDA may not be consistent with calculations of EBITDA used by other companies.
EBITDA per adjusted prescription is calculated by dividing EBITDA by the adjusted prescription volume for the period. This measure is used as an indicator of our EBITDA performance on a per-unit basis, providing insight into the cash-generating potential of each prescription. EBITDA per adjusted prescription reflects the level of efficiency in the business model and is affected by changes in prescription volumes between retail and mail, as well as the relative representation of brand-name, generic and specialty drugs.
Medco uses earnings per share excluding intangible asset amortization expense as a supplemental measure of operating performance. The excluded amortization is associated with intangible assets that substantially arose in connection with the acquisition of Medco by Merck & Co., Inc. in 1993 that were pushed down to Medco's balance sheet. The company believes that earnings per share, excluding the amortization of these intangibles, is a useful measure because of the significance of this non-cash item and to enhance comparability with its peers. The intangible asset amortization resulting from Medco's acquisition of Accredo in August 2005 is not part of the excluded amortization in this calculation, as such stems from a Medco investment decision.