mechanical behaviour analyzes of one leaf stone masonry walls
TRANSCRIPT

Cinpar 2010 - www.cinpar2010.com.ar - [email protected]
3rd SUBJECT – Material Characterization
Mechanical Behaviour Analyzes of One Leaf Stone Masonry
Walls Almeida C.1,a, Costa C. Q.2,b, Guedes J.3,c, Arêde A.3,d, Costa A.4,e
1PhD Student, Faculty of Engineering of University of Porto, Civil Engineering, Portugal 2Researcher, Faculty of Engineering of University of Porto, Civil Engineering, Portugal
3Assistant Professor, Faculty of Engineering of University of Porto, Civil Engineering, Portugal 4Full Professor, University of Aveiro, Civil Engineering, Portugal
[email protected], [email protected], [email protected], [email protected], [email protected]
Keywords: Stone Masonry, Experimental Testing, Numerical Modelling Abstract
The study of stone masonry buildings is a topic of great concern among the scientific community. This concern comes mainly from the need and interest in preserving the large number of constructions of this type existing all over the world. These buildings are characterized by a heterogeneous composition of materials, often with irregular shapes (mainly stones and mortar for the walls and timber for the roof and floors) and complex links and interactions, which make difficult the understanding of the mechanical behaviour of the global construction. Also for this, the definition of a law and numerical models capable of reproducing the real behaviour of these structures still represents a big challenge.
In this context, the present work aims contributing for a better knowledge on the mechanical behaviour of one leaf stone masonry walls, a typology found in many old constructions in Portugal. The study will focus on the walls of a building from the beginning of the XX century at Porto, which at that time was undergoing a rehabilitation process. The study starts with the geometrical characterization of the walls through a photographic survey and the collection of stones and mortar samples for laboratory analyses. A series of laboratory compression tests was done in panels extracted from one of the walls (that was meant to be demolished), to evaluate its strength and stiffness. The results obtained from the original panels were later analyzed and compared to the ones obtained after injecting the voids between stones with lime mortar. Based on the geometrical survey of the transversal section of the tested panels, the walls were simulated on the computer code Cast3M through linear elastic behaviour laws. The model allowed reproducing the experimental tests and evaluation the influence of the voids and mortar properties in the Young modulus of this type of masonry.

Cinpar 2010 - www.cinpar2010.com.ar - [email protected]
1. Introduction The rehabilitation of old stone masonry buildings is a topic of great
interest, given the growing need and will to protect and restore the safety and functionality of this large heritage, which exists spread all over the world. In Portugal, the cities historical centres are mainly dominated by this type of constructions. At Porto, these structures are made of timber beams and trusses supported by stone masonry (typically one leaf) walls, 30 to 50cm thick with large granite blocks.
Stone masonry is a heterogeneous composite structural material, mostly made of stones and mortar with complex links and interactions in between, for which the definition of realistic behaviour laws remains a big challenge. Research conducted in Italy [1] on buildings damaged by earthquakes characterizes and classifies the masonry according to the analysis of the walls elevation and cross-section. In Portugal, some work has been done on the survey of stone masonry constructions in different regions [2] and a first attempt to create a database was done through the study of stone walls from buildings of the town of Tentúgal [3].
To evaluate the mechanical properties of the masonry, several authors tried to reproduce different typologies in laboratory environment, designing physical models that respect the in-situ characteristics of the walls [4, 5]. In Italy, an experimental study was conducted to evaluate the mechanical behaviour of three-leaf walls under compression tests [6]. In the Laboratory of Earthquake and Structural Engineering (LESE) of the Faculty of Engineering of Porto University (FEUP) a wall from a building in Azores damaged after the 1998 earthquake was tested under constant vertical force and horizontal cyclic displacement applied to the top [7].
Different numerical analyses are found in the literature regarding the simulation of masonry walls, either as isolated panels, or as part of more complex constructions [8]. In these analyses, the masonry can be considered as an equivalent homogeneous material, disregarding the division into the different components (stones, bricks, mortar, wedges, infill, joints, voids…) by using concrete type models, or, in the limit, the components can be individualized and simulated separately using more or less complex behaviour models [8].
The present work aims contributing to the understanding of the phenomena involved in the behaviour of one-leaf stone masonry walls. Recently, a building located at the centre of Porto with this type of walls was used as case study. It allowed surveying the in-situ geometrical characteristics of the masonry walls and, afterwards, a wall of this building that was meant to be demolished was cut into six panels and transported to the LESE to evaluate its mechanical properties through a large experimental campaign. A series of uniaxial compression tests were done in three panels to assess the walls response in its original state and after injecting the voids in the joints with lime mortar. This last procedure was done in one of the three panels to evaluate the changes in the mechanical properties when the internal voids were filled in. Finally, some numerical analyses were performed using Cast3M software [9]

Cinpar 2010 - www.cinpar2010.com.ar - [email protected]
and the material properties calibrated through the experimental results from the referred experimental campaign. The wall was simulated in 2D, using the elevation and the vertical cross-section under, respectively, plane stress and plane strain hypotheses, and by individualizing the stones, the mortar and the joints between the two materials.
2. Description of the building The building used as case study, identified by A in Fig. 1(a), is located in
the city of Porto and was constructed in 1916 for industrial purposes by a major manufacturer of the city. In 1918, a second building adjacent to the first was constructed, for the factory workers and their families. Later, the two buildings were linked through the opening of a door at the top floor. The building has a rectangular configuration, 11.5x30.0m2, showing a basement (floor -1), two large floors (floors 0 and 1) and a sloped roof, Fig. 1(b). An internal structural stone masonry wall divides floor -1 in two independent spaces and supports the wooden beams of floor 0, Fig. 1(c).
Porto traditional constructions are typically characterized by granite masonry walls, wooden floor beams and roof trusses covered with ceramic tiles. The walls of the main façades are covered with mortar and (or) ceramics. At the time of the study, the building was under rehabilitation. The intervention included the demolition of the internal structural wall in floor -1 and the opening of windows and doors at the remaining walls.
(a) (b) (c)
Figure 1 : (a) Identification of the building (b) main facade (c) configuration plan.
3. Characterization of the Stone Masonry The characterization of the stone masonry walls needs a thorough
investigation of the geometry (in elevation and cross-section) and constitutive materials. For this purpose, the first approach to the building was the application of a form, expressly designed to collect and record the information concerning the masonry properties. This form was based in similar ones developed in Italy for the survey of old masonry buildings damaged during earthquakes [1]. The information is grouped into sections, namely the identification of the wall texture and cross-section (visible after wall cutting), the evaluation of the general characteristics and the percentage of its constituents (stone, mortar and voids). A photographic survey using a ruler as scaling factor is also included. The quantities of each material were evaluated using image

Cinpar 2010 - www.cinpar2010.com.ar - [email protected]
processing resorting to computational tools. Fig. 2 and 3 show the elevation and cross-section of three wall panels (E1, E2 and E3, located at the 1st floor), before and after image processing.
The survey showed that, in general terms, the masonry consists of medium to large size rectangular type stones (50 to 90cm measured diagonally) arranged on a regular alignment, with a significant number of small stone wedges (shims), mortar joints and, occasionally, brick pieces. The stones are in yellow granite. The joints present variable thickness (0.5 to 2cm) and are filled in with cream colour brittle mortar.
Figure 2 : Location of the surveyed walls (E1, E2 and E3) at floor 1.
E1 E2 E3 Figure 3 : Elevation and cross-section survey of the walls in Figure 2.
The cross-section of the surveyed walls consists of a single leaf of
granite stones, 30cm thick, with a widespread distribution of voids, more evident in the midline. In fact, the mortar was originally placed along the border lines, without filling the inside where the voids are quite evident, creating cavities due to the irregular shape of both the upper and lower stone faces in contact. The percentage of the materials measured through the elevation and cross-section was determined from the pictures in Fig. 3. The results are listed in Table 1; for the purpose of this work, the wall constituents are split into stone blocks, stone wedges, mortar and voids. The results show that the materials percentage estimated by just analysing the wall elevation may lead to significant errors due to difficulties on estimating the actual stone blocks size, the joints thickness and the voids volume, when compared to the results and information obtained using the cross-section picture

Cinpar 2010 - www.cinpar2010.com.ar - [email protected]
Table 1 : Material characterization using image processing.
Elevation Cross-section Filing
Zone Stone (%)
Filling (%)
Stone (%) Wedges
(%) Mortar
(%) Voids (%)
Total (%)
E1 86.05 13.95 94.9 0.5 3.5 1.1 5.1 E2 85.50 14.50 93.9 2.6 2.3 1.2 6.1 E3 81.54 18.46 91.8 3.8 4.0 0.4 8.2
It is noteworthy that the elevation view (in most cases the unique
accessible view) only allows identifying the percentage of stone and of the remaining material as a whole, herein referred to as filling. In this case, the elevation analysis yielded an 11% underestimation of the stone percentage when compared to the cross-section based estimation, which is considered to provide more realistic results. Unfortunately, accessing the wall cross-section is not always possible or feasible, and such data cannot be obtained.
This study included other wall sections located in floor -1, namely the left external wall (Wall D in Fig. 4), which was cut in order to create a 7m span opening, and the inner wall (Wall C in Fig.4), which had to be demolished according to the rehabilitation project. Besides the preliminary in-situ analysis, the wall C was sectioned into several panels and transported to the LESE for experimental tests (addressed in subsequent paragraphs). At the floor -1, both walls C and D are made of one leaf stone masonry, 40cm and 50cm thick, respectively, with similar characteristics of walls E. Also in this case, the widespread voids distribution is noticeable. The percentages of the different materials were also determined through image processing of the walls cross-section photos (Fig. 5).
Figure 4 : Location of the surveyed walls C and D at floor -1.
D1 D2 D3 C1 C2 C3
Figure 5 : Geometrical survey of the cross-sections of the walls C and D.

Cinpar 2010 - www.cinpar2010.com.ar - [email protected]
The elevation photos were not used for the geometrical survey of these
walls due to the considerable portion of mortar covering the joints and part of the stones which unabled the proper evaluation of the stone contours. The results of the cross-sections analysis presented in Fig. 6 show the variation of the different materials percentage for different wall thicknesses (50, 40 and 30cm); a decrease in the wall thickness corresponds to a reduction of the filling percentage.
Figure 6 : Evolution of the percentage of material for different wall thicknesses.
4. Characterization of the Materials During the demolition of the wall, cylindrical stone samples were taken
from stones, properly identified and tested for the evaluation of the compressive strength and modulus of elasticity. These tests were carried out in specimens kept under dry laboratory environment, giving average values for the compressive strength and Young modulus of 61MPa and 26GPa, respectively.
In addition, samples of mortar were taken for chemical and mineralogical characterization. These tests were performed in the Laboratory of the Civil Engineering Department of the University of Aveiro, comprising: the acid dissolution analysis for determining the percentage of material components, the application of X-ray diffraction (DRX) to obtain the mineralogical composition and the use of X-ray fluorescence spectrometry (FRX) for assessing the chemical composition. The results showed that it is a lime and sand based mortar with a proportion ratio of 1:3.
5. Wall Panels for Laboratory Tests Given the interest to study this type of masonry in detail, the six panels
extracted from the 30m long and 0.40m thick wall C shown in Fig. 4, namely four panels 1.2m wide (PP1 to PP4) and two 1.6m wide (PG1 and PG2), were transported to the LESE to be submitted to a series of mechanical tests. All the panels were 2.50m high. The walls were cut down to the foundation level using a diamond saw blade.
To succeed in the transport operation, it was necessary to adopt a confinement system that would allow the extraction, lifting and transportation of the walls to the laboratory in suitable and safe conditions. An external

Cinpar 2010 - www.cinpar2010.com.ar - [email protected]
contractor (Mota-Engil) helped on the definition of the procedures inherent to the packing (using Doka-Formwork elements) and transportation of the wall. The sequence of the operations is illustrated in Fig. 7.
Figure 7 : Panels for laboratory tests (from left to right): cutting, extraction and
transportation
After making the vertical cuts, three holes were drilled near the base of each panel, for inserting Dividag bars to confine and sustain the exterior containment structure; this structure was placed from the top down to the wall basement and then compressed against the wall through the Dividag bars at the base and three others placed at the top. This procedure was applied to all the panels; the lifting and placing on the vehicle that transported the walls was provided by the crane available on site.
Despite of all the care taken during cutting and transportation, some walls suffered slight damages resulting from the detachment of stones near the edges. Therefore, the panels were subjected to minor repairs done by experienced workers and using a lime and clay mortar with a 1:3 ratio. Nine mortar specimens were tested under compression loading at the age of 28, 60 and 90 days, from which average compressive strengths of 1.68MPa, 1.78MPa and 1.54MPa were measured using three samples for each age. There was an unexpected reduction of resistance from 60 to 90 days, probably due to internal cracking resulting from shrinkage.
6. Uniaxial Compression Test A series of tests was undertaken in order to characterize the mechanical
behaviour of the masonry walls. The panels identified by PP1, PP2 and PP3 were subjected to uniaxial compression tests; the panel PP4 was divided into two panels for diagonal compression tests and the panels PG1 and PG2 will be later shear tested under constant compression force. Only the tests on PP1, PP2 and PP3 will be presented in this paper.
a) Testing setup and sequence
The compression tests were performed under displacement control,
using the 3MN testing machine of the Laboratory for Testing Construction Materials (LEMC) of FEUP.
Due to the instability of the panel cut surface and taking into account the in-situ confinement conditions, the panels were laterally confined by two steel
Cinpar 2010 - www.cinpar2010.com.ar - [email protected]
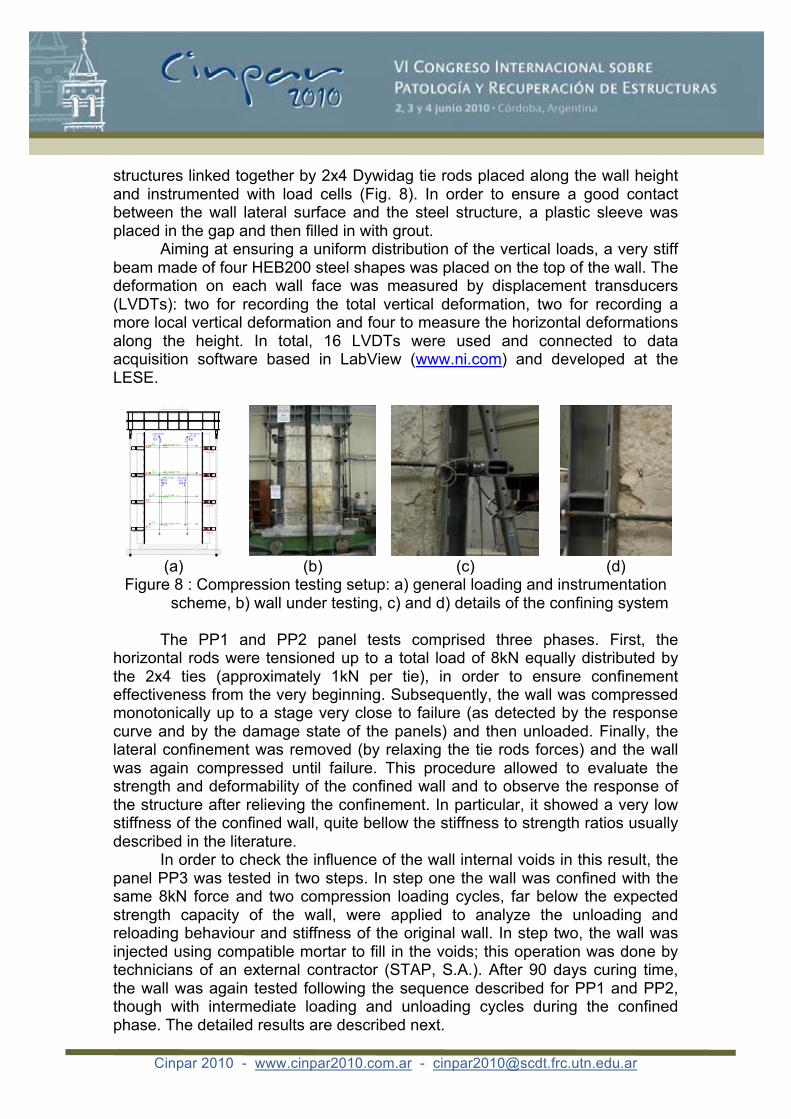
structures linked together by 2x4 Dywidag tie rods placed along the wall height and instrumented with load cells (Fig. 8). In order to ensure a good contact between the wall lateral surface and the steel structure, a plastic sleeve was placed in the gap and then filled in with grout.
Aiming at ensuring a uniform distribution of the vertical loads, a very stiff beam made of four HEB200 steel shapes was placed on the top of the wall. The deformation on each wall face was measured by displacement transducers (LVDTs): two for recording the total vertical deformation, two for recording a more local vertical deformation and four to measure the horizontal deformations along the height. In total, 16 LVDTs were used and connected to data acquisition software based in LabView (www.ni.com) and developed at the LESE.
(a) (b) (c) (d)
Figure 8 : Compression testing setup: a) general loading and instrumentation scheme, b) wall under testing, c) and d) details of the confining system
The PP1 and PP2 panel tests comprised three phases. First, the
horizontal rods were tensioned up to a total load of 8kN equally distributed by the 2x4 ties (approximately 1kN per tie), in order to ensure confinement effectiveness from the very beginning. Subsequently, the wall was compressed monotonically up to a stage very close to failure (as detected by the response curve and by the damage state of the panels) and then unloaded. Finally, the lateral confinement was removed (by relaxing the tie rods forces) and the wall was again compressed until failure. This procedure allowed to evaluate the strength and deformability of the confined wall and to observe the response of the structure after relieving the confinement. In particular, it showed a very low stiffness of the confined wall, quite bellow the stiffness to strength ratios usually described in the literature.
In order to check the influence of the wall internal voids in this result, the panel PP3 was tested in two steps. In step one the wall was confined with the same 8kN force and two compression loading cycles, far below the expected strength capacity of the wall, were applied to analyze the unloading and reloading behaviour and stiffness of the original wall. In step two, the wall was injected using compatible mortar to fill in the voids; this operation was done by technicians of an external contractor (STAP, S.A.). After 90 days curing time, the wall was again tested following the sequence described for PP1 and PP2, though with intermediate loading and unloading cycles during the confined phase. The detailed results are described next.

Cinpar 2010 - www.cinpar2010.com.ar - [email protected]
b) Analysis of the results of the original walls Panels PP1 and PP2
The tests allowed quantifying strength and deformability parameters for both panels PP1 and PP2. The maximum vertical displacement recorded for panel PP1 was 40mm at a maximum force of 1700kN, and 23mm for panel PP2 at 1200kN maximum force.
The analyses of the stress-strain diagrams, with and without lateral confinement (Fig. 9(a)), show that the wall compressive stresses reached 3.94MPa for panel PP1 and 2.50MPa for panel PP2, which reduce, respectively, to 1.87MPa and 1.34MPa after first damage when the lateral confinement was relieved. The diagrams also show that both wall panels have similar deformability.
The value of the secant elastic modulus (calculated at about 10-30% of the maximum strength) in the confined phase of the test was determined assuming two types of analysis within the classical theory of elasticity, namely: i) considering the confinement effect (assuming a biaxial plane stress loading conveying an almost plane strain state in the cross-section) or ii) neglecting such effect (thus considering a uniaxial plane stress state). The elastic modulus values obtained by these two types of analyses were comparable, reaching 0.22GPa for the PP1 and 0.33GPa for the PP2. It was clear that this confinement effect plays a minor role in the evaluation of the elastic modulus which is consistent with the low average horizontal stress recorded during the tests that was only about 6% of the vertical stress. For that reason, the elastic modula presented in this paper were calculated without considering the confinement effect in the calculations. In terms of unloading and reloading, the results show that a strong plastic deformation occurs, reflecting a very high stiffness in these conditions. It is noteworthy that the reloading stiffness is much larger than the initial stiffness of the confined wall, namely 0.5GPa for PP1 and 0.7GPa for PP2.
Concerning the ratio between the modulus of elasticity and the compressive strength, it was found , which is far below the value proposed in Eurocode 6, [10].
(a) (b)
Figure 9 : a) Vertical stress-strain plots for PP1 and PP2 and b) crack patterns in panel PP1.

Cinpar 2010 - www.cinpar2010.com.ar - [email protected]
The cracking pattern observed during the test was mainly vertical, more
evident halfway up the wall; the damage became more notorious, with crushing and cracking of some stones, for a stress level of about 1.5MPa (Fig. 9b). Panel PP3
The study of panel PP3 focused on the evaluation of the elastic modulus on the cyclic behaviour. Two loading-unloading cycles were applied to the confined wall (Fig. 10): the first cycle for a maximum force of 500kN (about 1/3 of the maximum load recorded in the tests of PP1 and PP2) and the second for 700kN. The stress and stiffness for the two cycles are shown in Table 2.
The stress-strain diagram shows that after unloading and reloading, the panel exhibits a small strength reduction but the envelop curve is reached slightly beyond the same point from where it unloaded, which is a sort of “memory” very common of many civil construction materials such as concrete and steel. Moreover, as in the previous cases, during the unloading and reloading stages, the stiffness is considerably larger than the initial one, due to the deformability characteristics of masonry that include very high plasticity; therefore, only a small percentage of the joint compressive deformation and of crushing of contact surfaces between the different elements is recovered. Once again, a very low stiffness was measured in the first loading branch. At this point only a slight detachment of mortar was registered, without cracking. This result underlined, once again, the low stiffness registered by these walls. In order to check the influence of the voids to this result, the joints of the panel PP3 were injected and the wall was tested again.
Figure 10 : Axial stress-strain diagrams for PP3 in the first phase of the study.
Table 2 : PP3 results: stress (σc) and stiffness (E).
1st cycle 2nd cycle Unload and reload σc (MPa) E10-30% (GPa) σc (MPa) E10-30% (GPa) Eu,r (GPa)
1.05 0.36 1.50 0.39 1.37

Cinpar 2010 - www.cinpar2010.com.ar - [email protected]
c) Analysis of the results of the “injected wall” Injection procedures
In order to assess the influence of the wall internal voids in the panel stiffness, the wall PP3 was injected with a mortar made of a mixture of hydrated lime, hydraulic lime, sand and water with very poor stiffness and strength characteristics. The operations consisted first, on identifying points to introduce plastic injection tubes in both wall faces, in order to ensure adequate penetration of the mortar to fill the voids. Then the joints were sealed with hydraulic lime and clay mortar (ratio 1:3) to avoid leakage of the injection mortar. The injection was performed at low pressure (3bar), tube by tube, starting from the bottom up to the top of the wall. The voids were considered to be filled in when the mortar reaches the upper tubes. The operation proceeded until the full injection of all tubes on both wall sides was completed (Fig. 11), what took about half an hour and around 85litres of mortar. Given the wall volume (1.17m3), this corresponds to a void ratio of around 7.3%, considerably larger than the ratio estimated in the survey using the panel cross-section (2.6%). This difference arises from the estimation process which, for instance, does not account for the voids along the vertical joints, as well as for the fact that the injected mortar penetrates into the quite porous mortar of the wall.
Figure 11 : Injection of the mortar in the panel PP3.
Analysis of the results
After injection, the panel PP3 was subjected to the same loading cycles of the original panel: a first cycle up to 500kN and a second one up to 700kN, the last being repeated three times. Then, the panel was loaded up to a force of 1200kN, unloaded and reloaded twice and, finally, it was driven to failure (or close to failure, since the damage and the stress-strain curves provided that indication, Fig. 12(a)). The wall reached a maximum stress of about 5.4MPa. The test was not driven through the softening phase of the response curve for safety reasons, concerning equipment and staff. Comparing this result with the average values obtained with the PP1 and PP2 tests, it exhibits a strength increase of about 60%. As for the modulus of elasticity for the first and second load cycles, the values were 0.93GPa and 1.09GPa, respectively. Concerning the unloading and reloading curves, they show that the stiffness reaches a

Cinpar 2010 - www.cinpar2010.com.ar - [email protected]
value of 1.90GPa. Similarly to the PP1 and PP2 tests, the PP3 panel was also tested without lateral confinement, leading to the final cycle shown in Fig. 12(a), where the strength was about 3.4MPa.
This analysis shows the importance of the internal voids of the wall, which, once filled in, leads to a significant stiffness increase (almost 3 times), in comparison to the original situation (Fig. 12(b)). Although this is a one leaf wall made of stones of considerable size, the internal voids have a strong influence on the strength and deformability of the structure.
(a) (b)
Figure 12 : Results of panel PP3: a) vertical stress-strain diagram after the injection and (b) comparison of the stress-strain diagrams before and
after the injection.
7. Numerical Simulation The main objective of the numerical simulations within this work is to
contribute to a better understanding of the phenomena involved and the way the different components interact and participate to the final response of this one-leaf granite stone walls under compression forces. In particular, it seeks for an explanation for the low stiffness and the large effect of the voids observed in the experimental tests.
Following these objectives, the PP3 panel was simulated numerically, using the experimental results to calibrate the model. The numerical modelling and computations were performed using the general purpose finite element based computer code Cast3M, formerly known as CASTEM 2000. The process is based on a 2D detailed modelling with zero thickness joints in the contact between the different elements: block-to-block and block-to-mortar. The geometry of the wall was reproduced in a CAD program and transformed afterwards to Cast3M geometry. a) Description of the model
Three different geometrical models were adopted to simulate the wall. The first corresponds to the vertical cross-section of the wall after the cut. The second model represents the cross-section as well, but after the injection,

Cinpar 2010 - www.cinpar2010.com.ar - [email protected]
meaning that the voids in the first model were filled in with mortar elements. The third model corresponds to the wall elevation.
Five different types of materials/elements were generated in the cross-section, namely: blocks, wedges, mortar, voids and joints connecting stone-to-stone, stone-to-mortar, stone-to-wedges and mortar-to-wedges (Fig. 13(a)). As for the elevation, no voids were considered, since they are only visible in the cross-section. The materials were simulated by linear elastic behaviour models with no coupling between compression and shear. The cross-sections and the elevation were calculated considering plane strain and plane stress models, respectively. Fig. 13 shows the different components and meshes considered in the three models.
(a) (b) (c) (d) (e) Figure 13 : Numerical models: a) cross-section photo with components’
individualization, b) cross-section mesh with voids, c) cross-section mesh with the voids filled in with mortar, d) elevation photo with components’
individualization and e) elevation mesh.
The elastic properties for the blocks and mortar were selected based on the laboratory results on stone and mortar samples from the same building, and also by matching the Young modulus measured from the experimental response curve of the wall through a trial and error procedure.
The joints are simulated through zero thickness elements without tensile strength, characterized by a compression (kn) and a shear stiffness (ks). Because these two parameters are difficult to assess, the values were adopted based in previous laboratory tests carried out at FEUP and LNEC [11, 12]. Table 3 presents the material properties that allowed a good match between the numerical and experimental wall stiffness, and that were adopted in the simulations.

Cinpar 2010 - www.cinpar2010.com.ar - [email protected]
Table 3 : Material parameters adopted in the numerical model
Young Modulus E (GPa) Unit Weight (KN/m3)
Blocks and Wedges 26.0 26.0
Mortar 0.08 21.0
kn (MPa/mm) ks (MPa/mm)
Joints 5.30 0.578 b) Results obtained Cross-section model results
In order to evaluate the sensitiveness of the numerical results to the material properties, a comparative analysis was performed by varying, within acceptable limits, the values of some of the material parameters: the mortar Young modulus (0.04; 0.2 and 3GPa, based in previous laboratory tests developed at FEUP and in [13]), the joints normal and shear stiffness kn and ks (kn = 2.5; 6.4 and 18MPa/mm and ks = 0.35; 0.68 and 0.92, respectively, values obtained in [11, 12]) and the stone Young modulus (20, 40 and 65GPa, values obtained in stones from the same wall and in [14]). This analysis was done comparing the stiffness of the wall by changing only one parameter at a time. The results (Fig. 14) show that the model has a high sensitiveness to the variation of the joints stiffness, but, on the other hand, changing the Young modulus of the stones doesn’t change the stiffness of the wall. As for the joints, the results show that the wall stiffness is quite sensitive to the joint characteristics, more than to those of the mortar, and that the characteristics of the interface between the stones and between the mortar and the stones could be the main responsible for the low stiffness of the wall. Moreover, the results also show that a stiffer or softer stone has little influence on the final results.
These analyses concern only the stiffness at the early load stages. When the non-linear effects increase, the behaviour may be also controlled by the mortar and stone cracking, and this may introduce some changes in these results.
(a) (b) (c)
Figure 14 : Sensitiveness analysis: a) stone Young modulus, b) mortar Young modulus and c) joints normal and shear stiffness.

Cinpar 2010 - www.cinpar2010.com.ar - [email protected]
Subsequently, and using the properties listed in Table 3, the cross-
sections were analysed in more detail. In particular, the principal tensile and compression stresses are presented in Fig. 15 and 16; the area with major concentration of deformations is amplified and the critical points exhibiting larger stress concentrations signalled with a circle. The area where the maximum stress occurs in each case is indicated by a capital letter. The tensile stresses reach a maximum of 3.20MPa (A) and the compression stresses a maximum of 8.47MPa (B), contrasting with the 1.50MPa uniform compression stress applied to the top of the wall. These two maximums stresses occur in the stones.
(a) (b)
Figure 15 : Principal directions (before injection): a) tensile stresses and b) compressive stresses
(a) (b) (c)
Figure 16 : Principal directions (after injection): a) tensile stresses; b) compression stresses and c) crack pattern after the compression test.
The existence of the voids enforce the compressive stresses to deviate
to the contact points close to the wall faces, causing the stress concentration that explains the large compression stress peak found in B. On the other hand, this stress generates an arch type effect that causes tensile stresses to develop at the lower part of the stones between contact points. As a result, the stones tend to open cracks in the vertical direction in correspondence with the voids.

Cinpar 2010 - www.cinpar2010.com.ar - [email protected]
To confirm the influence of the voids in the wall behaviour, the cross-
section with the voids filled in with mortar was also simulated. The material properties in Table 3 for the old mortar were also adopted for the new mortar, since in reality the mortar injected in the wall presented poor mechanical characteristics. Nevertheless, the wall stiffness increased 62% to 0.58GPa, (Fig. 17). Although lower than the stiffness determined in the experimental test with the injected wall, 1GPa, this result follows the trend of the experimental results. Moreover, the results in Fig. 16 show that after injection the maximum tensile stress value (C) is similar (3.72MPa), but the maximum compressive stress is 5.29MPa, considerably lower than the value in B. Despite the poor mechanical properties of the mortar, the maximum compression stress dropped more than 35% after filling in the voids with mortar. This result clearly supports the feeling that the voids play a major role in the properties of such one-leaf type walls. The more uniform distribution of the vertical stresses between the blocks and the mortar contrasts with the previous case in which an important concentration of compressive stresses is easily identified in the limits of the voids.
Although the maximum principal tensile stress do not vary significantly, a redistribution of the principal stresses around the voids is identified, leading to lower peaks of tensile stresses in the majority of the sections. In addition, the above mentioned arch type effect, although still existing (the mortar has a much lower stiffness than the stones), has a smaller expression when the voids are filled with mortar, and this may delay the development of cracks in these points. Nevertheless, the final aspect of the cross-section at the end of the test shows that these vertical cracks appear at the weakest zone, Fig. 16(c). These results confirm that the more uniform distribution of stresses in the horizontal cross-sections is the major responsible for the stiffness increase when the voids are filled in with mortar.
Figure 17 : Comparison between the experimental and wall stiffness calculated
based on the two numerical models. In order to determine the wall zones that yield larger contributions to the
total deformation, seven areas were considered and the corresponding deformations calculated before and after the injection of the voids, Fig. 18.

Cinpar 2010 - www.cinpar2010.com.ar - [email protected]
The deformation obtained after injection is smaller in all the areas, except
in V2 that corresponds to a unique stone with no joints or mortar in between. It is visible that the area V5 is the one that gives a higher contribution to the global deformation, as the contact surface between the stones in this zone is very small, causing a large concentration stress that leads to a significant deformation. The almost null deformation in V2 highlights that the deformation of the wall is essentially due to the joint deformability and that it is independent of the stone properties. This fact supports the conclusions of the sensitiveness analysis. The areas where the displacements variation was higher were those that included larger voids, such as V4, V5 and V7.
(b) (c)
(a) (d)
Figure 18 : Vertical displacements of the wall cross-section: a) selected areas, b) displacements before injection, c) displacements after injection and d) comparison of the displacements before and after injection for areas V4,
V5 and V7. Elevation model results
The elevation model results are presented in Fig. 19. The stress concentration is evident in some areas, especially in the mortar and in contact points between stones. In Figure 19(a) the maximum principal tensile stress, 8.90MPa (Zone E), occurs in the place where the first crack developed during the experimental test, supporting the numerical simulation results. Regarding the principal compression stresses, a maximum value of 7.36MPa (Zone F) was reached. Also in this case the arch effects are visible, leading to high tensile stresses in some points and explaining some of the cracks that occurred during

Cinpar 2010 - www.cinpar2010.com.ar - [email protected]
the experimental test. As for the stiffness, although a closer approximation to the results of the cross-section after injection should be expected, it gives a value almost equal to that of the cross-section before the injection, i.e. with the voids. This result underlines the difficulty of simulating the mechanical behaviour of a wall by just using the elevation geometrical characteristics, since the real contact between stones and the presence of voids can hardly be detected. Moreover, by looking at the elevation, and due to the irregular shape of the stone blocks, one is forced to admit a larger thickness of the joints, which means a larger amount of mortar. By analyzing the cross-section and the elevation numerical models, the percentages of mortar plus voids at the cross-section model is around 10%, while in elevation is 15%. Therefore, a more flexible wall is expected when using the elevation model.
(a) (b) (c)
Figure 19 : Numerical results for the wall elevation: a) principal tensile stresses direction; b) principal compressive stresses direction and c) crack
pattern after the compression test.
8. Conclusions This work aimed at contributing for a better knowledge about the one-leaf
stone masonry walls made of large stone blocks, a structural element present in many buildings of the historical centre in the city of Porto, Portugal.
The geometrical characteristics of the walls, namely the percentages of their constituents (stone, wedges, mortar and voids) were analysed through photography, using pictures of both the elevation and the cross-section of the walls. An experimental campaign (uniaxial compression tests) done on panels retrieved from a real wall of an old building allowed to determine the mechanical characteristics of the wall. The results show that although the compression strength is within the expected range of values, the stiffness is much smaller than expected, especially when compared to code standard indications or bibliography proposals. The injection of mortar to fill in the voids of one of the wall panels showed that the large deformability observed is strongly related to

Cinpar 2010 - www.cinpar2010.com.ar - [email protected]
these large voids. Although with very poor mechanical characteristics, the injected mortar led to a significant stiffness and strength increase of the wall.
In an attempt to better understand these changes in the walls properties, the vertical cross-section and the elevation of one of the wall panels, PP3, was simulated numerically, individualizing its different components. After the calibration process (using the experimental results), the compression tests were simulated using linear elastic models for the materials and joints. The numerical results allowed concluding that the low compression stiffness of the wall is essentially due to the contact between the stones and the mortar, represented in the model by the joints. Nevertheless, the mortar also influences the results, contrarily to the stones. However, in the case of this wall, there is another “material” that contributes significantly to the global behaviour of the wall: the voids! The lack of mortar inside the wall, linked to the fact that the stones are quite irregular, leads the stresses to concentrate at the contact points, giving high compression stress peaks and high global deformability. This behaviour creates an arch type effect between contact points (above the voids) that increases the tensile stresses on the stones and justifies the crack pattern observed during the experimental test.
Finally, the numerical simulation of the wall with the voids filled in with mortar shows a significant stiffness increase, but still lower when compared to the experimental test. The increase of the wall stiffness is mainly due to a better distribution of the compression stresses inside the wall, without strong concentration of stresses and avoiding the arch effect between stones.
The present study is still under development. In particular, non linear behaviour material models will be applied in the analyses. This will allow understanding the high compression strength attained at the walls when compared to the low stiffness, and to analyze the influence of the stones cracks due to the arch effect on the walls response.
Acknowledgments The authors acknowledge the collaboration of: the constructor Mota-Engil during the packing operations and transportation of the walls to the laboratory; the constructor STAP, S.A. for the injection operations; architect Adriana Floret; engineer Domingos Martins and the 3M2P constructor for allowing using the building as a case study and for all the support provided during the work, in particular from Mr. Albertino. The efforts of the LESE staff, Mr. Valdemar Luis and André Martins, are gratefully acknowledged. This work includes research carried out with financial support of FCT, through the founding of its research unit CEC (Construction Study Centre of FEUP) and the Ph.D. grant given to the first author.
References [1] Binda, L. 2000. Caratterizzazione delle murature in pietra e mattoni ai
finidell'individuazione di opportune tecniche di riparazione, CNR-Gruppo Nazionale per la Difesa dai Terremoti” - Roma, 2000, 181 pp.

Cinpar 2010 - www.cinpar2010.com.ar - [email protected]
[2] Casella, G.: Gramáticas de Pedra. Levantamento de Tipologias de Construção Muraria”, Centro Regional de Artes Tradicionais, 2003.
[3] Pagaimo, F.: Caracterização Morfológica e Mecânica de Alvenarias Antigas: Caso de estudo da Vila de Tentúgal, Faculdade de Ciências e Tecnologia da Universidade de Coimbra, Departamento de Engenharia Civil, 2004.
[4] Oliveira, D. V., Lourenço, P.B.: Experimental Behaviour of Three-Leaf Stone Masonry Walls, Conference and Brokerage Event, The Construction Aspects of Built Heritage Protection, Dubrovnik, Croatia, 2006.
[5] Vintzileou E., Miltiadou-Fezans A.: Mechanical properties of three-leaf stone masonry grouted with ternary or hydraulic lime-based grouts, Engineering Structures, 2007.
[6] Valluzzi, M. R., Porto, F. and Modena, C.: Behaviour of multi-leaf stone masonry walls strengthened by different intervention techniques, University of Padua, Department of Structural and Transportation Engineering, Padua, Italy, 2001.
[7] Costa, A., Silva, B., Costa, A., Guedes, J., Arêde, A.: Structural Behaviour of a Masonry Wall under Horizontal Cyclic Load; Experimental and Numerical Study, 5th International Conference on Structural Analysis of Historical Constructions, New Delhi, India, 2006.
[8] Silva, B., Aplicação de um Modelo de Dano Contínuo na Modelação de Estruturas de Alvenaria, Master Thesis, Porto, 2008.
[9] CEA (2003). Manuel dútilisation de Cast3m – http://www-cast3m.cea.fr. C. à. l. É. Atomique. Saclay, Commissariat à l’Énergie Atomique.
[10] NP ENV1996 1-1: Eurocódigo 6, Projecto de estruturas de alvenaria, Parte 1-1: Regras gerais para edifícios, regras para alvenaria armada e não armada, 2000.
[11] Almeida, C.; Análise do Comportamento da Igreja do Mosteiro da Serra do Pilar sob a Acção dos Sismos, Master Thesis, Porto, 2000.
[12] Ensaios de Mecânica das Rochas para o Mosteiro da Serra do Pilar, Laboratório Nacional de Engenharia Civil, Lisboa, 2000.
[13] Veiga, M., Silva, J., Carvalho, F.; Conservação e Renovação de Revestimentos de Paredes de Edifícios Antigos, Laboratório Nacional de Engenharia Civil, Lisboa, 2004.
[14] Vasconcelos, G., Lourenço, P., Alves C., Pamplona J.: Experimental properties of granites, 6th International Symposium on the Conservation of Monuments in the Mediterranean Basin, 2004.