mec (extended slofec) and ut external pipeline inspection ......mec (extended slofec) and ut...
TRANSCRIPT

Unit 27/28 Howemoss Avenue - Unit 1 Webb Ellis Park Kirkhill Industrial Rugby CV21 2NP Dyce AB21 0GP Warwickshire, UK Aberdeen, UK Phone: +44 (0) 1788 5472 94 Phone: +44 (0) 1224 724 744 Fax: +44 (0) 1788 5472 99 Fax: +44 (0) 1224 774 087
W W W . I N N O S P E C T I O N . C O M I N F O @ I N N O S P E C T I O N . C O M
MEC (Extended SLOFEC) and UT External Pipeline Inspection Report
Client Client
Facility Client’s Gas Field
Items Inspected 12’’ and 6’’ Downstream Pipeline and Tie-in-Spool Sections
Inspection Method MEC (Extended SLOFEC) and UT
Date Commenced 29th May 2013
Date Completed 1st June 2013
Type of Report Final
Report Number Kxxxx

© Innospection Ltd Report No. Kxxxx
Client MEC (Extended SLOFEC)
Inspection Page 1 of 39
Client’s Gas Field
Pipeline Sections Pipeline Inspection Report Report: No Kxxx
PIPELINE
EXTERNAL INSPECTION REPORT Using MEC and UT
Prepared for
Final Report: Kxxxx
Disclaimer
The information contained in this document may be confidential. It is intended only for the use of the named recipient. If you are
not the intended recipient please delete this document. If you have received this document and are not the named recipient,
any disclosure, reproduction, distribution or other dissemination or use of the information contained in this document is strictly
prohibited.
Rev Document Author Checked Approved By
Date Name Signature Name Signature Name Signature
0 Issue to client
for comment TB KR AB 17/June/2012
Name Position Signature
AB Group Director
KR Director R&D
TB Reporting Engineer
LS NDT Technician (ET PCN Level 2)
MC
Senior Engineer (ET/UT PCN Level 3)
Technical Authority
© Innospection Ltd Report No. Kxxxx
Client MEC (Extended SLOFEC)
Inspection Page 2 of 39
Client’s Gas Field
Pipeline Sections Pipeline Inspection Report Report: No Kxxx
Contents 1. Executive Summary 3
2. Inspection Execution 3
2.1. Task 3
2.2. Inspection Objects 3
2.3. Equipment 5
2.4. Mobilisation and Preparation 6
2.5. Execution and Performance 6
3. Results 14
3.1. XXX 5 12’’ Downstream Pipeline Section (Priority 1) 14
3.2. XXX 4 12’’ Downstream Pipeline Section (Priority 2) 14
3.3. ZZZ 12’’ Downstream Pipeline Section (Priority 3) 14
3.4. YYY 2 12’’ Downstream Pipeline Section (Priority 4) 14
3.5. ZZZ 6’’ Tie-in-Spool (Priority 1) 14
3.6. YYY 2 6’’ Tie-in-Spool (Priority 2) 14
3.7. UT Measurements at XXX 5, ZZZ and YYY 2 Tee Elbows 14
3.8. List of MEC Indications 28
3.9. Conclusion 30
4. Technical Details of the Instrumentation 31
4.1. Description of the MEC (Extended SLOFEC) Technology 31
4.2. Equipment Calibration 32
4.3. Analysis Procedure 34
4.4. Description of the MEC-Combi Crawler Tool 34
Appendix 1: UT measurements performed with the crawler-integrated UT probe 37
© Innospection Ltd Report No. Kxxxx
Client MEC (Extended SLOFEC)
Inspection Page 3 of 39
Client’s Gas Field
Pipeline Sections Pipeline Inspection Report Report: No Kxxx
1. Executive Summary
The inspection of the Client’s offshore gas pipeline sections (XXX 5, XXX 4, ZZZ and YYY 2)
has been carried out between the 29th of May 2012 and 1st of June 2012. No major defects
have been detected. Three minor indications have been detected at the YYY 2 6’’ Tie-in-
Spool Section. All of them are pit-like and internal with a depth of close to 20 % wall loss.
2. Inspection Execution
2.1. Task
Innospection Ltd. has been asked by the Client to inspect several sections of the Client’s
offshore gas pipelines using the MEC (Magnetic Eddy Current) technology and ultrasonic
testing (UT).
The inspected components are:
XXX 5 12’’ Downstream Pipeline Section (Priority 1)
XXX 4 12’’ Downstream Pipeline Section (Priority 2)
ZZZ 12’’ Downstream Pipeline Section (Priority 3)
YYY 2 12’’ Downstream Pipeline Section (Priority 4)
ZZZ 6’’ Rigid Tie-in-Spool (Priority 1)
YYY 2 6’’ Rigid Tie-in-Spool (Priority 2)
The main focus of the inspection has been laid on the detection of internal metal losses, e.g.
caused by top-of-line corrosion. The MEC technology which is the next generation of fast
corrosion mapping technique based on the further development of the SLOFEC technique
was built into the MEC Combi Crawler tool (ref. 2.3) to allow for an external inspection of the
subsea pipeline.
2.2. Inspection Objects
The inspected 6’’ and 12’’ pipeline sections are part of the XXX, YYY and ZZZ gas fields
located offshore. The 12’’ pipelines downstream of each inline tee exhibit a wall thickness of
18.1 mm and a 2.5 mm 3-layer-polypropylene coating.
The 6’’ tie-in spools located at YYY and ZZZ exhibit a nominal wall thickness of 11 mm and a
2.5 mm 3-layer-polypropylene coating. The field joints of the pipelines are protected by heat
shrink sleeve, allowing the tool to negotiate the circumferential welds.
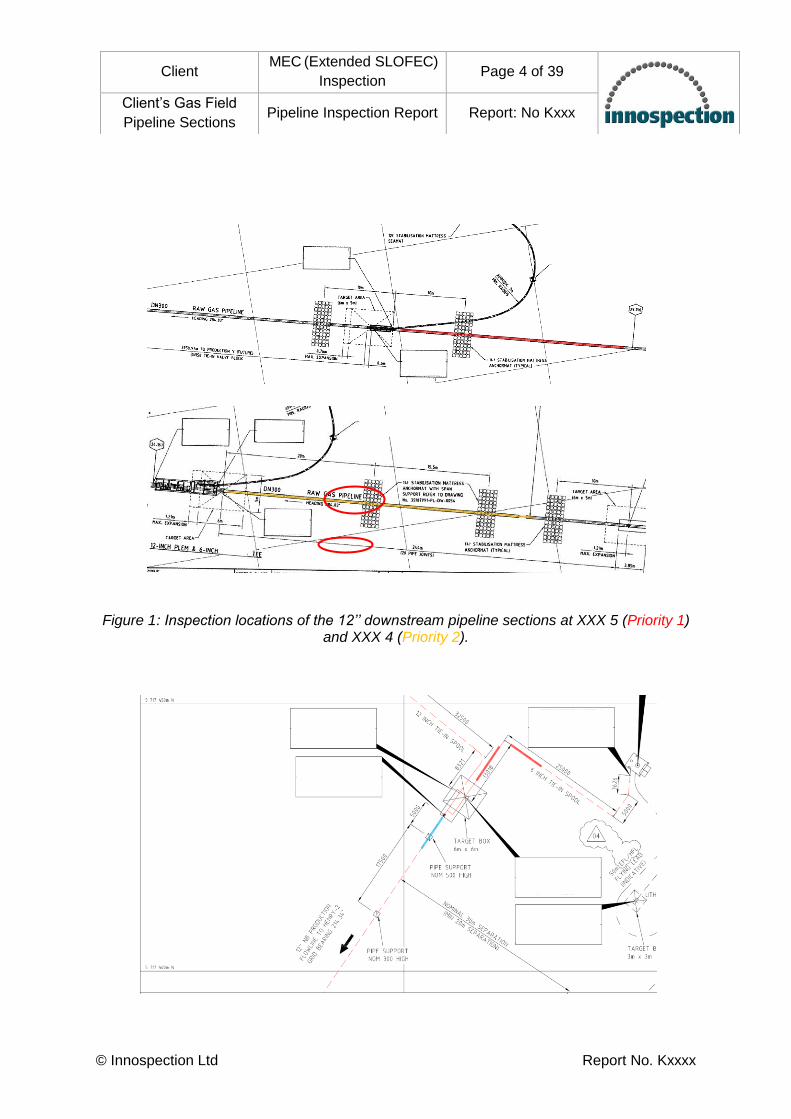
For a detailed view of the inspection locations, see Figs. 1 – 3.
© Innospection Ltd Report No. Kxxxx
Client MEC (Extended SLOFEC)
Inspection Page 4 of 39
Client’s Gas Field
Pipeline Sections Pipeline Inspection Report Report: No Kxxx
Figure 1: Inspection locations of the 12’’ downstream pipeline sections at XXX 5 (Priority 1) and XXX 4 (Priority 2).

© Innospection Ltd Report No. Kxxxx
Client MEC (Extended SLOFEC)
Inspection Page 5 of 39
Client’s Gas Field
Pipeline Sections Pipeline Inspection Report Report: No Kxxx
Figure 2: Inspection locations of the 6’’ (Priority 1) and 12’’ (Priority 3) pipeline sections at ZZZ.
Figure 3: Inspection locations of the 6’’ (Priority 2) and 12’’ (Priority 4) pipeline sections at YYY 2.
2.3. Equipment
The MEC inspection technology was used. For the subsea deployment a suitable tool (
MEC-Combi Crawler) was designed and built. The MEC-Combi Crawler tool has the
following technical parameters:
MEC-Combi Crawler tool: Hydraulically driven crawler to be attached to a
horizontal or vertical pipe from the outside. The
diameter is adjustable. The tool weight is 155 kg in air
and 5 kg in water (adjustable by modular buoyancy). It
has a length of 120 cm, a width of 60 cm and a height
of 40.5 cm.
Sensors: Eight Sensors of type FIT22. The unit covers a
circumferential width of 180 mm.
Scanning Speed: up to 30 m/min or 0.5 m/s
Eddy Current Instrument: -IQ Data System
Software Version: Innospectit Version 2.0
© Innospection Ltd Report No. Kxxxx
Client MEC (Extended SLOFEC)
Inspection Page 6 of 39
Client’s Gas Field
Pipeline Sections Pipeline Inspection Report Report: No Kxxx
For more detailed information on the MEC-Combi Crawler system refer to Section 4.
2.4. Mobilisation and Preparation
Inspection Team
The inspection team was made up of the following people:
L x, Team Leader (Eddy Current PCN Level 2 - xx)
J x, NDT Technician (Eddy Current PCN Level 2 - xx)
M x, Electronic Support Technician
S x, Project Engineer
Mobilisation Dates
The equipment was mobilised on the 19th of April 2012. The inspection crew was mobilised
from 13th of May to 3rd of June 2012. Upfront tests on site have been done on the 18th of May
2012. All tracks have been done from 29th of May 2012 to 1st of June 2012.
Cleaning
The cleaning of the inspected pipeline sections was done by the ROV operator (DOF
Subsea) using a 3-brush system. The cleaning was successful allowing for a smooth
movement of the MEC-Combi Crawler tool over the pipeline surface.
Procedure for Calibration and Set-up
The preparation and inspection of the riser was done according to Innospection’s procedures
- Inno-PSloPIP-001-08 – MEC Inspection Equipment on External Pipe Applications –
Current version
- Ultrasonic Inspection Procedure No. InnoUT-001-10 Current Version
The general test set-up was done prior to mobilisation in the workshop. Calibration pieces
with artificial defects have been tested to allow for classification and sizing of defects. On
site the tool was checked by the same procedure. All sensors have shown appropriate
signals. A sheet of neoprene with a thickness of 3 mm has been used to simulate the coating
of the pipeline. The settings were done accordingly before the tool was launched.
2.5. Execution and Performance
ROV Operation and Scanner Movement
The ROV (TRITON XLX Work Class) has been operated by DOF Subsea. The scanner has
been positioned at the predetermined circumferential position on the pipeline by the ROV.
Afterwards, the hydraulically powered drive unit enabled the scanner to crawl along the
pipeline to carry out the inspection. The scanner moved smoothly on the pipeline with very
little variation in velocity.
© Innospection Ltd Report No. Kxxxx
Client MEC (Extended SLOFEC)
Inspection Page 7 of 39
Client’s Gas Field
Pipeline Sections Pipeline Inspection Report Report: No Kxxx
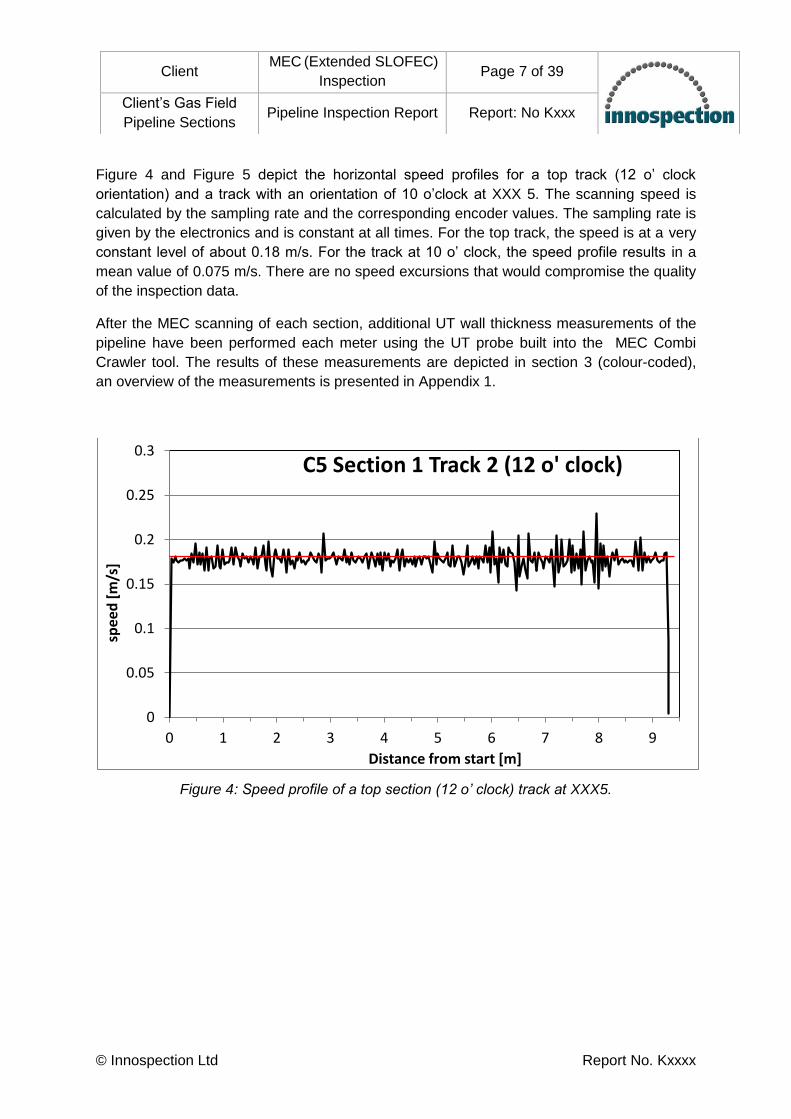
Figure 4 and Figure 5 depict the horizontal speed profiles for a top track (12 o’ clock
orientation) and a track with an orientation of 10 o’clock at XXX 5. The scanning speed is
calculated by the sampling rate and the corresponding encoder values. The sampling rate is
given by the electronics and is constant at all times. For the top track, the speed is at a very
constant level of about 0.18 m/s. For the track at 10 o’ clock, the speed profile results in a
mean value of 0.075 m/s. There are no speed excursions that would compromise the quality
of the inspection data.
After the MEC scanning of each section, additional UT wall thickness measurements of the
pipeline have been performed each meter using the UT probe built into the MEC Combi
Crawler tool. The results of these measurements are depicted in section 3 (colour-coded),
an overview of the measurements is presented in Appendix 1.
Figure 4: Speed profile of a top section (12 o’ clock) track at XXX5.
0
0.05
0.1
0.15
0.2
0.25
0.3
0 1 2 3 4 5 6 7 8 9
spee
d [
m/s
]
Distance from start [m]
C5 Section 1 Track 2 (12 o' clock)

© Innospection Ltd Report No. Kxxxx
Client MEC (Extended SLOFEC)
Inspection Page 8 of 39
Client’s Gas Field
Pipeline Sections Pipeline Inspection Report Report: No Kxxx
Figure 5: Speed profile of a track at XXX 5 with an orientation of 10 o’ clock.
Tracks and Coverage
For all tracks, the datum point is the adjacent edge of the corresponding PLEM. All track
positions given in this document are relative to this datum point.
XXX 5 12’’ Downstream Pipeline Section (+3.5 m to +35 m from datum point)
A total of 9 track runs has been performed at this section. The pipeline section has been
scanned with three tool orientations, resulting in a nearly 180° coverage of the top of the
pipeline. See Table 1 for detailed track parameters.
Position from
datum
Track No.
File No. Distance covered [m]
Orientation UT lowest WT [mm]
comment
+3.5m to +13.5m
1 2012-05-
29_07-59-26 8.8 17.4
weld at 9.5m
2 2012-05-
29_07-38-45 9.3 17.2
weld at 9.5m
3 2012-05-
29_08-10-59 8.4 17.0
weld at 9.5m
0
0.02
0.04
0.06
0.08
0.1
0.12
0.14
0 1 2 3 4 5 6 7 8 9
spee
d [
m/s
]
Distance from start [m]
C5 Section 1 Track 1 (10 o' clock)

© Innospection Ltd Report No. Kxxxx
Client MEC (Extended SLOFEC)
Inspection Page 9 of 39
Client’s Gas Field
Pipeline Sections Pipeline Inspection Report Report: No Kxxx
+13.5m to +25m
4 2012-05-
29_15-03-46 10.6 17.35
weld at 18.5m
5 2012-05-
29_08-27-34 9.5 17.7
weld at 18.5m
6 2012-05-
29_15-40-40 10.1 17.6
weld at 18.5m
+25m to
+35m
7 2012-05-
29_16-01-15 10.4 17.85
weld at 31.9m
8 2012-05-
29_16-15-40 9.4 17.6
weld at 31.9m
9 2012-05-
29_16-32-07 10.1 17.9
weld at 31.9m
Table 1: Overview of track parameters at XXX 5 12’’ downstream pipeline section (+3.5 m to +35 m from datum point)
XXX 4 Downstream Pipeline 12’’ Section (+6 m to +47.5 m from datum point)
A total of 4 track runs has been performed at this section. Only the top track (11 o'clock -
1 o'clock) has been inspected on this entire section. 39.25 metres in total was inspected
over the section length of 41 metres. See Table 2 for detailed track parameters.
Position from
datum
Track No.
File No. Distance covered [m]
Orientation UT lowest WT [mm]
comment
+6m to +12m
1 2012-05-
29_23-27-24 6.9 15.95
+14m to +25.5m
2 2012-05-
30_01-51-10 11.3 17.40
weld at 23.2m
+27.5m to +37.5m
3 2012-05-
30_06-32-04 10.5 17.45
weld at 33.5m
+37.5m to +47.5m
4 2012-05-
30_06-48-02 10.5 17.70
weld at 45.1m
Table 2: Overview of track parameters at XXX 4 12’’ downstream pipeline section (+6 m to +47.5 m from datum point)

© Innospection Ltd Report No. Kxxxx
Client MEC (Extended SLOFEC)
Inspection Page 10 of 39
Client’s Gas Field
Pipeline Sections Pipeline Inspection Report Report: No Kxxx
ZZZ 12’’ Downstream Pipeline Section (+7 m to +16 m from datum point)
A single track run of the top track (11 o'clock - 1 o'clock) has been performed at this section.
See Table 3 for detailed track parameters.
Position from
datum
Track No.
File No. Distance covered [m]
Orientation UT lowest WT [mm]
comment
+7m to +16m
1 2012-05-
30_23-27-22 8.91 17.7
Weld at 11.1m
Table 3: Overview of track parameters at ZZZ 12’’ Downstream Pipeline section (+7m to +16m from datum point).
YYY 2 12’’ Downstream Pipeline Section (+1 m to +11 m from datum point)
A single track run of the top track (11 o'clock - 1 o'clock) has been performed at this section.
The scan has been performed from +11 m on backwards. See Table 4 for detailed track
parameters.
Position from
datum
Track No.
File No. Distance covered [m]
Orientation UT lowest WT [mm]
comment
+1m to +11m
1 2012-06-
01_02-27-23 10.17 17.7
backwards scan
weld at
2.8m
Table 4: Overview of track parameters at YYY 2 12’’ downstream pipeline section P2 (+1 m
to +11 m from datum point)

© Innospection Ltd Report No. Kxxxx
Client MEC (Extended SLOFEC)
Inspection Page 11 of 39
Client’s Gas Field
Pipeline Sections Pipeline Inspection Report Report: No Kxxx
ZZZ 6’’ Tie-in-Spool Section (+6 m to +17 m from datum point)
A total of two track runs has been performed at this section. Only the top track (11 o'clock -
1 o'clock) has been inspected on this entire section. 8.2 metres in total was inspected over
the section length of 11 metres. See table 5 for detailed track parameters. In the region of
the bend, only UT measurements could be performed.
Position from
datum
Track No.
File No. Distance covered [m]
Orientation UT lowest WT [mm]
comment
+6m to +12m
1 2012-05-
31_07-53-01 5.5 10.85
weld at 10.8m
+12m to +13m
11.8 only UT (bend)
+13m to +17m
2 2012-05-
31_08-06-56 2.7 11.05
Table 5: Overview of track parameters at ZZZ 6’’ rigid tie-in-spool pipeline section (+6 m to +17 m from datum point)
YYY 2 6’’ Tie-in-Spool Section (+7 m to +18 m from datum point)
A total of two track runs has been performed at this section. Only the top track (11 o'clock -
1 o'clock) has been inspected on this entire section. 6.9 metres in total was inspected over
the section length of 11 metres. See Table 6 for detailed track parameters. In the region of
the bend, only UT measurements could be performed.
Position from
datum
Track Nr.
File Nr. Distance covered [m]
Orientation UT lowest WT [mm]
comment
+7m to +10m
1 2012-05-
31_12-01-51 2.5 10.85
+10m to +13m
12.3 only UT (bend)
+13m to +18m
2 2012-05-
31_13-07-54 4.3 11.05
weld at 16.9m
Table 6: Overview of track parameters at YYY2 6’’ rigid tie-in-spool pipeline section (+7 m to +18 m from datum point)

© Innospection Ltd Report No. Kxxxx
Client MEC (Extended SLOFEC)
Inspection Page 12 of 39
Client’s Gas Field
Pipeline Sections Pipeline Inspection Report Report: No Kxxx
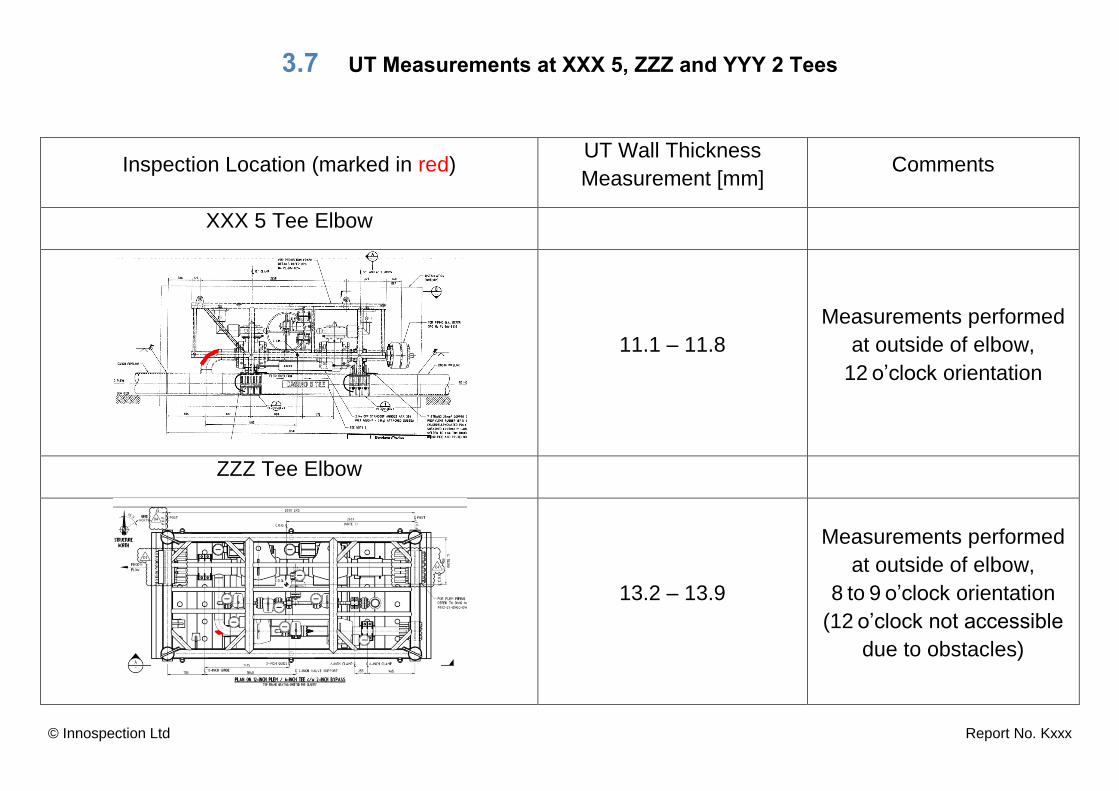
UT measurements with standalone probe at elbow of Tees
Additional wall thickness measurements have been performed at the elbows of XXX 5, ZZZ
and YYY 2 Tees using a standalone, ROV-mounted UT probe (Cygnus M5-ROV-048-M). A
custom bracket with adjustable contact pressure has been designed for the UT sensor to be
handled by the ROV manipulator. See Figure 6 for a detailed view of the tool. Wall thickness
measurements have been performed at XXX 5 and YYY 2 outside of the tee elbows at the
12 o’clock position, as well as at ZZZ at the 8 – 9 o’clock position of the elbow.
At ZZZ tee, the inspection couldn’t be performed at the 12 o’clock position due to obstacles
caused by the PLEM structure and sacrificial anode. See section 3.7 for inspection locations
and results of the performed measurements. At the time of inspection, no values of the
corresponding nominal wall thicknesses of the elbows have been available.
Figure 6: ROV-mountable UT probe with adjustable contact pressure.
Pipeline
Handle
Cushioning
UT Sensor
RS485
Connection

© Innospection Ltd Report No. Kxxxx
Client MEC (Extended SLOFEC)
Inspection Page 13 of 39
Client’s Gas Field
Pipeline Sections Pipeline Inspection Report Report: No Kxxx
Video Surveillance
The forward facing camera on the MEC-Combi Crawler tool worked at all times and has
been used for orientation and documentation purposes. It also turned out to be useful to
ensure a symmetrical cleaning of the pipeline.
Data Quality
The switching of the magnet worked without any problems. Also, the distance encoder
worked at all times. The starting distances for the tracks were given by the ROV crew.
The overall signal quality is definitively good for the specified probability of detection for
defects and complete data analysis.

© Innospection Ltd Report No. Kxxxx
Client MEC (Extended SLOFEC)
Inspection Page 14 of 39
Client’s Gas Field
Pipeline Sections Pipeline Inspection Report Report: No Kxxx
3. Results
3.1. XXX 5 12’’ Downstream Pipeline Section (Priority 1)
3.2. XXX 4 12’’ Downstream Pipeline Section (Priority 2)
3.3. ZZZ 12’’ Downstream Pipeline Section (Priority 3)
3.4. YYY 2 12’’ Downstream Pipeline Section (Priority 4)
3.5. ZZZ 6’’ Tie-in-Spool (Priority 1)
3.6. YYY 2 6’’ Tie-in-Spool (Priority 2)
3.7. UT Measurements at XXX 5, ZZZ and YYY 2 Tee Elbows
© Innospection Ltd Report No. Kxxx
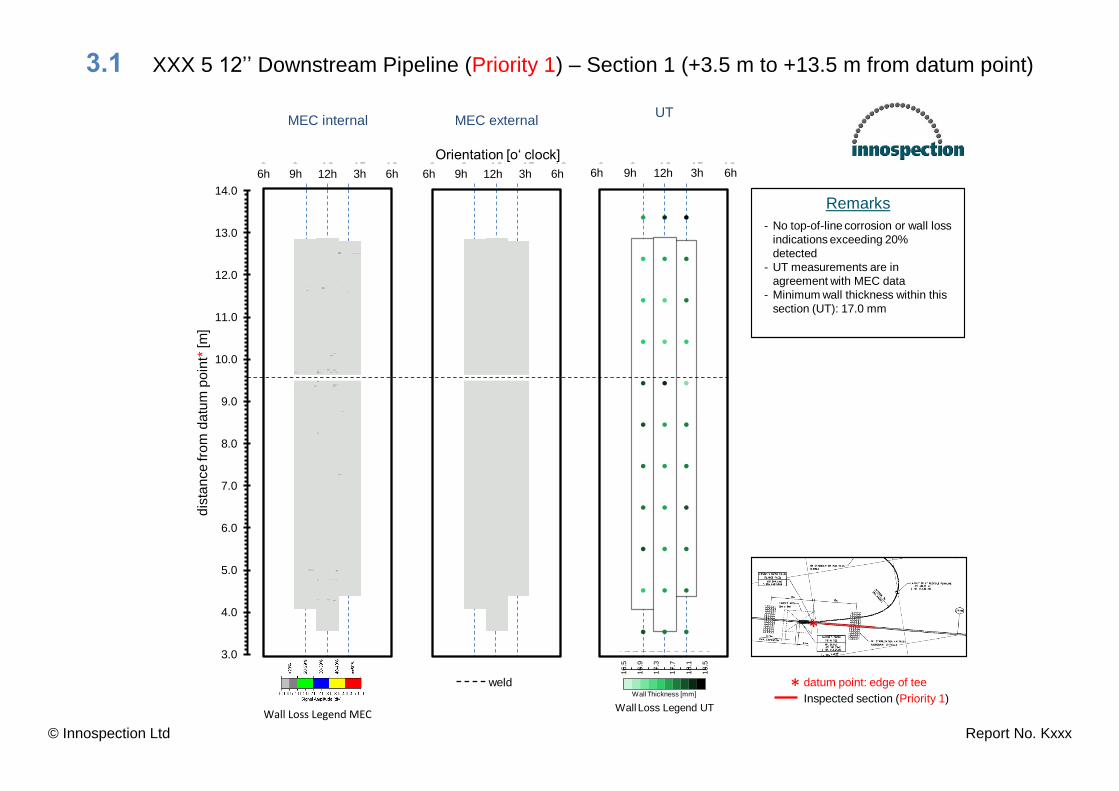
3.1 XXX 5 12’’ Downstream Pipeline (Priority 1) – Section 1 (+3.5 m to +13.5 m from datum point)
1717171717181818181819
16
.5
18
.5
16
.9
17
.3
17
.7
18
.1Wall Thickness [mm]
3h6h 9h 12h 6h
MEC internal MEC externalUT
3.0
4.0
5.0
6.0
7.0
8.0
9.0
10.0
11.0
12.0
13.0
14.0
6 9 12 15 18
weld
6 9 12 15 18 6 9 12 15 183h6h 9h 12h 6h 3h6h 9h 12h 6h 3h6h 9h 12h 6h
Wall Loss Legend SLOFEC
Orientation [o‘ clock]
dis
tan
ce
fro
m d
atu
m p
oin
t*[m
]
*
Wall Loss Legend UT
datum point: edge of tee*Inspected section (Priority 1)
Remarks
- No top-of-line corrosion or wall loss
indications exceeding 20%
detected
- UT measurements are in
agreement with MEC data
- Minimum wall thickness within this
section (UT): 17.0 mm
Wall Loss Legend MEC

© Innospection Ltd Report No. Kxxx
XXX 5 12’’ Downstream Pipeline (Priority 1) – Section 2 (+13.5 m to +25 m from datum point)
1717171717181818181819
16
.5
18
.5
16
.9
17
.3
17
.7
18
.1Wall Thickness [mm]
3h6h 9h 12h 6h
MEC internal MEC externalUT
13.0
14.0
15.0
16.0
17.0
18.0
19.0
20.0
21.0
22.0
23.0
24.0
25.0
6 9 12 15 18 6 9 12 15 18 6 9 12 15 183h6h 9h 12h 6h 3h6h 9h 12h 6h 3h6h 9h 12h 6h
Wall Loss Legend MEC
Orientation [o‘ clock]
dis
tan
ce
fro
m d
atu
m p
oin
t*[m
]
*
Wall Loss Legend UT
datum point: edge of tee*weld
Inspected section (Priority 1)
Remarks
- No top-of-line corrosion or wall loss
indications exceeding 20%
detected
- UT measurements are in
agreement with MEC data
- Minimum wall thickness within this
section (UT): 17.3 mm
Wall Loss Legend MEC

© Innospection Ltd Report No. Kxxx
XXX 5 12’’ Downstream Pipeline (Priority 1) – Section 3 (+25 m to +35 m from datum point)
1717171717181818181819
16
.5
18
.5
16
.9
17
.3
17
.7
18
.1Wall Thickness [mm]
3h6h 9h 12h 6h
MEC internal MEC externalUT
24.0
25.0
26.0
27.0
28.0
29.0
30.0
31.0
32.0
33.0
34.0
35.0
36.0
6 9 12 15 18 6 9 12 15 18 6 9 12 15 183h6h 9h 12h 6h 3h6h 9h 12h 6h 3h6h 9h 12h 6h
Wall Loss Legend MEC
Orientation [o‘ clock]
dis
tan
ce
fro
m d
atu
m p
oin
t*[m
]
*
Wall Loss Legend UT
datum point: edge of tee*weld
Inspected section (Priority 1)
Remarks
- No top-of-line corrosion or wall loss
indications exceeding 20%
detected
- UT measurements are in
agreement with MEC data
- Minimum wall thickness within this
section (UT): 17.6 mm
© Innospection Ltd Report No. Kxxx
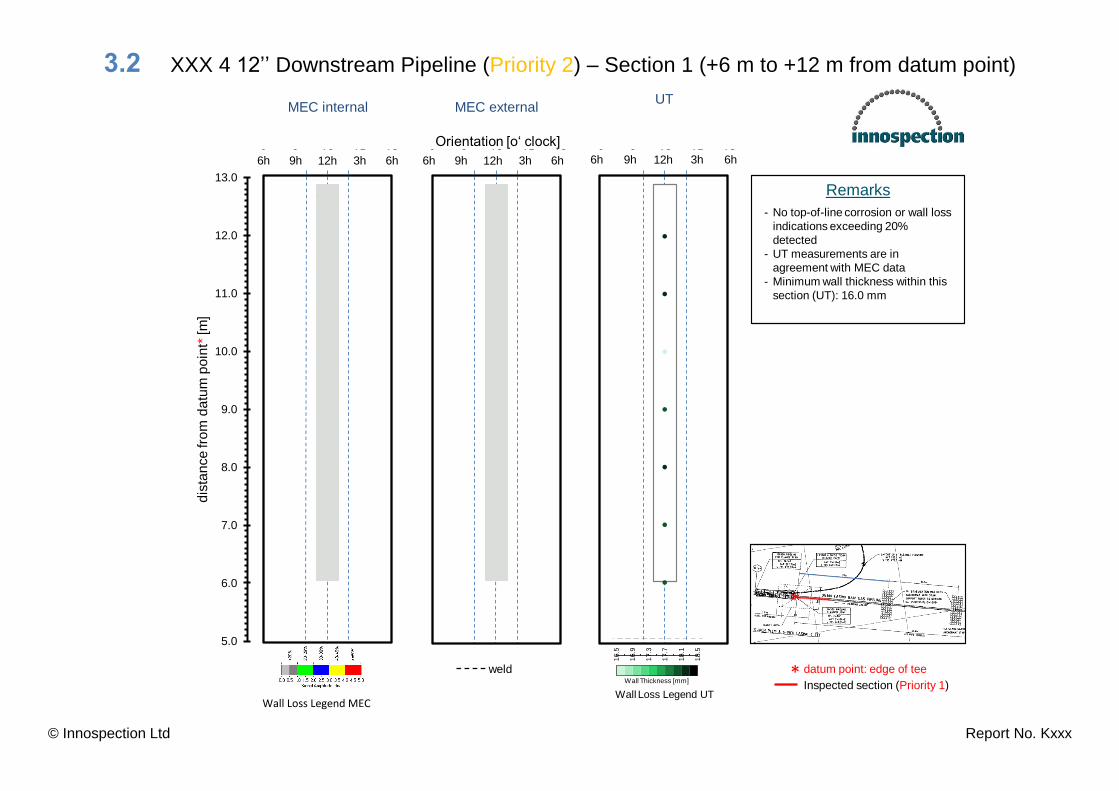
3.2 XXX 4 12’’ Downstream Pipeline (Priority 2) – Section 1 (+6 m to +12 m from datum point)
1717171717181818181819
16
.5
18
.5
16
.9
17
.3
17
.7
18
.1Wall Thickness [mm]
3h6h 9h 12h 6h
MEC internal MEC externalUT
5.0
6.0
7.0
8.0
9.0
10.0
11.0
12.0
13.0
6 9 12 15 18 6 9 12 15 18 6 9 12 15 183h6h 9h 12h 6h 3h6h 9h 12h 6h 3h6h 9h 12h 6h
Wall Loss Legend SLOFEC
Orientation [o‘ clock]
dis
tan
ce
fro
m d
atu
m p
oin
t*[m
]
*
Wall Loss Legend UT
datum point: edge of tee*weld
Inspected section (Priority 1)
Remarks
- No top-of-line corrosion or wall loss
indications exceeding 20%
detected
- UT measurements are in
agreement with MEC data
- Minimum wall thickness within this
section (UT): 16.0 mm
Wall Loss Legend MEC

© Innospection Ltd Report No. Kxxx
XXX 4 12’’ Downstream Pipeline (Priority 2) – Section 2 (+14 m to +25.5 m from datum point)
1717171717181818181819
16
.5
18
.5
16
.9
17
.3
17
.7
18
.1Wall Thickness [mm]
3h6h 9h 12h 6h
MEC internal MEC externalUT
13.0
14.0
15.0
16.0
17.0
18.0
19.0
20.0
21.0
22.0
23.0
24.0
25.0
26.0
6 9 12 15 18 6 9 12 15 18 6 9 12 15 183h6h 9h 12h 6h 3h6h 9h 12h 6h 3h6h 9h 12h 6h
Wall Loss Legend SLOFEC
Orientation [o‘ clock]
dis
tan
ce
fro
m d
atu
m p
oin
t*[m
]
*
Wall Loss Legend UT
datum point: edge of tee*weld
Inspected section (Priority 1)
Remarks
- No top-of-line corrosion or wall loss
indications exceeding 20%
detected
- UT measurements are in
agreement with MEC data
- Minimum wall thickness within this
section (UT): 17.4 mm
Wall Loss Legend MEC
© Innospection Ltd Report No. Kxxx
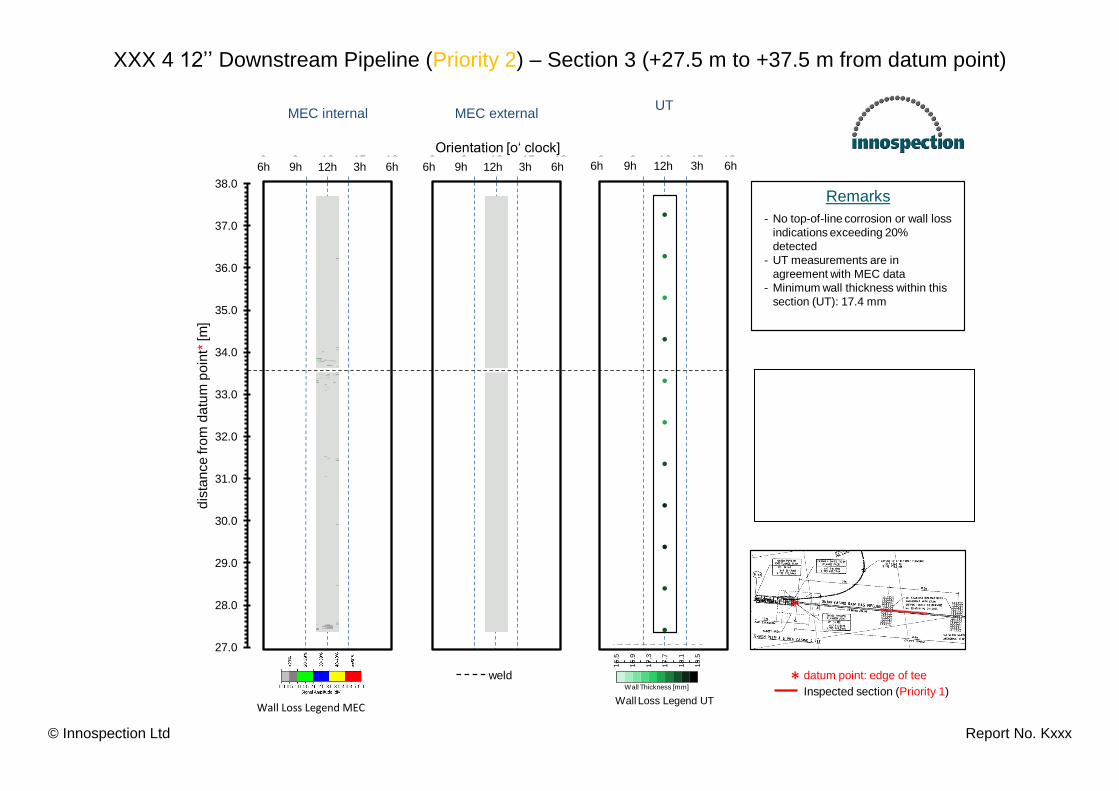
XXX 4 12’’ Downstream Pipeline (Priority 2) – Section 3 (+27.5 m to +37.5 m from datum point)
1717171717181818181819
16
.5
18
.5
16
.9
17
.3
17
.7
18
.1Wall Thickness [mm]
3h6h 9h 12h 6h
MEC internal MEC externalUT
27.0
28.0
29.0
30.0
31.0
32.0
33.0
34.0
35.0
36.0
37.0
38.0
6 9 12 15 18 6 9 12 15 18 6 9 12 15 183h6h 9h 12h 6h 3h6h 9h 12h 6h 3h6h 9h 12h 6h
Wall Loss Legend SLOFEC
Orientation [o‘ clock]
dis
tan
ce
fro
m d
atu
m p
oin
t*[m
]
*
Wall Loss Legend UT
datum point: edge of tee*weld
Inspected section (Priority 1)
Remarks
- No top-of-line corrosion or wall loss
indications exceeding 20%
detected
- UT measurements are in
agreement with MEC data
- Minimum wall thickness within this
section (UT): 17.4 mm
Wall Loss Legend MEC
© Innospection Ltd Report No. Kxxx
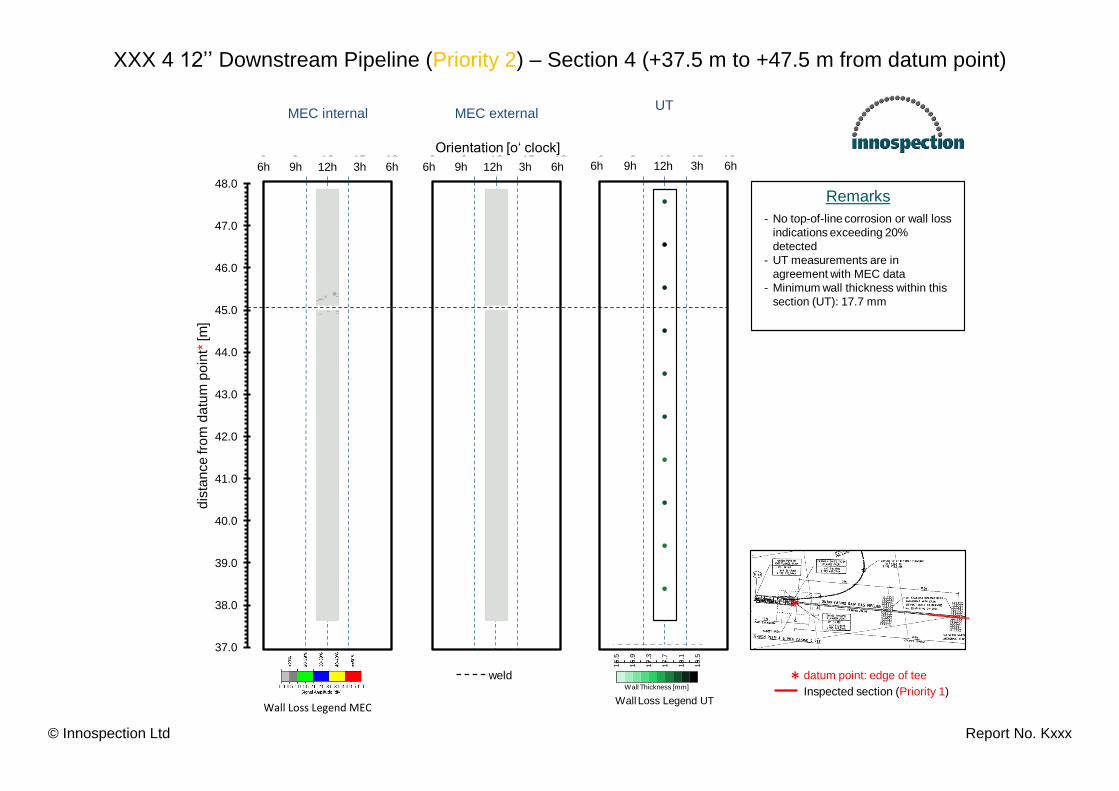
XXX 4 12’’ Downstream Pipeline (Priority 2) – Section 4 (+37.5 m to +47.5 m from datum point)
1717171717181818181819
16
.5
18
.5
16
.9
17
.3
17
.7
18
.1Wall Thickness [mm]
3h6h 9h 12h 6h
MEC internal MEC externalUT
37.0
38.0
39.0
40.0
41.0
42.0
43.0
44.0
45.0
46.0
47.0
48.0
6 9 12 15 18 6 9 12 15 18 6 9 12 15 183h6h 9h 12h 6h 3h6h 9h 12h 6h 3h6h 9h 12h 6h
Wall Loss Legend SLOFEC
Orientation [o‘ clock]
dis
tan
ce
fro
m d
atu
m p
oin
t*[m
]
*
Wall Loss Legend UT
datum point: edge of tee*weld
Inspected section (Priority 1)
Remarks
- No top-of-line corrosion or wall loss
indications exceeding 20%
detected
- UT measurements are in
agreement with MEC data
- Minimum wall thickness within this
section (UT): 17.7 mm
Wall Loss Legend MEC

© Innospection Ltd Report No. Kxxx
3.3 ZZZ 12’’ Downstream Pipeline (Priority 3) – Section 1 (+7 m to +16 m from datum point)
1717171717181818181819
16
.5
18
.5
16
.9
17
.3
17
.7
18
.1
Wall Thickness [mm]
3h6h 9h 12h 6h
MEC internal MEC externalUT
0.0
1.0
2.0
3.0
4.0
5.0
6.0
7.0
8.0
9.0
10.0
11.0
12.0
6 9 12 15 18 6 9 12 15 18 6 9 12 15 183h6h 9h 12h 6h 3h6h 9h 12h 6h 3h6h 9h 12h 6h
Wall Loss Legend SLOFEC
Orientation [o‘ clock]
dis
tan
ce
fro
m d
atu
m p
oin
t*[m
]
Wall Loss Legend UT
datum point: edge of tee*weld
Inspected section (Priority 4)
*
Remarks
- No top-of-line corrosion or wall loss
indications exceeding 20%
detected
- UT measurements are in
agreement with MEC data
- Minimum wall thickness within this
section (UT): 17.7 mm
Wall Loss Legend MEC
© Innospection Ltd Report No. Kxxx
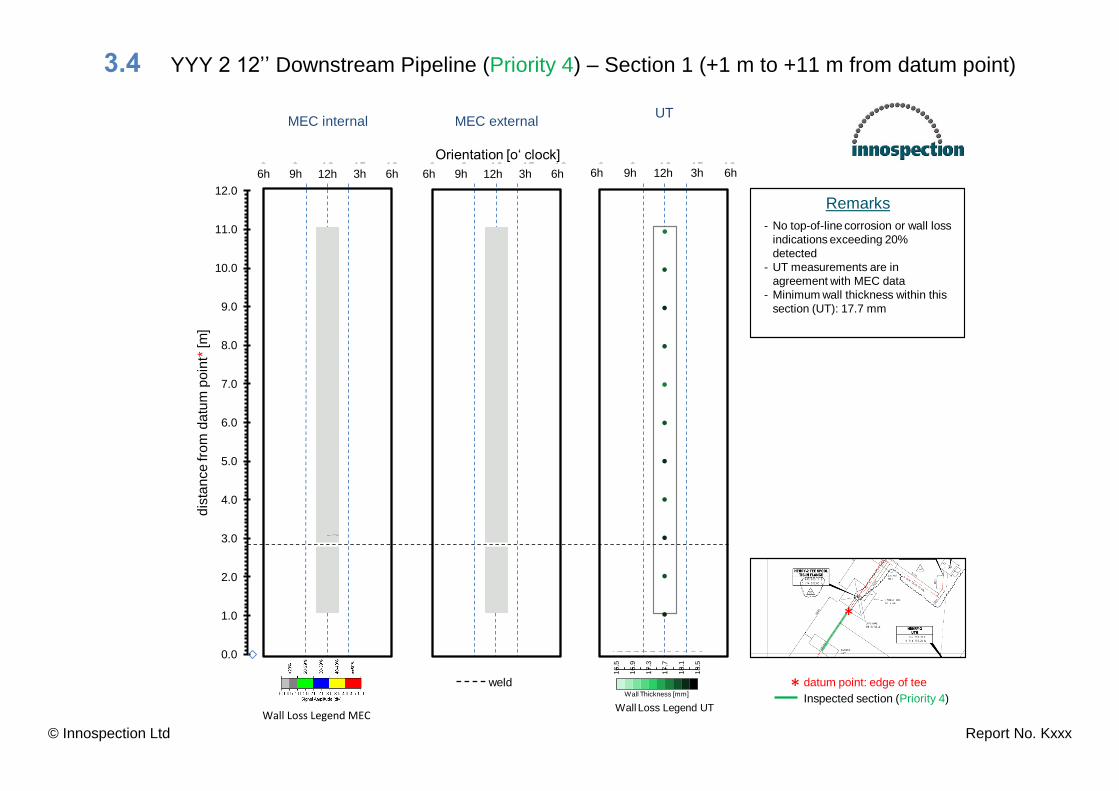
3.4 YYY 2 12’’ Downstream Pipeline (Priority 4) – Section 1 (+1 m to +11 m from datum point)
1717171717181818181819
16
.5
18
.5
16
.9
17
.3
17
.7
18
.1
Wall Thickness [mm]
3h6h 9h 12h 6h
MEC internal MEC externalUT
0.0
1.0
2.0
3.0
4.0
5.0
6.0
7.0
8.0
9.0
10.0
11.0
12.0
6 9 12 15 18 6 9 12 15 18 6 9 12 15 183h6h 9h 12h 6h 3h6h 9h 12h 6h 3h6h 9h 12h 6h
Wall Loss Legend SLOFEC
Orientation [o‘ clock]
dis
tan
ce
fro
m d
atu
m p
oin
t*[m
]
Wall Loss Legend UT
datum point: edge of tee*weld
Inspected section (Priority 4)
*
Remarks
- No top-of-line corrosion or wall loss
indications exceeding 20%
detected
- UT measurements are in
agreement with MEC data
- Minimum wall thickness within this
section (UT): 17.7 mm
Wall Loss Legend MEC
© Innospection Ltd Report No. Kxxx
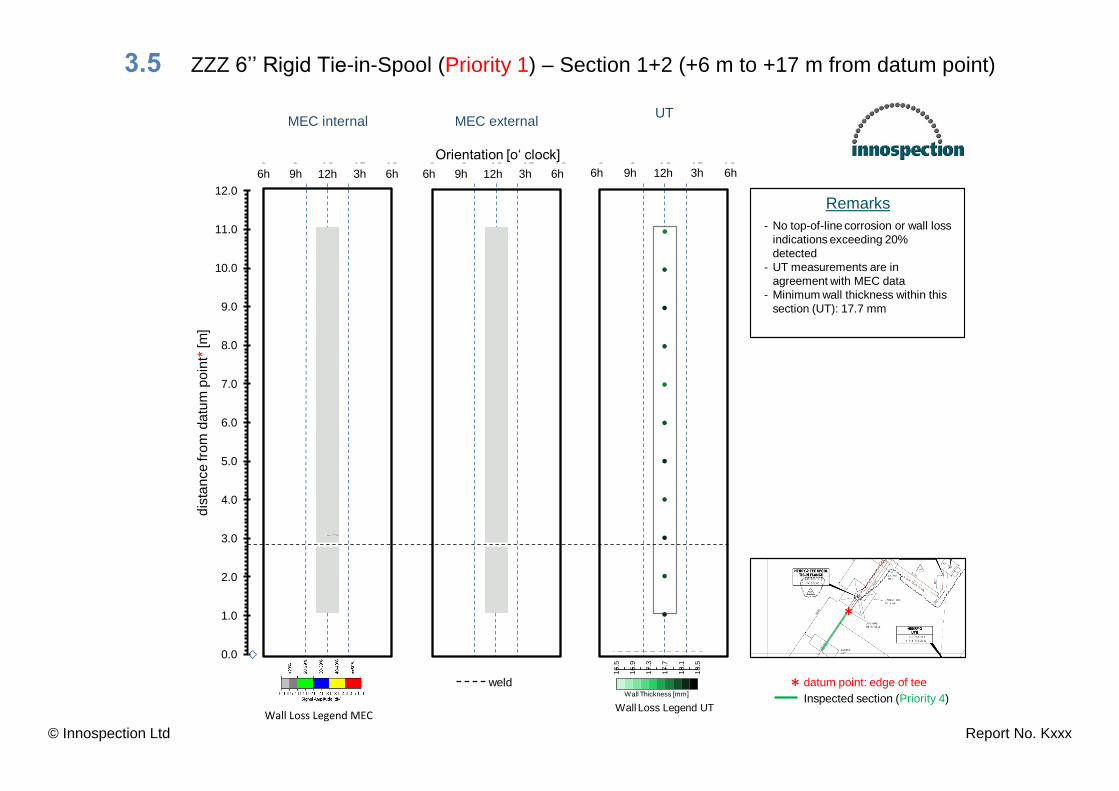
3.5 ZZZ 6’’ Rigid Tie-in-Spool (Priority 1) – Section 1+2 (+6 m to +17 m from datum point)
1717171717181818181819
16
.5
18
.5
16
.9
17
.3
17
.7
18
.1
Wall Thickness [mm]
3h6h 9h 12h 6h
MEC internal MEC externalUT
0.0
1.0
2.0
3.0
4.0
5.0
6.0
7.0
8.0
9.0
10.0
11.0
12.0
6 9 12 15 18 6 9 12 15 18 6 9 12 15 183h6h 9h 12h 6h 3h6h 9h 12h 6h 3h6h 9h 12h 6h
Wall Loss Legend SLOFEC
Orientation [o‘ clock]
dis
tan
ce
fro
m d
atu
m p
oin
t*[m
]
Wall Loss Legend UT
datum point: edge of tee*weld
Inspected section (Priority 4)
*
Remarks
- No top-of-line corrosion or wall loss
indications exceeding 20%
detected
- UT measurements are in
agreement with MEC data
- Minimum wall thickness within this
section (UT): 17.7 mm
Wall Loss Legend MEC

© Innospection Ltd Report No. Kxxx
3.6 YYY 2 6’’ Rigid Tie-in-Spool (Priority 2) – Section 1+2 (+7 m to +18 m from datum point)
1717171717181818181819
10
.0
12
.0
10
.4
10
.8
11
.2
11
.6
Wall Thickness [mm]
3h6h 9h 12h 6h
MEC internal MEC externalUT
6.0
7.0
8.0
9.0
10.0
11.0
12.0
13.0
14.0
15.0
16.0
17.0
18.0
19.0
6 9 12 15 18 6 9 12 15 18 6 9 12 15 189h6h 3h 12h 6h 9h6h 3h 12h 6h 9h6h 3h 12h 6h
Wall Loss Legend SLOFEC
Orientation [o‘ clock]
dis
tan
ce
fro
m d
atu
m p
oin
t*[m
]
Wall Loss Legend UT
datum point: edge of tee*weld
Inspected section (Priority 2)
*
Bend
1
2
3
Ind
ica
tion
s
Remarks
- 3 indications close to 20% wall loss
detected at 7.45m, 7.55m and
8.7m relative to datum point.
- UT measurements are in
agreement with MEC data
- Minimum wall thickness within this
section (UT): 10.8 mm
Dire
ctio
n o
f Flo
wWall Loss Legend MEC
© Innospection Ltd Report No. Kxxx
3.7 UT Measurements at XXX 5, ZZZ and YYY 2 Tees
Inspection Location (marked in red) UT Wall Thickness
Measurement [mm] Comments
XXX 5 Tee Elbow
11.1 – 11.8
Measurements performed
at outside of elbow,
12 o’clock orientation
ZZZ Tee Elbow
13.2 – 13.9
Measurements performed
at outside of elbow,
8 to 9 o’clock orientation
(12 o’clock not accessible
due to obstacles)

© Innospection Ltd Report No. Kxxx
3.7 UT Measurements at XXX5, ZZZ and YYY 2 Tees
Inspection Location UT reading of Wall
Thickness [mm] Comments
YYY 2 Tee Elbow
13.9 – 15.0
Measurements performed
at outside of elbow,
12 o’clock position
© Innospection Ltd Report No. Kxxx
Client MEC (Extended SLOFEC)
Inspection Page 28 of 39
Client’s Gas Field
Pipeline Sections Pipeline Inspection Report Report: No xxx
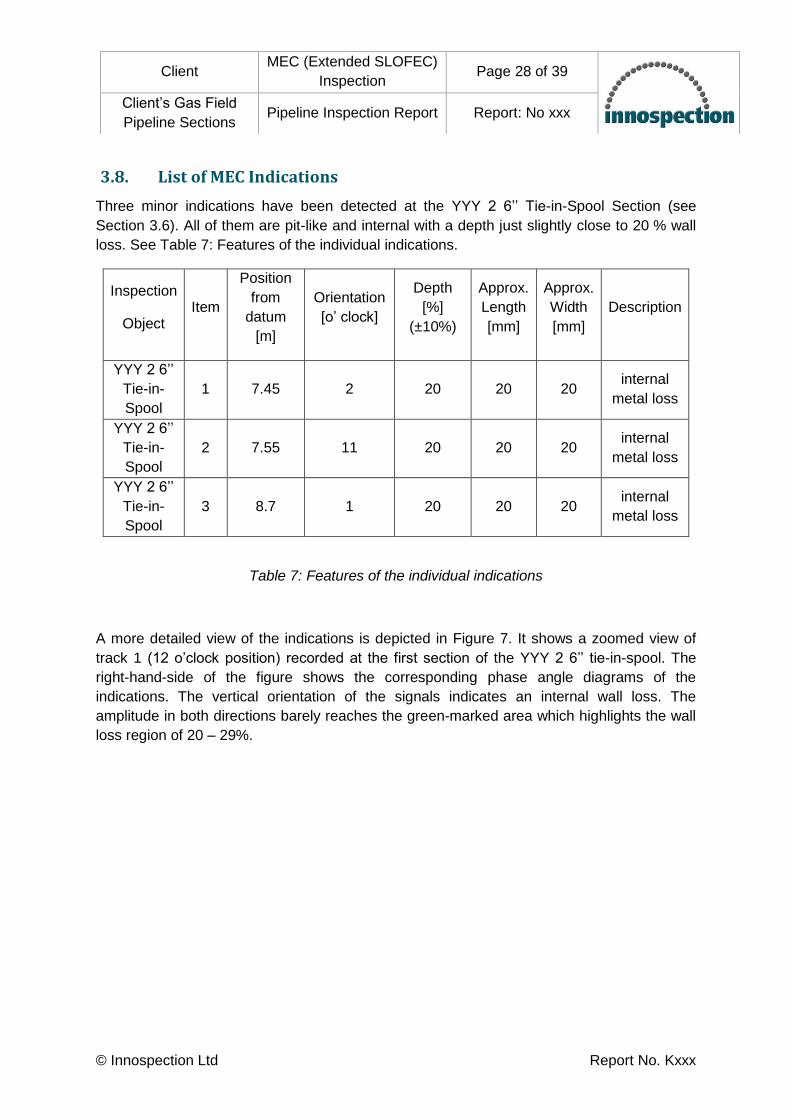
3.8. List of MEC Indications
Three minor indications have been detected at the YYY 2 6’’ Tie-in-Spool Section (see
Section 3.6). All of them are pit-like and internal with a depth just slightly close to 20 % wall
loss. See Table 7: Features of the individual indications.
Inspection
Object Item
Position
from
datum
[m]
Orientation
[o’ clock]
Depth
[%]
(±10%)
Approx.
Length
[mm]
Approx.
Width
[mm]
Description
YYY 2 6’’
Tie-in-
Spool
1 7.45 2 20 20 20 internal
metal loss
YYY 2 6’’
Tie-in-
Spool
2 7.55 11 20 20 20 internal
metal loss
YYY 2 6’’
Tie-in-
Spool
3 8.7 1 20 20 20 internal
metal loss
Table 7: Features of the individual indications
A more detailed view of the indications is depicted in Figure 7. It shows a zoomed view of
track 1 (12 o’clock position) recorded at the first section of the YYY 2 6’’ tie-in-spool. The
right-hand-side of the figure shows the corresponding phase angle diagrams of the
indications. The vertical orientation of the signals indicates an internal wall loss. The
amplitude in both directions barely reaches the green-marked area which highlights the wall
loss region of 20 – 29%.

© Innospection Ltd Report No. Kxxx
Client MEC (Extended SLOFEC)
Inspection Page 29 of 39
Client’s Gas Field
Pipeline Sections Pipeline Inspection Report Report: No xxx
Figure 7: Detailed view of the positions and phase angles of the indications 1-3 detected at the YYY 2 tie-in-spool.
7.3
7.4
7.5
7.6
7.7
7.8
7.9
8.0
8.1
8.2
8.3
8.4
8.5
8.6
8.7
dis
tance
fro
m d
atu
m [
m]
12
3
12 o‘ clock2 10

© Innospection Ltd Report No. Kxxx
Client MEC (Extended SLOFEC)
Inspection Page 30 of 39
Client’s Gas Field
Pipeline Sections Pipeline Inspection Report Report: No xxx
3.9. Conclusion
Three MEC-related indications have been found within the scanned areas of the individual
pipelines. All of them are located at the first section of the YYY 2 6’’ rigid Tie-in-Spool. They
are isolated and only seen on a single sensor at the internal scan, giving a size estimate of
about 20 x 20 mm. The depth of the indications is close to 20% of wall loss.
Due to their small size and depth, the indications can be classified as minor.
The spot-like UT wall thickness measurements performed with the UT probe integrated into
the MEC Combi Crawler tool are in agreement with the MEC measurements. The maximum
wall loss reading obtained with the UT tool is 12%, measured on a single spot at the top
track of the XXX 4 12’’ downstream pipeline in a distance of 10 m from the datum point.
Top-of-the-Line corrosion, characterised by a chain of deep pitting concentrated near the
12 o’clock position, has not been detected.

© Innospection Ltd Report No. Kxxx
Client MEC (Extended SLOFEC)
Inspection Page 31 of 39
Client’s Gas Field
Pipeline Sections Pipeline Inspection Report Report: No xxx
4. Technical Details of the Instrumentation
4.1. Description of the MEC (Extended SLOFEC) Technology
Standard eddy current instrumentation is only sensitive to the surface of a metallic material.
Even this can be quite a benefit for the inspection of flexible riser pipe. However,
modifications of the standard eddy current technologies allow for the inspection of deeper
structures. At Innospection magnetically biased eddy current has been found to be a
versatile method for the inspection of ferritic steel structures. The technology is also known
under the trade name of SLOFEC. The SLOFEC technology has been further developed into
the MEC (Magnetic Eddy Current) technique.
Specifically developed Eddy Current sensors able to generate a higher density Eddy Current
field for the increased defect detection sensitivity are used on the ferromagnetic material and
to magnetise the section of ferritic steel components at the same time. The magnetisation
has several effects. It changes the permeability of the material. Hence, the penetration depth
increases. At the same time changes in permeability due to different flux distribution become
visible. With these effects also defects embedded in the material can be picked-up with eddy
current sensors. The principle is shown below.
Figure 8: Principle of Eddy current measurement
© Innospection Ltd Report No. Kxxx
Client MEC (Extended SLOFEC)
Inspection Page 32 of 39
Client’s Gas Field
Pipeline Sections Pipeline Inspection Report Report: No xxx
The principle of measurement is related to MFL-measurement, but the set-up works at lower
magnetisation levels. Since only moderate levels of magnetisation are required, the method
works to higher wall thickness pipe, or through several millimetres of coating thickness.
Obviously one difference to MFL is that the level of magnetisation should be adjusted. In
contrast in MFL the magnetisation level should always be as high as possible.
4.2. Equipment Calibration
For external corrosion detection, the differential mode was used. The frequency setting used
for channel 1-8 (differential mode) was 70 kHz.
The amplitude of the signals was set so that the artificial reference defect (Ø 25mm 60%
depth) was set to 5 screen divisions. This is only classed as the initial pre-calibration setup
and may then be further adjusted when the first true indication is detected and evaluated for
depth, this by utilising the ultrasonic pulse echo technique.
Optimum signal/noise ratio and signal phase separation between the internal defect
indications and other indications were considered when selecting a suitable test frequency.
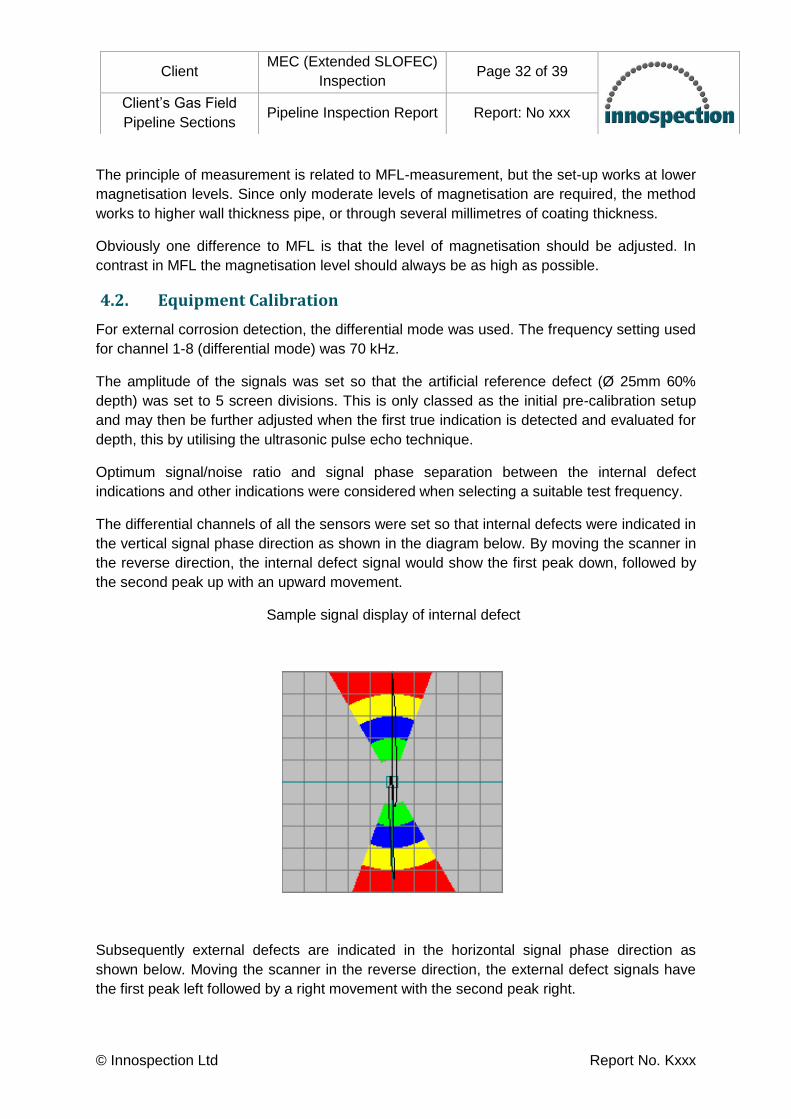
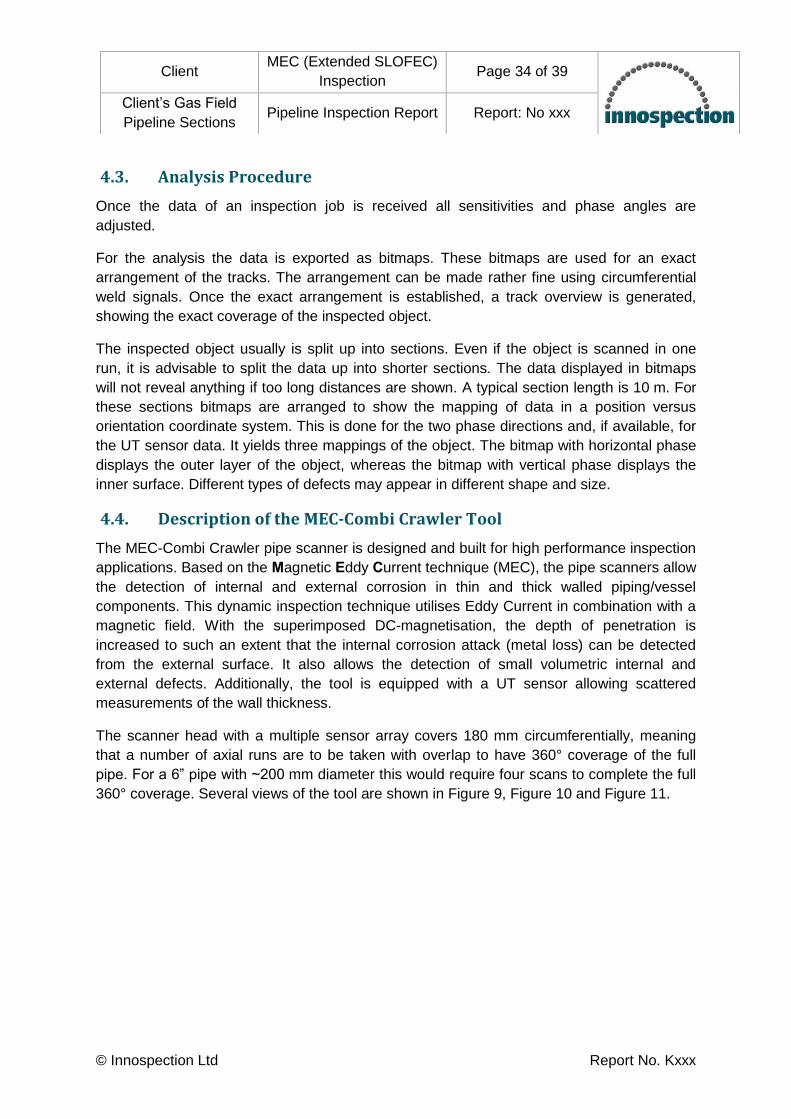
The differential channels of all the sensors were set so that internal defects were indicated in
the vertical signal phase direction as shown in the diagram below. By moving the scanner in
the reverse direction, the internal defect signal would show the first peak down, followed by
the second peak up with an upward movement.
Sample signal display of internal defect
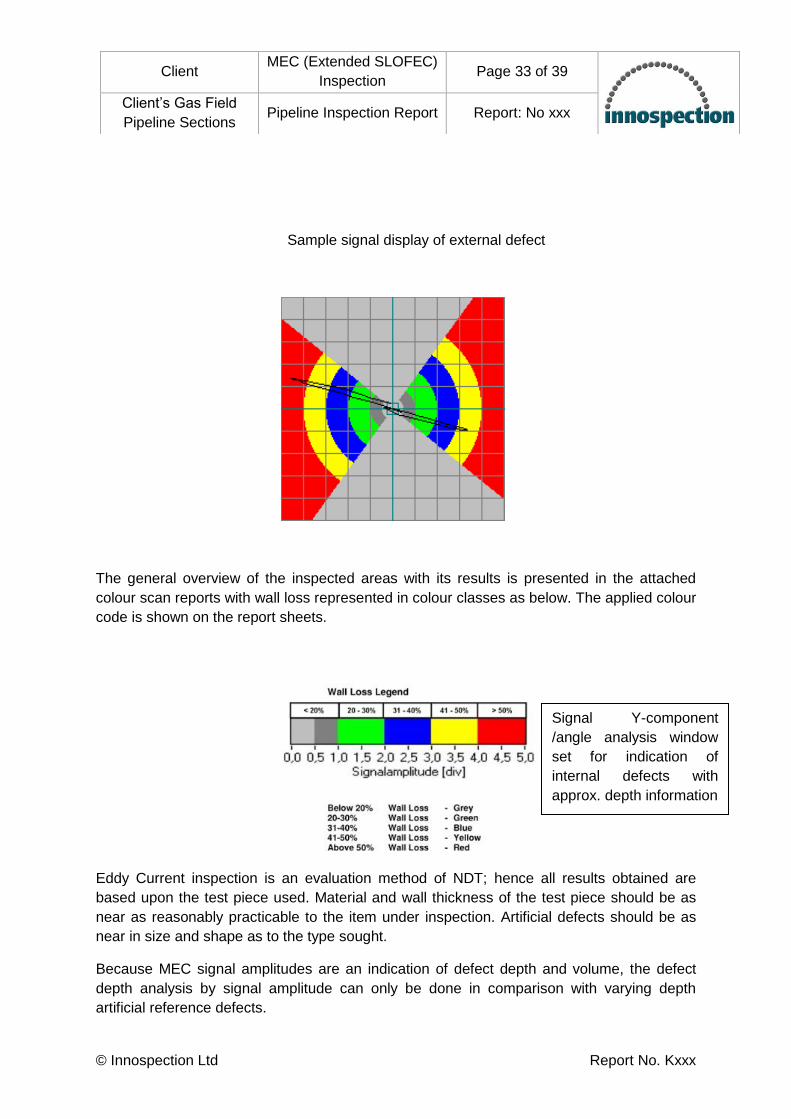
Subsequently external defects are indicated in the horizontal signal phase direction as
shown below. Moving the scanner in the reverse direction, the external defect signals have
the first peak left followed by a right movement with the second peak right.
© Innospection Ltd Report No. Kxxx
Client MEC (Extended SLOFEC)
Inspection Page 33 of 39
Client’s Gas Field
Pipeline Sections Pipeline Inspection Report Report: No xxx
Sample signal display of external defect
The general overview of the inspected areas with its results is presented in the attached
colour scan reports with wall loss represented in colour classes as below. The applied colour
code is shown on the report sheets.
Eddy Current inspection is an evaluation method of NDT; hence all results obtained are
based upon the test piece used. Material and wall thickness of the test piece should be as
near as reasonably practicable to the item under inspection. Artificial defects should be as
near in size and shape as to the type sought.
Because MEC signal amplitudes are an indication of defect depth and volume, the defect
depth analysis by signal amplitude can only be done in comparison with varying depth
artificial reference defects.
Signal Y-component
/angle analysis window
set for indication of
internal defects with
approx. depth information
© Innospection Ltd Report No. Kxxx
Client MEC (Extended SLOFEC)
Inspection Page 34 of 39
Client’s Gas Field
Pipeline Sections Pipeline Inspection Report Report: No xxx
4.3. Analysis Procedure
Once the data of an inspection job is received all sensitivities and phase angles are
adjusted.
For the analysis the data is exported as bitmaps. These bitmaps are used for an exact
arrangement of the tracks. The arrangement can be made rather fine using circumferential
weld signals. Once the exact arrangement is established, a track overview is generated,
showing the exact coverage of the inspected object.
The inspected object usually is split up into sections. Even if the object is scanned in one
run, it is advisable to split the data up into shorter sections. The data displayed in bitmaps
will not reveal anything if too long distances are shown. A typical section length is 10 m. For
these sections bitmaps are arranged to show the mapping of data in a position versus
orientation coordinate system. This is done for the two phase directions and, if available, for
the UT sensor data. It yields three mappings of the object. The bitmap with horizontal phase
displays the outer layer of the object, whereas the bitmap with vertical phase displays the
inner surface. Different types of defects may appear in different shape and size.
4.4. Description of the MEC-Combi Crawler Tool
The MEC-Combi Crawler pipe scanner is designed and built for high performance inspection
applications. Based on the Magnetic Eddy Current technique (MEC), the pipe scanners allow
the detection of internal and external corrosion in thin and thick walled piping/vessel
components. This dynamic inspection technique utilises Eddy Current in combination with a
magnetic field. With the superimposed DC-magnetisation, the depth of penetration is
increased to such an extent that the internal corrosion attack (metal loss) can be detected
from the external surface. It also allows the detection of small volumetric internal and
external defects. Additionally, the tool is equipped with a UT sensor allowing scattered
measurements of the wall thickness.
The scanner head with a multiple sensor array covers 180 mm circumferentially, meaning
that a number of axial runs are to be taken with overlap to have 360° coverage of the full
pipe. For a 6” pipe with ~200 mm diameter this would require four scans to complete the full
360° coverage. Several views of the tool are shown in Figure 9, Figure 10 and Figure 11.
© Innospection Ltd Report No. Kxxx
Client MEC (Extended SLOFEC)
Inspection Page 35 of 39
Client’s Gas Field
Pipeline Sections Pipeline Inspection Report Report: No xxx
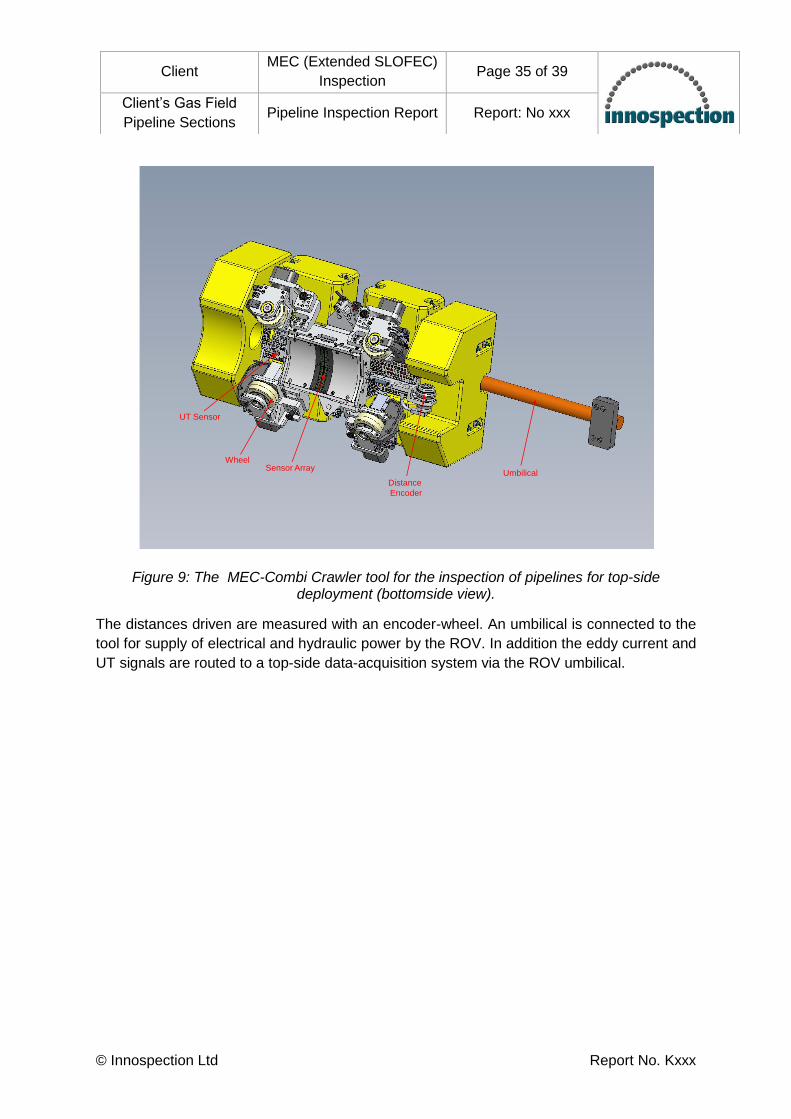
Figure 9: The MEC-Combi Crawler tool for the inspection of pipelines for top-side deployment (bottomside view).
The distances driven are measured with an encoder-wheel. An umbilical is connected to the
tool for supply of electrical and hydraulic power by the ROV. In addition the eddy current and
UT signals are routed to a top-side data-acquisition system via the ROV umbilical.
Sensor ArrayWheel
Distance
Encoder
Umbilical
UT Sensor
© Innospection Ltd Report No. Kxxx
Client MEC (Extended SLOFEC)
Inspection Page 36 of 39
Client’s Gas Field
Pipeline Sections Pipeline Inspection Report Report: No xxx
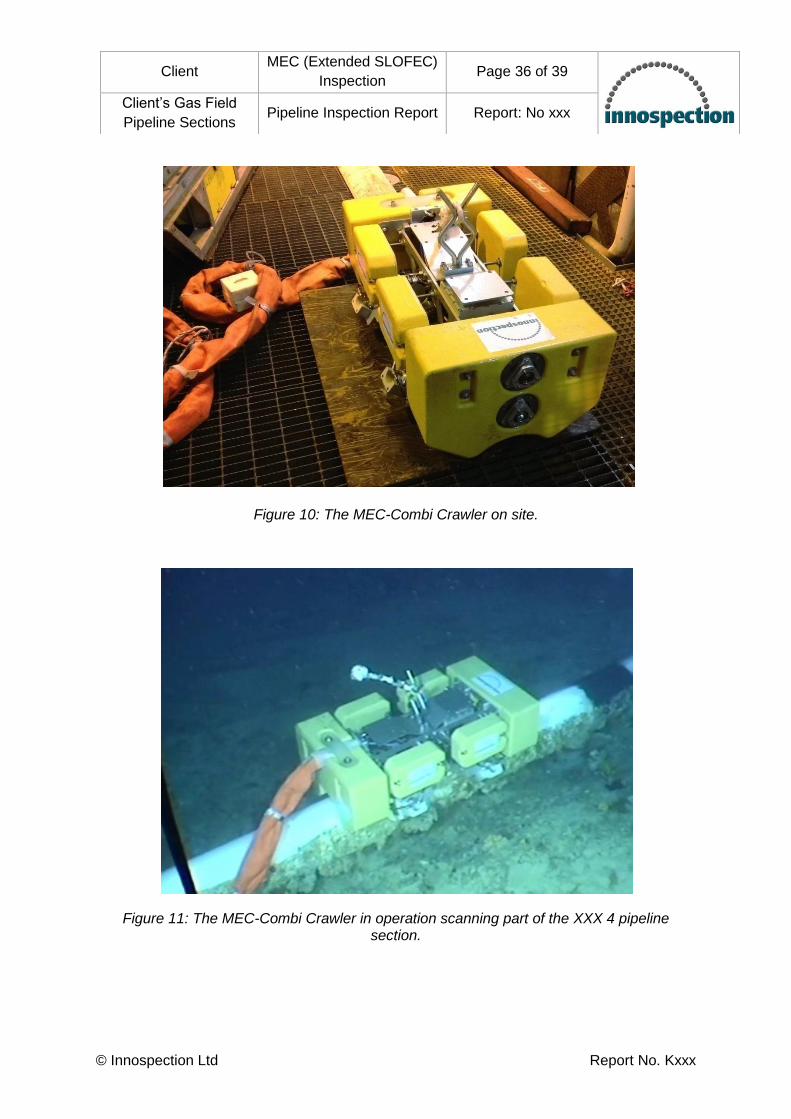
Figure 10: The MEC-Combi Crawler on site.
Figure 11: The MEC-Combi Crawler in operation scanning part of the XXX 4 pipeline section.
© Innospection Ltd Report No. Kxxx
Client MEC (Extended SLOFEC)
Inspection Page 37 of 39
Client’s Gas Field
Pipeline Sections Pipeline Inspection Report Report: No xxx
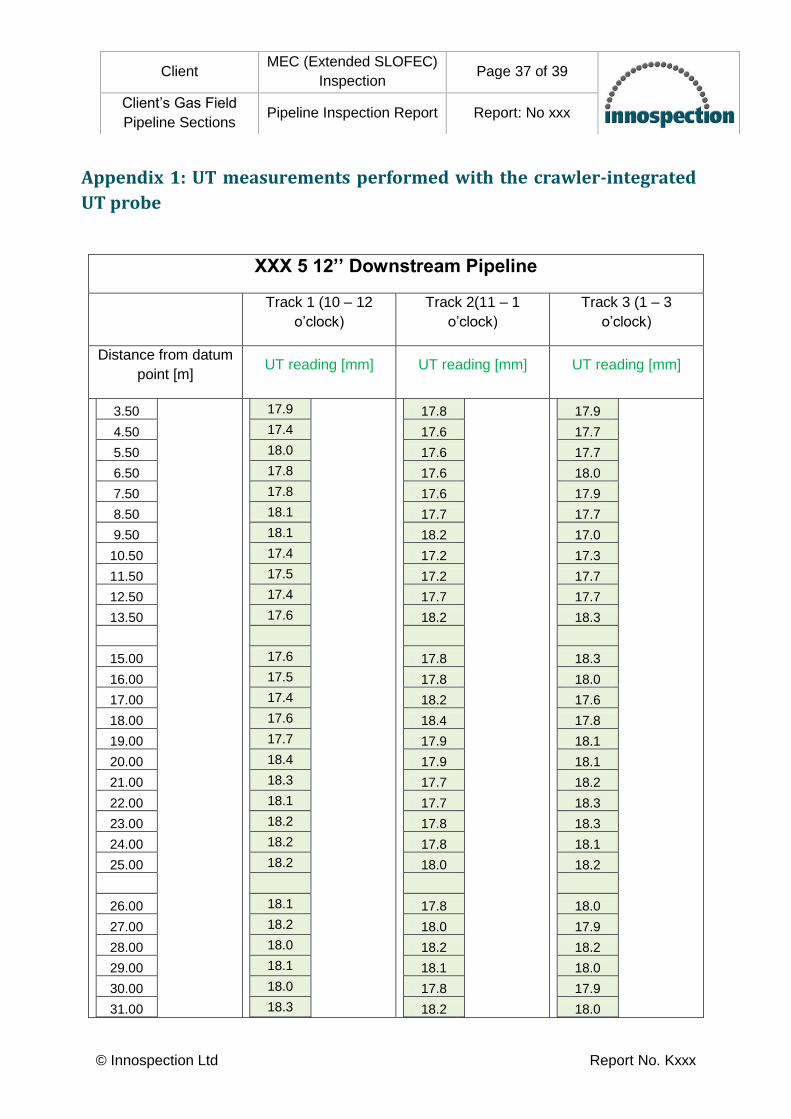
Appendix 1: UT measurements performed with the crawler-integrated
UT probe
XXX 5 12’’ Downstream Pipeline
Track 1 (10 – 12
o’clock)
Track 2(11 – 1
o’clock)
Track 3 (1 – 3
o’clock)
Distance from datum
point [m] UT reading [mm] UT reading [mm] UT reading [mm]
3.50
4.50
5.50
6.50
7.50
8.50
9.50
10.50
11.50
12.50
13.50
15.00
16.00
17.00
18.00
19.00
20.00
21.00
22.00
23.00
24.00
25.00
26.00
27.00
28.00
29.00
30.00
31.00
17.9
17.4
18.0
17.8
17.8
18.1
18.1
17.4
17.5
17.4
17.6
17.6
17.5
17.4
17.6
17.7
18.4
18.3
18.1
18.2
18.2
18.2
18.1
18.2
18.0
18.1
18.0
18.3
17.8
17.6
17.6
17.6
17.6
17.7
18.2
17.2
17.2
17.7
18.2
17.8
17.8
18.2
18.4
17.9
17.9
17.7
17.7
17.8
17.8
18.0
17.8
18.0
18.2
18.1
17.8
18.2
17.9
17.7
17.7
18.0
17.9
17.7
17.0
17.3
17.7
17.7
18.3
18.3
18.0
17.6
17.8
18.1
18.1
18.2
18.3
18.3
18.1
18.2
18.0
17.9
18.2
18.0
17.9
18.0

© Innospection Ltd Report No. Kxxx
Client MEC (Extended SLOFEC)
Inspection Page 38 of 39
Client’s Gas Field
Pipeline Sections Pipeline Inspection Report Report: No xxx
32.00
33.00
34.00
35.00
17.9
18.0
18.2
18.3
17.6
18.2
18.0
17.8
18.2
18.1
18.0
18.0
XXX 4 12’’ Downstream Pipeline
Track 2 (11 – 1 o’clock)
Distance from datum
point [m] UT reading [mm]
Distance from datum
point [m] UT reading [mm]
6.00
7.00
8.00
9.00
10.00
11.00
12.00
14.00
15.00
16.00
17.00
18.00
19.00
20.00
21.00
22.00
23.00
24.00
25.00
17.9
18.1
18.2
17.9
16.0
18.2
18.2
17.8
17.9
18.1
17.3
17.6
17.4
17.6
18.2
18.2
17.9
18.1
18.1
27.50
28.50
29.50
30.50
31.50
32.50
33.50
34.50
35.50
36.50
37.50
38.50
39.50
40.50
41.50
42.50
43.50
44.50
45.50
46.50
47.50
18.0
18.0
18.2
18.1
18.0
17.6
17.5
18.0
17.6
17.8
17.9
17.7
17.7
17.9
17.8
17.9
18.0
18.2
18.2
18.5
17.9

© Innospection Ltd Report No. Kxxx
Client MEC (Extended SLOFEC)
Inspection Page 39 of 39
Client’s Gas Field
Pipeline Sections Pipeline Inspection Report Report: No xxx
ZZZ 12’’ Downstream Pipeline YYY 2 12’’ Downstream Pipeline
Track 2 (11 – 11
o’clock)
Track 2 (11 – 1
o’clock)
Distance from datum
point [m] UT reading [mm]
Distance from datum
point [m] UT reading [mm]
7.00
8.00
9.00
10.00
11.00
12.00
13.00
14.00
15.00
16.00
18.2
18.2
18.2
18.0
18.2
18.1
18.0
17.7
17.7
17.7
1.00
2.00
3.00
4.00
5.00
6.00
7.00
8.00
9.00
10.00
11.00
18.2
18.0
18.1
18.1
18.2
18.0
17.8
18.0
18.2
18.0
17.7
ZZZ 6’’ Rigid Tie-in-Spool YYY 2 6’’ Rigid Tie-in-Spool
Track 2 (11 – 11
o’clock)
Track 2 (11 – 1
o’clock)
Distance from datum
point [m] UT reading [mm]
Distance from datum
point [m] UT reading [mm]
6.00
7.00
8.00
9.00
10.00
11.00
12.00
13.00
14.00
15.00
16.00
17.00
11.1
11.0
10.9
11.1
11.0
11.0
11.0
11.1
11.1
11.1
11.1
11.2
7.00
8.00
9.00
10.00
13.00
14.00
15.00
16.00
17.00
18.00
11.2
11.1
11.3
10.9
11.3
11.4
11.4
11.4
11.4
11.1