measuring national innovation systems efficiency – a review of dea approach
TRANSCRIPT
Maxim Kotsemir
MEASURING NATIONAL INNOVATION SYSTEMS
EFFICIENCY – A REVIEW OF DEA APPROACH
BASIC RESEARCH PROGRAM
WORKING PAPERS
SERIES: SCIENCE, TECHNOLOGY AND INNOVATION WP BRP 16/STI/2013
This Working Paper is an output of a research project implemented
at the National Research University Higher School of Economics (HSE). Any opinions or claims contained
in this Working Paper do not necessarily reflect the views of HSE.
Maxim N. Kotsemir1
MEASURING NATIONAL INNOVATION SYSTEMS
EFFICIENCY – A REVIEW OF DEA APPROACH
The paper reviews the application of the data envelopment analysis (DEA) method for measuring
the efficiency of national innovation systems (NIS). The paper firstly visualizes the logic of DEA
method and briefly summarizes the key advantages and main limitations of the DEA method.
Further, this paper provides a comprehensive review of 11 empirical studies on cross-country
analysis of NIS efficiency with DEA technique. In its main part the paper analyses the
specifications of DEA models used in the reviewed studies, the content of the country samples,
sets of input and output variables used and the resulting lists of efficient countries.
The review detects general trends and differences in the sets of variables and the content of
country samples. Moreover, this paper highlights the problem of “small countries bias” in the
reviewed studies: situation when “small” (in terms of national innovation system scope and the
level of development) countries (like Venezuela, Kyrgyzstan etc.) are included in the country
sample, these “small” countries become the efficient ones.
In general, empirical studies on cross-country analysis of national innovation systems efficiency
using DEA method pay little attention to profound analysis of previous relevant studies.
Therefore, this paper is among the first papers with deep review of such empirical studies.
JEL Classification: C44, C61, P49, P51, P52, Q55.
Keywords: data envelopment analysis, DEA, national innovation systems, national innovation
system efficiency, economic review, efficiency analysis, review of empirical studies.
1 National Research University Higher School of Economics, Institute for Statistical Studies and Economics
of Knowledge, Research Laboratory for Science and Technology Studies, Junior Research Fellow. E-mail:

3
Introduction
Analysis of economic efficiency is in general based on the frontier techniques. Michael J.
Farrell was the pioneer here [Farrell, 1951]. Farrell was the first who decomposed the overall
efficiency of the production unit on two components:
Technical efficiency
Allocative efficiency.
Koopmans (1951), (with formal definition of efficiency), and Debreu (1951), (with measure
of technical efficiency) seriously influenced on Farrell [Murillo-Zamorano, 2004]. Further
different methods of frontier analysis were developed. All frontier methods can be splitted into
two big groups: parametric and non-parametric methods. Non-parametric methods accurately
calculate the scores of efficiency on the basis on empirical (in form of piecewise envelop)
efficiency frontier built on observed object s of analysis. Parametric methods stochastically
estimate the efficiency scores. In parametric methods, the user has to a priori set the functional
form of transformation resource (inputs) into results (outputs).
Deep historical analysis of theoretical developments in frontier methods was proposed in
Murillo-Zamorano (2004). Hjalmarsson, Kumbhakar and Heshmati (1996) propose a profound
overview of key methods of frontier analysis: data envelopment analysis (DEA), deterministic
frontier approach (DFA) and stochastic frontier approach (SFA). Comprehensive review of
application of parametric and non-parametric frontier techniques to in analysis the efficiency of
R&D systems can be found in Bonaccorsi and Daraio (2004).
The key non-parametric method of frontier analysis is data envelopment analysis (DEA)
approach developed by Charnes, Cooper and Rhodes (1978). Data envelopment analysis
technique uses method of mathematical programming for building the efficiency frontier on the
observed data and for further calculation of efficiency scores for the built efficiency frontier. The
main parametric method of frontier analysis the method of stochastic frontier analysis (approach)
(SFA), developed by Aigner, Lovell and Schmidt (1977).
Data envelopment analysis (DEA) method is the main nonparametric frontier method for
efficiency analysis. Data envelopment analysis method was proposed by Charnes, Cooper and
Rhodes (1978). This first classical DEA model is known under the “CCR DEA model” or “CRS
CCR input-oriented DEA model” name. CRS means “constant return on scale” while CCR
means first letters of “Charnes”, “Cooper” and “Rhodes” surnames. In the classical DEA model
returns on scale are constant; the line that reflects the functional form of combinations of input
and output variable is convex and finally all objects of analysis (decision making units) work
under strong disposability (fully use their resources).

4
Data Envelopment Analysis concept
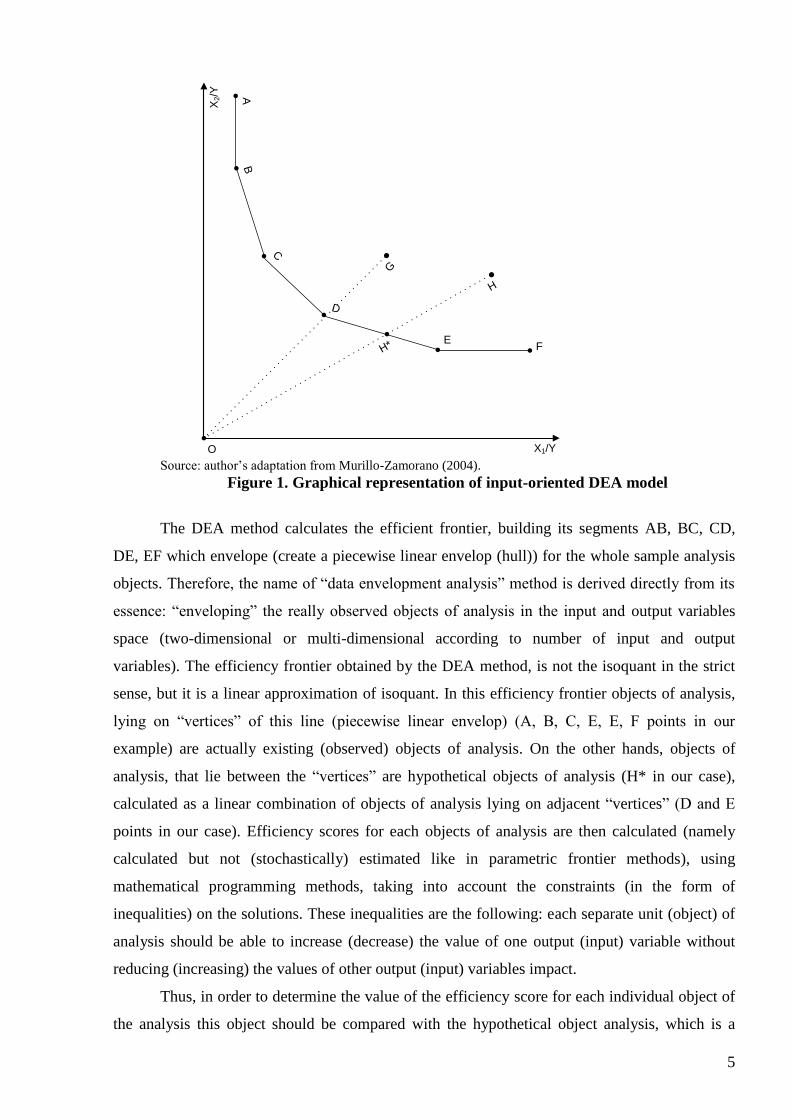
The logic of DEA method can be explained by the following simple example (Figure 1,
adapted from Murillo-Zamorano (2004)). First consider eight objects of analysis (firms, farms,
banks or any other “production units”), (A, B, C, D, E, F, G, H) which produce only one type of
product (Y), and use the resources of the two types: X1 and X2 (Figure 1). The line passing
through the points A, B, C, D, E and F is the boundary unit isoquant obtained by the DEA in the
analysis of a sample of six objects of the analysis, which use a combination of two different
types of resources (X1 and X2), to produce a single type of product (Y). Inefficiency of each
object is determined by analysis by comparing it with a reference (control, target) object of
analysis or a convex combination of reference (control, target) objects of analysis that lie on the
boundary isoquant and use the same combination of resources that the monitoring and analysis
object.
Technical efficiency, for “H” object of analysis is given by H* OH*/OH, where H* -
linear combination of analysis objects “D” and “E”, which are a set of reference (control, target)
objects of analysis (peer group) for the object “H”, and use the resources of X1 and X2 in the
same proportions as the analysis object “H”, since the points H and H* lie on same ray.
Efficiency score for the object “G” can be estimated as the ratio of the OD to the OG (OD/OG).
“D” object of analysis is the only one reference object of analysis for the “G” object of analysis,
since the point C lies on the efficient isoquant and on the same ray as the point F lies. It should
also be noted that in the example illustrated in Figure 1 “A” and “F” objects of analysis that lies
on the efficiency frontier, cannot be called the efficient object of analysis in terms of Pareto-
efficiency. “F” object of analysis uses the same amount of “X2” resource, as the object “E”, but
higher volume of “X1” resource to produce the same (as the object of analysis “E”) the amount
of product “Y”. Similarly, “A” object of analysis uses the same amount of “X1” resource, as the
object “B”, but higher volume of “X2” resource to produce the same (as the object of analysis
“B”) the amount of product “Y”. This is a technical feature of DEA models: objects of analysis
located on the vertical (like object “A”) and horizontal (like object “F”) segments of the efficient
frontier (in the form of a unit isoquant in the example in Figure 1) will be treated as efficient
objects, but they will not be efficient in terms of Pareto-efficiency. To resolve this problem, we
should assume for DEA model the presence of excess resources and the “production” of
insufficient performance variables (slacks). DEA model with slack-based measure of efficiency
was proposed in Färe, Grosskopf and Lovell (1994) and further developed by Tone (2001).
5
X2/Y
X1/Y
B
C
D
EF
G
H
H*
O
A
Source: author’s adaptation from Murillo-Zamorano (2004).
Figure 1. Graphical representation of input-oriented DEA model
The DEA method calculates the efficient frontier, building its segments AB, BC, CD,
DE, EF which envelope (create a piecewise linear envelop (hull)) for the whole sample analysis
objects. Therefore, the name of “data envelopment analysis” method is derived directly from its
essence: “enveloping” the really observed objects of analysis in the input and output variables
space (two-dimensional or multi-dimensional according to number of input and output
variables). The efficiency frontier obtained by the DEA method, is not the isoquant in the strict
sense, but it is a linear approximation of isoquant. In this efficiency frontier objects of analysis,
lying on “vertices” of this line (piecewise linear envelop) (A, B, C, E, E, F points in our
example) are actually existing (observed) objects of analysis. On the other hands, objects of
analysis, that lie between the “vertices” are hypothetical objects of analysis (H* in our case),
calculated as a linear combination of objects of analysis lying on adjacent “vertices” (D and E
points in our case). Efficiency scores for each objects of analysis are then calculated (namely
calculated but not (stochastically) estimated like in parametric frontier methods), using
mathematical programming methods, taking into account the constraints (in the form of
inequalities) on the solutions. These inequalities are the following: each separate unit (object) of
analysis should be able to increase (decrease) the value of one output (input) variable without
reducing (increasing) the values of other output (input) variables impact.
Thus, in order to determine the value of the efficiency score for each individual object of
the analysis this object should be compared with the hypothetical object analysis, which is a

6
linear combination of a set of observed reference (control, target) objects of analysis. It should be
noted that DEA method allows taking into consideration any object of analysis: organizations
(academic, financial, industrial, medical, and educational, etc.), sectors of the economy, the
economy of the country region or the country as a whole.
During the following 30 years, many theoretical developments of the initial CCR model
were proposed. Profound and comprehensive analysis of theoretical DEA models during last
decades can be found in Cook and Seiford (2009). These models propose developments in the
following dimensions of DEA methodology:
Dimensions of input and output variables;
Strategies of decision making units, DMUs (objects of analysis);
Approaches to DMUs grouping and clustering.
The key advantages and disadvantages of DEA method are summarized in Table 1.
Table 1: Advantages and disadvantages of data envelopment analysis method Advantages Disadvantages
DEA efficiency scores for each DMU can be seen as integral measure
of their performance
No need of predetermined offsetting of the functional form of
transformation of resources (input variables) into results (output
variables).
Weights for input and output variables are formulated within the model
without their a priori setting
DEA method allows to include several output variables into model,
Input and output variables can be expressed in different units
In DEA models user can take into account external factors (in form of
environmental variables)
DEA method evaluates changes in input and output variables needed for
reaching the efficiency frontier
DEA method can be used for forecasting the efficiency scores of DMUs
DEA efficiency scores can be strongly
biased by the statistical noise and
outlier DMUs.
DEA efficiency scores can be
seriously influenced by the content of
the DMU sample (when adding each
new object of analysis, it is necessary
to recalculate the entire system)
DEA efficiency scores by DEA can’t
be cleared from statistical noise.
Small sample size and overly large set
of input and output variables seriously
bias the efficiency scores.
Source: based on the analysis of Cooper, Seiford and Tone (2006).
Data envelopment analysis method has been widely used in different cross-country
studies on measuring the efficiency of national innovation systems (NIS). Meanwhile, analysis
of the this literature on cross-country analysis of efficiency of national innovation systems with
data envelopment analysis (DEA) technique shows that these empirical papers do not pay
attention to deep analysis of previous related studies. Therefore, this paper can be viewed as one
of the first attempt to do comprehensive overview of empirical papers on cross-country analysis
of efficiency of national innovations systems using DEA technique. The general motivation of
this work is twofold:
1. To catch some general trends in papers with cross-country DEA analysis of the
efficiency national innovation systems;

7
2. To highlight the following phenomenon: the “content” of country samples and
sets of output variables in DEA method can seriously change the result of
analysis. Moreover, inclusion “small” (in terms of national innovation system
scope and its level development) countries in the studied sample can lead to
appearance of these “small” countries (like Kyrgyzstan, Venezuela, Malta, etc.) in
the group of efficient countries.

8
Empirical papers on cross-country analysis of national innovation
system efficiency with DEA method: detailed description
This section provides the detailed description of 11 empirical papers on cross-country
analysis of national innovation systems’ efficiency using data envelopment analysis method.
Table 2 provides general information about all reviewed papers
Table 2: Basic bibliographical info about 11 reviewed studies.
Authors and the year of
publication
Paper title Place of publication
Rousseau S., Rousseau R. (1997) Data Envelopment Analysis as a Tool for
Constructing Scientometric Indicators Scientometrics
Nasierowski W., Arcelus F.J.
(2003)
On the Efficiency of National Innovation
Systems Socio-Economic Planning Sciences
Hollanders H., Esser F.C. (2007) Measuring Innovation Efficiency INNO-Metrics Thematic Paper
Sharma S., Thomas V.J. (2008) Inter-Country R&D Efficiency Analysis:
An Application of Data Envelopment
Analysis
Scientometrics
Cullmann A., Schmidt-Ehmcke
J., Zloczysti P. (2009)
Innovation, R&D Efficiency and the
Impact of The Regulatory Environment –
A Two-Stage Semi-Parametric DEA
Approach
German Institute for Economic
Research, Discussion papers
Abbasi F., Hajihoseini H.,
Haukka S. (2010)
Use of Virtual Index for Measuring
Efficiency of Innovation Systems: A
Cross-Country Study
International Journal of Technology
Management and Sustainable
Development journal
Pan Т.W., Hung S.V., Lu W.M.
(2010)
DEA Performance Measurement of the
National Innovation System in Asia and
Europe
Asia-Pacific Journal of Operational
Research
Cai Y. (2011) Factors Affecting the Efficiency of the
BRICS' National Innovation Systems: A
Comparative Study Based on DEA and
Panel Data Analysis
Economics (open e-Journal)
Chen C.P., Hu J.L., Yang C.H.
(2011)
An International Comparison of R&D
Efficiency of Multiple Innovative
Outputs: The Role of the National
Innovation System
Innovation: Management, Policy and
Practice
Guan J., Chen K. (2011) Modeling the Relative Efficiency of
National Innovation Systems Research Policy
Hsu Y. (2011) Cross National Comparison of Innovation
Efficiency and Policy Application
African Journal of Business
Management
Further, a detailed description on each reviewed study is including:
1. Information about the sample of countries used in the study. Total number of countries
and the number of countries in five regions:
Africa
Asia and Oceania;
Eastern Europe;
Western Europe and North America;
Latin America and Caribbean.

9
2. List of efficient countries
3. Set of input and output variables (in author definition).
4. DEA models used in the analysis.
5. Key potentials and limitations of the study.
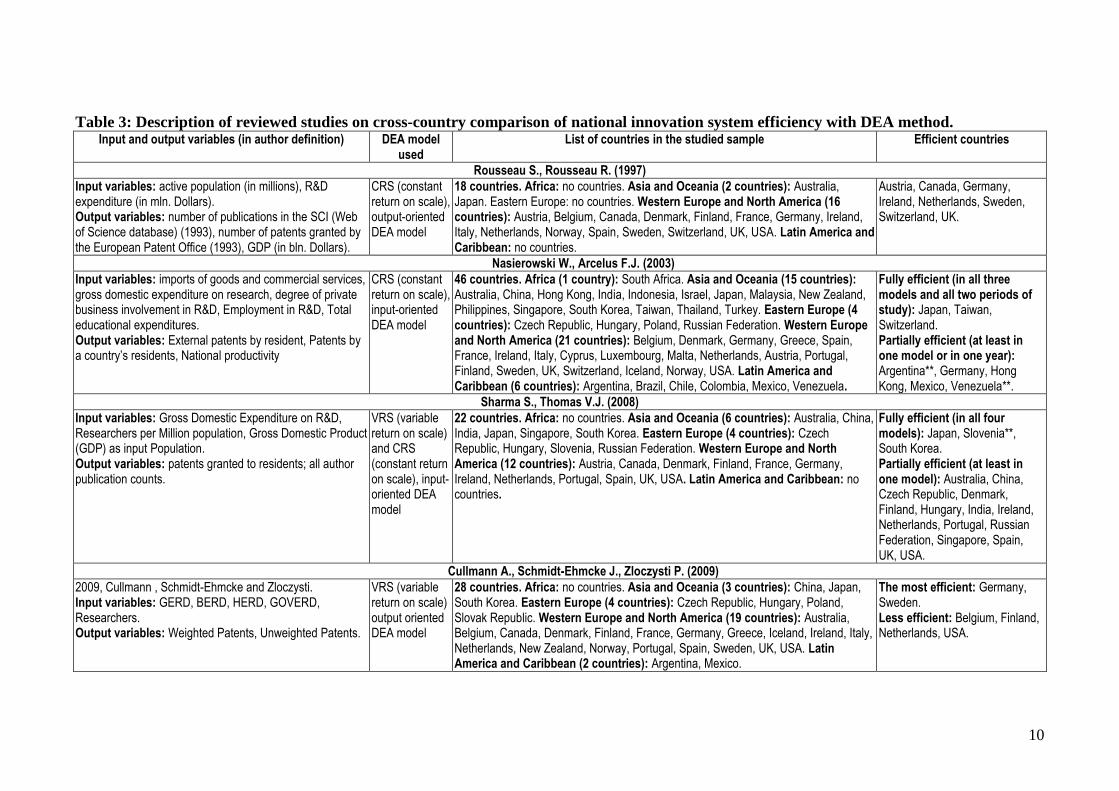
Table 3 summarizes the description of all reviewed studies. The last two sections review
key potentials and limitations of the studt and also summarize the general findings from this
review.
10
Table 3: Description of reviewed studies on cross-country comparison of national innovation system efficiency with DEA method. Input and output variables (in author definition) DEA model
used List of countries in the studied sample Efficient countries
Rousseau S., Rousseau R. (1997)
Input variables: active population (in millions), R&D expenditure (in mln. Dollars). Output variables: number of publications in the SCI (Web of Science database) (1993), number of patents granted by the European Patent Office (1993), GDP (in bln. Dollars).
CRS (constant return on scale), output-oriented DEA model
18 countries. Africa: no countries. Asia and Oceania (2 countries): Australia, Japan. Eastern Europe: no countries. Western Europe and North America (16 countries): Austria, Belgium, Canada, Denmark, Finland, France, Germany, Ireland, Italy, Netherlands, Norway, Spain, Sweden, Switzerland, UK, USA. Latin America and Caribbean: no countries.
Austria, Canada, Germany, Ireland, Netherlands, Sweden, Switzerland, UK.
Nasierowski W., Arcelus F.J. (2003)
Input variables: imports of goods and commercial services, gross domestic expenditure on research, degree of private business involvement in R&D, Employment in R&D, Total educational expenditures. Output variables: External patents by resident, Patents by a country’s residents, National productivity
CRS (constant return on scale), input-oriented DEA model
46 countries. Africa (1 country): South Africa. Asia and Oceania (15 countries): Australia, China, Hong Kong, India, Indonesia, Israel, Japan, Malaysia, New Zealand, Philippines, Singapore, South Korea, Taiwan, Thailand, Turkey. Eastern Europe (4 countries): Czech Republic, Hungary, Poland, Russian Federation. Western Europe and North America (21 countries): Belgium, Denmark, Germany, Greece, Spain, France, Ireland, Italy, Cyprus, Luxembourg, Malta, Netherlands, Austria, Portugal, Finland, Sweden, UK, Switzerland, Iceland, Norway, USA. Latin America and Caribbean (6 countries): Argentina, Brazil, Chile, Colombia, Mexico, Venezuela.
Fully efficient (in all three models and all two periods of study): Japan, Taiwan, Switzerland. Partially efficient (at least in one model or in one year): Argentina**, Germany, Hong Kong, Mexico, Venezuela**.
Sharma S., Thomas V.J. (2008)
Input variables: Gross Domestic Expenditure on R&D, Researchers per Million population, Gross Domestic Product (GDP) as input Population. Output variables: patents granted to residents; all author publication counts.
VRS (variable return on scale) and CRS (constant return on scale), input-oriented DEA model
22 countries. Africa: no countries. Asia and Oceania (6 countries): Australia, China, India, Japan, Singapore, South Korea. Eastern Europe (4 countries): Czech Republic, Hungary, Slovenia, Russian Federation. Western Europe and North America (12 countries): Austria, Canada, Denmark, Finland, France, Germany, Ireland, Netherlands, Portugal, Spain, UK, USA. Latin America and Caribbean: no countries.
Fully efficient (in all four models): Japan, Slovenia**, South Korea. Partially efficient (at least in one model): Australia, China, Czech Republic, Denmark, Finland, Hungary, India, Ireland, Netherlands, Portugal, Russian Federation, Singapore, Spain, UK, USA.
Cullmann A., Schmidt-Ehmcke J., Zloczysti P. (2009)
2009, Cullmann , Schmidt-Ehmcke and Zloczysti. Input variables: GERD, BERD, HERD, GOVERD, Researchers. Output variables: Weighted Patents, Unweighted Patents.
VRS (variable return on scale) output oriented DEA model
28 countries. Africa: no countries. Asia and Oceania (3 countries): China, Japan, South Korea. Eastern Europe (4 countries): Czech Republic, Hungary, Poland, Slovak Republic. Western Europe and North America (19 countries): Australia, Belgium, Canada, Denmark, Finland, France, Germany, Greece, Iceland, Ireland, Italy, Netherlands, New Zealand, Norway, Portugal, Spain, Sweden, UK, USA. Latin America and Caribbean (2 countries): Argentina, Mexico.
The most efficient: Germany, Sweden. Less efficient: Belgium, Finland, Netherlands, USA.
11
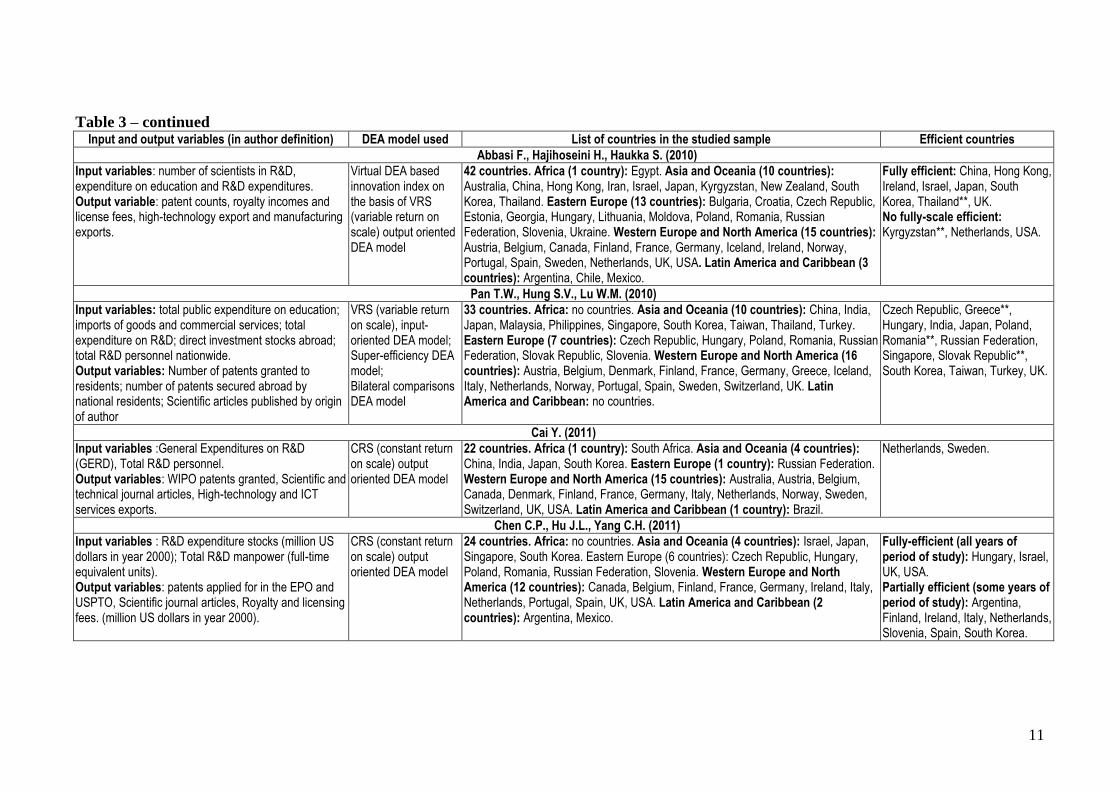
Table 3 – continued Input and output variables (in author definition) DEA model used List of countries in the studied sample Efficient countries
Abbasi F., Hajihoseini H., Haukka S. (2010)
Input variables: number of scientists in R&D, expenditure on education and R&D expenditures. Output variable: patent counts, royalty incomes and license fees, high-technology export and manufacturing exports.
Virtual DEA based innovation index on the basis of VRS (variable return on scale) output oriented DEA model
42 countries. Africa (1 country): Egypt. Asia and Oceania (10 countries): Australia, China, Hong Kong, Iran, Israel, Japan, Kyrgyzstan, New Zealand, South Korea, Thailand. Eastern Europe (13 countries): Bulgaria, Croatia, Czech Republic, Estonia, Georgia, Hungary, Lithuania, Moldova, Poland, Romania, Russian Federation, Slovenia, Ukraine. Western Europe and North America (15 countries): Austria, Belgium, Canada, Finland, France, Germany, Iceland, Ireland, Norway, Portugal, Spain, Sweden, Netherlands, UK, USA. Latin America and Caribbean (3 countries): Argentina, Chile, Mexico.
Fully efficient: China, Hong Kong, Ireland, Israel, Japan, South Korea, Thailand**, UK. No fully-scale efficient: Kyrgyzstan**, Netherlands, USA.
Pan Т.W., Hung S.V., Lu W.M. (2010)
Input variables: total public expenditure on education; imports of goods and commercial services; total expenditure on R&D; direct investment stocks abroad; total R&D personnel nationwide. Output variables: Number of patents granted to residents; number of patents secured abroad by national residents; Scientific articles published by origin of author
VRS (variable return on scale), input-oriented DEA model; Super-efficiency DEA model; Bilateral comparisons DEA model
33 countries. Africa: no countries. Asia and Oceania (10 countries): China, India, Japan, Malaysia, Philippines, Singapore, South Korea, Taiwan, Thailand, Turkey. Eastern Europe (7 countries): Czech Republic, Hungary, Poland, Romania, Russian Federation, Slovak Republic, Slovenia. Western Europe and North America (16 countries): Austria, Belgium, Denmark, Finland, France, Germany, Greece, Iceland, Italy, Netherlands, Norway, Portugal, Spain, Sweden, Switzerland, UK. Latin America and Caribbean: no countries.
Czech Republic, Greece**, Hungary, India, Japan, Poland, Romania**, Russian Federation, Singapore, Slovak Republic**, South Korea, Taiwan, Turkey, UK.
Cai Y. (2011)
Input variables :General Expenditures on R&D (GERD), Total R&D personnel. Output variables: WIPO patents granted, Scientific and technical journal articles, High-technology and ICT services exports.
CRS (constant return on scale) output oriented DEA model
22 countries. Africa (1 country): South Africa. Asia and Oceania (4 countries): China, India, Japan, South Korea. Eastern Europe (1 country): Russian Federation. Western Europe and North America (15 countries): Australia, Austria, Belgium, Canada, Denmark, Finland, France, Germany, Italy, Netherlands, Norway, Sweden, Switzerland, UK, USA. Latin America and Caribbean (1 country): Brazil.
Netherlands, Sweden.
Chen C.P., Hu J.L., Yang C.H. (2011)
Input variables : R&D expenditure stocks (million US dollars in year 2000); Total R&D manpower (full-time equivalent units). Output variables: patents applied for in the EPO and USPTO, Scientific journal articles, Royalty and licensing fees. (million US dollars in year 2000).
CRS (constant return on scale) output oriented DEA model
24 countries. Africa: no countries. Asia and Oceania (4 countries): Israel, Japan, Singapore, South Korea. Eastern Europe (6 countries): Czech Republic, Hungary, Poland, Romania, Russian Federation, Slovenia. Western Europe and North America (12 countries): Canada, Belgium, Finland, France, Germany, Ireland, Italy, Netherlands, Portugal, Spain, UK, USA. Latin America and Caribbean (2 countries): Argentina, Mexico.
Fully-efficient (all years of period of study): Hungary, Israel, UK, USA. Partially efficient (some years of period of study): Argentina, Finland, Ireland, Italy, Netherlands, Slovenia, Spain, South Korea.
12
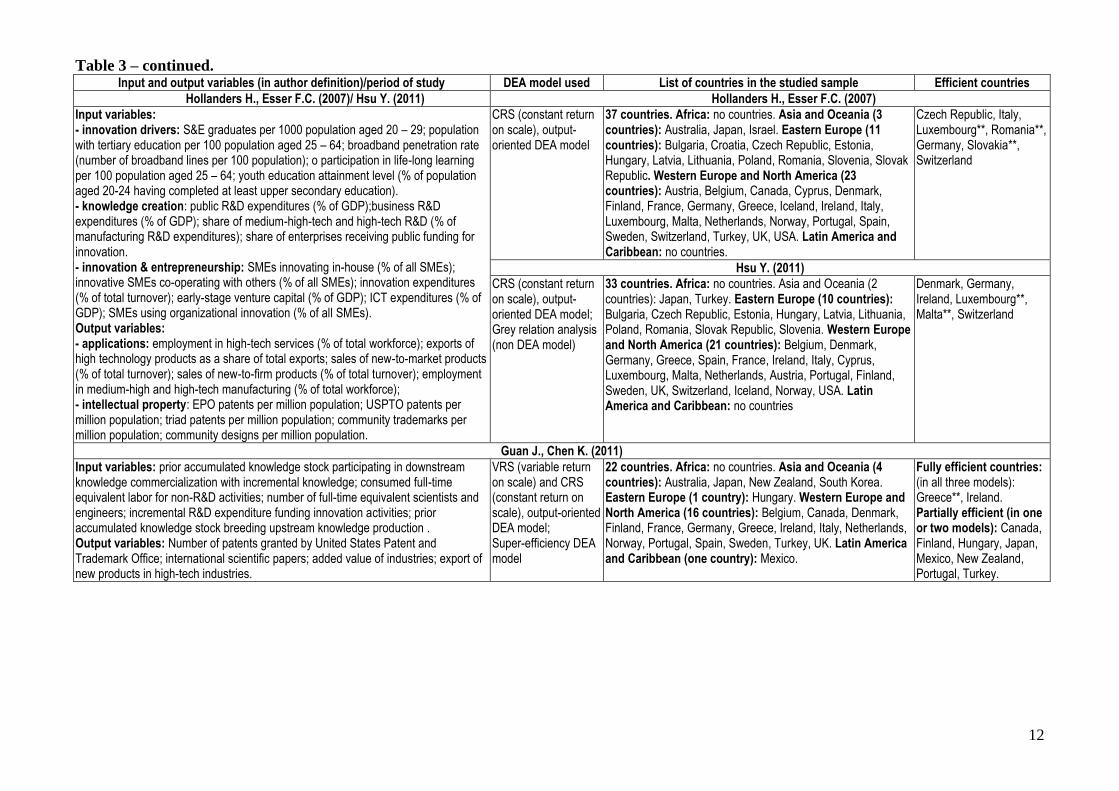
Table 3 – continued. Input and output variables (in author definition)/period of study DEA model used List of countries in the studied sample Efficient countries
Hollanders H., Esser F.C. (2007)/ Hsu Y. (2011) Hollanders H., Esser F.C. (2007)
Input variables: - innovation drivers: S&E graduates per 1000 population aged 20 – 29; population with tertiary education per 100 population aged 25 – 64; broadband penetration rate (number of broadband lines per 100 population); o participation in life-long learning per 100 population aged 25 – 64; youth education attainment level (% of population aged 20-24 having completed at least upper secondary education). - knowledge creation: public R&D expenditures (% of GDP);business R&D expenditures (% of GDP); share of medium-high-tech and high-tech R&D (% of manufacturing R&D expenditures); share of enterprises receiving public funding for innovation. - innovation & entrepreneurship: SMEs innovating in-house (% of all SMEs); innovative SMEs co-operating with others (% of all SMEs); innovation expenditures (% of total turnover); early-stage venture capital (% of GDP); ICT expenditures (% of GDP); SMEs using organizational innovation (% of all SMEs). Output variables: - applications: employment in high-tech services (% of total workforce); exports of high technology products as a share of total exports; sales of new-to-market products (% of total turnover); sales of new-to-firm products (% of total turnover); employment in medium-high and high-tech manufacturing (% of total workforce); - intellectual property: EPO patents per million population; USPTO patents per million population; triad patents per million population; community trademarks per million population; community designs per million population.
CRS (constant return on scale), output-oriented DEA model
37 countries. Africa: no countries. Asia and Oceania (3 countries): Australia, Japan, Israel. Eastern Europe (11 countries): Bulgaria, Croatia, Czech Republic, Estonia, Hungary, Latvia, Lithuania, Poland, Romania, Slovenia, Slovak Republic. Western Europe and North America (23 countries): Austria, Belgium, Canada, Cyprus, Denmark, Finland, France, Germany, Greece, Iceland, Ireland, Italy, Luxembourg, Malta, Netherlands, Norway, Portugal, Spain, Sweden, Switzerland, Turkey, UK, USA. Latin America and Caribbean: no countries.
Czech Republic, Italy, Luxembourg**, Romania**, Germany, Slovakia**, Switzerland
Hsu Y. (2011)
CRS (constant return on scale), output-oriented DEA model; Grey relation analysis (non DEA model)
33 countries. Africa: no countries. Asia and Oceania (2 countries): Japan, Turkey. Eastern Europe (10 countries): Bulgaria, Czech Republic, Estonia, Hungary, Latvia, Lithuania, Poland, Romania, Slovak Republic, Slovenia. Western Europe and North America (21 countries): Belgium, Denmark, Germany, Greece, Spain, France, Ireland, Italy, Cyprus, Luxembourg, Malta, Netherlands, Austria, Portugal, Finland, Sweden, UK, Switzerland, Iceland, Norway, USA. Latin America and Caribbean: no countries
Denmark, Germany, Ireland, Luxembourg**, Malta**, Switzerland
Guan J., Chen K. (2011)
Input variables: prior accumulated knowledge stock participating in downstream knowledge commercialization with incremental knowledge; consumed full-time equivalent labor for non-R&D activities; number of full-time equivalent scientists and engineers; incremental R&D expenditure funding innovation activities; prior accumulated knowledge stock breeding upstream knowledge production . Output variables: Number of patents granted by United States Patent and Trademark Office; international scientific papers; added value of industries; export of new products in high-tech industries.
VRS (variable return on scale) and CRS (constant return on scale), output-oriented DEA model; Super-efficiency DEA model
22 countries. Africa: no countries. Asia and Oceania (4 countries): Australia, Japan, New Zealand, South Korea. Eastern Europe (1 country): Hungary. Western Europe and North America (16 countries): Belgium, Canada, Denmark, Finland, France, Germany, Greece, Ireland, Italy, Netherlands, Norway, Portugal, Spain, Sweden, Turkey, UK. Latin America and Caribbean (one country): Mexico.
Fully efficient countries: (in all three models): Greece**, Ireland. Partially efficient (in one or two models): Canada, Finland, Hungary, Japan, Mexico, New Zealand, Portugal, Turkey.

13
The studies
The studies are analyzed in the following.
The Study by Rousseau and Rousseau (1997) shows a strong potential in the graphical
representation of efficiency frontier for the sample. This visualization allows to clearly seeing
the efficient countries on the scatter-plot diagram. However, the study analyses only a limited
sample of countries (only 18 countries), taking into account only OECD countries. Moreover no
further econometric analysis of efficiency scores was done.
Nasierowski and Arcelus (2003) take into account external (moderator) variables, run
the analysis for two years of study (1993 and 1997) and further run tobit regression analysis of
influence of moderator variables on the efficiency scores. The key potential of this study is the
largest sample of countries among 11 reviewed studies including 45 countries. On the other
hand, authors provide hard to understand mathematical description of models used for analysis
and do not visualize efficiency frontier on the scatter plot.
In Hollanders and Esser (2007) study a comprehensive set of input and output variables
is used for the analysis of the efficiency of national innovation systems. Moreover, authors take
into account variables directly related to innovation activities. As well as Rousseau and
Rousseau (1997) authors provide graphical representation of efficiency frontier and peer groups
of countries in a very easy to understand style. In addition, authors run the DEA analysis for
several models and variables set specifications. Meanwhile the key limitation of this study is the
absence of the mathematical description of model used. In addition, authors “ignore” countries
from Africa and Latina America and Caribbean in their country sample. Moreover, Hollanders
and Esser (2007) do not run further econometric analysis of efficiency scores.
Sharma and Thomas (2008) run the analysis on several specifications of DEA model.
The main advantage of their work is a very clear presentation of the analysis results in form of
graphs and tables. The key limitation of this work is a little sample of countries studied (only 22
countries). As it was in some reviewed studies the authors don’t run further econometric analysis
of efficiency scores. Mathematical description of models used in Sharma and Thomas (2008) is
difficult to understand especially for readers without strong mathematical background. Also the
authors do not use graphical representation of efficiency frontier.
Cullmann, Schmidt-Ehmcke and Zloczysti (2009) make a comprehensive literature
review of previous empirical studies on measuring the NIS efficiency using data envelopment
analysis. Authors also analyze the impact of regulatory environmental factors on efficiency.
However their paper has some serious limitations. Firstly, authors do not provide any graphical
representation of efficiency frontier. Further, presentation of the analysis results is unclear and

14
hard to understand. Finally authors take very “weak” list of output variables (only “Weighted
Patents” and “Unweighted Patents”).
Abbasi, Hajihoseini and Haukka (2010) in their paper use their own model (virtual
index of NIS efficiency) based on DEA output-oriented model. Further authors analyze “sources
of differences in innovative performance and to investigate the impacts of the country-specific
factors across the sample countries” (ibid) through tobit model and explain “the variation the
variation of DEA efficiency scores between DMUs” (ibid) using ordinary least square
regression. Abbasi et al also include very big number (42 countries) of countries in the sample
and take countries that have been not analyzed in other reviewed studies. On the other hand,
authors do not provide graphical representation of efficiency frontier. Their study suffers from
very unclear and hard to understand representation of the analysis results and very unclear
mathematical description of “virtual index for measuring the relative innovativeness of countries.
Pan, Hung and Lu (2010) use of extended DEA models (super efficiency DEA model
and model for bilateral comparison) for measuring the efficiency of national innovation systems.
They provide a very clear and accurate mathematical description of model used as well as very
elegant and clear representation of the analysis results Using super-efficiency DEA model
authors also determine the needed changes in input and output variables for achieving the
efficiency frontier for all inefficient countries. Meanwhile authors do not plot the efficiency
frontier and concentrate their analysis only on Asian and European countries.
Cai (2011) runs the analysis for the whole period (2000 – 2008) instead of one-year and
does comprehensive econometric analysis of factors influencing the NIS efficiency. On the other
hand the author takes very little (only 22 countries) sample of countries, provides weak
mathematical description of DEA model used and as it was in many reviewed studies does not
provide graphical representation of the efficiency frontier.
Chen, Hu and Yang (2011) like Cai (2011) also run the analysis for the whole period
(1998 – 2005) for several sets of variables. Like Pan et al (2010) they provide elegant
mathematical description of the models used and very clear graphical and table presentation of
the analysis results. The other potential of this study is detailed description of the set of
variables. The main limitations of this paper is the absence of graphical representation of
efficiency frontier and little country sample (24 countries).
Guan and Chen (2011) also use DEA super-efficiency model for measuring the
efficiency of national innovation systems. Authors run their analysis for several set of variables.
Further Guan and Chen analyze the impact of external factors on NIS efficiency. In their paper
authors provide comprehensive mathematical description of the models used. Like Hollanders
and Esser (2007) and Hsu (2011) authors use of variables directly linked with innovation
15
activity. Again, the key limitation of the study is little sample study. Guan and Chen (2011)
analyze only 22 OECD countries. The other limitation of this study are absence of efficiency
frontier in explicit form and quite hard to understand mathematical description of models used in
the basis of analysis.
Only Hsu (2011) among 11 reviewed studies uses additional, non-DEA method for
analysis the NIS efficiency (grey relational analysis technique, developed in Deng, 1988).
Authors take quite big sample of countries (33 countries) for analysis. Meanwhile Hsu (2011)
does not plot efficiency frontier in input-output variables coordinates. Author also provides
Unclear and hard to understand representation of the analysis results and does not econometric
methods for further analysis of efficiency scores.

16
Discussion
The reviewed empirical all included countries from Western Europe and North America.
Germany, Finland, France, Japan, Netherlands, and UK were analyzed in the studied sample in
all 11 reviewed papers. In all reviewed studies countries from Western Europe and the North
America were the dominant (in terms of number of countries) group of countries. The resulting
“bias” is due to easy access to comparable and reliable data on national innovation system
development for Western Europe and North America countries.
African countries were studied only in three of 11 reviewed studies: South Africa
[Nasierowski, and Arcelus, 2003; Cai, 2011] and Egypt [Hajihoseini and Haukka, 2010]. Until
recently scholars also “ignored” countries from Latin America and Caribbean. Only two papers
[Nasierowski and Arcelus, 2003; Abbasi, Hajihoseini and Haukka 2011] take more than 3
countries from Latin America and Caribbean.
In general, the studies use rather small (less than 30) samples of countries in the studies.
Only two reviewed papers take into the sample more than 40 countries:
Abbasi, Hajihoseini and Haukka (2010) 42 countries;
Nasierowski, and Arcelus (2003) 46 countries.
Not surprisingly, the most efficient national innovation systems (countries) are
OECD countries. Ireland, Netherlands, UK were included in the list of efficient countries in six
and Germany, Hungary, and Japan in five of the 11 studies. Therefore, these countries can be
considered well developed and strong national innovation systems.
Meanwhile “small” countries like Argentina, Kyrgyzstan or Slovak Republic, were
described efficient countries in rare cases. These “small” countries became the efficient
countries primarily due to the sample and the set of variables but not due to performance of
their national innovation system.
Only in three of 11 reviewed studies “small” countries were not taken in the list of
efficient countries (Table A.1). These studies with their special characteristics that lead to
exclusion of “small countries” from the list of efficient countries are the following:
Rousseau and Rousseau (1997): little and “strong” sample – only 18 OECD
countries + CRS DEA model;
Cullman, Schmidt-Ehmcke and Zloczysti (2009): set of output variables – only
patent activity variables;
Cai (2011): little and “strong” sample – 18 OECD countries and 4 BRIC countries
+ CRS DEA model.
17
The remaining studies assigned the status efficient countries to the “small” countries.
This can be explained by the design of the sample and the list of variables or the specification of
DEA model used in these studies.
Input variables
The reviewed studies show quite little similarity in the sets of input variables.
Different indicators of R&D personnel (total R&D personnel or number of researchers) were
used as main “human capital” input variable in many reviewed papers. However, in some
cases authors take other indicators as “human capital” input variable:
“Active population” [Rousseau and Rousseau, 1997] ;
“S&E graduates per 1000 population aged 20–29”, “Population with tertiary
education per 100 population aged 25–64”, “Youth education attainment level”
[Hollanders and Esser, 2007; Hsu, 2011] ;
“Number of full-time equivalent scientists and engineers”, “consumed full-time
equivalent labor for non-R&D activities” [Guan and Chen, 2011].
The main “investment” input variables were different indicators of R&D
expenditures. These indicators were used in all reviewed studies. Meanwhile, in some cases
authors (3 of 11 studies) include expenditures on education as additional “investments” input
variable.
It should be noted that in some cases author used quite strange input variables:
“Imports of goods and commercial services” [Nasierowski and Arcelus, 2003;
Pan, Hung and Lu 2010];
“Direct investment stocks abroad” [Pan, Hung and Lu, 2010];
“GDP as input population” [Sharma and Thomas, 2008].
Output variables
In contrast to the list of input variables, authors use more or less identical sets of output
variables. Different indicators of patent activity were taken as output variables in all reviewed
papers2.
Publication activity indicators were included in the list of output variables in six cases3.
2 See Khramova, Meissner, Sagieva (2013) for a detailed analysis of different indicators of patent activity
and international databases on intellectual property rights. 3 See Kotsemir 2012a and 2012b for analysis of key potentials and limitations of Scopus and Web of
Science databases as well as problems with indicators of publication activity.

18
Indicators of high-tech export variables were taken as output variables in five cases in
our review. Important note here: authors take different meaning of high-tech export in their
studies
Exports of high technology products as a share of total exports [Hollanders and
Esser, 2007; Hsu, 2011];
High-technology export and manufacturing exports [Abbasi, Hajihoseini and
Haukka, 2010];
Export of new products in high-tech industries [Guan and Chen, 2001];
Export of high-technology and ICT services exports [Cai, 2011].
Royalty incomes and license fees were included in the list of output variables in two
cases.
In three cases authors use indicators linked with the productivity in the set of output
variables:
“GDP” [Rousseau and Rousseau, 1997];
“national productivity” [Nasierowski and Arcelus, 2003];
“added value of industries” [Guan and Chen, 2011].
We also can identify “employment in high-tech services” as “unusual” output variable.
[Hollanders and Esser, 2007; Hsu, 2011].
DEA models used in the papers
The classical CRS CCR DEA model was used in only two cases in our review:
Rousseau and Rousseau (1997) and Nasierowski and Arcelus (2003). The most frequently used
model (in 6 of 11 cases) was output-oriented model with constant return to scale.
In some cases in our review, authors use “non-classical” specifications of DEA
models:
“Virtual index for measuring the relative innovativeness of countries” based on
DEA output-oriented model [Abbasi, Hajihoseini and Haukka, 2010];
Super-efficiency DEA model [Pan, Hung and Lu, 2010; Guan and Chen, 2011];
DEA specification for bilateral comparison4 of two clusters of DMUs [Pan, Hung
and Lu, 2010];
Grey relational analysis developed by Deng (1998) in addition to DEA models
[Hsu, 2011].
4 Theoretical description of DEA model for bilateral comparison see in Sueyoshi et al., 1998; Cooper et al.,
2006.
19
Key limitations of the reviewed studies
We can detect the following list of main limitation of the reviewed studies.
1. In general the small size of country samples is the main limitation of all reviewed
studies. Such limitation highlights the problems with international database availability for
authors or with the set of variables “very high requirements” (data on these variables are
available for a very small sample of countries).
2. A strong bias towards OECD countries in the sample studied results from the small
sample sizes usually used. Since in general a broad set of comparable data on NIS development
are available firstly for OECD countries authors tend to take these countries into their country
samples. Meanwhile such databases as SCImago Journal and Country Rank, World Intellectual
Property Organization, World Bank database, World Development Indicators, section “Science
and Technology”, UNESCO Institute for Statistics, Data center, Section “Science and
Technology” include broad publicly available and free to download range of comparable datasets
on NIS development for almost all countries of the world. Moreover, these databases are
synchronized and harmonized with other international databases such as U.S. National Science
Board, the UN Statistics Division, the International Monetary Fund, OECD MSTI etc. Therefore,
availability of key research and development statistics for non-OECD countries is not a problem
at all.
3. Very poor analysis of “small” countries in the list of efficient countries. Since in
many reviewed studies the effect of “small” countries exist, meanwhile these studies pay little
attention to this phenomenon. Moreover in some countries such “exotic” countries like
Venezuela and Kyrgyzstan become the efficient countries but authors do not explain clearly why
these “exotic” countries became the efficient countries.
4. Almost no discussion on problems of data collection. Since data on NIS
development are quite specific data at least the statement of this phenomenon is required.
Moreover internationally comparable data on innovation activity are currently unavailable for a
vast majority of countries5. Meanwhile all reviewed studies paid very little attention to these
problems.
5. Very little discussion on previous studies. Only Sharma and Thomas (2008) and
Cullmann, Schmidt-Ehmcke and Zloczysti (2009) provide literature review of the previous
relevant studies in the explicit form. In all other reviewed studies authors pay little attention to
the analysis of previous related studies.
5 See Russian innovation index (2011) on detailed discussion on methodology of indicators of innovation
activity in Russia.

20
6. In many cases DEA model used are poorly described. Almost all reviewed studies
suffer from unclear and hard to understand mathematical description of DEA models used for
analysis. This limitation seriously hampers the general understanding and clear reading of these
studies. Only Pan, Hung and Lu (201) provide elegant and easy to understand mathematical
description of the models used.
7. In many cases results of analysis are presented unclearly. This limitation seriously
diminishes the value of study since the clear presentation of results of the study is may be more
important than the strong and serious underlying mathematical models. In general Asian authors
tend to clear presentation of their analysis results [Sharma and Thomas , 2008; Pan, Hung and
Lu, 2010; Chen, Hu and Yang, 2011].
21
Concluding remarks
The working paper compared different empirical studies. It can be further developed in
the following direction. It would be reasonable to run DEA model for analysis the efficiency of
national innovation systems for a big (more than 40 countries) country sample. This sample
should include highly developed countries (such as the UK, South Korea, Germany), developing
countries (such as India, Argentina and Ecuador), and countries with economies in transition
(such as Russia, Kazakhstan, Ukraine). This study should also in detail discuss the problem of
availability and collection of data especially for non-OECD countries as well as review of other
related studies.
The main goal of this paper should be: detection the “small” countries in the list of
efficient countries” phenomenon and development of tools for eliminating (or at least
diminishing) of this phenomenon. This study will use tool of weighting the output variables in
their absolute values in order to escape direct exclusion of “small” countries from the studied
sample based on some subjective principles. Therefore, this study pays big attention to detailed
description of the set of input and output variables as well as procedure of weighting the output
variables. Finally, this study will in details describe the reasons for national innovation system
efficiency for all efficient countries.

22
References
Abbasi F., Hajihoseini H., Haukka S. (2011). Use of Virtual Index for Measuring
Efficiency of Innovation Systems: A Cross-Country Study // International Journal of
Technology Management and Sustainable Development, Vol. 9, No. 3, pp. 195–212.
Aigner D.J., Lovell C.A.K., Schmidt P.J. (1977). Formulation and Estimation of
Stochastic Frontier Production Function Models // Journal of Econometrics, Vol. 6, pp. 21–37.
Bonaccorsi A., Daraio C. (2004). Econometric Approaches to the Analysis of
Productivity of R&D Systems: Production Functions and Production Frontiers. In: H.F. Moed et
al. (eds.). Handbook of Quantitative Science and Technology Research // Kluwer Academic
Publishers, pp. 51 – 74.
Cai Y. (2011). Factors Affecting the Efficiency of the BRICS' National Innovation
Systems: A Comparative Study Based on DEA and Panel Data Analysis // Economics (open e-
Journal), Economics Discussion Papers, No. 2011-52.
Charnes A., Cooper W. W., Rhodes E. (1978). Measuring the Efficiency of Decision
Making Units // European Journal of Operational Research, Vol. 2, pp. 429–444.
Chen C.P., Hu J.L., Yang C.H. (2011). An International Comparison of R&D Efficiency
of Multiple Innovative Outputs: The Role of the National Innovation System // Innovation:
Management, Policy and Practice, Vol. 13, No. 3, pp. 341–360.
Cook W.D., Seiford L.M. (2009). Data Envelopment Analysis (DEA) – Thirty Years On
// European Journal of Operational Research, Vol. 192, No. 1, pp. 1–17.
Cooper W.W., Seiford L.M., Tone K. (2006). Introduction to Data Envelopment Analysis
and Its Use with DEA-Solver Software // Springer Science Business Media, Inc.
Cullmann A., Schmidt-Ehmcke J., Zloczysti P. (2009). Innovation, R&D Efficiency and
the Impact of The Regulatory Environment – A Two-Stage Semi-Parametric DEA Approach //
German Institute for Economic Research, Discussion paper №883: Berlin, May 2009.
Debreu G. (1951). The Coefficient of Resource Utilization // Econometrica, Vol. 19, No.
3, pp. 273–292.
Deng J (1988). Modeling Of the GM Model of Grey System. Essential Topics on Grey
System Theory and Application // China Ocean Press, pp. 40–53
Fare R., Grosskopf S., Lovell C.A.K. (1994). Production Frontiers // Cambridge,
Cambridge University Press.
Farrell M.J. (1957). The Measurement of Productive Efficiency // Journal of the Royal
Statistical Society (A, general), Vol. 120, pp. 253–281.
Guan J., Chen K. (2012). Modeling the Relative Efficiency of National Innovation
Systems // Research Policy, Vol. 41, No. 1, pp. 102–115.
Gokhberg L.M. (ed.) (2011). Russian innovation index // Moscow: HSE (in Russian).
Hjalmarsson L., Kumbhakar S.C., Heshmati A. (1996). DEA, DFA and SFA: A
Comparison // Journal of Productivity Analysis, Vol. 7, pp. 303–327.
Hollanders H., Esser F.C. (2007). Measuring Innovation Efficiency // INNO-Metrics
Thematic Paper, December 2007.
Hsu Y. (2011). Cross National Comparison of Innovation Efficiency and Policy
Application // African Journal of Business Management, Vol. 5, No. 4, pp. 1378–1387.
Khramova E.B., Meissner D. Sagieva G.S. (2013). Statistical Patent Analysis Indicators
as a Means of Determining Country Technological Specialisation // Higher School of Economics
Research Paper No. WP BRP 09/STI/2013. Available at SSRN:
http://ssrn.com/abstract=2247936
Koopmans T.C. (1951). An Analysis of Production as Efficient Combination of
Activities. In: Activity Analysis of Production and Allocation, Koopmans, T.C. (eds.) // Cowles
Commission for Research in Economics, Monograph no. 13, New York.

23
Kotsemir M.N. (2012). Dynamics of Russian and World Science Through the Prism of
International Publications // Foresight Russia, Vol. 6, No. 1, pp. 38–58. Available at SSRN:
http://ssrn.com/abstract=2262223
Kotsemir M.N. (2012). Publication Activity of Russian Researches in Leading
International Scientific Journals // Acta Naturae, Vol. 4, No. 2, pp. 14–35. Available at SSRN:
http://ssrn.com/abstract=2207297
Murillo-Zamorano L.R. (2004). Economic Efficiency and Frontier Techniques // Journal
of Economic Surveys, Vol. 18, No. 1, pp. 33–77.
Nasierowski W., Arcelus F.J. (2003). On the Efficiency of National Innovation Systems //
Socio-Economic Planning Sciences, Vol. 37, pp. 215–234.
Pan Т.W., Hung S.V., Lu W.M. (2010). DEA Performance Measurement of the National
Innovation System in Asia and Europe // Asia-Pacific Journal of Operational Research, Vol. 27,
No. 3, pp. 369–392.
Rousseau S., Rousseau R. (1997). Data Envelopment Analysis as a Tool for Constructing
Scientometric Indicators // Scientometrics, Vol. 40, No. 1, pp. 45–56.
Seiford L.M., Thrall R.M. (1990). Recent Developments in DEA: The Mathematical
Approach to Frontier Analysis // Journal of Econometrics, Vol. 46, pp. 7–38.
Sharma S., Thomas V.J. (2008). Inter-Country R&D Efficiency Analysis: An Application
of Data Envelopment Analysis // Scientometrics, Vol. 76, No. 3, pp. 483–501.
Sueyoshi T., Hasebe T., Ito F., Sakai J., Ozawa W. (1998). DEA-Bilateral Performance
Comparison: An Application to Japan Agricultural // Omega, International Journal of
Management Science, Vol. 26, No. 2, pp. 233–248.
Tone K. (2001). A Slack-Based Measure of Efficiency in Data Envelopment Analysis //
European Journal of Operational Research, Vol. 130, pp. 498–509.

24
Maxim N. Kotsemir
National Research University Higher School of Economics, Institute for Statistical Studies and
Economics of Knowledge, Research Laboratory for Science and Technology Studies, Junior
Research Fellow.
E-mail: [email protected]
Any opinions or claims contained in this Working Paper do not necessarily
reflect the views of HSE.