measuring and understanding energy efficiency
TRANSCRIPT

28Mar2011 www.fahrenergy.co.uk P: 1
MeasuringEfficiency.doc Copyright FAHRenergy Ltd. 2005 to 2013
Measuring And Understanding Energy Efficiency
Knowledge makes the difference. It is the base for improvements.
INSTRUMENTS NEEDED .......................................................................................................................................... 1
INTRODUCTION......................................................................................................................................................... 2
ENERGY RECOVERY DEPENDS ON TEMPERATURE DIFFERENCE.................................................................................. 3
MEASURING TEMPERATURE AND HUMIDITY ................................................................................................ 4
THE LOFT .................................................................................................................................................................... 4
Humidity On The Loft ............................................................................................................................................ 4
Sun Energy From The Loft..................................................................................................................................... 5
How Much Energy Is Collected From The Loft? ................................................................................................... 7
CALCULATING THE HRV SYSTEM EFFICIENCY............................................................................................. 8
COMPENSATED EFFICIENCY ........................................................................................................................................ 8
AVERAGE EFFICIENCY................................................................................................................................................. 9
EFFICIENCY AND HUMIDITY ....................................................................................................................................... 9
LONG TERM HOUSE EFFICIENCY ............................................................................................................................... 10
TOO HIGH EFFICIENCY .............................................................................................................................................. 12
Instruments Needed
USB thermal and humidity datalogger http://uk.rs-
online.com/web/search/searchBrowseAction.html?method=getProduct&R=4901064&cm_vc=av_
uk
A USB datalogger is the one which may be left in a ventilation duct.
Note:
• Common low price thermometers are non-linear. The tolerance changes with temperature
• Professional thermometers keep the tolerance throughout the range
Wattmeter
Nomenclature:
FAI = Fresh Air Into the HRV
FAO = Fresh Air Out of the HRV
OAI = Old Air Into the HRV
OAO = Old Air Out of the HRV
28Mar2011 www.fahrenergy.co.uk P: 2
MeasuringEfficiency.doc Copyright FAHRenergy Ltd. 2005 to 2013
Introduction
The ventilation system energy efficiency is compounded by a number of physical entities.
Energy consumption and recovery depends on energy movements in the ventilation system. Some
of this energy is captured or lost in the HRV, ducts or elsewhere in the house.
Measurement of airflow and thus air volume is difficult at low airspeeds. Tolerances better than
+/-15% are not common.
Reasonable measurements are not obtained with simple instruments. Trustworthy instruments and
quite some practical and theoretical knowledge is needed to obtain fair air volume and
temperature measurements. These are needed to calculate the energy efficiency of the ventilation
system.
It is NOT possible to use a common thermometer to measure outside, FAI (fresh air in), OAI (old
air in), OAO (old air out) and room temperatures at the same time. The reason is the lag of the
thermometer. It takes at least 30 minutes to obtain one single temperature measurement.
By using several thermometers they all must be of known tolerance throughout the range and this
tolerance must be sufficiently small to obtain a fair measurement.
The ventilation system efficiency changes hour by hour, day by day and time of year. Several
measurements are needed to obtain a fair idea of the efficiency of a HRV system.
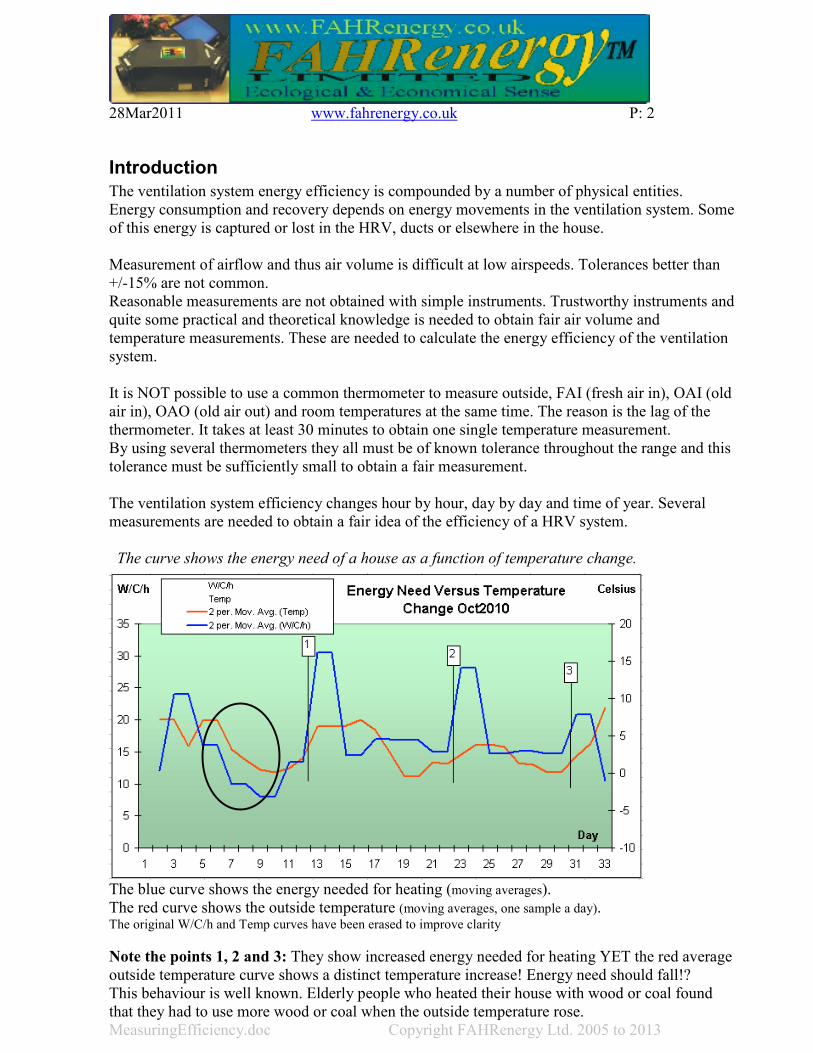
The curve shows the energy need of a house as a function of temperature change.
The blue curve shows the energy needed for heating (moving averages).
The red curve shows the outside temperature (moving averages, one sample a day).The original W/C/h and Temp curves have been erased to improve clarity
Note the points 1, 2 and 3: They show increased energy needed for heating YET the red average
outside temperature curve shows a distinct temperature increase! Energy need should fall!?
This behaviour is well known. Elderly people who heated their house with wood or coal found
that they had to use more wood or coal when the outside temperature rose.

28Mar2011 www.fahrenergy.co.uk P: 3
MeasuringEfficiency.doc Copyright FAHRenergy Ltd. 2005 to 2013
The example is shown here to emphasise the statement:
Energy measurements of a ventilation system are a part of the house and cannot be done by a
single sample or ad hoc measurements.
Look at the curves surrounded by the ring on the chart above.
A distinct drop in temperature is expected to demand more energy! Yet in the instance shown the
energy need dropped!
Energy Recovery Depends On Temperature Difference
The energy and temperature difference chart below shows a fair correlation between temperature
difference and energy recovered.
1: Energy recovery depends on the temperature difference between inside and outside.
The chart above: Energy recovered follows I/O temperature difference.
2: Energy is recovered whether the outside temperature is below or above the inside temperature.
The chart above: Energy is recovered both when the outside temperature is below or above the
inside temperature.
The average efficiency is around 80%.
Efficiencies above 100% are due to the delay of energy movements. The delay is created by the
local energy storage capacity of the house. Walls store more energy than floors etc.

28Mar2011 www.fahrenergy.co.uk P: 4
MeasuringEfficiency.doc Copyright FAHRenergy Ltd. 2005 to 2013
Measuring Temperature And Humidity
To measure a temperature is simple.
To understand what causes the particular temperature is quite complex.
Measure combined temperature and relative humidity (RH) of the loft using a temperature and RH
datalogger. At the same time measure the temperature outside using the same sample time.
The temperature and RH dataloggers program will calculate the dew point arising from the
collected data.
As all data are measured at the same time and during a fair timeperiod of at least 24 hours we may
obtain a useful data set.
The Loft
The following measurements were made on a 36m3 loft (54m2 area) with 2 FAHRenergy Power
HRV installed which excavated fresh air from the loft.
Outside temperature, loft temperature and loft humidity were measured with quality USB
dataloggers.
The hourly excavated air volume is around 150m3. This fairly large loft ventilation reduces
temperature differences on the loft. Condensation spots are eliminated.
Roof ventilation is obtained through lose tiles. This gives a mild, even ventilation throughout the
roof. To prevent dust and spray from the rain settling in the insulation, a plastic membrane is
suspended 10cm from the roof. Spray and dust will slide down the plastic membrane and enter the
gutter.
The measurements below (next page) were made with 2 thermal and 1 humidity dataloggers.
The tolerance is +/-0.5°C and +/-2RH% throughout the measurement range.
Heating energy consumption was measured with a wattmeter.
The heat used on any day depends on the average temperature, the added sun energy and the heat
loss of the house.
Humidity On The Loft
(See chart on the next page)
The loft humidity increases as the loft temperature decreases. From the calculated dew point curve
(green) we see that condensation cannot occur as the loft temperature (pink) is well above the dew
point.
Note that the extra ventilation created by the HRV eliminates any cold spot where condensation
could settle.

28Mar2011 www.fahrenergy.co.uk P: 5
MeasuringEfficiency.doc Copyright FAHRenergy Ltd. 2005 to 2013
In reference to the 2 circles in the chart above:
On a cold morning after the sun has risen, the outside temperature rises faster than the loft
temperature. This is the situation where condensation possibilities on the loft are highest.
Due to the forced ventilation the loft dew point is never reached.
Without the forced ventilation the loft humidity is less controlled. On a warm, cloudy day with
some wind the loft humidity would be as high as outside. If the clouds disperse at nights and the
wind recedes, the loft temperature will fall below the dew point as the loft air is not exchanged.
Condensation will occur. This is the foundation for the common mouldy and smelly loft.
Sun Energy From The Loft
The roof of the house is square, all sides are tapering towards the middle. The roof is tilted 23
degrees.
The roof area is 114m2 of which an average of 25m
2 is turned towards the sun. Due to the roof
angle this represents around 11m2 of sun area during the summer.
On sunny days 6 hour of sunshine is assumed. The sun energy which radiates onto the roof during
the month of March is around 300W per m2, some of which is reflected. Some sun energy heats
the roof tiles and thus heats the loft space through roof tile thermal conduction.
The sun energy radiating onto the roof on a sunny March day is thus 300*11*6 = 19.8kWh.
The calculated the heat loss of the house (upper level) for the 24th of March is 11kWh.
From the chart below we see that 0.9kWh was used. As the heater is a heat pump having a CoP of
2.5 we have received 2.25kWh from the heat pump. The difference of 8.75kWh is possibly
received from the loft through the HRV.
Having an 80% HRV system at 150m3 of air volume per hour we expect to lose 2kWh. A total of
10.75kWh has been collected from the loft.

28Mar2011 www.fahrenergy.co.uk P: 6
MeasuringEfficiency.doc Copyright FAHRenergy Ltd. 2005 to 2013
Let us compare our 10.75kWh energy collected from the loft to a sun collector. The sun collector
should be 10.75/0.3/6 = 6m2.
The HRV constantly excavates fresh air from the loft. The energy which has not been collected by
the HRV, heats up the loft space. This energy can be calculated from the difference between the
measured loft, outside temperature and air volume.
The result is seen in the chart below:
Parameters used to calculate the air energy: Air power constant is 0.3W per degree Celsius per m3.
Sample rate is 0.5hour. Air volume is 150m3 per hour.
The green curve shows the calculated loft energy available, relative to the outside temperature.
The energy received by the loft at anyone time is mainly positive. During cold mornings (24th and
26th) the energy is negative (cooling). It occurs when the outside temperature is warmer than the
loft. It is associated with sunny morning spells and thus decreasing humidity outside and on the
loft. The latter is due to the consistent forced intake of outside air to the loft.
The measurements during 24 hours on 3 days have been converted into energy available (not
collected). Some loft energy has been collected by the HRV.
In other words:
The HRV system reduces the temperature peaks of the loft. This in turn dampens the humidity
changes on the loft and condensation periods are shortened or eliminated.
This FAHRenergy loft installation corresponds to a FREE 6m2 sun collector
No installation and no maintenance is needed for this virtual sun collector
Let’s accept that we get positive energy from the loft. Let’s utilise this free energy!

28Mar2011 www.fahrenergy.co.uk P: 7
MeasuringEfficiency.doc Copyright FAHRenergy Ltd. 2005 to 2013
How Much Energy Is Collected From The Loft?
Energy collected by the HRV is defined as the energy recovered from the old air plus the extra
energy obtained from excavating the fresh air from the loft rather than directly from the outside.
The yearly calculated heating energy consumption of the laboratory house and the actual used
heating energy we obtained from September 2009 to March 2010 is shown below:
More about the energy reduction here:
http://www.fahrenergy.org.uk/install/Energy_Reduction_For_Existing_Homes.pdf
Energy collected from the loft during autumn is mainly from the sun.
Energy collected during the winter is mainly recovery of heat percolating through the ceiling and
loft insulation.
During January the average loft temperature was –1.7°C versus the average outside temperature
being –8°C. The rather large temperature difference is surprising as 150m3 of fresh air were
excavated from the loft every hour.
One explanation is the extra insulation the snow cover has created. This means that a large part of
the energy did not escape but assisted the HRV system in its quest for energy recovery. This is an
added installation bonus.
The OAO of the HRV is higher than the loft temperature and thus higher than the outside
temperature. Condensation cannot happen.

28Mar2011 www.fahrenergy.co.uk P: 8
MeasuringEfficiency.doc Copyright FAHRenergy Ltd. 2005 to 2013
Calculating The HRV System Efficiency
FAO = Fresh Air Out of the HRV. OAI = Old Air Into the HRV.
In the chart below FAO, AOI and outside temperatures were collected using 3 dataloggers.
Sample rate is 0.5 hours.
From the collected data the immediate efficiency was calculated and given the name Ei.
The immediate efficiency Ei, depends on the energy transferred from the old air to the fresh air.
This will be:
Ei = temperature difference between FAO and outside divided by the temperature difference
between OAI and outside. This becomes (in reference to the chart):
Ei = (FAO°C-Out°C)/(OAI°C-Out°C)
To get Ei in percent multiply by 100.
Compensated Efficiency
Due to a difference of 1.15 in the OAI and the FAO flow (FAO being the larger), the efficiency
has been compensated by multiplying Ei with 1.15. Let us call it Comp factor.
In the chart the compensated efficiency curve is called Ec1.15.
This is the actual efficiency.
Note that FAO has intentionally been set a bit high to increase the energy recovery even if this
results in a lower FAO temperature.
Ec% = (FAO°C-Out°C)/(OAI°C-Out°C) * Comp * 100

28Mar2011 www.fahrenergy.co.uk P: 9
MeasuringEfficiency.doc Copyright FAHRenergy Ltd. 2005 to 2013
Average Efficiency
The average efficiency is the sum of the ½ hours efficiencies divided by the sample number.
Interesting points in the chart above:
The two circles points out that minimum efficiency occurred when the outside temperature is
increasing (This is typically in the morning).
As the outside temperature settles the efficiency rises. It then stays around the same value all day
until the evening where the heater switches off. At this point it drops a bit but then stays steady.
Note that an earlier drop in the outside temperature has little effect.
In the morning, when the outside temperature rises, the efficiency of the HRV system drops
sharply.
Again the efficiency rises sharply as the outside temperature settles. Also note that the heater
stopped which steadied the OAI during this period yet the efficiency rose steadily.
One might suspect the heater being part of the efficiency but the heater has no connection to the
HRV but for the fact that it heats the air in the house.
It is more likely that the variance is connected to the fact that fresh air is taken from the loft.
The above points out that:
More about the actual efficiency measured in the FAHRenergy laboratory house during a 4 years
period. Actual HRV system efficiency is around 80% (see page 8):
http://www.fahrenergy.org.uk/install/Energy_Reduction_For_Existing_Homes.pdf
Efficiency And Humidity
FAHRenergy HRV’s are designed to avoid condensation.
In reference to the efficiency chart above, the red square points to a situation where OAO
condensation is a possibility as the efficiency reaches 99%.
Should the OAO temperature be reduced to near the loft temperature OAO condensation could
occur if the loft humidity is near 100%.
To assure condensation cannot occur in FAHRenergy HRV’s it is designed such that the
efficiency of an installed HRV stays around 80%. This gives a fair temperature and thus humidity
safe limit of the OAO.
This has been done to avoid expensive control and heater systems which only would reduce the
actual energy efficiency, increase the failure rate and price.
The average efficiency during the 27th and 28th of March 2011 is 76%
Several coherent samples must be made over time to obtain an efficiency measurement

28Mar2011 www.fahrenergy.co.uk P: 10
MeasuringEfficiency.doc Copyright FAHRenergy Ltd. 2005 to 2013
Long Term House Efficiency
What is the long term efficiency of a house with average insulation, heat pump as a sole heating
system and FAHRenergy HRV ventilation?
The above describes several installed FAHRenergy systems, hereunder the FAHRenergy
laboratory house.
The lab house, which has been in action for 6 years, is intended to answer such questions.
The Lab House Long Term Results
During a period from autumn 2009 to 2012 everything has been the same in terms of insulation,
ventilation and heating.
The Swedish electricity company’s connection bill.
In Sweden electricity payment has been split into electricity consumption and delivery through the
electrical net (to confuse the customer).
The electrical company charges the actual total monthly consumption as the meter from Kamstrup
Metro DK reports the reading directly through the electrical network:
The 2 monthly charge for the electrical network connection (not the electricity) is shown.
The total monthly consumption on each month during a year is seen on the bill above.
Heat consumption in the coldest December for many decades (2010) was 490kWh.

28Mar2011 www.fahrenergy.co.uk P: 11
MeasuringEfficiency.doc Copyright FAHRenergy Ltd. 2005 to 2013
Monthly Heat Consumption
2009 was a cool winter
2010 was a very cold winter and year. The coldest in decades
2011 was a very cold winter
In reference to the chart above:
From April to October no heating was needed. Normally the heating season would include both
April and October but the FAHRenergy HRV system delivers sufficient heat from the sun to
compensate for the needed energy.

28Mar2011 www.fahrenergy.co.uk P: 12
MeasuringEfficiency.doc Copyright FAHRenergy Ltd. 2005 to 2013
Yearly Heating Efficiency Changes
KWh/°C is calculated from the average daily energy consumption divided by the difference
between the 18°C average room temperature and the monthly average outside temperature.
The chart shows that the energy consumption increases as the outside temperature decreases.
This effect arises from the heat pump which has a lower Cop (Coefficient of Power) at lower
temperatures. The polynomial trend curve points this out.
The large and the small ‘top’ of the blue curve arose from high humidity weather conditions
where the outside unit of the heat pump needed excessive defrosting. Outside humidity is
commonly low during severe frost.
Too High Efficiency
Too little and too much spoils everything!
HRV’s with too high a temperature efficiency consume more than 25% of the energy recovered
for humidity mitigation. This reduces the energy actually recovered to less than 60% for a HRV
which was measured to 80% in the laboratory.
A CoP (Coefficient of Power) below 4 is common for this type of HRV’s.
To obtain this ‘higher efficiency’ humidity mitigation through heaters and control electronics are
added. An energy consuming and expensive design.