healthcare efficiency assessment using dea analysis in the
TRANSCRIPT
RESEARCH Open Access
Healthcare efficiency assessment using DEAanalysis in the Slovak RepublicRobert Stefko1, Beata Gavurova2* and Kristina Kocisova2
Abstract
A regional disparity is becoming increasingly important growth constraint. Policy makers need quantitativeknowledge to design effective and targeted policies. In this paper, the regional efficiency of healthcare facilities inSlovakia is measured (2008–2015) using data envelopment analysis (DEA). The DEA is the dominant approach toassessing the efficiency of the healthcare system but also other economic areas. In this study, the windowapproach is introduced as an extension to the basic DEA models to evaluate healthcare technical efficiency inindividual regions and quantify the basic regional disparities and discrepancies. The window DEA method waschosen since it leads to increased discrimination on results especially when applied to small samples and it enablesyear-by-year comparisons of the results. Two stable inputs (number of beds, number of medical staff), three variableinputs (number of all medical equipment, number of magnetic resonance (MR) devices, number of computedtomography (CT) devices) and two stable outputs (use of beds, average nursing time) were chosen as productionvariable in an output-oriented 4-year window DEA model for the assessment of technical efficiency in 8 regions.The database was made available from the National Health Information Center and the Slovak Statistical Office, aswell as from the online databases Slovstat and DataCube. The aim of the paper is to quantify the impact of thenon-standard Data Envelopment Analysis (DEA) variables as the use of medical technologies (MR, CT) on the resultsof the assessment of the efficiency of the healthcare facilities and their adequacy in the evaluation of themonitored processes. The results of the analysis have shown that there is an indirect dependence between thevalues of the variables over time and the results of the estimated efficiency in all regions. The regions that had lowvalues of the variables over time achieved a high degree of efficiency and vice versa. Interesting knowledge wasthat the gradual addition of variables number of MR, number of CT and number of medical devices together, tothe input side did not have a significant impact on the overall estimated efficiency of healthcare facilities.
Keywords: Healthcare system, Healthcare technical efficiency, Data envelopment analysis, Healthcare facility,Regional disparity
BackgroundThe issue of healthcare in its broader concept falls withinthe public sector. The public sector is often viewed in termsof the efficient use of public resources. In the Slovak Re-public [23, 24, 62], but also in other countries, several stud-ies have been carried out to evaluate the efficiency of publicorganizations, including hospital facilities [26, 47, 58].Potential users of performance measurement results in thehealthcare system are governments, regulators, healthcareproviders, and the general public. The significant systemiccomplexity of the healthcare sector determines the
analytical level of research studies and the choice of ad-equate methods for assessing the efficiency of the health-care sector. Their application is influenced by both theresearch objectives and the available database. Due to sig-nificant systemic changes in the healthcare sector relatedto the ongoing source of diagnosis and treatmentprocesses, these changes should also be reflected in theoutputs of these processes (increasing efficiency in thesector). Some methods may be sensitive to the implemen-tation of so-called non-standard variables, in others the in-fluence is minimal. The research question is to determineto what extent the standard application of methods usingclassical variables is sufficient for national and inter-national comparison of the efficiency of the surveyed
* Correspondence: [email protected] of Economics, Technical University of Kosice, Kosice, SlovakiaFull list of author information is available at the end of the article
© The Author(s). 2018 Open Access This article is distributed under the terms of the Creative Commons Attribution 4.0International License (http://creativecommons.org/licenses/by/4.0/), which permits unrestricted use, distribution, andreproduction in any medium, provided you give appropriate credit to the original author(s) and the source, provide a link tothe Creative Commons license, and indicate if changes were made.
Stefko et al. Health Economics Review (2018) 8:6 https://doi.org/10.1186/s13561-018-0191-9
units. In the context of the above, the goals of our contri-bution were set, with the result and process line. The pri-mary objective of the contribution was to evaluatehealthcare technical efficiency in individual regions on thebasis of the theoretical backgrounds, practical experienceand secondary research on the current state of healthcarefacilities in Slovakia and quantify the basic regional dispar-ities and discrepancies. The secondary objective is toquantify the impact of the non-standard variables in DEArelated to the use of medical technologies (MR, CT) onthe results of the evaluation of the efficiency of the health-care facilities and their adequacy in the evaluation of themonitored processes. To evaluate the technical efficiencyof healthcare facilities at the regional level, we used the ex-tended DEA window analysis, under the conditions ofconstant (CCR model) as well as the variable return toscale (BCC model). The database was made available fromthe National Health Information Center and the SlovakStatistical Office, as well as from the online databasesSlovstat and DataCube. The input and output variableshave been compiled on the basis of a detailed analysis ofthe most commonly used variables in research studies andtaking into account the theoretical rules for the construc-tion of DEA models and limitations for sample sizedetermination.
Data envelopment analysis and its analytical andapplication aspects in healthcareDEA window analysis has been used by several types ofresearch over the past two decades. Its particular appli-cation in the healthcare sector can be found in studies ofKazley and Ozcan [33] or Jia and Yuan [31]. In Slovakia,the issue of healthcare and the application of the DEAwindow analysis method were dealt with by Sendek et al.[60], who focused on assessing the efficiency of hospitalsin the Czech and Slovak Republics using the BCCmodel. Many authors prefer the application of DEAmethods due to several advantages like simultaneous useof multiple inputs and outputs (e.g. [13, 16, 27, 28, 34]),it does not require a mathematical specification of theproduction function (e.g. [13, 27, 28, 50]), it is most ap-propriate to investigate the impact of exogenous vari-ables [32], suggests recommendations for an inefficientproduction unit [49]. On the other hand, its applicationspectrum is eliminated by several disadvantages, resp.limitations. The most important are results are sensitiveto outlier values (e.g. [29, 45, 49, 57, 66]), it’s just aboutmeasuring relative efficiency [28, 49, 56], limitation forthe sample size [38].When choosing a DEA model, it isnecessary to define initially if the input or output-oriented method will be used. The used methods are dif-ferent for application to the healthcare sector. Theoutput-oriented method is preferred by Araújo et al. [2],Hernandez and San Sebastian [28], Oikonomou et al.
[51], Li and Dong [38], Karagiannis [32], Cheng et al.[13], Villalobos et al. [66]; Mujasi et al. [49], Mahate etal. [45], De Souza et al. [18]. The input-oriented methodwas used in studies presented by Grosskopf et al. [27],Kontodimopoulos et al. [34], Czypionka et al. [16], Reza-pour et al. [57], Büchner et al. [10], Fragkiadakis et al.[22]. Opinions on DEA and its benefits vary. Hernandezand San Sebastian [28] stated that in the case of primaryand secondary healthcare, inputs are uniform and low,and health outcomes could increase at efforts to achieveimproved health promotion. They also point out that inmany cases the needs for healthcare services are poorlymet. In such situations, it would be unethical to reducethe amount of provided healthcare services to improvehospital efficiency. Cheng et al. [13] justify the choice ofoutput orientation due to limited control of hospital man-agers over their inputs and controlled decisions on recruit-ment and investment by government departments.Oikonomou et al. [51] justified the choice of an output-oriented model because the demand for primary healthcare services has a tendency to expand and not to decrease.According to these authors, lowering inputs in theprovision of health services is undesirable, while increasingoutputs is feasible. Based on the study of literature, we de-cided to use an output-oriented model in our analysis, asthe primary objective in the field of healthcare is the humanhealth. When questioning hospital efficiency, it is importantto focus attention on the quality of the services provided,on the quantity and satisfaction of patients and to focus onincreasing patient satisfaction due to a better and betterhealthcare system. This will result in more treatment, moreperformance, more hospitalization, more release, and, as aresult, an increase in quality of life and health, decreasinglevels of disease mortality, late diagnosis and inadequatetreatment. From a moral point of view, the healthcaresystem is specific and the aim of hospitals and healthcarefacilities should not be to reduce inputs and costs but toconcentrate on increasing outputs in the form of theabove-mentioned objectives. For this reason, we prefer touse an output-oriented DEA model. The second importanttheoretical decision in DEA specification is the applicationof return to scale. The model assuming the constant returnto scale was defined by Charnes et al. [12] and is marked asthe CCR model. Second, the model assuming with thevariable return to scale was described by Banker et al. [3]and is labelled as BCC. In the context of the defined goals,we decided to apply both approaches and compare theresults achieved through both types of models.
MethodsData Envelopment Analysis (DEA) is the dominant non-parametric approach to evaluate the efficiency of Deci-sion-Making Units (DMU). From the point of view ofassessing the efficiency of healthcare, DMUs can represent
Stefko et al. Health Economics Review (2018) 8:6 Page 2 of 12

different levels of healthcare, including a complete health-care system in the country, districts, hospitals, specific ser-vice providers, departments, or individual physicians. Theefficiency of the DMU represents its distance from the effi-ciency frontier. The location and shape of the efficiencyfrontier depend on the user data and the used assumptions(a type of return to scale, input or output orientation). Theefficiency frontier arises by plotting the relationship be-tween the number of inputs and the outputs achieved inthe two-dimensional space. This is a combination of indi-vidual tracking relationships between inputs and outputs.The construction of the efficiency frontier is based on theprinciple of the best estimate, so we only regard it as an ap-proaching reality [15]. From a historical point of view, weconsider Farrell and his work in 1957 to lay the foundationsof the DEA method. Farrell [21], in his work, starts tomeasure efficiency by assuming that only one input entersthe model and production unit produces only one output.However, as the authors of the first comprehensive modelare considered Charnes et al. [12], who extended the ori-ginal Farrell’s model. This basic model is referred to by theinitials of its authors, the CCR model, assuming that theproduction unit operates under the conditions of constantreturn to scale. The second basic model was developed byBanker et al. [3], named as the BCC model and is based onthe assumption of the variable return to scale.In the healthcare sector, there is imperfect competition,
which is manifested by limited funding opportunities,market entry regulation, merger or market exit constraintsresulting in inefficient management, so it is necessary toapply the BCC model in addition to the CCR model. DEAmodels can be input, or output oriented. While in the caseof input-oriented models we try to find out the minimallevel of inputs which is needed to produce a given level ofoutputs. Under the output-oriented models, we try to findout the answer which maximum level of outputs can beachieved by using the given level of inputs in order forDMUs to be considered effective.In order to evaluate the technical efficiency of the
healthcare system at the level regions of the Slovak Re-public, we decided to apply the output-oriented models,CCR and BCC, based on the DEA window analysis. Out-put oriented CCR model can be formulated in thematrix form by the following formula:
Maximize g ¼ ϕq þ ε eT sþ þ eT s−� �
Under conditions Xλþ s− ¼ xqYλ−sþ ¼ ϕqyqλ; sþ; s− ≥0
ð1Þ
where: ε – constant, q – evaluated DMU, yq– output ofevaluated DMUq, xq– input of evaluated DMUq, s+ands−are slack variables for input and outputs.
As stated by Jablonský and Dlouhý [30] based onthe model (1), the production unit is evaluated as ef-fective if the optimal value of the function g* = 1 andall complementary variables are equal to zero. If thisvalue is above 1, the DMU cannot be considered asan efficient and the optimal value ϕ�
q expresses the
need for a proportional increase in inputs to achieveefficiency. Assuming that production units operateunder the variable return to scale (increasing, de-creasing, non-increasing, non-decreasing), we applythe BCC output-oriented model, where we add a con-vexity condition: eTλ = 1.When evaluating efficiency, we can sometimes en-
counter a limited number of DMUs. To overcome thisproblem, a so-called DEA window analysis was created.It allows us to compare the efficiency of a limited num-ber of DMUs in individual periods and to analyzechanges in efficiency over time. DEA window analysisgeneralizes the idea of moving averages to uncover thetrend of DMU efficiency development over time. Themoving average method is used to compile a differentsample to determine the relative efficiency of eachDMU. Based on the dynamic perspective, each DMU isconsidered as a separate unit in individual time periodsin individual windows [15]. The input and output vari-ables of DMU in the selected period are compared tothat of other DMUs in all periods. We also compare theresults of DMU from one period with the results of thesame unit in the remaining periods. If the window ismoved for the first time, at the same time the firstperiod is deleted in each window and a new period isadded. The benefit of this method is a comprehensivedescription of dynamic changes of the efficiency of eachDMU, both horizontal and vertical. Of course, the mainbenefit is what we mentioned in the beginning, increas-ing the number of DMUs, which increases the discrim-inatory power in situations with a limited number ofDMUs in the sample [31].We assume a sample N (n = 1,...,N) DMUs during T (t
= 1,...,T) periods of time. Each DMU uses r different in-puts to produces s different outputs. If DMUn
t is a com-bination of inputs and outputs for the Nth unit of theDMU in the T period, then the input vector Xn
t and out-put vector Yn
t can be written as follows:
Xtn ¼
x1tn⋮xrtn
24
35 Y t
n ¼y1tn⋮ystn
24
35 ð2Þ
If the window starts in time k (1 ≤ k ≤ T) and thewidth of the window is w (1 ≤ k ≤ T-k), then inputmatrix (Xk
w) and output matrix (Ykw) of each window
will look like as follows:
Stefko et al. Health Economics Review (2018) 8:6 Page 3 of 12

Xwk ¼
xk1 xk2⋮ ⋮
xkþw1 xkþw
2
⋯ xkN⋱ ⋮⋯ xkþw
N
24
35
Ywk ¼
yk1 yk2⋮ ⋮
ykþw1 ykþw
2
⋯ ykN⋱ ⋮⋯ ykþw
N
24
35
ð3ÞAppropriate determination of window size and win-
dow length are used by Cooper et al. [15] where we usethe following labels: n = number of DMU, k = number ofperiods, p = window length (p ≤ k), w = number of win-dows. The following relationships apply to:number of windows:
w ¼ k−pþ 1 ð4Þnumber of DMU in each window:
np=2 ð5Þnumber of different DMUs:
npw ð6ÞΔ number of DMU (increase in number):
n p−1ð Þ k−Pð Þ ð7ÞTo derive the total number of different DMUs, Cooper
et al. [15] mention the following relationship:
n k−pþ 1ð Þp ð8ÞIf we put the last equation equal to 0, we get a rela-
tionship for calculating the length of window:
p ¼ k þ 12
ð9Þ
To always reach an integer, the relationship applies:
p ¼k þ 12
;when k is odd;
k þ 12
� 12
;when k is even:
8><>:
ð10Þ
In this paper, we will analyze the Slovak health caresystem. We have decided to monitor the DMU at the re-gional level as the best comparable minimum level oftracking. The smaller division into districts was nottaken into account due to the lack of availability ofmicrodata at the relevant regional level. The indicatorsmonitored by multinational organizations are used asthe smallest regional level of NUTS 3, which is thebreakdown in the region when applying to Slovakia. InSlovakia, we have a total of eight districts. In the firststep, DEA window analysis is performed to calculate thetechnical efficiency of healthcare facilities in the relevant
regions. The selection of the DEA analysis is influencedby a number of sources that use the DEA method to as-sess the efficiency of medical devices. A review of the lit-erature using the DEA method can be seen in the workof Worthington [68].Due to the frequent criticism of the DEA method which
is based on its nonparametric nature and is mirrored in asmall statistical basis, one of the most important steps isthe right choice of input and output variables. After thestudy of relevant literature, we decide to use five inputand three output variables in our analysis. The specifica-tion of the variables used in the DEA, their summary over-view and the brief definition are given in Table 1.The number of beds is an indicator that reflects the
size of the hospital. It is clear from this indicator thateach added bed means an extra cost to the hospital forits purchase and future operation. On the other hand,the beds mean the possibility of providing basic hospitalservices, thus bringing the marginal profit to the hos-pital. Whether directly from the patient or from healthinsurance companies that reimburse hospitals for pay-ments made for medications, consumed other medicalsupplies besides drugs themselves. The number of bedsis one of the most commonly used indicators for com-paring hospitals across the country. This fact was putforward by Wagstaff [67] in his study in the evaluationof Spanish hospitals in 1977–1981. Ley [37] had a sam-ple of 139 Spanish hospitals, Valdmanis [64] comparedUS hospitals in Michigan, Byrnes and Valdmanis [8]compared the sample of 123 Californian hospitals,Kooreman [35] analysed nursing houses in theNetherlands, Zuckerman et al. [69] compared an exten-sive sample to 4149 American hospitals, Lopez-Valcarcel
Table 1 Specification of DEA model variables
Labels Variable Definition
Input variables
x1 Number of beds Total number of beds inthe health facility
x2 Number of medical staff Total number of medicalstaff, including the numberof physicians and nurses
x3 Number of CT Number of computedtomography (CT) devices
x4 Number of MR Number of magneticresonance (MR) devices
x5 Number of medicalequipment together
Number of all medical devices
Output variables
y1 Bed occupancy rate Percentage use of the totalnumber of beds
y2 Average nursing time indays
Ratio of treatment days tothe total number ofhospitalized patients
Source: Prepared by authors
Stefko et al. Health Economics Review (2018) 8:6 Page 4 of 12

and Perez [42] compared the efficiency of Spanish hospi-tals in 1991–1993 with the DEA and Stochastic FrontierApproach (SFA) method; Magnussen [44] evaluated theefficiency of Norwegian hospitals, Parkin and Hollings-worth [52] evaluated hospitals in Scotland, Linna [39]compared the results of the efficiency of the SFA, DEAand Malmquist methods on a sample of 43 Finnish acutecare hospitals, Burgess and Wilson [9] compared 1545US hospitals using DEA, Linna et al. [40] followed asample of 48 Finnish acute care hospitals, Gerdtham etal. [25] compared 26 Swedish hospitals using SFA, andManiadakis and Thanassoulis [46] analyzed the effi-ciency of 75 Scottish hospitals for a 5 year period. Sev-eral authors used a variable number of beds forinternational comparisons, such as Varabyova andSchreyögg [65], who compared OECD countries to eachother. Dervaux et al. [17] compared the French andAmerican hospitals, Samut and Cafri [59] compared 29OECD countries between 2000 and 2010, Mobley andMagnussen [48] were using the DEA analysis to com-pare public, highly regulated Norwegian hospitals with aprivate, highly competitive unregulated system hospitalsin California, USA.The number of the medical staff represents the regis-
tered number of employees in natural persons, being thesum of the number of doctors, dentists, pharmacists,nurses, midwives, laboratory technicians, assistants,technicians and other health workers. With the authorsMaestre et al. [43], Baray and Cliquet [4], we see thetracking of the basic indicator as the total number ofemployees without subdivision of employees into sub-groups. According to these authors, the total number ofemployees is the basic indicator needed to monitor theeconomic outturn. The indicator also reflects the size ofthe patient’s catchment area, which according to thegeographical location of the hospital is used by the par-ticular hospital [43]. Employee tracking alone has notelling value. Of course, the number of employees islargely affected by the increase in wage costs, with eachadditional employee in employment [4]. An indicator ofthe total number of employees was used in the studiesby Byrnes and Valdmanis [8], Kooreman [35], Lopez-Valcarcel and Perez [42], Magnussen [44], Parkin andHollingsworth [52], Maniadakis and Thanassoulis [46].The total number of medical personnel, other technicalpersonnel, and the number of non-medical personnelwas used as an input variable by Cheng et al. [13] whoused variable numbers of doctors, nurses, and the num-ber of administrative and other staff. Czypionka et al.[16] used the variable of medical and non-medical staff,Varabyova and Schreyögg [65], and Li and Dong [38]used the variable of employees for the DEA model,Mahate et al. [45] distributed input variables to physi-cians, dentists, nurses, pharmacists, administrative and
other workers to estimate technical efficiency. Fragkiada-kis et al. [22] used inputs such as clinical staff, nursesand administrative staff, Rezapour et al. [57] used thetotal staff of hospitals in the aggregate variable: humanresources. Blank and Valdmanis [6] used a variable todescribe the efficiency of hospitals: employees and ad-ministrators, nurses, medical staff, other staff. Variablemedical equipment denounces the overall technicalequipment of hospitals and medical facilities and isexpressed in pieces. In particular, we monitor the totalnumber of technical devices including radiograph, mam-mography, positron tomograph, linear accelerators, elec-troencephalographs, ultrasound devices, brachytherapydevices, urethroscopes, bronchoscopes, endoscopes,laparoscopes, arthroscopes, tomographs, angiography,monitoring devices, ultraviolet and infrared emitters,colposcopes, laryngoscopes and pharyngoscopes, dialysismonitors, gamma cameras, isotopic irradiators, electro-myographs, agnetic resonance, lithotriptors, cytoscopes,colonoscopes, sigmoidoscopes and rectoscopes, gastro-scopes and duodenoscopes, cryogenic devices. Particu-larly, we focus on variable magnetic resonance (MR) andcomputed tomography (CT) devices, as they are themost widely used devices for the diagnosis of diseasesand injuries in the human body. Some authors have usedvariable medical devices as a whole, like Grosskopf et al.[27] who used as inputs assets all buildings and facilities.Zuckerman et al. [69] used as an input variable the indexof high-tech services. Puig-Junoy [54] used as one of theinput variables the technological availability measured asa proportion of 33 technological items available in theintensive care unit expressed as a percentage. Bradfordet al. [7] used the variable use of established and newtechnology. Dey et al. [19] used as a variable “capital fa-cilities”, defined as the provision of up-to-date techno-logical equipment and equipment, also referred to in thesecond subcategory “maintenance” defined as reasonableand regular maintenance of medical equipment by thebiomedical team of engineers. Chang and Lan [11] stud-ied the impact of using new technologies on early diag-nosis and treatment, Tsekouras et al. [63] monitored theimpact of purchasing new high-tech medical devices toincrease production efficiency, Kounetas and Papatha-nassopoulos [36] monitored the efficiency of Greek hos-pitals and the impact on efficiency by introducingadvanced medical facilities, Rezaee and Karimdadi [56]used the input medical device, Oikonomou et al. [51]used the biomedical technology variable, which it di-vided by weight into a fully operational microbiologicaland imaging laboratory and a group of twenty diagnostictherapeutic and auxiliary devices, Ancarani et al. [1] ex-amined the impact of the acquisition of relevant medicaltechnologies and information technologies on the effi-ciency of hospital departments in three state hospitals in
Stefko et al. Health Economics Review (2018) 8:6 Page 5 of 12
Dubai. The impact of the introduction of informationtechnology on the efficiency of the health system wasalso examined by Šoltés et al. [61]. Another group of au-thors focused on monitoring only individual MR or CTdevices: Lo et al. [41], who monitored the effect of theMR, CT, röntgen, Chirikos and Sear [14] variable scandevices, used composite indices to measure efficiency,reflecting special MR tests and procedures. Retzlaff-Roberts et al. [55] used the number of MR devices permillion population to confirm the growth and necessityof healthcare technologies, and Samut and Cafri [59]used input variables to count the MR and CT devicesper 100,000 inhabitants.Bed occupation is used by many authors in their stud-
ies, Kooreman [35], Linna [39], Chirikos and Sear [14],Perera et al. [53], Belciug and Gorunescu [5], Dy et al.[20], Rezaee and Karimdadi [56], Rezapour et al. [57].An indicator of the use of the bed fund generally refersto the percentage utilization of the total number of hos-pital beds for a specified period, typically a calendar year[5]. As noted by Dy et al. [20], this indicator directly re-flects the use of resources available to the hospital. Toolow the value of the use of bedding is a warning signalfor inefficient use of financial resources and hospitalcapacities, which should lead to a reduction in the num-ber of beds with unchanged patient satisfaction, but tolower the cost of bed operation and maintenance [53].The number of beds is directly related to the ownershipof immovable property. Finding the optimal size of theuse of bedding is key to effective hospital management.The Average Length of Stay (ALOS) tells you the lengthof the patient’s length on the bed in the facility. It is cal-culated as a proportion of the total number of treatmentdays and the number of hospitalized patients. If the aver-age treatment time would be reduced, the total costswould be reduced as the cost of treating the patient onthe bed would be reduced. Also, the trend of lower-costoutpatient treatment is also reduced in even more compli-cated cases. On the other hand, there is a presumptionthat shorter stays are more demanding and thereforeexpensive. If the patient is discharged too quickly andhealing is not possible, re-hospitalization may occur,which may even increase the cost. The variable averagetreatment time in days was used by Kooreman [35],Chirikos and Sear [14], Varabyova and Schreyögg, [65] toinvestigate the efficiency of DEA patients.
Results and discussionThe analysis was done using a narrower sample of yearsunder review for the period 2008 to 2015. The reasonfor narrowing the sample is the consistency of data onmedical devices and specific MR and CT devices re-ported since 2008. Therefore it was not able to use datasince 2000. The total number of DMUs is 8 regions in
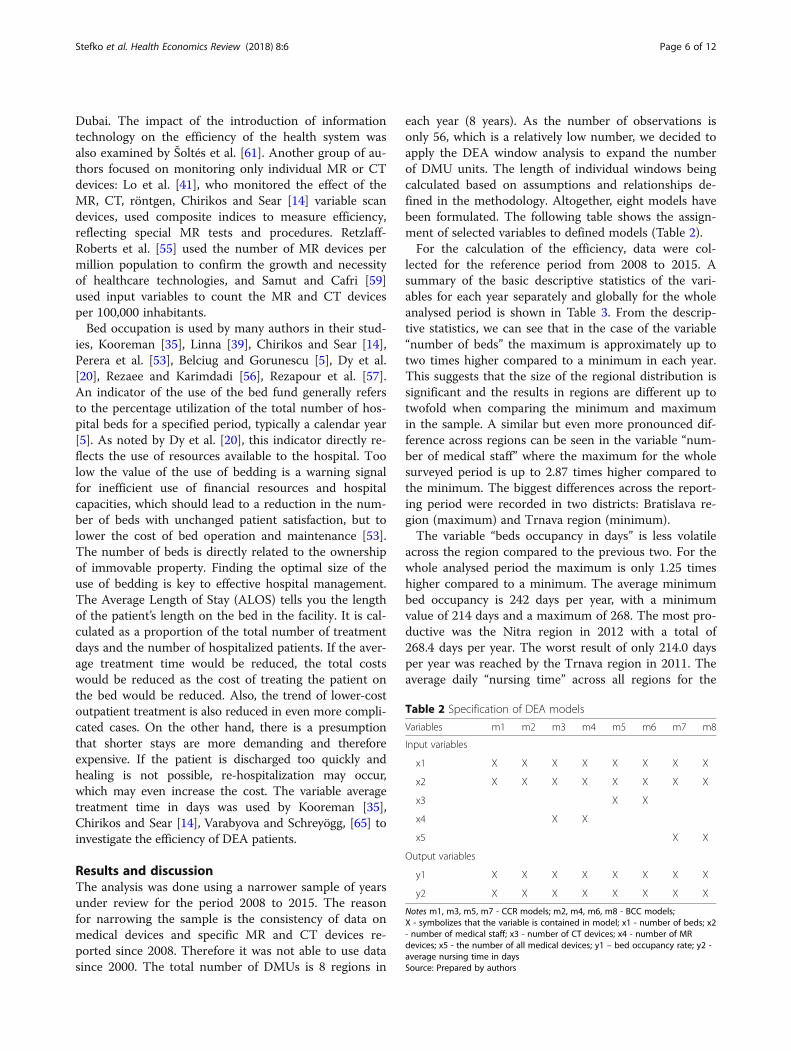
each year (8 years). As the number of observations isonly 56, which is a relatively low number, we decided toapply the DEA window analysis to expand the numberof DMU units. The length of individual windows beingcalculated based on assumptions and relationships de-fined in the methodology. Altogether, eight models havebeen formulated. The following table shows the assign-ment of selected variables to defined models (Table 2).For the calculation of the efficiency, data were col-
lected for the reference period from 2008 to 2015. Asummary of the basic descriptive statistics of the vari-ables for each year separately and globally for the wholeanalysed period is shown in Table 3. From the descrip-tive statistics, we can see that in the case of the variable“number of beds” the maximum is approximately up totwo times higher compared to a minimum in each year.This suggests that the size of the regional distribution issignificant and the results in regions are different up totwofold when comparing the minimum and maximumin the sample. A similar but even more pronounced dif-ference across regions can be seen in the variable “num-ber of medical staff” where the maximum for the wholesurveyed period is up to 2.87 times higher compared tothe minimum. The biggest differences across the report-ing period were recorded in two districts: Bratislava re-gion (maximum) and Trnava region (minimum).The variable “beds occupancy in days” is less volatile
across the region compared to the previous two. For thewhole analysed period the maximum is only 1.25 timeshigher compared to a minimum. The average minimumbed occupancy is 242 days per year, with a minimumvalue of 214 days and a maximum of 268. The most pro-ductive was the Nitra region in 2012 with a total of268.4 days per year. The worst result of only 214.0 daysper year was reached by the Trnava region in 2011. Theaverage daily “nursing time” across all regions for the
Table 2 Specification of DEA models
Variables m1 m2 m3 m4 m5 m6 m7 m8
Input variables
x1 X X X X X X X X
x2 X X X X X X X X
x3 X X
x4 X X
x5 X X
Output variables
y1 X X X X X X X X
y2 X X X X X X X X
Notes m1, m3, m5, m7 - CCR models; m2, m4, m6, m8 - BCC models;X - symbolizes that the variable is contained in model; x1 - number of beds; x2- number of medical staff; x3 - number of CT devices; x4 - number of MRdevices; x5 - the number of all medical devices; y1 – bed occupancy rate; y2 -average nursing time in daysSource: Prepared by authors
Stefko et al. Health Economics Review (2018) 8:6 Page 6 of 12

whole of the monitored period was declining, so the re-gions reduced the caregiving time for the referenceperiod 2008 to 2015. The highest average nursing times
were in Kosice region in 2008 and the Nitra region intwo consecutive periods 2009 and 2010. The shortestnursing time was 6.8 days in the Trnava region in 2014and 2015. For the indicator, the number of MR devices,the differences can be again marked across regions. Thelowest number of MR devices was recorded in the Tren-cín region in 2008 - 2012 and the highest number in theBratislava region in 2011. The average in all regions is4 MR devices. The number of CT devices is l higher com-pared to MR ones. The average over the monitoredperiod is 10 CT devices. The most CT devices werein Bratislava in 2010 with a total of 18 CTs. The variabletotal number of medical equipment brings the largestdifference between the maximum value of 2163 devicesin the Bratislava region and the minimum of 571 devicesin the Trencín region, both in 2008. As regards the me-dian values of the variables in the monitored period, thefollowing situations occurred. The number of beds fellfrom 4285 to 3945, a decrease of 8%. The number ofhealth workers dropped from 9539 to 9264, a decreaseof 3%. The use of beds in days increased from 242 to249 days, an increase of 3%. Average nursing time indays decreased from 9 to 8, a decrease of 11%. Thenumber of CT devices has increased from 9 to 11, whichis a 22% increase. A drop from 5 to four MR devices rep-resents a 20% drop. And finally, the number of medicalequipment has risen from 974 units to 1098 units, an in-crease of 13%.Estimated efficiencies for the years 2008–2015 using
DEA analysis of different models are shown in Table 4.According to the m1 model, the Trnava, Trencin, Nitraand Banska Bystrica regions reached average efficienciesabove the average of the whole sample. Below the aver-age, there are the remaining regions, namely Zilina,Bratislava, Presov and Kosice region. The efficiencyscore equal to one can be seen in the Trnava region in2008, 2011, 2012 and 2015. The Trencin region is effi-cient in 2011, 2012 and 2015. The third region thatachieved efficiency equal to 1 is the Nitra region in2009. The best average values reached the Trnava regionwith the value of 0.9929. On the other hand, the mini-mum average value was achieved in Kosice region(0.5262). The Kosice region recorded the biggest change,decreased by 13.74%. Besides Kosice region, the Zilinaregion (10.80%) and the Presov region (9.29%) also fell.The largest increase was recorded in the Banska Bystricaregion (5.73%).The m2 model compared to the m1 model reached
higher average efficiency (0.9624). The average efficien-cies above the average were also achieved by the Trencinand Trnava regions, as in the m1 model. Also, the Nitraregion achieves efficiency at level 1, namely in 2009–2012, 2014 and 2015. According to the model m2, theBanska Bystrica, Zilina, Presov and Kosice region are
Table 3 Summary descriptive statistics of variables incalculating efficiency using DEA
Variables
x1 x2 y1 y2 x3 x4 x5
2015 Min 2437 6022 221 7 7 2 813
Max 5381 17,299 263 9 15 9 1720
Average 3934 10,040 244 8 11 5 1149
Median 3945 9264 249 8 11 4 1098
2014 Min 2408 6202 218 7 7 2 813
Max 5554 17,248 267 8 15 9 1720
Average 3952 9966 245 8 11 5 1149
Median 3934 8995 248 8 11 4 1098
2013 Min 2373 6134 223 7 6 1 787
Max 5563 17,054 264 8 15 10 2100
Average 3954 9933 245 8 10 4 1182
Median 3956 8787 251 8 10 3 1214
2012 Min 2348 6120 224 7 6 0 746
Max 5356 17,127 268 8 15 9 2055
Average 4030 9904 246 8 10 4 1277
Median 3931 9056 249 8 10 3 1165
2011 Min 2533 6246 214 7 6 0 674
Max 5736 17,163 263 9 16 11 1999
Average 4119 9855 237 8 10 5 1232
Median 3954 8790 242 8 9 3 1114
2010 Min 2637 6424 215 7 6 0 666
Max 5934 16,472 258 9 18 11 1954
Average 4392 9944 238 8 9 5 1196
Median 4233 9040 243 8 8 4 1086
2009 Min 2568 6483 217 7 5 0 581
Max 5988 16,031 251 9 13 10 1901
Average 4440 9745 238 8 9 4 1122
Median 4326 8977 241 9 9 5 1056
2008 Min 2558 6513 221 8 4 0 571
Max 5930 15,405 251 9 14 10 2163
Average 4460 9892 239 8 9 4 1100
Median 4285 9539 242 9 9 5 974
2008–2015 Min 2348 6022 214 7 4 0 571
Max 5988 17,299 268 9 18 11 2163
Average 4162 9898 242 8 10 4 1193
Median 4078 9475 244 8 9 4 1118
Notes x1 - number of beds in pieces; x2 - number of medical staff in persons;x3 - number of CT devices; x4 - number of MR devices; x5 - the number ofall medical devices; y1 – beds occupancy in days;y2 - average nursing time in daysSource: Own calculations
Stefko et al. Health Economics Review (2018) 8:6 Page 7 of 12
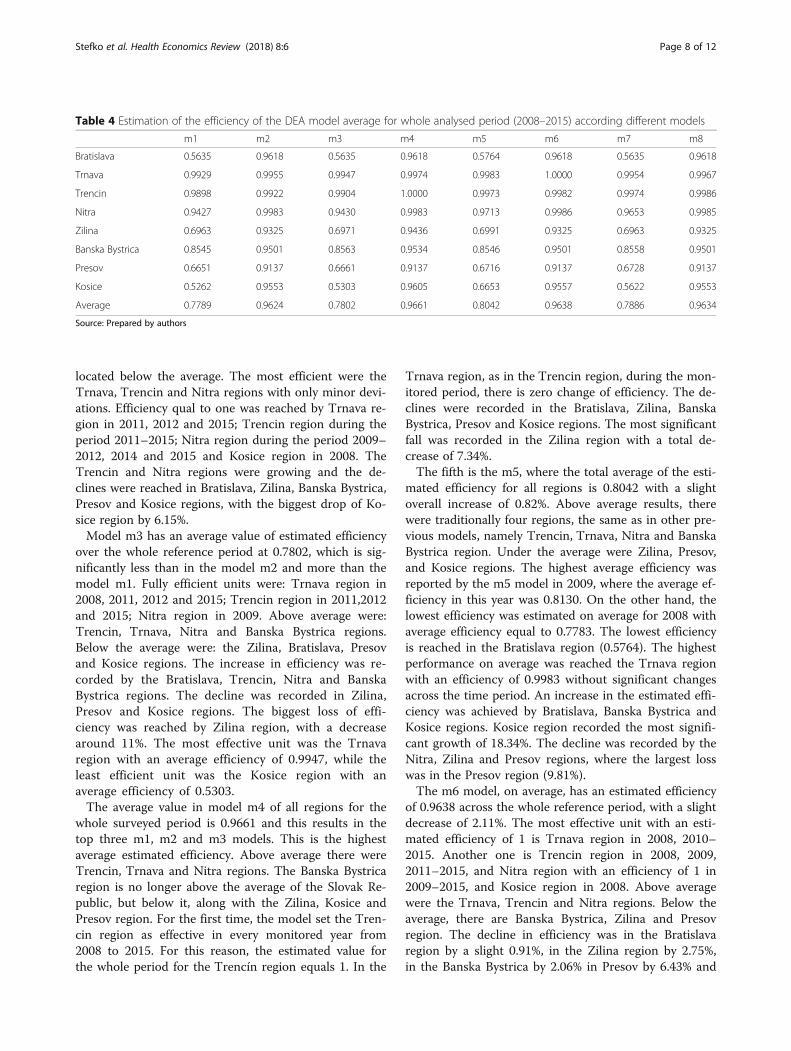
located below the average. The most efficient were theTrnava, Trencin and Nitra regions with only minor devi-ations. Efficiency qual to one was reached by Trnava re-gion in 2011, 2012 and 2015; Trencin region during theperiod 2011–2015; Nitra region during the period 2009–2012, 2014 and 2015 and Kosice region in 2008. TheTrencin and Nitra regions were growing and the de-clines were reached in Bratislava, Zilina, Banska Bystrica,Presov and Kosice regions, with the biggest drop of Ko-sice region by 6.15%.Model m3 has an average value of estimated efficiency
over the whole reference period at 0.7802, which is sig-nificantly less than in the model m2 and more than themodel m1. Fully efficient units were: Trnava region in2008, 2011, 2012 and 2015; Trencin region in 2011,2012and 2015; Nitra region in 2009. Above average were:Trencin, Trnava, Nitra and Banska Bystrica regions.Below the average were: the Zilina, Bratislava, Presovand Kosice regions. The increase in efficiency was re-corded by the Bratislava, Trencin, Nitra and BanskaBystrica regions. The decline was recorded in Zilina,Presov and Kosice regions. The biggest loss of effi-ciency was reached by Zilina region, with a decreasearound 11%. The most effective unit was the Trnavaregion with an average efficiency of 0.9947, while theleast efficient unit was the Kosice region with anaverage efficiency of 0.5303.The average value in model m4 of all regions for the
whole surveyed period is 0.9661 and this results in thetop three m1, m2 and m3 models. This is the highestaverage estimated efficiency. Above average there wereTrencin, Trnava and Nitra regions. The Banska Bystricaregion is no longer above the average of the Slovak Re-public, but below it, along with the Zilina, Kosice andPresov region. For the first time, the model set the Tren-cin region as effective in every monitored year from2008 to 2015. For this reason, the estimated value forthe whole period for the Trencín region equals 1. In the
Trnava region, as in the Trencin region, during the mon-itored period, there is zero change of efficiency. The de-clines were recorded in the Bratislava, Zilina, BanskaBystrica, Presov and Kosice regions. The most significantfall was recorded in the Zilina region with a total de-crease of 7.34%.The fifth is the m5, where the total average of the esti-
mated efficiency for all regions is 0.8042 with a slightoverall increase of 0.82%. Above average results, therewere traditionally four regions, the same as in other pre-vious models, namely Trencin, Trnava, Nitra and BanskaBystrica region. Under the average were Zilina, Presov,and Kosice regions. The highest average efficiency wasreported by the m5 model in 2009, where the average ef-ficiency in this year was 0.8130. On the other hand, thelowest efficiency was estimated on average for 2008 withaverage efficiency equal to 0.7783. The lowest efficiencyis reached in the Bratislava region (0.5764). The highestperformance on average was reached the Trnava regionwith an efficiency of 0.9983 without significant changesacross the time period. An increase in the estimated effi-ciency was achieved by Bratislava, Banska Bystrica andKosice regions. Kosice region recorded the most signifi-cant growth of 18.34%. The decline was recorded by theNitra, Zilina and Presov regions, where the largest losswas in the Presov region (9.81%).The m6 model, on average, has an estimated efficiency
of 0.9638 across the whole reference period, with a slightdecrease of 2.11%. The most effective unit with an esti-mated efficiency of 1 is Trnava region in 2008, 2010–2015. Another one is Trencin region in 2008, 2009,2011–2015, and Nitra region with an efficiency of 1 in2009–2015, and Kosice region in 2008. Above averagewere the Trnava, Trencin and Nitra regions. Below theaverage, there are Banska Bystrica, Zilina and Presovregion. The decline in efficiency was in the Bratislavaregion by a slight 0.91%, in the Zilina region by 2.75%,in the Banska Bystrica by 2.06% in Presov by 6.43% and
Table 4 Estimation of the efficiency of the DEA model average for whole analysed period (2008–2015) according different models
m1 m2 m3 m4 m5 m6 m7 m8
Bratislava 0.5635 0.9618 0.5635 0.9618 0.5764 0.9618 0.5635 0.9618
Trnava 0.9929 0.9955 0.9947 0.9974 0.9983 1.0000 0.9954 0.9967
Trencin 0.9898 0.9922 0.9904 1.0000 0.9973 0.9982 0.9974 0.9986
Nitra 0.9427 0.9983 0.9430 0.9983 0.9713 0.9986 0.9653 0.9985
Zilina 0.6963 0.9325 0.6971 0.9436 0.6991 0.9325 0.6963 0.9325
Banska Bystrica 0.8545 0.9501 0.8563 0.9534 0.8546 0.9501 0.8558 0.9501
Presov 0.6651 0.9137 0.6661 0.9137 0.6716 0.9137 0.6728 0.9137
Kosice 0.5262 0.9553 0.5303 0.9605 0.6653 0.9557 0.5622 0.9553
Average 0.7789 0.9624 0.7802 0.9661 0.8042 0.9638 0.7886 0.9634
Source: Prepared by authors
Stefko et al. Health Economics Review (2018) 8:6 Page 8 of 12

in Kosice region by 6.01%. The growth was only in oneregion, namely 1.12% in the Nitra region.The average value of efficiency estimated by the m7
model for the whole period from 2008 to 2015 for thewhole of Slovakia is 0.7886 with a total decline of 0.32%.As in all previous models, the above-average wereTrnava, Trencin, Nitra and Banska Bystrica regions.Below the average were Zilina, Presov, Bratislava andKosice regions. Efficiency equal to 1 was achieved by theTrnava region in 2008, 2011, 2012 and 2015; Trencin re-gion in 2008, 2011, 2012 and 2015; and Nitra region in2009. The increase in average efficiency for the wholeanalysed period was reached by the Bratislava region(3.68%), Nitra region (0.49%), Banska Bystrica region(6.75%) and Kosice region (12.70%). On the other side,the decline was recorded in the Zilina region (10,80%)and Presov region (12.82%).The last model in the model group was the model m8.
This model estimates the overall average efficiency forall regions over the observed period of 0.963394 with afall of 2.13%. The Trencin, Trnava and Nitra regions areefficient throughout the whole period under review. Ko-sice region is efficient only in 2008. The increase in effi-ciency was reached by Nitra region (1.12%). In the otherregions, there was a decline in efficiency, namely in theBratislava region by 0.91%, in the Zilina region by 2.75%,in the Banska Bystrica region by 2.06%, in the Presov re-gion by 6.43% and in the Kosice region by 6.15%.After performing efficiency estimates using 8 models
and partial analyzes each of them, we can conclude thatevery model created produces very similar results, nomodel speculated a special extreme value that would beinconsistent with other models. Therefore, we can con-clude that the results shown and described in the previ-ous sections are consistent with regard to the choice ofinput variables and roughly equally estimate the effi-ciency and inefficiency of Slovak regions. We note thatthe gradual substitution of the variables “number ofMR devices ”, “number of CT devices” and “number ofall medical devices ” to input side did not significantlyaffect the overall estimated efficiency of healthcare ser-vices in regions. Based on these findings, we considerthat impact of selected input variables: × 1 - the numberof beds and x2 - the number medical staff, and selectedoutputs: y1 – bed occupancy rate and y2 - average nurs-ing time, was significant, and therefore the adding othervariables affected the overall efficiency only in minimalway. The selection of the variables x1, x2, y1 and y2 iscrucial for the evaluation of the efficiency of healthcaredevices and we have confirmed this in the analysis. Inthe process of evaluation of the impact of medical tech-nology (apparatus and equipment) on the efficiency, werecommend to add inputs or outputs which are directlyresults of the usage of medical technology in the field of
treatment or prevention. In all models of DEA analysis,the regions of Trencin, Trnava and Nitra were repeatedabove the average. Banska Bystrica region was complet-ing them, which was just above the average. In the m2,m4, m6 and m8 they were complemented by the Kosiceregion, but only in 2008, at the beginning of the moni-tored period and then gradually in each of the aforemen-tioned models, the efficiency of the Kosice region hadfallen over time. When we look at the development ofvariables, we repeat ourselves in the overriding values ofthe opposite of the other regions. Above average ofwhole sample during the whole analysed period, ie thehighest average values, were at the x1 - Bratislava, Ko-sice and Presov regions. For variable x2 - the regions ofBratislava, Kosice, Presov and Zilina were above the totalaverage. For variable y1 - the regions of Zilina, Kosice,Bratislava, Nitra and Banska Bystrica were above theoverall average for this variable; y2 - regionsof Bratislava, Nitra, Presov, Kosice and BanskaBystrica were above the y2 overall average; x3- BanskaBystrica, Bratislava and Zilina were above the total aver-age; x4- Bratislava, Kosice, and Presov. were above theaverage; and for the last variable x5 the regions ofBratislava, Zilina and Kosice were above the average ofwhole sample for this variable. We see that Trencinand Trnava regions are not above the average in any in-put and output variables. What is important is whetherthey can provide adequate bad occupancy rate and aver-age nursing time in days with the number of beds andthe number of medical staff. In the deeper analysis andcomparison of the number of beds and the use of beds,we can see that the regions with the highest number ofbeds are using them less than regions with fewer bedsand therefore it is a clear recommendation to reduce thenumber of beds in Bratislava, Kosice, Zilina and Presovregions in order to increase the use of beds, as these re-gions have large surpluses of beds, resp., could increasethe number of hospitals and thus their use. Another wayis to increase their occupancy with unchanged bedcounts. When looking at the ratio of the number ofmedical staff to the second observed variable “averagenursing time in days”, we get similar results as in theprevious situation. In the Bratislava, Kosice and Presovregions, the proportion is too high, suggesting an opti-mal reduction in the number of medical staff. The sameresult is obtained by the proportional variations in thenumber of medical staff in the variable use of beds. Rec-ommendations based on performance analysis are forBratislava, Kosice, Zilina and Presov regions in terms ofoutput orientations for increasing the use of beds withunchanged bed counts and the number of healthworkers. It also comes to our belief that the average timeof care/treatment should be increased for Bratislava, Ko-sice, Zilina and Presov with unchanged beds and medical
Stefko et al. Health Economics Review (2018) 8:6 Page 9 of 12
staff. This outcome is debatable, since increasing theaverage treatment time may mean making more de-manding treatment procedures, hospitalization of whichis demanding, which is desirable in terms of demand forhealth services. There is a tendency to reduce the aver-age treatment time due to the shift of hospitalized per-formance to outpatient care and thus to the treatment ofbeds and the working time of healthcare workers. Un-regulated reductions in average treatment time may leadto re-hospitalizations and re-operations, which reducesefficiency.
ConclusionIn the context of the ongoing globalization processesand pressures on the efficiency of healthcare systems inthe countries, our study focused on analyzing and evalu-ating the efficiency of healthcare facilities in the variousregions of the Slovak Republic in order to detect signifi-cant disparities. We applied the DEA method, used inmany research studies to evaluate the efficiency of thesectors. Estimated efficiencies did not differ significantlyin our models, but were consistent regardless of thechange in input variables. The results of the analysishave shown that there is an indirect dependence be-tween the values of the variables over time and the re-sults of the estimated efficiency in all regions. Theregions that had low values of the variables over timeachieved a high degree of efficiency and vice versa. Inter-esting knowledge was that the gradual addition of vari-ables “number of MR devices ”, “number of CT devices ”and “number of all medical devices ” to the input sidedid not have a significant impact on the overall esti-mated efficiency of healthcare facilities. Technologicaladvances in recent decades have brought many newdiagnostic and therapeutic devices and healthcare prac-tices that are also costly and which are expected to havesignificant health and economic benefits. For this reason,these processes need to be taken into account in systemsfor measuring and evaluating the efficiency of healthcarefacilities. Our DEA method has not uncovered the im-pact of health technologies on health care efficiency,which significantly reduces its importance in the processof quantifying and evaluating efficiency in the future. InSlovakia, unlike in the rest of the world, the use ofHealth Technology Assessment (HTA) is totally absent.The efficiency of outputs from HTA is significantly in-creased by complementary use of adequate efficiencymeasurement methods, which would also take into ac-count disparities and disproportions in the use of newhealth technologies in healthcare units on an aggregatescale. It is only possible to explicitly quantify the healthand economic outcomes of their use and to set up aplatform for national and international benchmarking.
These specific facts encourage the realization of subse-quent research aimed at finding, resp. designing appro-priate systems to measure the efficiency of thehealthcare system and their process interconnection.Their importance is particularly important in the processof creating stabilization and regulatory mechanisms inthe health system and in the development of targetedpolicies.
AcknowledgementsThis research paper is made possible through the support from VEGA ProjectNo. 1/0945/17 Economic research on quantif. of marketing processesimproving values for patients, multidimen. Analysis of the mark. Mix of HCFand quantif. of their importance in the process of establis. A system tomeasure the quality and efficiency.Our thanks go out to the National Health Information Centre of the SlovakRepublic for providing access to the central mortality database for theexplored period as well as the other studied data along with the StatisticalOffice of the Slovak Republic.Our acknowledgments also belong to the Ministry of Health of the SlovakRepublic for its cooperation in creation of the new conceptions andmethodologies and for its support of our research activities.
FundingVEGA Project No. 1/0945/17 - Scientific Grant Agency of the Ministry ofEducation, science, research and sport of the Slovak Republic and the SlovakAcademy of Sciences.
Authors’ contributionsRS initiated the research and the manuscript. RS and BG proposed the studydesign, performed data collection, the literature research and theinterpretation of the data. BG and KK participated in the design of thestructure of the article, the interpretation of the data and literary researchand the preparation of the manuscript. All the authors contributed to thearticle and approved the final form of the manuscript.
Competing interestsAuthors declare that they do not have any competing financial, professional,or personal interests from other parties.
Publisher’s NoteSpringer Nature remains neutral with regard to jurisdictional claims inpublished maps and institutional affiliations.
Author details1Faculty of Management, The University of Presov, Presov, Slovakia. 2Facultyof Economics, Technical University of Kosice, Kosice, Slovakia.
Received: 27 December 2017 Accepted: 6 March 2018
References1. Ancarani A, DI Mauro C, Gitto S, Mancuso O, Ayach A. Technology
acquisition and efficiency in Dubai hospitals. Technol Forecast Soc Chang.2016;113:475–85.
2. Araújo C, Barros CP, Wanke P. Efficiency determinants and capacity issues inBrazilian for-profit hospitals. Health Care Manag Sci. 2014;17(2):126–38.
3. Banker RD, Charnes A, Cooper WW. Some models for estimating technicaland scale inefficiencies in data envelopment analysis. Manag Sci. 1984;30(9):1078–92.
4. Baray J, Cliquet G. Optimizing locations through a maximum covering/p-median hierarchical model: maternity hospitals in France. J Bus Res. 2013;66(1):127–32.
5. Belciug S, Gorunescu F. Improving hospital bed occupancy and resourceutilization through queuing modeling and evolutionary computation. JBiomed Inform. 2015;53:261–9.
Stefko et al. Health Economics Review (2018) 8:6 Page 10 of 12

6. Blank JK, Valdmanis VG. Environmental factors and productivity on Dutchhospitals: a semi-parametric approach. Health Care Manag Sci. 2010;13(1):27–34.
7. Bradford WD, Kleit AN, Krousel-Wood MA, RE RN. Stochastic frontierestimation of cost models within the hospital. Rev Econ Stat. 2001;83(2):302–9.
8. Byrnes P, Valdmanis V. Analyzing technical and allocative efficiency ofhospitals. In: Data envelopment analysis: theory, methodology, andapplications. Netherlands: Springer; 1994. p. 129–44.
9. Burgess JF, Wilson PW. Variation in inefficiency among US hospitals. INFOR,Can J Oper Res Inf Process. 1998;36(3):84–102.
10. Büchner VA, Hinz V, Schreyögg J. Health systems: changes in hospitalefficiency and profitability. Health Care Manag Sci. 2016;19(2):130–43.
11. Chang L, Lan YW. Has the National Health Insurance Scheme improvedhospital efficiency in Taiwan? Identifying factors that affects its efficiency.Afr J Bus Manag. 2010;4(17):37–52.
12. Charnes A, Cooper WW, Rhodes E. Measuring the efficiency of decisionmaking units. Eur J Oper Res. 1978;2(6):429–44.
13. Cheng Z, Cai M, Tao H, He Z, Lin X, Lin H, Zuo Y. Efficiency and productivitymeasurement of rural township hospitals in China: a bootstrapping dataenvelopment analysis. BMJ Open. 2016;6(11):1–11.
14. Chirikos TN, Sear AM. Measuring hospital efficiency: a comparison of twoapproaches. Health Serv Res. 2000;34(6):1389–408.
15. Cooper WW, Seiford LM, Tone K. Data Envelopment Analysis AComprehensive Text with Models, Applications, References and DEA-SolverSoftware. Springer; 2007 490 s. ISBN: 0387452818.
16. Czypionka T, Kraus M, Mayer S, Röhrling G. Efficiency, ownership, andfinancing of hospitals: the case of Austria. Health Care Manag Sci. 2014;17(4):331–47.
17. Dervaux B, Ferrier GD, Leleu H, Valdmanis V. Comparing French and UShospital technologies: a directional input distance function approach. ApplEcon. 2004;36(10):1065–81.
18. De Souza PC, Scatena JHG, Kehrig RT. Aplicação da Análise Envoltória deDados para avaliar a eficiência de hospitais do SUS em Mato Grosso. Physis:Revista de Saúde Coletiva. 2016;26(1)
19. Dey PK, Hariharan S, Clegg BT. Measuring the operational performance ofintensive care units using the analytic hierarchy process approach. Int JOper Prod Manag. 2006;26(8):849–65.
20. Dy MS, Kiley KB, Ast K, Lupu D, Norton SA, McMillan SC, Herr K, Rotella JD,Casarett DJ. Measuring what matters: top-ranked quality indicators forhospice and palliative care from the American Academy of hospice andpalliative medicine and hospice and palliative nurses association. J PainSymptom Manag. 2015;49(4):773–81.
21. Farrel MJ. The measurement of productive efficiency. J R Stat Soc Ser A(General). 1957;120(3):253–90.
22. Fragkiadakis G, Doumpos M, Zopounidis C, Germain C. Operational andeconomic efficiency analysis of public hospitals in Greece. Ann Oper Res.2016;247(2):787–806.
23. Gavurová B, Šoltés V, Kafková K, Černý Ľ. 2013. Vybrané aspekty efektívnostislovenského zdravotníctva. Jednodňová zdravotná starostlivosť a jej rozvoj vpodmienkach Slovenskej republiky. Technická univerzita v Košiciach, Košice2013. 276 s. ISBN: 978-80-553-1439-6.
24. Gavurová B, Šoltés V. 2013. Slovak Healthcare Effectiveness-Analysis ofComparative Aspects and Identification of Development Opportunities 2013.
25. Gerdtham UG, Löthgren M, Tambour M, Rehnberg M. Internal markets andhealth care efficiency: a multiple-output stochastic frontier analysis. HealthEcon. 1999;8(2):151–64.
26. Gholami R, Higón DA, Emrouznejad A. Hospital performance: efficiency orquality? Can we have both with IT? Expert Syst Appl. 2015;42(12):5390–400.
27. Grosskopf S, Margaritis D, Valdmanis V. Competitive effects on teachinghospitals. Eur J Oper Res. 2004;154(2):515–25.
28. Hernandez AR, San Sebastian M. Assessing the technical efficiency of health postsin rural Guatemala: a data envelopment analysis. Glob Health Action. 2014;7
29. Ineveld M, Oostrum J, Vermeulen R, Steenhoek A, Klundert J. Productivityand quality of Dutch hospitals during system reform. Health Care ManagSci. 2015:1–12.
30. Jablonský J, Dlouhý M. 2004. Modely hodnocení efektivnosti produkčníchjednotek. 1. vyd. Praha: Professional Publishing, 2004. 184 s. ISBN 80-86419-49-5.
31. Jia T, Yuan H. The application of DEA (data envelopment analysis) windowanalysis in the assessment of influence on operational efficiencies after theestablishment of branched hospitals. BMC Health Serv Res. 2017;17(1):265.
32. Karagiannis R. A system-of-equations two-stage DEA approach forexplaining capacity utilization and technical efficiency. Ann Oper Res. 2015;227(1):25–43.
33. Kazley AS, Ozcan YA. Electronic medical record use and efficiency. A DEAand windows analysis of hospitals. Socio Econ Plan Sci. 2008;43(3):209–16.
34. Kontodimopoulos N, Nanos P, Niakas D. Balancing efficiency of healthservices and equity of access in remote areas in Greece. Health policy. 2006;76(1):49–57.
35. Kooreman P. Data envelopment analysis and parametric frontier estimation:complementary tools. J Health Econ. 1994;13(3):345–6.
36. Kounetas K, Papathanassopoulos F. How efficient are Greek hospitals? Acase study using a double bootstrap DEA approach. Eur J Health Econ.2013;14(6):979–94.
37. Ley E. Eficiencia productiva: Un estudio aplicado al sector hospitalario.Investicaionnes Económicas. 1991;15(1):71–88.
38. Li H, Dong S. Measuring and benchmarking technical efficiency of publichospitals in Tianjin, China a bootstrap–data envelopment analysis approach.INQUIRY: J Health Care Organization, Provision, and Financing. 2015; 52.0046958015605487.
39. Linna M. Measuring hospital cost efficiency with panel data models. HealthEcon. 1998;7(5):415–27.
40. Linna M, Häkkinen U, Linakko E. An econometric study of costs of teachingand research in Finnish hospitals. Health Econ. 1998;7(5):291–305.
41. Lo JC, Shih KS, Schen KL. Technical efficiency of the general hospitals inTaiwan: an application of DEA. Academia Econ Pap. 1996;24(3):275–96.
42. Lopez-Valcarcel BG, Perez BP. Changes in the efficiency of Spanish publichospitals after the introduction of program-contracts. InvesticaionnesEconómicas. 1996;20(3):377–402.
43. Maestre AM, oliveira MD, Barbosa-Póvoa AP. Location–allocation approachesfor hospital network planning under uncertainty. Eur J Oper Res. 2015;240(3):791–806.
44. Magnussen J. Efficiency measurement and the operationalization of hospitalproduction. Health Serv Res. 1996;31(1):21–37.
45. Mahate A, Hamidi S, Akinci F. Measuring the effect of size on technical efficiencyof the United Arab Emirates hospitals. Global J Health Sci. 2016;9(3):116.
46. Maniadakis N, Thanassoulis E. Assessing productivity changes in UK hospitalsreflecting technology and input prices. Appl Econ. 2000;32(12):1575–89.
47. Martini G, Berta P, Mullahy J, Vittadini G. The effectivness-effficiency trade-offin health care: the case of hospitals in Lombardy, Italy. Reg Sci Urban Econ.2014;49:217–31.
48. Mobley LR, Magnussen J. An international comparison of hospital efficiency:does institutional environment matter? Appl Econ. 1998;30(8):1089–100.
49. Mujasi PN, Asbu EZ, Puing-Junoy J. How efficient are referral hospitals inUganda? A data envelopment analysis and tobit regression approach. BMCHealth Serv Res. 2016;16(1):230.
50. Nedelea IC, Fannin JM. Analyzing cost efficiency of critical access hospitals. JPolicy Model. 2013;35(1):183–95.
51. Oikonomou N, tountas Y, Mariolis A, Souliotis K, Athanasakis K, KyriopoulosJ. Measuring the efficiency of the Greek rural primary health care using arestricted DEA model; the case of southern and western Greece. HealthCare Manag Sci. 2016;19(4):313–25.
52. Parkin D, Hollingsworth B. Measuring production efficiency of acutehospitals in Scotland, 1991-94: validity issues in data envelopment analysis.Appl Econ. 1997;29(11):1425–33.
53. Perera R, Dowell A, Crampton P. Painting by numbers: a guide forsystematically developing indicators of performance at any level of healthcare. Health Policy. 2012;108(1):49–59.
54. Puig-Junoy J. Technical efficiency in the clinical management of critically illpatients. Health Econ. 1998;7(3):263–77.
55. Retzlaff-Roberts D, Chang CF, Rubin RM. Technical efficiency in the use ofhealth care resources: a comparison of OECD countries. Health policy. 2004;69(1):55–72.
56. Rezaee MJ, Karimdadi A. Do geographical locations affect in hospitalsperformance? A multi-group data envelopment analysis. J Med Syst. 2015;39(9):1–11.
57. Rezapour A, Azar FE, Zadeh NY, Roumiani Y, Faradonbeh SB. Technicalefficiency and resources allocation in university hospitals in Tehran, 2009-2012. Med J Islam Repub Iran. 2015;29:266.
58. Rosenkratz AB, Doshi A. Characterizing the performance of the Nation’shospitals in the hospital outpatient quality reporting Program’s imagingefficiency measures. J Am Coll Radiol. 2015;12(2):166–73.
Stefko et al. Health Economics Review (2018) 8:6 Page 11 of 12

59. Samut PK, Cafri R. Analysis of the efficiency determinants of health systemsin OECD countries by DEA and panel Tobit. Soc Indic Res. 2016:1–20.
60. Sendek S, Svitálková Z, Angelovičová K. Efficiency evaluation of hospitals inthe environment of the Czech and Slovak Republic. Acta UniversitatisAgriculturae et Silviculturae Mendelianae Brunensis. 2015;63(6):2109–18.
61. Šoltés V, Balloni AJ, Gavurová B, Šoltés M. Economic aspects of a healthsystem Electronization. Laboratory Management Information Systems:Current Requirements and Future Perspectives. 2014:32–50.
62. Šoltés V, Gavurová B. The functionality comparison of the health caresystems by the analytical hierarchy process method. E+ M Ekonomie aManagement. 2014;17(3):100–18.
63. Tsekouras K, Papathanassopoulos F, Kounetas K, Pappous G. Does theadoption of new technology boost productive efficiency in the publicsector? The case of ICUs system. Int J Prod Econ. 2010;128(1):427–33.
64. Valdmanis V. Sensitivity analysis for DEAmodels. An empirical example usingpublic vs. NFP hospitals. J Public Econ. 1992;48(2):185–205.
65. Varabyova Y, Schreyögg J. International comparisons of the technicalefficiency of the hospital sector: panel data analysis of OECD countriesusing parametric and non-parametric approaches. Health Policy.2013;112:70–9.
66. Villalobos M, Chacón M, Zitko P, Instroza-Ponta M. A new strategy toevaluate technical efficiency in hospitals using homogeneous groups ofCasemix. J Med Syst. 2016;40(4):1–12.
67. Wagstaff A. Estimating efficiency in the hospital sector: a comparison ofthree statistical cost frontier models. Appl Econ. 1989;21(5):659–72.
68. Worthington AC. Frontier efficiency measurement in health care: a review ofempirical techniques and selected applications. Med Care Res Rev. 2004;61(2):135–70.
69. Zuckerman S, Hadley J, Iezzoni L. Measuring hospital efficiency with frontiercost functions. J Health Econ. 1994;13(3):255–80.
Stefko et al. Health Economics Review (2018) 8:6 Page 12 of 12