measurement of particulate matter: recommendations for the
TRANSCRIPT

Together with our clients, we integrate scientific know-how and practical experience to develop livestock concepts for the 21st century. With our expertise on innovative livestock systems, nutrition, welfare, genetics and environmental impact of livestockfarming and our state-of-the art research facilities, such as Dairy Campus and Swine Innovation Centre Sterksel, we support our customers to find solutions for current and future challenges.
The mission of Wageningen UR (University & Research centre) is ‘To explore the potential of nature to improve the quality of life’. Within Wageningen UR, nine specialised research institutes of the DLO Foundation have joined forces with Wageningen University to help answer the most important questions in the domain of healthy food and living environment. With approximately 30 locations, 6,000 members of staff and 9,000 students, Wageningen UR is one of the leading organisations in its domain worldwide. The integral approach to problems and the cooperation between the various disciplines are at the heart of the unique Wageningen Approach.
Wageningen UR Livestock ResearchP.O. Box 3386700 AH WageningenThe Netherlands T +31 (0)317 48 04 91E [email protected]/livestockresearch
Livestock Research Report 797
Albert Winkel, Peter Demeyer, Anders Feilberg, Malene Jørgensen, July Puterflam, Peter Engel
Measurement of particulate matter: recommendations for the VERA test protocol on air cleaning technologies
Omslag 797.indd 1 13-11-14 08:50

Measurement of particulate matter: recommendations for the VERA test protocol on air cleaning technologies
Albert Winkel 1, Peter Demeyer 2, Anders Feilberg 3, Malene Jørgensen 4, July Puterflam 5, Peter Engel 6 1 Wageningen UR Livestock Research, Wageningen, the Netherlands 2 Institute for Agricultural and Fisheries Research (ILVO), Merelbeke, Belgium 3 Aarhus University, Aarhus, Denmark 3 Danish Pig Research Centre, Kjellerup, Denmark 5 Technical Institute for Poultry Research (ITAVI), Ploufragan, France 6 Danish Standard Foundation, Copenhagen, Denmark (host of the International VERA Secretariat 2010-2013)
A working group report from the project “ICT-AGRI: Development of harmonized methods for sampling and measurement of odour, ammonia and dust emission” developed on the initiative of the international VERA organisation
Wageningen UR Livestock Research Wageningen, September 2014
Livestock Research Report 797
Albert Winkel, Peter Demeyer, Anders Feilberg, Malene Jørgensen, July Puterflam, Peter Engel, 2014. Measurement of particulate matter: recommendations for the VERA test protocol on air cleaning
technologies. Wageningen, Wageningen UR (University & Research centre) Livestock Research, Livestock Research Report 797. Abstract
This report has been prepared by the working group on the measurement of dust (particulate matter; PM) in livestock production within the overall project ‘Development of harmonized methods for sampling and measurement of odour, ammonia and dust emission’, developed on the initiative of the international VERA organisation. This report first clarifies the involved terms, size fractions, and definitions for dust (chapter 2) and provides some insight into the working principles of measurement methods and into the variety of samplers available to measure airborne dust in livestock production (chapter 3). Subsequently, the challenges are described that can be encountered when measuring dust in livestock production (chapter 4). Furthermore, an overview is presented of the available sampling standards on dust (chapter 5) and of the emissions and emission regulations in the participating countries (chapter 6). Next, summaries are provided of finalised and ongoing studies performed by the participating institutions (chapter 7). Based on the content of these chapters, conclusions and recommendations are presented as building blocks for improvement of the VERA test protocol on air cleaning technologies with regard to the measurement of particulate matter. Some of the main recommendations are: o that testing institutes should report the exact PM fraction that has been sampled, i.e., by
referring to a fraction that is described in a standard, by mentioning its 50%-cut off diameter or by giving its cut-off curve;
o that removal efficiencies of air cleaning technologies should be based on particle mass concentrations (i.e., µg/m3 or mg/m3) and not on particle number concentrations ;
o that measurement methods are only used after equivalence tests to relevant reference samplers have been carried out and published, and corrective measures have been taken. For this, a reference sampler for PM emission measurement in livestock production should be developed;
o not to use measurement methods based on light-scattering under very humid conditions (e.g., at the outlet of air scrubbers);
o that in principle technologies are tested over one 24-h period or over two periods: a day (light) period and a night (dark) period.
Furthermore, recommendations are given for further research. © 2014 Wageningen UR Livestock Research P.O. Box 338, 6700 AH Wageningen, the Netherlands, T +31 (0) 317 48 39 53, E [email protected], I www.wageningenUR.nl/en/livestockresearch. Livestock Research is part of Wageningen UR (University & Research centre). All rights reserved. No part of this publication may be reproduced and/or made public, whether by print, photocopy, microfilm or any other means, without the prior permission of the publisher or author.
The ISO 9001 certification by DNV underscores our quality level. All our research commissions are in line with the Terms and Conditions of the Animal Sciences Group. These are filed with the District Court of Zwolle.
Livestock Research Report 797

Table of contents
1 Introduction 5
2 Particulate matter (PM) definitions and size fractions 6
3 Measurement methods for PM 9
3.1 Particle number versus particle mass concentration 93.2 Working principles and critical factors of PM measurement methods 93.3 Presentation of some samplers used in recent livestock emission studies 11
4 Known challenges in measuring PM from livestock production 14
4.1 Difficulties related to isokinetic and isoaxial sampling 144.2 Sampling bias related to Semi-Volatile Compounds 164.3 Sampling bias due to hygroscopic particle growth 164.4 Sampling bias related to (NH4)2SO4 and NH4-HSO4 particle formation 174.5 Rapid pollution of devices 174.6 Lack of clarity on terms for PM 174.7 Lack of clarity on the degree of equivalence of devices 174.8 Undefined sampling duration 18
5 Overview of existing PM sampling standards 19
6 PM emissions and regulations in Europe and involved countries 21
6.1 PM regulations in Europe 216.2 PM emissions and regulations in the Netherlands 216.3 PM emissions and regulations in Denmark 226.4 PM emissions and regulations in Belgium 236.5 PM emissions and regulations in France 24
7 Summaries of finalised and on-going research projects 25
7.1 An PM emission survey in the Netherlands (finalised) 257.2 A research programme on PM emission abatement in poultry houses in the
Netherlands (finalised) 267.3 An EN 12341 equivalence study on five PM10 samplers in the Netherlands
(finalised) 277.4 The ‘PigDust’ project in Belgium (finalised) 287.5 The ‘MultiPol’ project in Belgium (on-going) 297.6 The ‘BlesPigs’ project in Belgium (started) 29
8 Recommendations 31
8.1 Recommendations for the VERA test protocols 318.2 Recommendations for future research 32
References 33

1 Introduction
VERA1 (‘Verification of Environmental Technologies for Agricultural Production’) is an international organisation which issues VERA Verification Statements technologies that have been tested following on of the five VERA test protocols on environmental performance and operational stability. One of the protocols deals with testing of air cleaning technologies. Obtaining a VERA Verification Statement is an important step for the introduction of an air cleaning technology to the market and the acceptance by authorities. During the development and use of the VERA test protocol for air cleaning technologies a number of measurement methods on odour, ammonia and dust has been revealed to be insufficient for the use within agricultural production. Hence, there is a need for harmonization and development of sampling and measurement methods for odour, ammonia and dust emissions from livestock production to generate trustworthy test results which can be mutually accepted across borders. By that, technology manufacturers can more easily get access to the international marked based on tests conducted in just one country. A project was developed on the initiative of the international VERA organisation to yield guidelines and recommendations concerning measurement methods for odour, ammonia and dust emissions, which can at a later stage be integrated in existing or new test protocols for air cleaning technologies, for instance the VERA test protocol developed within the VERA organisation. At the start of this project, experts from all participating countries joined an introductory workshop on April 16th 2013 in Copenhagen convened by the International VERA Secretariat. During this workshop, three international working groups were established on odour, ammonia and dust. The present report is the result of the work carried out by the working group on dust. The members of this group, and their institutions, are listed on the cover of this report. This report first clarifies the many terms, size fractions, and definitions for dust (chapter 2) and provides some insight into the working principles of measurement methods and into the variety of samplers available to measure airborne dust in livestock production (chapter 3). Subsequently, the challenges are described that can be encountered when measuring dust in livestock production (chapter 4). Furthermore, an overview is presented of the available sampling standards on dust (chapter 5) and of the emissions and emission regulations in the participating countries (chapter 6). Next, summaries are provided of finalised and ongoing studies performed by the participating institutions (chapter 7). Finally, conclusions and recommendations are presented as building blocks for future improvements of the VERA test protocols on air cleaning technologies with regard to the measurement of particulate matter.
1 Website VERA: http://www.veracert.eu
Livestock Research Report 797 | 5

2 Particulate matter (PM) definitions and size fractions
The term dust is often used in relation to non-gaseous emissions from animal houses. However, in atmospheric science, dust is defined as mechanically generated solid particles (Table 1). For this work, the more general term particulate matter (PM) is suggested, since this term includes both liquid and solid particles. An equivalent term is aerosol. In the following, PM is used as a general term of airborne particles regardless of shape, size, composition, physical nature, etcetera. Particles in animal house air usually are not spherical; they have irregular shapes (e.g. hair-like, flake-like, filamentary, etc.) and have various densities (Cambra-López et al., 2011). Using a diameter as such, would therefore not be meaningful. Diameters of particles greater than circa 0.5 µm can be described by their aerodynamic diameter. The aerodynamic diameter of an irregular particle is equal to the diameter of a sphere with a density of 1 g/m3 that would have the same terminal velocity as the irregular particle. PM is classified according to either the main region of deposition in the respiratory tract (terms used in the field of occupational health) or the sampling cut-off size (terms used in the field of atmospheric science). In the latter classification, abbreviations in the form PMxx are used where PM stands for particulate matter and ‘xx’ denotes the 50% cut-off point of the upper size limit of the particles in µm. For clarity, most frequently used terms are listed in Table 1. One should realize that no sampler is able to collect only particles exactly smaller than a given size limit. A sampler for PM10 for instance, will collect particles with aerodynamic diameters ranging from <1 to circa 15 µm. Very small particles will be collected with an efficiency close to 100% whereas this figure will be close to zero for particles of circa 15 µm. This results in a smoothed penetration curve with (for the example of PM10) a 50% cut-off point at 10 µm (Figure 1). Ideally, the penetration curve would be very steep (e.g., a vertical line from 100 to 0 percent at the upper size limit), but since this curve is smoothed out in practice, some of the oversized particles are collected too, whereas some of the aimed particles are not collected. There is a certain overlap between sampling cut-off size fractions and occupational health size fractions. For instance; PM10 (defined in EN 12341) is to a certain extent equivalent to the thoracic fraction (both have a 50% cut-off at 10 µm), but the thoracic fraction extends further into larger particles (up to 40 µm) compared to PM10 (up to 15 µm). Thus; the penetration curve for PM10 is more steep. Similarly, the respirable size fraction (defined in ISO 7708) would be termed PM4 in sampling cut-off terminology. The PM2.5 fraction is somewhat equivalent to the so-called ‘high-risk’ respirable fraction (defined in ISO 7708) because both fractions have 50% cut-off points at 2.5 µm, but the penetration curve for PM2.5 is more steep (not shown in Figure 1, but in Cambra-López et al. (2010)).This means that, in principle, PM10 and PM2.5 sampling yields lower mass concentrations than sampling of the thoracic and ‘high risk’ respirable fraction respectively, despite their comparable cut-off sizes.
6 | Livestock Research Report 797

Table 1 Overview of terms and definitions of PM
Term
Fraction
(PMxx) Definition Standard Reference;
First author (year)
Dust Not a fraction
‘Solid particles (settled or airborne) formed by mechanical fracture of a parental material, which can sediment under gravity forces, with diameters up to 500 or 1000 µm’
- Cambra-López (2010)
Particulate matter (aerosol)
Not a fraction
‘Fine solid or liquid particles suspended in a gaseous medium’
- Cambra-López (2010)
Total airborne particles
Not a fraction
Theoretical term in ISO 7708 to refer to ‘all particles surrounded by air in a given volume of air’
ISO 7708
ISO (1995)
Suspended particulate matter (SPM)
Not a fraction
A theoretical term used in 40 CFR 50, EN 12341 and EN 14907: ‘notion of all particles surrounded by air in a given, undisturbed volume of air’
EN 12341 EN 14907
CEN (1998) CEN (2005)
Total dust Undefined Term for airborne particles that can be collected using 37-mm filter cassettes
NIOSH method 0500
NIOSH (1994)
Total suspended particles (TSP)
~PM35 Archaic term for ambient PM: ‘particles up to 25–50 µm, depending on wind speed and direction’
40 CFR 50, appendix B
US-EPA (2014d)
Inhalable dust (inspirable dust)
~PM100 ‘Mass fraction of total airborne particles which is inhaled through the nose and mouth’
ISO 7708 EN 481
ISO (1995) CEN (1993)
Extrathoracic fraction
~PM100–10 ‘Mass fraction of inhaled particles that fail to penetrate beyond the larynx’
ISO 7708 EN 481
ISO (1995) CEN (1993)
Thoracic fraction
~PM10 ‘Mass fraction of total airborne particles which penetrate beyond the larynx’
ISO 7708 EN 481
ISO (1995) CEN (1993)
PM10 PM10 ‘Particulate matter which passes through a size-selective inlet with a 50% efficiency cut-off at 10 μm aerodynamic diameter’
EN 12341 CEN (1998)
Tracheobronchial fraction
~PM10–4 ‘Mass fraction of inhaled particles which penetrate beyond the larynx, but which fail to penetrate to the unciliated airways’
ISO 7708 EN 481
ISO (1995)
Coarse fraction PM10–2.5 ‘Particles bigger than 2.5 µm and smaller than 10 µm diameter’ (PM10 minus PM2.5)
- US-EPA (2004) Cambra-López (2010)
‘Healthy adult’ respirable fraction ‘High risk’ respirable fraction
~PM4
~PM2.5
‘Mass fraction of inhaled particles which penetrate to the unciliated airways’
ISO 7708
ISO (1995)
PM2.5 (or ‘fine fraction’, next to ‘coarse’)
PM2.5 ‘Particulate matter which passes through a size-selective inlet with a 50% efficiency cut-off at 2.5 μm aerodynamic diameter’
EN 14907 CEN (2005)
Submicron particles
PM1 ‘Particles smaller than 1 µm in diameter’ - Cambra-López (2010)
Nanoparticles (ultrafine particles)
PM0.1 Particles between 0.001 µm (1 nm) and 0.1 µm (100 nm)
- -
Livestock Research Report 797 | 7

Figure 1 The inhalable, thoracic, PM10 and respirable conventions expressed as percentages of total airborne particles (graph composed from tables given in ISO 7708 and EN 12341)
Over the last decades, there has been a proliferation of particle definitions. For purposes of clarity, the following can be stated: • The occupational health related size fractions (terms: inhalable fraction, extrathoracic
fraction, thoracic fraction, ‘healthy adult’ respirable fraction, and ‘high risk’ respirable fraction) have been explicitly defined in ISO 7708 and EN 481 (Table 1 and Figure 1). The ISO 7708 standard uses the theoretical term ‘total airborne particles’ to further set the aforementioned (measurable) fractions of these particles.
• The PM10 fraction has been set in EN 12341 (focused on ambient air sampling) in three ways: by giving a definition (Table 1), by giving a penetration curve (Figure 1) and by defining European reference samplers and procedures that must be used to assess the equivalence of a candidate sampler to this reference sampler. For PM2.5 a definition (Table 1) and European reference samplers have been set in EN 14907. In the USA, PM10 and PM2.5 reference samplers and methods to assess equivalence have been set by the US Environmental Protection Agency (US-EPA, 2014a, 2014c) . In conclusion, the PM10 and PM2.5 fractions have been explicitly set as well.
• For the >10 µm fractions, the terms ‘total airborne particles’, ‘suspended particulate matter’, ‘total dust’, ‘inhalable dust’, ‘inspirable dust’, and ‘total suspended particles’ are used. Of these six terms, the first two are used in a theoretical manner in ISO 7708, EN 12341 and EN 14907 to refer to ‘all particles in air’ which in principle could be collected in a certain fraction. The term ‘total dust’ can be described on the basis of NIOSH Method 0500 as ‘airborne particles that can be collected using 37-mm filter cassettes’. The terms ‘inhalable’ and ‘inspirable’ are synonyms. This fraction has explicitly been set in ISO 7708 and EN 481. ‘Total suspended particles’ is an archaic term for ambient particle measurement, used by the US-EPA since 1971. The fraction has been more and more replaced for PM10 (US-EPA, 2014b). Thus, it should be noted that ‘total dust’, ‘total suspended particles’ and ‘inhalable dust’ are different fractions.
0
20
40
60
80
100
1 10 100
Parti
cles
in c
onve
ntio
n (%
)
Aerodynamic particle diameter (µm)
Inhalable (ISO 7708, EN 481)
Thoracic (ISO 7708, EN 481)
PM10 (EN 12341)
'Healthy adult' respirable (ISO 7708, EN 481)
'High risk' respirable (ISO 7708)
8 | Livestock Research Report 797

3 Measurement methods for PM
3.1 Particle number versus particle mass concentration
Concentrations of PM in air can be expressed in two manners: 1. in particle number concentrations; e.g. in counts per cm3, L or m3; 2. in particle mass concentrations; e.g. in µg/m3 or mg/m3.
When interpreting PM measurements, either to determine emissions or removal efficiency of mitigation measures, the type of concentration is important to consider for three reasons. First, in European legislation (Directive; 2008/50/EC; see also chapter 2) particle mass concentrations are used to set maximum PM10 and PM2.5 levels in ambient air. Therefore, livestock emission studies usually report this type of concentration. This way, emission levels can be used to estimate ambient concentrations based on dispersion modelling. Second, exposure limits are usually expressed in mass concentrations too. Third, particle number and particle mass concentrations can give opposite pictures with regard to removal efficiencies of mitigation measures. A publication may for instance report very high removal efficiencies based on particle number concentrations (e.g., upstream and downstream of an air cleaning technology), but when this reduction is mainly achieved in the smaller particle size range, the mitigation of particle mass is likely to be negligible, since the total mass of PM in air is mainly attributable to the larger particles.
3.2 Working principles and critical factors of PM measurement methods
Four main principles can be identified for sampling and measurement of PM in livestock production. In the following a short summary is given of each working principle. 1. Gravimetric principle (gravimetry; filter-based samplers)
This principles consists of collecting the aimed particles onto a filter. Air is drawn with a certain air flow rate through a sampler by a pump. Before meeting the filter, particles larger than the aimed particle size can be removed from the air stream by impaction or centrifugal force. Filters are weighed before and after sampling (‘loaded’ and ‘unloaded’ filters) under standard conditions for temperature (T) and relative humidity (RH). The difference between both readings equals the mass of captured PM. The mass concentration is then determined by dividing the collected mass by the known volume of air drawn through the filter by the pump. With this principle a time-average mass concentration is obtained for the period of sampling. Weighing requires a weighing room with programmable and stable T and RH, as well as a balance with a high resolution (1 or 10 µg). Critical factors • The method requires a climate-controlled weighing room, a high-resolution balance and
meticulous weighing procedures • The method produces a time-integrated concentration value; continuous values (i.e., minute or
hourly) are not possible • Handling and transportation of filters and the removal of loaded filters from the filter holder
before weighing may agitate the PM layer on the filter and cause loss of PM material • The pump needs to be able to maintain the nominal air flow through the filter when the PM layer
and pressure drop across the filter increases (i.e., at high concentrations and/or long sampling periods)
• When a PM10 or PM2.5 pre-separator based on impaction is used, the impactor may become overloaded with PM, causing particle bouncing of larger particles to the filter, resulting in overestimation of the true concentration
Livestock Research Report 797 | 9
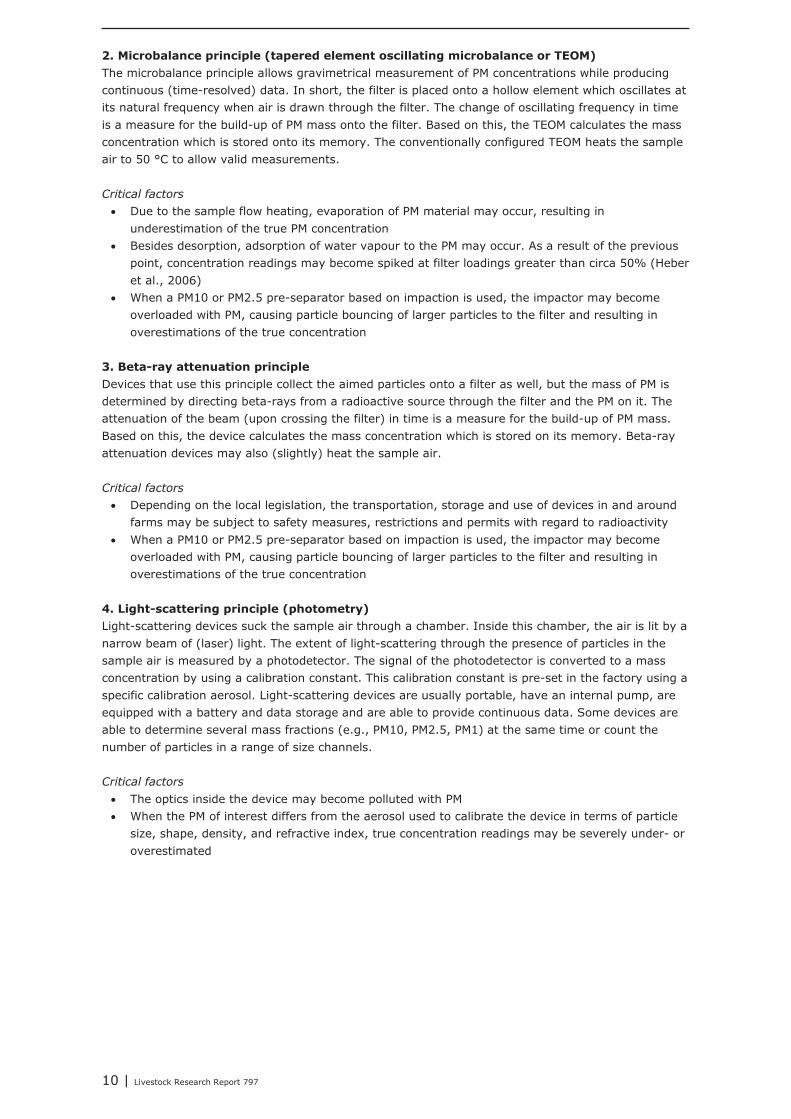
2. Microbalance principle (tapered element oscillating microbalance or TEOM)
The microbalance principle allows gravimetrical measurement of PM concentrations while producing continuous (time-resolved) data. In short, the filter is placed onto a hollow element which oscillates at its natural frequency when air is drawn through the filter. The change of oscillating frequency in time is a measure for the build-up of PM mass onto the filter. Based on this, the TEOM calculates the mass concentration which is stored onto its memory. The conventionally configured TEOM heats the sample air to 50 °C to allow valid measurements. Critical factors • Due to the sample flow heating, evaporation of PM material may occur, resulting in
underestimation of the true PM concentration • Besides desorption, adsorption of water vapour to the PM may occur. As a result of the previous
point, concentration readings may become spiked at filter loadings greater than circa 50% (Heber et al., 2006)
• When a PM10 or PM2.5 pre-separator based on impaction is used, the impactor may become overloaded with PM, causing particle bouncing of larger particles to the filter and resulting in overestimations of the true concentration
3. Beta-ray attenuation principle
Devices that use this principle collect the aimed particles onto a filter as well, but the mass of PM is determined by directing beta-rays from a radioactive source through the filter and the PM on it. The attenuation of the beam (upon crossing the filter) in time is a measure for the build-up of PM mass. Based on this, the device calculates the mass concentration which is stored on its memory. Beta-ray attenuation devices may also (slightly) heat the sample air. Critical factors • Depending on the local legislation, the transportation, storage and use of devices in and around
farms may be subject to safety measures, restrictions and permits with regard to radioactivity • When a PM10 or PM2.5 pre-separator based on impaction is used, the impactor may become
overloaded with PM, causing particle bouncing of larger particles to the filter and resulting in overestimations of the true concentration
4. Light-scattering principle (photometry)
Light-scattering devices suck the sample air through a chamber. Inside this chamber, the air is lit by a narrow beam of (laser) light. The extent of light-scattering through the presence of particles in the sample air is measured by a photodetector. The signal of the photodetector is converted to a mass concentration by using a calibration constant. This calibration constant is pre-set in the factory using a specific calibration aerosol. Light-scattering devices are usually portable, have an internal pump, are equipped with a battery and data storage and are able to provide continuous data. Some devices are able to determine several mass fractions (e.g., PM10, PM2.5, PM1) at the same time or count the number of particles in a range of size channels. Critical factors
• The optics inside the device may become polluted with PM • When the PM of interest differs from the aerosol used to calibrate the device in terms of particle
size, shape, density, and refractive index, true concentration readings may be severely under- or overestimated
10 | Livestock Research Report 797

3.3 Presentation of some samplers used in recent
livestock emission studies
Numerous devices are available for measurement of airborne PM, but only a limited number of these have been used in studies on livestock PM emissions in the past. In Table 2 these samplers are presented. Rather than providing an exhaustive overview, Table 2 gives an impression of the diversity of devices available. Hyperlinks or references are given to further explore device characteristics. Table 2 Overview of devices used for determination of PM emissions from animal houses, as
found in literature from European studies
Device and picture
Main characteristics
LV Reference samplers for PM10 and PM2.5 in ambient air
(EN 12341 and EN 14907)
Producer: several PM fractions: PM10 or PM2.5 Pre-separation: impaction plate Principle: gravimetry Flow rate: 38.33 L/min (2.3 m3/h) Further information: - EN 12341 (CEN, 1998) - EN 14907 (CEN, 2005) - Description and detailed pictures by Zhao et al. (2009)
Cyclone samplers
Producer: assembled from components from several producers; operated by Wageningen UR, NL PM fractions: PM10, PM2.5 Pre-separation: cyclone Principle: gravimetry Flow rate: 16.67 L/min (1 m3/h) Further information: - Description and detailed pictures by Zhao et al. (2009) and Hofschreuder et al. (2008)
RespiCon, model 8522
Producer: TSI Inc., USA PM fractions: inhalable, thoracic and respirable simultaneously Pre-separation: none Principle: gravimetry Flow rate: 3.11 L/min Further information: - Hyperlink to website - Hyperlink to brochure - Hyperlink to manual
Livestock Research Report 797 | 11

(Table 2; continued)
Device and picture Main characteristics
IOM Sampler
Producer: SKC Inc., USA PM fractions: inhalable Pre-separation: none Principle: gravimetry Flow rate: 2.0 L/min Further information: - Hyperlink to website - Hyperlink to datasheet - Hyperlink to manual
TEOM, model 1400 ab
Producer: Thermo Scientific, USA PM fractions: Total PM, PM10 or PM2.5, depending on pre-separation (not shown) Pre-separation: impactor or cyclone Principle: microbalance Sample flow: 16.67 L/min (total), split to sample flow of 3.0 L/min Further information: - Hyperlink to website - Hyperlink to brochure
FH 62 I-R
Producer: MetOne / Thermo Scientific, USA PM fractions: PM10 or PM2.5, depending on pre-separation Pre-separation: impactor or cyclone Principle: beta-ray attenuation Sample flow: 16.67 L/min (1 m3/h) Further information: - Hyperlink to website - Hyperlink to brochure - Hyperlink to manual
DustTrak, model 8520
Producer: TSI Inc., USA PM fractions: PM10 or PM2.5, depending on configuration Pre-separation: PMxx inlet nozzle Principle: photometry Sample flow: 1.7 L/min Further information: Model 8520: - Hyperlink to website - Hyperlink to manual Model 8530: - Hyperlink to website - Hyperlink to catalogue
12 | Livestock Research Report 797

(Table 2; continued)
Device and picture
Main characteristics
HAZ-DUST, model EPAM-5000
Producer: SKC Inc., USA PM fractions: PM10 or PM2.5, depending on configuration Pre-separation: PMxx inlet piece Principle: photometry Sample flow: 4.0 L/min Further information: - Hyperlink to website 1 - Hyperlink to website 2 - Hyperlink to datasheet - Hyperlink to manual
Particle Aerosol Counter, model 1.109
Producer: GRIMM Aerosol Technik GmbH & Co. KG, Germany PM fractions: mass of PM10, PM2.5, PM1, inhalable, thoracic, and respirable PM, and particle counts in multiple size channels Pre-separation: none; particles counts are given in size channels Principle: photometry Sample flow: 1.2 L/min Further information: - Hyperlink to website - Hyperlink to manual
Livestock Research Report 797 | 13

4 Known challenges in measuring PM from livestock production
4.1 Difficulties related to isokinetic and isoaxial sampling
The principle of isokinetic PM sampling is explained in Figure 2. This principle is needed when PM is sampled in stacks, ducts or shafts with high air velocities (e.g., >2 m/s). When the ratio between sampling velocity and gas flow velocity (Vg/Va) in Figure 2 deviates from 1, under- or oversampling will occur. This is also the case when the sampler is positioned at an angle to the air flow. For unbiased sampling, the sampler should be positioned in line with the air flow (isoaxial sampling). Standard EN-13284-1 requires isokinetic and iso-axial (<15°) sampling of PM in stacks, ducts or shafts. This is however, very difficult to achieve in livestock production because (Hofschreuder et al., 2008): • exhausts are often not of the ‘stack-type’, e.g., in the case of roof ridge exhausts (naturally
ventilated buildings) and end wall ventilators; • ventilation flow may not be very spatially homogeneous; • in some buildings (especially for poultry) many ventilators may present that are switched on and
off within short periods to adapt the ventilation rate quickly to ventilation needs; • when a ventilator is working continuously, the ventilation rate may fluctuate considerably in time,
especially at longer sampling times (e.g., day/night fluctuations). A stable air flow rate is crucial to allow iso-kinetic sampling;
• stacks are usually too short to allow measurement away from inlet, bends, obstructions and outlet; therefore, air flows in these stacks are usually turbulent which impedes iso-axial sampling.
a. Isokinetic PM sampling. Sampling velocity is identical to the gas flow velocity (Vs = Vg). Iso = similar; kinetic = moving energy. b. Sampling velocity is greater than the gas flow velocity (Vs > Vg). Flow lines from outside the sampling duct diameter are sucked in. Smaller (lighter) particles tend to follow these flow lines, but larger (heavier) particles tend to continue and bypass the sampling duct. Net result: shift to smaller particles, hence: underestimation of true PM mass concentration. c. Sampling velocity is smaller than the gas flow velocity (Vs < Vg). Flow lines within the sampling duct diameter bypass the sampler. Smaller (lighter) particles tend to follow these flow lines, but larger (heavier) particles tend to continue into the sampler. Net result: shift to larger particles, hence: overestimation of true PM mass concentration.
Figure 2 The principle of isokinetic sampling explained (Vg: gas velocity; Vs: sampling velocity)
Vg
Vg
Vg
Vs
Vs
Vs
14 | Livestock Research Report 797

a. Measurement in ingoing air (background) b. Measurement under the roof ridge exhaust
c. Measurement in front of end wall fans d. Measurement at the inlet of a ventilation shaft
e. Measurement downstream of a scrubber f. Measurement upstream of a filter wall Figure 3 a through f: examples of non-isokinetic sampling strategies applied in projects at
Wageningen UR Livestock Research in the past
Livestock Research Report 797 | 15

In the Netherlands, these issues have led to the use of non-isokinetic sampling methods for animal houses, based on the basic principles described in EN 12341 and EN 14907 for ambient sampling of PM10 and PM2.5 respectively (‘Cyclone samplers’, Table 2). This method is used combined with the strategy to sample PM outside stacks, ducts or shafts. Applying this method has been the outcome of an outlook report on this matter by Hofschreuder et al. (2008). The inlet of these samplers have a circumferential slit and samplers are applied in relatively calm air flows (<2 m/s), mimicking ambient sampling conditions. Sampling is done inside the animal houses, directly (<3 m) in front of wall ventilators or 0.1 m vertically and 0.5 m horizontally away from vertical roof ventilators (Hofschreuder et al., 2008). Examples of such measurement strategies are shown in Figure 3. Further research is needed to develop and validate isokinetic and non-isokinetic sampling strategies.
4.2 Sampling bias related to Semi-Volatile Compounds
Emissions from livestock production contain semi-volatile compounds that are reversibly sorbed to PM. This includes compounds (e.g. NH3, carboxylic acids) that may be ionized in the particle phase (containing moisture), which enhances the partitioning from the gas phase into the particle phase. This has implications for the gravimetric measurements of PM in several ways (Volckens and Leith, 2003).
a. Compound mass originally in the gas phase may be adsorbed to the filter material during sampling, thus overestimating the concentration of PM. This is especially a risk for polar “sticky” compounds such as ammonia, amines and carboxylic acids.
b. Compound mass originally in the particle phase may be desorbed into the gas phase during sampling, especially if there is a significant pressure drop across the filter or when the air sample is heated. Heating of sampled PM occurs intentionally in the conventionally configured TEOM and in beta-ray attenuation samplers, but may also occur unintentionally through the heat produced by the internal pump of sampling devices. Another cause of evaporative PM loss is deviation from gas-particle equilibrium. This will underestimate the PM concentration.
c. Compound mass originally in the particle phase may evaporate during drying of the filter material prior to weighing. Active drying of filters (e.g., oven drying) is allowed in EN 13284-1 (1 hour at >160 °C followed by equilibration to ambient temperature), but not in EN 12341 and EN 14907. The latter two standards prescribe incubation of filters at 20 ± 1°C and 50 ± 5% relative humidity. Active drying is likely to result in in evaporative losses and underestimation of PM concentration.
The magnitude of the sampling bias due to semi-volatile compounds has not been systematically investigated, but there are indications from the literature that adsorption of gaseous carboxylic acids to filter materials is significant (Andersen et al., 2014).
4.3 Sampling bias due to hygroscopic particle growth
When animal house exhaust air passes a scrubber, biofilter (composed from moisturized organic packing material), heat exchanger or manure drying system, a drop in temperature (T) and a rise in relative humidity (RH) occurs. In some cases, RH of the air downstream of the system will approach 100%. At such high humidities particles will most likely take up water and will temporarily grow in size and weight. For particles with aerodynamic diameters in the smoothed part of the penetration curve, this water uptake may cause them to become an ‘oversized particle’. As a result, these particles may erroneously not be sampled in the fraction of interest. Released into the atmosphere, particles may lose this adsorbed water again due to evaporation, returning to their original size. When this mechanism of hygroscopic particle growth plays a role for livestock PM at the aforementioned systems, the downstream PM concentration will be underestimated and consequently the removal efficiency will be overestimated. For light-scattering devices the water shell around the particle will change the refractive index of the particle which will probably represent a second form of sampling bias for these type of instruments. Currently, the occurrence and magnitude of these phenomena are unknown.
16 | Livestock Research Report 797

4.4 Sampling bias related to (NH4)2SO4 and NH4-HSO4
particle formation
In air filters with trickling water (i.e. biotrickling filters and acid scrubbers), PM may be released from the trickling liquids as wet particles containing ionic species. This has been observed to be a significant problem in acid scrubbers using H2SO4. When gaseous ammonia enters the acid scrubber, airborne (NH4)2SO4 and NH4-HSO4 particles will be formed and released to the air flow downstream of the scrubber unless a very efficient mist collector is used. These particles are included in the PM measurements. This is not a measurement error, but the manufacturers need to be aware that this will reduce the PM removal efficiency of the technology even if the scrubber eliminates the PM originating from the livestock house.
4.5 Rapid pollution of devices
Since PM concentrations in animal houses are high (10 to 200 times higher than in ambient air), devices may become rapidly polluted with PM which may affect their accuracy. Zhao et al. (2009) for instance, used the European reference sampler for PM2.5 (described in EN 14907) inside animal houses and concluded that the greased impaction plate for particle pre-separation was overloaded with particles within one hour of sampling. Particles greater than 2.5 µm then bounce off further into the sampler and are erroneously measured as PM2.5. For the PM10 impactor described in EN 12341, this did not occur within 24 hour, but in general, care should be taken when using greased impaction plates inside animal houses. Overloading of impactions plates was also found during PM sampling in a pig house by Van Ransbeeck et al. (2013b). This particle bouncing may also play a role in other pre-separation systems, such as inlet nozzles of cyclones, etcetera. Furthermore, high PM concentrations may also cause rapid pollution of the interior of devices, such as internal filters, tubes, and mirrors or lenses in light-scattering devices. Preliminary results of a study by Winkel et al (2014b) show that time intervals between non-routine services of a number of tested samplers should be shortened for animal house PM sampling, as compared to standard intervals stated in operating manuals. Finally, also flies, red mites or other organisms may enter sampling inlets and cause malfunctioning of the device.
4.6 Lack of clarity on terms for PM
As described in chapter 2, there has been a proliferation of terms for PM. Many of the terms listed in Table 1 can be found in studies on concentrations and emissions of PM in livestock production. In some cases, it can be unclear which exact PM fraction has been sampled. Researchers should be unambiguous with regard to the exact PM fraction that has been sampled. This can be achieved by referring to the terms, their definitions, and their penetration curves mentioned in standards (Table 1).
4.7 Lack of clarity on the degree of equivalence of devices
In addition to the many terms for PM, a broad array of devices are available for measurement of PM (chapter 2). Table 2 lists a number of devices that have been used in livestock studies in the past. It is well known from field measurements where two or more types of samplers were used simultaneously that concentration readings can differ significantly between them. This deviation between sampler types represents a systematic error which can be identified by testing each sampler type against a reference sampler for the PM fraction in question. With regard to this, it should be noted that at this moment, there is no PM10 or PM2.5 reference sampler available for emission measurements in livestock production. Furthermore, concentration readings from multiple devices of the same sampler type can differ too, which represents random error. Before using a sampler type to determine absolute PM concentrations and emissions, both error sources should be investigated and measures should be taken to ensure that valid data is produced, for instance by applying a calibration factor to correct for a systematic error and/or the use of a mean concentration value obtained from duplicate or triplicate
Livestock Research Report 797 | 17

sampling to average out the random error. When samplers are used to obtain relative figures (e.g., by upstream and downstream PM measurement for determination of removal efficiencies of end of pipe systems or by performing measurements at control and treatment sites) systematic errors may be of less importance. But, for that situation, random errors may give rise to instrument effects. This can be overcome by exchanging devices between upstream and downstream (or control and treatment) sites, in addition to the use of a mean concentration value obtained from duplicate or triplicate sampling. Currently, little information is available on systematic and random errors of samplers under conditions of sampling animal house PM and this information is urgently needed.
4.8 Undefined sampling duration
The VERA protocol is ambiguous with respect to PM sampling time. In Table 2 of the protocol it is stated that PM should be sampled over 24 hours, but in Table 3 it is stated that sampling should be carried out between 9 am and 4 pm and that sampling time should be “30/120 minutes”. This needs to be clarified and is also relevant with respect to the issue of isokinetic sampling. It should be noted that technologies can have daily patterns in their removal efficiency and that a very short sampling time of 30 to 120 minutes may not provide a representative figure of the overall 24-h removal. Furthermore, when using simple filter-based systems for PM10, respirable PM (~PM4) or PM2.5, a short sampling duration may result in too little PM on the filter for accurate weighing.
18 | Livestock Research Report 797

5 Overview of existing PM sampling standards
In Table 3, an overview is given of standards that are related to sampling of PM in several situations. Table 3 Overview of PM sampling standards in Europe (CEN), Germany (VDI) and the USA (EPA
and NIOS) for several sampling situations a)
Sampling situation
Standard
Title Reference
Metrology JCGM 100:2008
Evaluation of measurement data – Guide to the expression of uncertainty in measurement (GUM).
JCGM (2008)
EN ISO 20988:2007
Air quality -- Guidelines for estimating measurement uncertainty ISO (2007)
Ambient air sampling
EN 12341 ‘Air quality - Determination of the PM 10 fraction of suspended particulate matter - Reference method and field test procedure to demonstrate reference equivalence of measurement methods’
CEN (1998)
EN 14907 ‘Ambient air quality - Standard gravimetric measurement method for the determination of the PM2.5 mass fraction of suspended particulate matter’
CEN (2005)
40 CFR 50, appendix B
‘Reference method for the determination of suspended particulate matter in the atmosphere (high-volume method)’
US-EPA (2014d)
40 CFR 50, appendix J
‘Reference method for the determination of particulate matter as PM10 in the atmosphere’
US-EPA (2014a)
40 CFR 50, appendix L
‘Reference method for the determination of fine particulate matter as PM2.5 in the atmosphere’
US-EPA (2014c)
Official list ‘List of designated reference and equivalent methods’ (Edition: December, 17, 2013)
US-EPA (2013)
VDI 2463 b) ‘Part 1. Particulate matter measurement. Gravimetric determination of the mass concentration of suspended particulate matter in ambient air. General principles’
VDI (1999)
‘Part 11. Particulate matter measurement. Measurement of mass concentration in ambient air. Filter method. Digitel DHA-80 filter changer‘
VDI (1996)
Occupational sampling
EN 13205 ‘Workplace atmospheres - Assessment of performance of instruments for measurement of airborne particle concentrations’
CEN (2002)
NIOSH method 0500
‘Particulates not otherwise regulated’ (total dust or total aerosol mass)
NIOSH (1994)
Stack, duct and shaft
EN 13284-1 ‘Stationary source emissions - Determination of low range mass concentration of dust - Part 2: Automated measuring systems’
CEN (2001)
sampling EN 13284-1 ‘Stationary source emissions - Determination of low range mass concentration of dust - Part 2: Automated measuring systems’
CEN (2004)
VDI 2066 c) ‘Part 1. Particulate matter measurement. Measuring of particulate matter in flowing gases. Gravimetric determination of dust load. Fundamentals’
VDI (2006)
‘Part 5. Particulate matter measurement. Dust measurement in flowing gases; particle size selective measurement by impaction method’
VDI (1994)
‘Part 10. Particulate matter measurement. Dust measurement in flowing gases. Measurement of PM10 and PM2,5 emissions at stationary sources by impaction method’
VDI (2004)
a) CEN: Comité Européen de Normalisation (European Committee for Standardization); VDI: Verein Deutscher Ingenieure (Society of German Engineers); EPA : Environmental Protection Agency; NIOSH: National Institute for Occupational Safety and Health. b) VDI 2463: Parts 1 and 11 are currently available with a status verified (überprüft) c) VDI 2066: Parts 1, 5, 8, and 10 are currently available with a status verified (überprüft)
Livestock Research Report 797 | 19

Next to two standards on metrology, the standards listed in Table 3 mainly apply to three situations: the measurement of PM in ambient air, the measurement of PM exposure during work, or the measurement of PM inside stacks, ducts and shafts. There is no sampling standard available that is tailored to PM sampling in livestock production. However, one should take note of the aspects pre-scribed in the given standards (e.g., test protocols, reference instruments, procedures, and so on) and consider whether or not to apply these aspects in the situation of sampling PM in livestock production. In the Netherlands, this process of tailoring a sampling method (and strategy) to animal house situations has been described by Hofschreuder et al. (2008).
20 | Livestock Research Report 797

6 PM emissions and regulations in Europe and involved countries
6.1 PM regulations in Europe
The European legal framework for PM in ambient air has been described in a recent review (Cambra-López et al., 2010). In short, EU member states should meet limit values for PM10 and PM2.5 in ambient air, which are stated in Annex XI and XIV of the new Air Quality Directive (2008/50/EC). First, for PM10, day-average ambient concentrations should not exceed the level of 50 µg/m3 more than 35 days per year. Second, the annual mean ambient PM10 concentration should not exceed the level of 40 µg/m3. Third, the annual mean ambient PM10 concentration should not exceed the level of 25 µg/m3.
6.2 PM emissions and regulations in the Netherlands
PM emissions and emission regulation
In 2012, the total primary emission of PM10 in the Netherlands was estimated at 32.2 kt. Of this total emission, 13.4 kt was estimated to originate from traffic and transportation, 7.1 kt from industry and 6.4 kt from agriculture. The contributions of animal houses were estimated at 4.0 kt for poultry houses, 1.2 kt for pig houses and 0.3 kt for cattle houses (RIVM, 2014). Currently, the limit of 35 exceedances of the day-average PM10 limit (see par. 6.1) cannot be met in certain areas of the Netherlands, including areas with many farms. The National Air Quality Cooperation Programme (NSL; Nationaal Samenwerkingsprogramma Luchtkwaliteit) was set up to be able to meet air quality limit values in future. One of the elements of this programme is the reduction of PM emissions from animal houses, especially poultry houses. In the monitoring report of 2012, a total number of 131 animal farms were estimated to cause exceedances of the day-average limit by more than 35 days (Van Zanten et al., 2012). Two research programs were carried out at Wageningen University and Research Centre to facilitate the reduction of PM emissions from animal houses. In a first research programme an extensive emission survey was performed quantifying the emission rates (inhalable dust, PM10, and PM2.5) of 14 types of buildings (total: 40 farm locations) housing poultry, pigs, dairy and mink. In a second research programme, a broad array of mitigation options were developed, tested on a semi-practical scale and validated on commercial farms in practice. The PM10 emission rates obtained from the first research programme have been set as official emission factors by the Dutch Ministry of Infrastructure and Environment (factors are expressed in: gram/animal place per year). The reductions of mitigation techniques for PM10 obtained from validation measurements at commercial farms have been adopted as annual average emission reductions (expressed in percentage reduction). These official figures are published on the website of the ministry and updated regularly2. In order to receive an environmental permit from the local municipality, farmers who wish to construct an animal house must first assess the expected effect of this future building on ambient PM concentrations at the nearest exposed object (e.g., the nearest house). This assessment is done by using a standardized Gaussian dispersion model for PM10 (termed: ISL3a). The model uses the coordinates of the emitting building, the coordinates of the nearest exposed object, the number of
2 http://www.rijksoverheid.nl/documenten-en-publicaties/publicaties/2013/03/15/emissiefactoren-fijn-stof-voor-veehouderij-2013.html (MS Excel file).
Livestock Research Report 797 | 21

animal places of the building, the emission factor associated with the housing system inside the building, the exhaust air speed and direction (vertically or horizontally), meteorological conditions, and so on, to estimate the distribution of future exposures at the coordinates of the nearest exposed residential objects. As set in European legislation, the day-average PM10 concentration should not be exceeded more than 35 days per year. If this is the case, mitigation measures must be taken in order to receive the environmental permit. PM exposure and exposure regulation
Until 2007, the protection of Dutch workers against hazardous compounds was based on Maximum Acceptable Concentrations (or: MAC values) issued by the Dutch Ministry of Social Affairs and Employment. In 2007, this framework has been changed. The protection of workers has since then in principle been regarded as a responsibility of employers to their personnel. Each employer should now assess which compounds may pose a threat to their employees, establish limit values (‘private limit values’) and take measures to ensure safety. This however is only the case for farmers that can be regarded as ‘employer’. Limit values for farmers that have personnel should be based on sound sources, like information from epidemiological studies or safe levels advised by the Dutch Health Council. Besides these private limit values, a limited set of ‘public values’ are issued by the government for a number of compounds (e.g., carcinogenic substances). Particulate matter (or specifically animal house PM) is not included in this list of public limit values. When measures are taken to reduce exposure to PM, the use of respiratory masks is probably the most common applied measure. In farming practice, this occupational regulatory framework probably has no lowering effect on PM emissions from animal houses.
6.3 PM emissions and regulations in Denmark
Agriculture accounts for 29% of the total TSP emission, the emission shares for PM10 and PM2.5 are 18% and 5% respectively. Most agricultural emissions originate from livestock production. The emissions from livestock production include PM from housing systems for cattle, pigs, poultry, horses, sheep, and goats. In 2009, these emissions, expressed as TSP, were an estimated 11.255 kt. Of this, 78% related to pig production. The emission from cattle and poultry contributed 12% and 10%, respectively. The contribution of field burning is only ~1% of the total agricultural PM emission. PM emissions from field operations are not included in the Danish emission inventory due to the lack of validated data. So, at present, Denmark does not regulate PM emission from production facilities. However PM concentration thresholds for indoor facilities are included in the Danish Act on Working Environment as described in (Arbejdstilsynet, 2007). The parameter used for evaluating the PM level inside facilities in DK is a time weighted mean PM concentration, expressing the average exposure level in the inhalable air during an 8-hour working day. In a time weighted mean, the impact of each measurement is proportional to its sampling period, causing the impact of a measurement with a 2-hour sampling period to be twice as big as the impact of a measurement with a 1-hour sampling period. Based on this 8-hour time weighted mean, a threshold of 3 mg/m3 is given for the total dust concentration. In addition, the threshold must not be exceeded by more than 100% during a period of maximum 15 minutes. Total dust is defined through the sampling method; total dust is simply all dust collected at an inlet velocity of 1.25 m/s without the use of separators such as cyclones or similar instruments. In pig units, PM is assumed to be organic causing the threshold concentration of 3 mg/m3 for total organic dust to be the valid threshold in pig stables. In agreement, the threshold limit for a given period of maximum 15 minutes is then 6 mg/m3. If several (problematic) compounds co-exist (e.g. PM and ammonia), their impact will be considered additive (unless opposing information is available). The combined effect of co-existing compounds should then be calculated as:
𝐼𝐼𝐼𝐼𝑡𝑡𝑡𝑡 =𝐶𝐶𝐶𝐶1𝑇𝑇𝑇𝑇1
+𝐶𝐶𝐶𝐶2𝑇𝑇𝑇𝑇2
+ ⋯𝐶𝐶𝐶𝐶𝑛𝑛𝑛𝑛𝑇𝑇𝑇𝑇𝑛𝑛𝑛𝑛
where: It is the total impact of compounds; C is the measured concentration of a given compound; T is the threshold of a given compound; 1, 2, …, n indicate compound numbers 1, 2 and n.
22 | Livestock Research Report 797

In a case where several compounds co-exist, the total impact should not exceed the value of 1 for the 8-hour time weighted mean, and 2 for any period of maximum 15 min.
6.4 PM emissions and regulations in Belgium
There are no global emission targets established for total dust in Flanders. The emission of total dust is regulated in VLAREM for point sources (permit regulation). To comply with the European Directive 2001/80/EC, the emission limit values for large combustion plants were adjusted in 2004. Since 2008 the emission limit values of total dust for new and existing plants is greatly reduced. Emissions of total primary dust decreased from 49.3 kt in 1995 to 31.1 kt in 2009. After a sharp decline in the period 1995–2000, a more stagnated decline was observed in the period 2001-2005. In the period 2005-2009 the emissions decreased further. Agriculture is one of the main sources of total dust, be it that a large proportion is attributed to windblown soil dust. Emissions decreased partly through a series of policy measures: (1) the adaptation of VLAREM to comply with the European Directive 2001/80/EC, and (2) VLAREM II provides emission limits for specific industrial activities, such as smelters, foundries, coke ovens, aluminum production and granulation of mineral fertilizers. TSP emissions decreased by 6% between 2000 and 2012. This decrease was largely due to the reduction of exhaust emissions by traffic. These emissions decreased with the introduction of environmentally friendly and more efficient vehicles. The power plants and refineries contributed to a large extent. The emissions from agriculture decreased slightly (16% to 13%) mainly by a reduced energy consumption. The emissions by households raised significantly mainly due to an increased use of biomass. The emissions from households and emissions by re-suspension (windblown PM) are responsible for 30% and 27% of the TSP emissions in Flanders respectively. PM10 emissions decreased by 7% in the period 2000–2012. This decrease was largely due to the large reduction of exhaust emissions from traffic. Also the energy sector contributed significantly. Emissions show a declining trend for agriculture (14% to 11%), trade and services and industry. Households had the largest contribution to the overall PM10 emission in 2012 (43%), followed by industry (15%). For PM10, emissions through re-suspension amounted to the third largest source (11%). Transport and industry are the main emission source of PM2,5. PM2,5 emissions decreased by 7% in the period 2000–2012. This decrease is largely due to the large reduction of exhaust emissions from traffic. Also the energy sector contributes significantly. Emissions show a declining trend for agriculture (11% to 8%), trade and services, off-road and industry. Households had the largest contribution in the overall PM2,5 emissions in 2012 (56%). For PM2,5 there are no emissions through re-suspension (0%). The Flemish MINA plan 4 (2011–2015) includes only emission targets for PM2.5. These targets apply for transport emissions (transport sector plus off-road and fisheries), with maximum 2.3 kt by 2015, and for stationary sources, with 6.0 kt by 2015. Provisional results indicate that the emissions are still well above the MINA plan targets. Following the review of the Göteborg Protocol in May 2012, the NEC targets will probably be expanded with targets for particulate matter. This may take place in 2014. In Flanders also the Royal Decree on occupational safety (2002) applies. This decree states exposure limits of 3 and 10 mg/m³ during a reference period of 8 hours for PM2,5 en PM10 respectively. However, this regulation is not yet subject of surveys in agricultural production systems.
Livestock Research Report 797 | 23
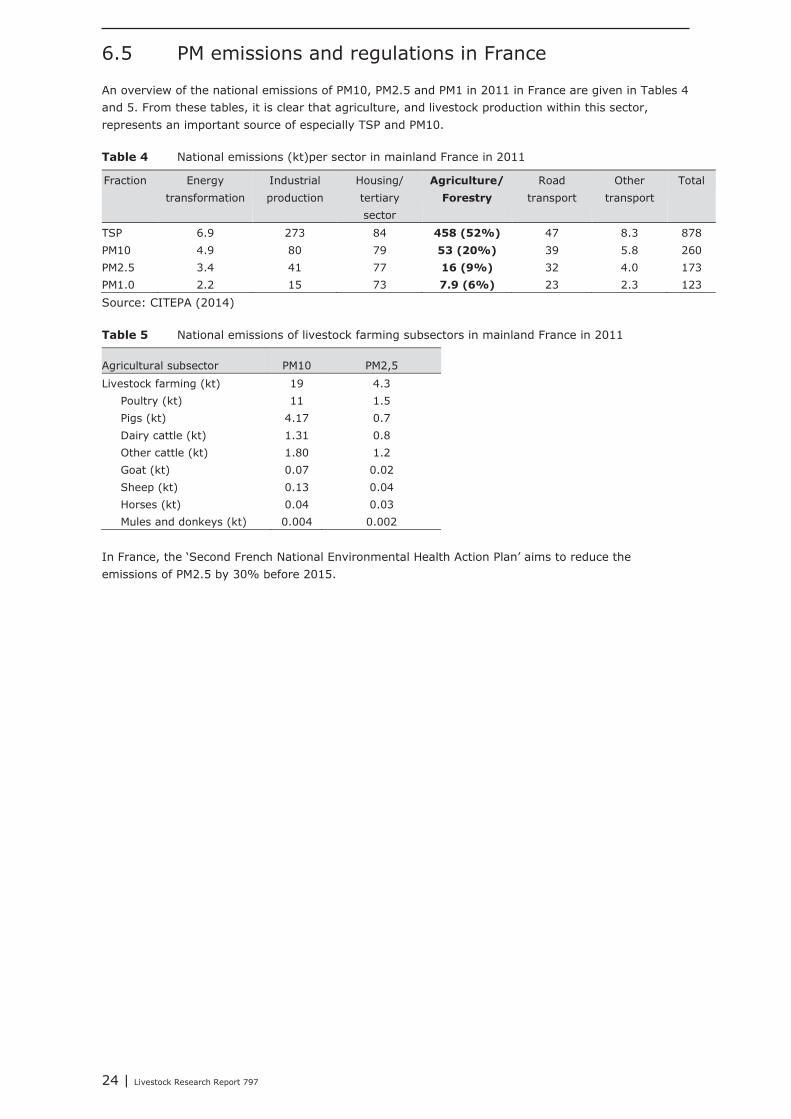
6.5 PM emissions and regulations in France
An overview of the national emissions of PM10, PM2.5 and PM1 in 2011 in France are given in Tables 4 and 5. From these tables, it is clear that agriculture, and livestock production within this sector, represents an important source of especially TSP and PM10. Table 4 National emissions (kt)per sector in mainland France in 2011
Fraction Energy transformation
Industrial production
Housing/ tertiary sector
Agriculture/
Forestry
Road transport
Other transport
Total
TSP 6.9 273 84 458 (52%) 47 8.3 878 PM10 4.9 80 79 53 (20%) 39 5.8 260 PM2.5 3.4 41 77 16 (9%) 32 4.0 173 PM1.0 2.2 15 73 7.9 (6%) 23 2.3 123
Source: CITEPA (2014) Table 5 National emissions of livestock farming subsectors in mainland France in 2011
Agricultural subsector PM10 PM2,5
Livestock farming (kt) 19 4.3 Poultry (kt) 11 1.5 Pigs (kt) 4.17 0.7 Dairy cattle (kt) 1.31 0.8 Other cattle (kt) 1.80 1.2 Goat (kt) 0.07 0.02 Sheep (kt) 0.13 0.04 Horses (kt) 0.04 0.03 Mules and donkeys (kt) 0.004 0.002
In France, the ‘Second French National Environmental Health Action Plan’ aims to reduce the emissions of PM2.5 by 30% before 2015.
24 | Livestock Research Report 797

7 Summaries of finalised and on-going research projects
7.1 An PM emission survey in the Netherlands (finalised)
After the development of measurement methods for PM10 and PM2.5 (Hofschreuder et al., 2008; Zhao et al., 2009) (also see par. 4.1), these methods have been used in the Netherlands to determine emission rates from commonly used animal housing systems in a large emission survey. This survey was conducted between 2007 and 2010, covered a total of 14 different housing systems for poultry, pigs and dairy cattle, and included a total of 40 different farm locations. At each location, 6 (sometimes 5) 24-h measurements were carried out, which included concentrations of inhalable PM, PM10 and PM2.5, ammonia, odour, methane and nitrous oxide, ventilation rate, and climate conditions. The measurements were carried out following the Dutch protocols on the determination of PM emissions from animal houses (Hofschreuder et al., 2008; Ogink et al., 2011). From this survey, a series of initial reports (in Dutch, with English summary) have been published (Table 6). Recently, a paper has been submitted to a scientific journal in which an overall analysis of the dataset on PM concentrations, ventilation rates, PM emissions, and ventilation rates is reported (Winkel et al., 2014c).
Table 6 Overview of initial reports published from the PM emission survey in the Netherlands. With URLs for quick access to reports (in Dutch, with English summary)
Animal type Farms Report
URL to online report
Layers, floor 4 Mosquera et al. (2009b). Dust emission from animal houses: layer hens in floor housing (Report 279)
http://edepot.wur.nl/14562
Layers, aviary 4 Winkel et al. (2009b). Dust emission from animal houses: layer hens in aviary systems (Report 278)
http://edepot.wur.nl/14750
Broiler breeders 2 Mosquera et al. (2009a). Dust emission from animal houses: broiler breeders (Report 276)
http://edepot.wur.nl/14560
Broilers, floor 4 Winkel et al. (2009c). Dust emission from animal houses: broilers (Report 275)
http://edepot.wur.nl/14559
Turkeys 2 Mosquera et al. (2009c). Dust emission from animal houses: turkeys (Report 277)
http://edepot.wur.nl/14561
Pregnant sows 4 Mosquera et al. (2010c). Dust emission from animal houses: pregnant sows (Report 294)
http://edepot.wur.nl/135666
Piglets 4 Winkel et al. (2010). Dust emission from animal houses: piglets (Report 293)
http://edepot.wur.nl/135665
Fattening pigs 8 Mosquera et al. (2010b). Dust emission from animal houses: growing and finishing pigs (Report 292)
http://edepot.wur.nl/135664
Dairy cattle 4 Mosquera et al. (2010a). Dust emission from animal houses: dairy cattle (Report 296)
http://edepot.wur.nl/135667
Minks 4 Mosquera et al. (2011). Dust emission from animal houses: minks (Report 340)
http://edepot.wur.nl/163740
The PM emission rates reported have been laid down as PM emission factors (expressed in gram per animal place per year, including a correction for ‘empty periods’ of housing systems) in Dutch legislation. In the Netherlands, these emission factors are now used in combination with a PM dispersion model (name: ISL3a) to assess the effects of new farms on ambient PM concentrations.
Livestock Research Report 797 | 25

7.2 A research programme on PM emission abatement in
poultry houses in the Netherlands (finalised)
Since poultry houses have the largest contribution to the total amount of PM emitted from livestock production in the Netherlands, a research programme was set up to develop and test mitigation technologies so that these would become available for the poultry industry. The basis of this research programme was a Plan of Action published by Ogink and Aarnink (2011). The technologies that were developed and tested are listed in Table 7, together with the main reports from this research.
Table 7 Overview of the main publications (either journal papers or reports) on semi-practical experiments and field tests of air cleaning technologies from the research programme on PM emission abatement in poultry houses. With URLs for quick access to reports (in Dutch, with English summary)
Technology Publication
URL to online report
Negative air ionisation (inside)
Cambra-López et al. (2009). Ionization for reducing particulate matter emissions from poultry houses. Trans. ASABE 52(5):1757-1771.
-
Winkel et al. (2011b). Measures to reduce fine dust emission from poultry: validation of an ionization system on broiler farms (Report 462)
http://edepot.wur.nl/166947
Winkel et al. (2009d). Measures to reduce fine dust emission from poultry houses: ionization in aviary housing for layers (Report 285)
http://edepot.wur.nl/138526
Pos. air ionisation (inside)
Winkel et al. (2013b). Measures to reduce fine dust emission from poultry houses: validation of an ionisation system on layer farms (Report 685)
http://edepot.wur.nl/260484
Oil spraying onto the litter
Aarnink et al. (2011). Dust reduction in broiler houses by spraying rapeseed oil. Trans. ASABE 54(4):1479-1489.
-
Winkel et al. (2009a). Measures to reduce fine dust emission from poultry: optimization of an oil spraying system for broilers (Report 204)
http://edepot.wur.nl/10596
Winkel et al. (2011d). Measures to reduce fine dust emission from poultry houses: validation of an oil spraying system on broiler farms (Report 392)
http://edepot.wur.nl/166950
Winkel et al. (2012b). Measures to reduce […] from poultry: optimization of oil application on litter of aviary housing for layers (Report 597)
http://edepot.wur.nl/210164
Winkel et al. (2013a). Measures to reduce fine dust emission from poultry: validation of an oil spraying robot on a layer farm (Report 686)
http://edepot.wur.nl/260488
Winkel et al. (2014a). Measures to reduce fine dust emission from poultry: validation of an oil spraying system on a layer farm (Report in press)
-
Water spraying onto the litter
Harn et al. (2012a). Measures to reduce fine dust emission from poultry: effect of water spraying on bedding material on the fine dust emission in aviary housing systems for layers (Report 425)
http://edepot.wur.nl/203019
Harn et al. (2012b). Measures to reduce fine dust from poultry housings: effects of the frequency of water spraying on the litter floor in aviary housing systems for laying hens (Report 565)
http://edepot.wur.nl/202813
Harn et al. (2013). Measures to reduce fine dust emission from poultry houses: effects of application of an acidified water film on the litter floor of laying hen houses with aviary housing systems (Report 573)
http://edepot.wur.nl/259260
Dry filter wall (‘end of pipe’)
Winkel et al. (2011c). Measures to reduce fine dust emission from poultry houses: validation of a dry filter wall on layer farms (Report 394)
http://edepot.wur.nl/170798
Pos. ionisation (‘end of pipe’)
Winkel et al. (2012a). Measures to reduce fine dust emission from poultry houses: validation of an ionisation filter on layer farms (Report 440)
http://edepot.wur.nl/200711
Manure dryers for PM filtration (‘end of pipe’)
Winkel et al. (2011a). Dust emission from animal houses: laying hens in houses with a tunnel drying system (Report 280)
http://edepot.wur.nl/166949
Heat exchangers for PM filtration (‘end of pipe’)
Ellen et al. (2013). Measures to reduce fine dust emission from poultry houses: validation of an heat exchanger on broiler farms (Report 621)
http://edepot.wur.nl/259023
Simple water scrubber (‘end of pipe’)
Hol et al. (2010). Measures to reduce fine dust emissions from poultry housings: indicative research into dust removal by a water scrubber (Report 354)
http://edepot.wur.nl/151519
Harn et al. (2010). Measures to reduce fine dust from poultry housings: perspectives of a simple water scrubber (Report 326)
http://edepot.wur.nl/146828
Melse et al. (2011). Measures to reduce fine dust emissions from poultry housings: validation of a scrubber system with water as scrubbing solution at two poultry farms (Report 502)
http://edepot.wur.nl/184259
In the research programme, a number of technologies have been developed and tested under semi-practical conditions in a poultry research centre, before their efficacy was validated under field conditions in commercial poultry farms (e.g., ‘negative air ionisation’, ‘oil spraying onto the litter’ or
26 | Livestock Research Report 797

‘water spraying onto the litter’). Other technologies were already applied in practice or had been developed and tested by the air cleaning industry. Such technologies have directly been validated on commercial poultry farms, following the Dutch measurement protocol on PM emission (Ogink et al., 2011). This usually meant that a technology was installed at two different commercial farms and that the PM emission reduction of the technology was determined in a case-control setting (i.e., a test house versus an identical and adjacent control house on the same farm) or by conducting ‘upstream’ and ‘downstream’ measurements in the case of an ‘end of pipe’ technology. In any case, six measurements were carried out per farm. Based on this work, a number of technologies listed in Table 7 have made it to obtaining ‘approval’ of the Dutch ministry of Infrastructure and Environment. A list of approved technologies and their year-average reduction percentage on the house level is published in Dutch legislation3. Such technologies can now be chosen by farmers to install in new poultry houses and to receive an environmental permit of the local municipality. Besides the technologies listed, a number of ‘management measures’ have been tested experimentally, such as effects of different light regimes (Harn et al., 2009) or of litter types (Van Harn et al., 2012).
7.3 An EN 12341 equivalence study on five PM10 samplers in the Netherlands (finalised)
In 2012, a research project was started at Wageningen University and Research Centre to gain insight into systematic and random errors of samplers for PM10 inside animal houses. This project was started to make a contribution to the harmonisation of PM10 measurement methods across institutes and countries, and to explore the applicability of other measurement methods than those developed by Hofschreuder et al. (2008). A paper from this project has recently been submitted to a scientific journal (Winkel et al., 2014b). Therefore, in this report, only a brief description can be given of the project outline and type of results to be published.
In short, the low-volume PM10 reference sampler described in EN 12341 was used to determine the ‘true’ PM10 concentration. Instead of 2 samplers prescribed by EN 12341, 4 samplers were used and the mean concentration value was regarded as the ‘true’ concentration during a measurement. In total, five types of candidate samplers were used: a filter-based cyclone sampler, the Thermo Scientific FH 62 I-R beta-attenuation sampler, the Thermo Scientific Tapered Element Oscillating Microbalance, model 1400ab, the TSI DustTrak model 8520, and the GRIMM Portable Aerosol Spectrometer model 1.109. These candidate samplers were applied in duplicate. Therefore, the total number of devices for each measurement was (4+(5×2)=) 14. Measurements were carried out inside three main animal housing types: a growing-finishing pig house, a laying hen house, and a broiler house. A fourth measurement series was carried out in an office room of the institute. The analysis of the data collected was done as prescribed in EN 12341, in two ways. A first analysis was done to assess the degree to which two candidate samplers of the same type yield consistent concentrations when used side by side and simultaneously (‘comparability’; random errors). This test procedure can be found in in paragraph 5.2.3 of EN 12341. A second analysis was done to assess the degree to which candidate samplers yield concentration readings consistent with the reference sampler concentration (‘accuracy’; systematic errors). This test procedure can be found in paragraph 5.2.4 of EN 12341 and is based on simple linear regression, using the candidate sampler concentration as dependent and reference sampler concentration as independent variable. EN 12341 states a number of criteria that should be met by a candidate sampler to be regarded as ‘reference equivalent’. In the project, candidate samplers are assessed on the basis of these criteria.
Results show that the comparability between two devices of the same sampler type was lower than required by the EN 12341 standard. This aspect can be improved by taking the average of concentration values obtained from two or three samplers. Furthermore, considerable bias from the true concentration of the reference sampler was found for a number of devices. For these samplers, correction factors (using only a correction slope) or equations (using both a slope and an offset) are published. Such corrections can be simple means to calibrate measured values to reference sampler values.
3 http://www.infomil.nl/onderwerpen/landbouw-tuinbouw/ammoniak/regeling-ammoniak/stalbeschrijvingen/map-staltypen/7-additionele/
Livestock Research Report 797 | 27

7.4 The ‘PigDust’ project in Belgium (finalised)
PigDust was a 4 year research project (2009-2012) conducted by ILVO in cooperation with Ghent University on the characterisation of the particulate matter (PM) status in the Flemish pig fattening industry. This project was funded by the Flemish Agency for Innovation by Science and Technology. The scope of this research was to achieve a reduced measuring strategy for sampling PM, ammonia and greenhouse gases (GHG) in pig fattening facilities. Furthermore, indoor and emission measurements were performed in pig fattening facilities (PFF) to determine the indoor air quality and calculate emission factors. The indoor air quality data were also linked with the animal health status. The research concerning PM can be divided in two phases: 1) measuring methods and strategies, 2) indoor concentration and emission measurements. During the first part, the PM sampling method was examined. The objective was to test the comparability and equivalence of different instrumental techniques for the measurement of PM concentrations (PM10, PM2.5, and PM1) in heavy PM loaded agricultural aerosols like the indoor climate of a pig fattening facility. The equivalence assessments were performed according to EN 13205 (2002). Four types of instruments were included in these experiments: a reference instrument for ambient air according to Belgian and European regulations, a PM10 impactor, a beta attenuation monitor and two similar spectrometers. In most cases, comparable results in PM10 concentrations were found between the different instruments. Furthermore, for this fraction, equivalence according to EN 13205 (2002) was established with the spectrometers. For PM2.5 and PM1, the measured concentrations were less comparable between the different instruments, and consequently no equivalence could be shown (Van Ransbeeck et al., 2013b). To develop a measuring strategy for PM and gases, a large dataset was collected in a compartment of a conventional pig fattening facility on both indoor concentrations and emission rates, in order to make a detailed analysis of the temporal and spatial variations of these pollutants. Different PM fractions ranging from 0.25 to 32 µm were sampled continuously together with environmental parameters (i.e., temperature and relative humidity). Sampling position (19 locations) within the compartment showed a significant effect on the PM concentration, but this was small compared to the effect of the daily variations and the variation over the whole fattening period. The contribution of location to the variance of indoor PM concentrations was 6, 4 and 12% for PM1, PM2.5 and PM10, respectively. The effect of daily variations contributed 29, 65 and 58% to the concentration variance, while the effect of variation over the fattening period was 65, 31 and 31% for PM1, PM2.5 and PM10, respectively. Based on these conclusions, a measuring strategy for pig fattening facilities was proposed (Van Ransbeeck et al., 2012). For one fattening period, the strategy consists of 4 specific sampling periods of 48 hours. This measuring strategy offers the possibility to shorten the total sampling time significantly and to reduce the number of measurements without loss of important PM concentration characteristics (e.g., daily peak concentrations and emission factors). This strategy also allows a reconstruction of the evolution of PM concentrations over the entire fattening period. During the second part of this research, indoor concentrations of PM (PM1, PM2.5 and PM10) in different conventional PFF and one low ammonia emission fattening facility (LAE) were measured based on the reduced measuring strategy. Concentration data were used to calculate respective emission factor (EF) which were assessed and evaluated with regard to similar studies. In total, six pig fattening stables were sampled during two fattening periods. The average indoor PM concentrations were 15.0, 38.9 and 719 µg/m3 for PM1, PM2.5 and PM10 respectively for conventional pig fattening stables, while for the LAE stable, these were 14.2, 41.2 and 595 µg m-3 respectively. The emission factors of the conventional fattening facilities were 3.4, 7.8 and 99.9 g yr-1 a-1 for P PM1, PM2.5 and PM10 respectively. For the LAE the emission factors were 2.3, 7.3 and 85.3 g yr-1 a-1 for PM1, PM2.5 and PM10 respectively (Van Ransbeeck et al., 2013a). Furthermore, the particle size distribution and the correlations between indoor concentrations, emissions and different operational conditions were investigated. Finally, also PM exposure levels for both the farmer and the veterinarian during different operational tasks in pig fattening houses were assessed and their exposure levels on a daily working basis (time weighted average (TWA)) were estimated (Van Ransbeeck et al., 2014). The measured PM fractions were: inhalable and respirable PM, PM1, PM2.5 and PM10. Furthermore, the effects of pig age, pen floor type (conventional or low emission surface) and cleaning of the pens on
28 | Livestock Research Report 797

the personal PM exposure were investigated. Also the indoor concentrations of NH3, CH4, and CO2 were measured during some operational tasks. The results showed that personal exposure levels can become extremely high during some operational tasks performed by the farmer or veterinarian. The highest concentration levels were observed during feed shovelling and blood sampling, the lowest during the weighing of the pigs. For the farmer, the estimated TWA exposure levels of inhalable and respirable PM were 6.0 and 0.29 mg/m3 respectively. The exposure levels for the veterinarian were respectively 10.6 and 0.74 mg/m3. The PM concentration levels were mainly determined by the performed operational tasks. There was no significant effect of pig age, pen floor type, or cleaning of the pens on the personal exposure levels. Concerning animal health, PM10 and NH3 did not affect animal performance or the extent and prevalence of pneumonia. PM10 and NH3 only influenced nPCR results numerically. However, PM10 was positively associated with pleurisy lesions. Further research is necessary to assess the influence of PM10 and NH3 on other important respiratory pathogens in pigs.
7.5 The ‘MultiPol’ project in Belgium (on-going)
MultiPol is a 4 year research project (2011–2015) conducted by ILVO in cooperation with Ghent University on the behaviour of the main pollutants in pig fattening barns and their possible interactions. This project is an ILVO PhD grant. The main objectives are to examine the influence of different housing and farm management techniques on the emission of the most important air pollutants. This multi-pollutant strategy takes into account ammonia, greenhouse gases (methane, nitrous oxide and carbon dioxide) and particulate matter. The influence of the different housing techniques can be evaluated through the analysis of both existing data collected during previous projects, and new experiments. The influence of cleaning protocols, and feeding management, will also be examined experimentally. During a large-scale measurement campaign, the influence of two different cleaning protocols is investigated in a commercial pig barn in Flanders (Ulens et al., 2014b). The study involves dry cleaning versus dry and wet cleaning with the application of a disinfectant afterwards. These two cleaning protocols are simultaneously tested in a barn with both fully slatted floors and low ammonia emission compartments. Data-analysis, based upon experimental data of earlier research projects, will allow to validate recently developed emission measuring strategies. The influence of the feed formulation is investigated in experimental pig nurseries at ILVO (Ulens et al., 2014a). Data analysis showed that the use of a low-ammonia-emission housing system under field conditions does not seem to lower the indoor concentrations of NH3, CO2, N2O or PM. The CH4 indoor concentrations were reduced, however, in the low-ammonia-emission system. The use of a more extensive cleaning protocol, with an additional wet cleaning and disinfection step, did not result in consistently lower indoor concentrations for the studied pollutants, suggesting that dry cleaning by itself may already be sufficient to reduce the pollutant concentrations. Also, preliminary research was conducted on the ammonium content of PM from indoor pig housing systems. This aspect was addressed in the hypothesis that secondary particulate matter formation could take place inside animal houses (e.g. ammonium salts). If so, this could be an important aspect to take into account in the modelling approach to assess the contributions by the agricultural sector with regard to PM10 (54%) and PM2.5 (49%) in Flanders. This work was supported by Boerenbond, a professional association of Flemish farmers. Samples of PM10 and PM2.5 were taken at a commercial fattening pig facility in Flanders in order to check the hypothesis of secondary particulate matter formation inside animal housing systems. The ammonium content of PM10 and PM2.5 captured inside the animal houses was higher than the ammonium content of these fractions at the air inlet, indicating the possible indoor formation of secondary particulate matter. The results of this preliminary research therefore suggest the occurrence of secondary particulate matter formation inside animal housing systems. However, these provisional conclusions are based upon a limited number of samples. A more extended sampling campaign would be necessary for final confirmation.
7.6 The ‘BlesPigs’ project in Belgium (started)
BlesPigs is a rather large scale research project (2014–2018) conducted by ILVO in cooperation with Ghent University, Inagro and Innovatiesteunpunt on the development of housing techniques and management tools for the reduction of odour and PM emissions in the Flemish pig husbandry. This
Livestock Research Report 797 | 29

project is funded by the Flemish Agency for Innovation by Science and Technology and aims to deliver solutions through the development, dissemination and implementation of suitable housing techniques and management tools for the reduction of odour and PM emissions from both existing and new housings. The project will develop three research lines to achieve these goals: (1) on ventilation techniques, (2) on techniques for air treatment (air scrubbers) and (3) on techniques for air guidance outside the stable (e.g., shelterbelts, wind breaking walls). The deliverables of the project should support the ILVO vision for ‘the stable for the future’ needing innovative, validated, affordable, easy to implement and easy to use technique combinations for emission reduction of odour, PM and ammonia.
30 | Livestock Research Report 797
8 Recommendations
8.1 Recommendations for the VERA test protocols
From this work, the following recommendations are given: 1. It is recommended to use the term ‘particulate matter’ in test protocols instead of ‘dust’. The first
term refers to all ‘fine solid or liquid particles suspended in a gaseous medium’, whereas the latter term usually only refers to ‘solid particles formed by mechanical fracture of a material’ (Chapter 1).
2. It is recommended that testing institutes should report the exact PM fraction that has been
sampled, i.e., by referring to a fraction that is described in a standard, by mentioning its 50%-cut off diameter or by giving its cut-off curve. An overview of terms, size fractions, definitions and cut-off curves has been provided in this report (Chapter 1).
3. It is recommended that removal efficiencies of air cleaning technologies should be based on
particle mass concentrations (i.e., µg/m3 or mg/m3) and not on particle number concentrations (Chapter 3.1).
4. When measurements by testing institutes are meant to produce absolute PM concentration values
or absolute PM emission rates, measurement methods should produce concentrations near the true concentration. Systematic bias of measurement methods can be severe. It is recommended that measurement methods are only used after equivalence tests to relevant reference samplers have been carried out and published, and corrective measures have been taken. Such measures may for instance include the recalibration of a method using the PM of interest or the use of correction factors. No standard is available that describes how to perform equivalence tests in livestock production settings. The standards listed in Table 3 (Chapter 5) however, provide some guidance, for instance with regard to reference samplers, general procedures and statistical tests. In general, standard EN 12341 provides many useful elements, whereas EN 13205 contains flaws and should be used carefully.
5. When measurements by testing institutes are meant to produce a PM removal efficiency on a
relative scale (i.e., determined from the PM concentrations downstream and upstream of a technology) or meant to produce a PM emission mitigation efficiency on a relative scale (i.e., determined from the PM emissions of a treatment house and a control house), systematic bias of a sampler (i.e., a systematic deviation of the measured concentration from the true concentration) would in principle be less relevant. When the exact same error is made on both sides of an air cleaning technology, this error would be cancelled out when calculating a removal efficiency. It is however questionable whether the latter assumption can be met in practice, since the particle size distribution and air characteristics usually change when the air flow passes an air cleaning technology. These downstream changes may well give rise to errors of a different nature or magnitude. Therefore, also in this situation, samplers are needed that produce concentrations near the true concentration.
6. Regardless of whether measurements are carried out in the situation described under 4. or 5., it
is recommended that concentration values at a sampling position are in principle taken in duplicate, since the random error between instruments of the same measurement method are relatively high in livestock production settings. This principle may be further adapted to a ‘multiple single sampling’ approach for situations where several single measurements are taken spread over at a large cross-sectional area (as is often the case in filter walls, air scrubbers, biofilters, etcetera). The latter approach covers both spatial variation and random error between instruments.
Livestock Research Report 797 | 31
7. It is recommended not to use measurement methods based on light-scattering under very humid
conditions, such as downstream of scrubbers, heat exchangers or manure drying systems. The uptake of water by the particles can interfere with the working principle of light-scattering. In these cases, a gravimetric method is the best option available at the moment.
8. A recommended sampling time needs to be identified. In general, the current sampling duration
of 30/120 minutes, somewhere between 9:00 and 16:00, is very short. It is recommended that in principle technologies are tested over one 24-h period or over two periods: a day (light) period and a night (dark) period. Only when tests clearly reveal that there is no relevant variation in the removal efficiency of a technology over the course of a 24-h period, sampling can be done for a shorter time frame, but at least for 3 hours.
8.2 Recommendations for future research
The following general recommendations are given for further research: 9. Since at this moment no reference sampler for PM emission measurement in livestock production
is available, a reference sampler should be developed. 10. Subsequently, more insight is needed in systematic bias of gravimetric samplers, TEOM samplers,
light-scattering devices and other potential PM measuring methods (e.g. beta-ray attenuation samplers) in comparison to reference samplers.
11. Insight is also needed in the random error of measurement methods when multiple instruments
of the same type are operated side by side and simultaneously. 12. In-depth knowledge is needed on the specific vulnerabilities or artefacts of measurement
methods that underlie these systematic and random errors. 13. Consequently, satisfactory solutions need to be developed to reduce these systematic and
random errors (e.g., the use of correction factors, technical adaptations, intensified cleaning schedules, etcetera) and ascertain the unbiasedness of data produced.
More specifically, the following research needs are stated. 14. It needs to be identified to what extent non-isokinetic and isokinetic sampling methods yield
consistent concentration readings. Non-isokinetic sampling should be validated towards isokinetic sampling.
15. It needs to be identified to what extent adsorption and evaporation (both during sampling and
drying) of semi-volatile compounds occur. Measures to minimize the impact of these needs to be identified (e.g. using a back-up filter to account for gas adsorption).
16. It needs to be identified to what extent hygroscopic particle growth affects the collection of an
aimed particle size fraction when sampling PM at moist conditions (e.g., downstream of an air scrubber).
In all of these cases, it is evident that the output of any research on these issues in future is published, so that the scientific community and testing institutes can take note of new insights and further improve their measurement methods and procedures accordingly.
32 | Livestock Research Report 797

References
Aarnink, A. J. A., J. Van Harn, T. G. Van Hattum, Y. Zhao, and N. W. M. Ogink. 2011. Dust reduction in broiler houses by spraying rapeseed oil. Trans. ASABE 54(4):1479-1489.
Arbejdstilsynet. 2007. Grænseværdier for stoffer og materialer. København, Denmark: Arbejdstilsynet. Cambra-López, M., A. Winkel, J. Van Harn, N. W. M. Ogink, and A. J. A. Aarnink. 2009. Ionization for
reducing particulate matter emissions from poultry houses. Trans. ASABE 52(5):1757-1771. Cambra-López, M., A. J. A. Aarnink, Y. Zhao, S. Calvet, and A. G. Torres. 2010. Airborne particulate matter
from livestock production systems: A review of an air pollution problem. Environmental Pollution 158(1):1-17.
Cambra-López, M., T. Hermosilla, H. T. L. Lai, A. J. A. Aarnink, and N. W. M. Ogink. 2011. Particulate matter emitted from poultry and pig houses: Source identification and quantification. Trans. ASABE 54(2):629-642.
CEN. 1993. EN 481:1993. Workplace atmospheres - Size fraction definitions for measurement of airborne particles. Brussels, Belgium: Comité Européen de Normalisation (CEN; European Committee for Standardization).
CEN.1998.EN 12341:1998. Air quality - Determination of the PM 10 fraction of suspended particulate matter - Reference method and field test procedure to demonstrate reference equivalence of measurement methods. Brussels, Belgium: Comité Européen de Normalisation (CEN; European Committee for Standardization).
CEN. 2001. EN 13284-1:2001. Stationary source emissions - Determination of low range mass concentration of dust - Part 1: Manual gravimetric method. Brussels, Belgium: Comité Européen de Normalisation (CEN; European Committee for Standardization).
CEN. 2002. Workplace atmospheres - Assessment of performance of instruments for measurement of airborne particle concentrations. Brussels, Belgium: Comité Européen de Normalisation (CEN; European Committee for Standardization).
CEN. 2004. EN 13284-2:2004. Stationary source emissions - Determination of low range mass concentration of dust - Part 2: Automated measuring systems. Brussels, Belgium: Comité Européen de Normalisation (CEN; European Committee for Standardization).
CEN. 2005. EN 14907:2005. Ambient air quality - Standard gravimetric measurement method for the determination of the PM2.5 mass fraction of suspended particulate matter. Brussels, Belgium: Comité Européen de Normalisation (CEN; European Committee for Standardization).
CITEPA. 2014. Particulate Matter. Paris, France: Interprofessional Technical Centre for Studies on Air Pollution (CITEPA). Available at: http://www.citepa.org/en/air-and-climate/pollutants-and-ghg/particulate-matter.
Ellen, H. H., J. M. G. Hol, J. W. H. Huis in't Veld, G. M. Nijeboer, J. P. M. Ploegaert, and N. W. M. Ogink. 2013. Maatregelen ter vermindering van fijnstofemissie uit de pluimveehouderij: validatie van een warmtewisselaar op vleeskuikenbedrijven [Measures to reduce fine dust emission from poultry houses: validation of an heat exchanger on broiler farms]. Report 621. Lelystad, the Netherlands: Wageningen University and Research Centre, Livestock Research.
Harn, J. v., J. Mosquera Losada, and A. J. A. Aarnink. 2009. Maatregelen ter vermindering van fijnstofemissie uit de pluimveehouderij: invloed lichtschema op fijnstof- en ammoniakemissie uit vleeskuikenstallen [Measures to reduce fine dust emissions from poultry housings: influence light schedules on dust and ammonia emission from broiler houses]. Animal Sciences Group, Wageningen University and Research Centre. Lelystad, the Netherlands.
Harn, J. v., F. Dousma, and A. J. A. Aarnink. 2010. Maatregelen ter vermindering van fijnstofemissie uit de pluimveehouderij: perspectieven van een eenvoudige vernevelingswasser [Measures to reduce fine dust from poultry housings: perspectives of a simple water scrubber]. Report 326. Lelystad, the Netherlands: Wageningen University and Research Centre, Livestock Research.
Harn, J. v., H. H. Ellen, R. A. v. Emous, J. Mosquera Losada, G. M. Nijeboer, F. A. Gerrits, A. J. A. Aarnink, and N. W. M. Ogink. 2012a. Maatregelen ter vermindering van fijnstofemissie uit de pluimveehouderij: effect van een waterfilm op het strooisel op de fijnstofemissie bij leghennen in volièresystemen [Measures to reduce fine dust emission from poultry: effect of water spraying on bedding material on the fine dust emission in aviary housing systems for layers]. Report 425. Lelystad, the Netherlands: Wageningen University and Research Centre, Livestock Research.
Harn, J. v., H. H. Ellen, J. W. H. Huis in 'T Veld, and N. W. M. Ogink. 2012b. Maatregelen ter vermindering van fijnstofemissie uit de pluimveehouderij: effecten van de aanbrengfrequentie van een waterfilm op het
Livestock Research Report 797 | 33

strooisel bij leghennen in volièresystemen [Measures to reduce fine dust from poultry housings: effects of the frequency of water sprayin on the litter floor in aviary housing systems for laying hens]. Report 565. Lelystad, the Netherlands: Wageningen University and Research Centre, Livestock Research.
Harn, J. v., H. H. Ellen, R. A. v. Emous, and N. W. M. Ogink. 2013. Maatregelen ter vermindering van de fijnstofemissie uit pluimveestallen: effecten van het aanbrengen van een aangezuurde waterfilm op het strooisel bij leghennen in volièresystemen [Measures to reduce fine dust emission from poultry houses: effects of application of an acidified water film on the litter floor of laying hen houses with aviary housing systems]. Report 573. Lelystad, the Netherlands: Wageningen University and Research Centre, Livestock Research.
Heber, A. J., T. T. Lim, J. Q. Ni, P. C. Tao, A. M. Schmidt, J. A. Koziel, S. J. Hoff, L. D. Jacobson, Y. H. Zhang, and G. B. Baughman. 2006. Quality-assured measurements of animal building emissions: Particulate matter concentrations. Journal of the Air & Waste Management Association 56(12):1642-1648.
Hofschreuder, P., Z. Yang, A. J. A. Aarnink, and N. W. M. Ogink. 2008. Measurement protocol for emissions of fine dust from animal houses: considerations, draft protocol and validation. Report 134. Lelystad, the Netherlands: Animal Sciences Group, Wageningen University and Research Centre.
Hol, J. M. G., C. M. Groenestein, F. Dousma, R. W. Melse, and N. Ogink. 2010. Maatregelen ter vermindering van fijnstofemissie uit de pluimveehouderij: oriënterend onderzoek naar stofafvang door een waterwasser [Measures to reduce fine dust emissions from poultry housings: indicative research into dust removal by a water scrubber]. Report 354. Lelystad, the Netherlands: Wageningen University and Research Centre, Livestock Research.
ISO. 1995. ISO 7708. Air Quality – Particle size fraction definitions for health related sampling. Genève, Switzerland: International Organization for Standardization.
ISO. 2007. EN ISO 20988:2007. Air quality -- Guidelines for estimating measurement uncertainty. Genève, Switzerland: International Organization for Standardization.
JCGM. 2008. Evaluation of measurement data – Guide to the expression of uncertainty in measurement (GUM). Joint Committee for Guides in Metrology (JCGM).
Melse, R. W., J. M. G. Hol, F. Dousma, G. M. Nijeboer, and J. W. H. Huis in't Veld. 2011. Maatregelen ter vermindering van fijnstofemissie uit de pluimveehouderij: validatie van een luchtwassysteem met water als wasvloeistof bij twee pluimveebedrijven [Measures to reduce fine dust emissions from poultry housings: validation of a scrubber system with water as scrubbing solution at two poultry farms]. Report 502. Lelystad, the Netherlands: Wageningen University and Research Centre, Livestock Research.
Mosquera, J., R. A. van Emous, A. Winkel, F. Dousma, E. Lovink, N. W. M. Ogink, and A. J. A. Aarnink. 2009a. Fijnstofemissie uit stallen: (groot)ouderdieren van vleeskuikens [Dust emission from animal houses: broiler breeders]. Report 276. Lelystad, the Netherlands: Wageningen University and Research Centre, Livestock Research.
Mosquera, J., A. Winkel, F. Dousma, E. Lovink, N. W. M. Ogink, and A. J. A. Aarnink. 2009b. Fijnstofemissie uit stallen: leghennen in scharrelhuisvesting [Dust emission from animal houses: layer hens in floor housing]. Report 279. Lelystad, the Netherlands: Wageningen University and Research Centre, Livestock Research.
Mosquera, J., A. Winkel, R. K. Kwikkel, F. A. Gerrits, N. W. M. Ogink, and A. J. A. Aarnink. 2009c. Fijnstofemissie uit stallen: vleeskalkoenen [Dust emission from animal houses: turkeys]. Report 277. Lelystad, the Netherlands: Wageningen University and Research Centre, Livestock Research.
Mosquera, J., J. M. G. Hol, A. Winkel, i. Huis, J. W. H. t Veld, F. A. Gerrits, N. W. M. Ogink, and A. J. A. Aarnink. 2010a. Fijnstofemissie uit stallen: melkvee [Dust emission from animal houses: dairy cattle]. Report 296. Lelystad, the Netherlands: Wageningen University and Research Centre, Livestock Research.
Mosquera, J., J. M. G. Hol, A. Winkel, E. Lovink, N. W. M. Ogink, and A. J. A. Aarnink. 2010b. Fijnstofemissie uit stallen: vleesvarkens [Dust emission from animal houses: growing and finishing pigs]. Report 292. Lelystad, the Netherlands: Wageningen University and Research Centre, Livestock Research.
Mosquera, J., J. M. G. Hol, A. Winkel, G. M. Nijeboer, N. W. M. Ogink, and A. J. A. Aarnink. 2010c. Fijnstofemissie uit stallen: dragende zeugen [Dust emission from animal houses: pregnant sows]. Report 294. Lelystad, the Netherlands: Wageningen University and Research Centre, Livestock Research.
Mosquera, J., J. M. G. Hol, A. Winkel, J. W. H. Huis in 't Veld, F. Dousma, N. W. M. Ogink, and C. M. Groenestein. 2011. Fijnstofemissie uit stallen: nertsen [Dust emission from animal houses: minks]. Report 340. Lelystad, the Netherlands: Wageningen University and Research Centre, Livestock Research.
NIOSH. 1994. Method 500: particulates not otherwise regulated (total dust or total aerosol mass). National Institute for Occupational Safety and Health (NIOSH). Available from: http://www.cdc.gov/niosh/docs/2003-154/pdfs/0500.pdf. In NIOSH Manual of Analytical Methods (NMAM), 4th ed. Washington DC, USA: U.S. Government Printing Office.
Ogink, N. W. M., and A. J. A. Aarnink. 2011. Plan van aanpak bedrijfsoplossingen voor fijnstofreductie in de pluimveehouderij [Plan of action for particulate matter mitigation solutions in poultry]. Report 113. Lelystad, the Netherlands: Animal Sciences Group, Wageningen University and Research Centre.
34 | Livestock Research Report 797

Ogink, N. W. M., P. Hofschreuder, and A. J. A. Aarnink. 2011. Protocol voor meting van fijnstofemissie uit
huisvestingssystemen in de veehouderij 2010 [Protocol for the measurement of fine emissions from housings in animal production 2010]. Report 492. Lelystad, the Netherlands: Wageningen University and Research Centre, Livestock Research.
RIVM. 2014. Annual national emissions of PM10; in total and per sector/source, for 2012. Retrieved 11 February 2014, from http://www.emissieregistratie.nl. Bilthoven, the Netherlands: National Institute for Public Health and the Environment (RIVM).
Ulens, T., P. Demeyer, B. Ampe, H. Van Langenhove, and S. Millet. 2014a. Effect of grinding intensity and pelleting of the diet on indoor particulate matter concentration and growth performance of weanling pigs. Submitted paper.
Ulens, T., S. Millet, N. Van Ransbeeck, S. Van Weyenberg, H. Van Langenhove, and P. Demeyer. 2014b. The effect of different pen cleaning techniques and housing systems on indoor concentrations of particulate matter, ammonia and greenhouse gases (CO2, CH4, N2O). Livest. Sci. 159(1):123-132.
US-EPA. 2004. Air quality criteria for particulate matter - Volume I of II. Research Triangle Park, Durham NC, USA: United States Environmental Protection Agency.
US-EPA. 2013. List of designated reference and equivalent methods. Edition: December, 17, 2013. Available from: http://www.epa.gov/ttn/amtic/criteria.html. Washington DC, USA: Environmental Protection Agency (EPA).
US-EPA. 2014a. Reference method for the determination of particulate matter as PM10 in the atmosphere. Electronic Code of Federal Regulations (CFR), Title 40 (Protection of Environment), Part 50 (National primary and secondary ambient air quality standards), Appendix J. Retrieved February 11, 2014, from: http://www.ecfr.gov.
US-EPA. 2014b. Particulate Matter (PM-10). Retrieved February 11, 2014, from: http://www.epa.gov/airtrends/aqtrnd95/pm10.html.
US-EPA. 2014c. Reference method for the determination of fine particulate matter as PM2.5 in the atmosphere. Electronic Code of Federal Regulations (CFR), Title 40 (Protection of Environment), Part 50 (National primary and secondary ambient air quality standards), Appendix L. Retrieved February 11, 2014, from: http://www.ecfr.gov.
US-EPA. 2014d. Reference method for the determination of suspended particulate matter in the atmosphere (high-volume method). Electronic Code of Federal Regulations (CFR), Title 40 (Protection of Environment), Part 50 (National primary and secondary ambient air quality standards), Appendix B. Retrieved Februari 11, 2014, from: http://www.ecfr.gov.
Van Harn, J., A. J. A. Aarnink, J. Mosquera, J. W. Van Riel, and N. W. M. Ogink. 2012. Effect of bedding material on dust and ammonia emission from broiler houses. Trans. ASABE 55(1):219-226.
Van Ransbeeck, N., H. Van Langenhove, S. Van Weyenberg, D. Maes, and P. Demeyer. 2012. Typical indoor concentrations and emission rates of particulate matter at building level: A case study to setup a measuring strategy for pig fattening facilities. Biosyst. Eng. 111(3):280-289.
Van Ransbeeck, N., H. Van Langenhove, and P. Demeyer. 2013a. Indoor concentrations and emissions factors of particulate matter, ammonia and greenhouse gases for pig fattening facilities. Biosyst. Eng. 116(4):518-528.
Van Ransbeeck, N., S. Van Weyenberg, H. Van Langenhove, and P. Demeyer. 2013b. Indoor concentration measurements of particulate matter at a pig fattening facility: Comparison and equivalence tests with different sampling instruments and measuring techniques. Biosyst. Eng. 115(4):453-462.
Van Ransbeeck, N., H. Van Langenhove, A. Michiels, B. Sonck, and P. Demeyer. 2014. Farmer and veterinarian exposure levels of particulate matter and gases during different operational tasks in pig fattening houses. Annals of Agricultural and Environmental Medicine. Accepted for publication in 2014.
Van Zanten, M. C., A. Van Alphen, J. Wesseling, D. Mooibroek, P. L. Nguyen, H. Groot Wassink, and C. Verbeek. 2012. Monitoringsrapportage NSL 2012 [State of affairs of the National Air Quality Cooperation Programme 2012, in Dutch with English summary]. Report 680712004/2012. Bilthoven, the Netherlands: National Institute for Public Health and the Environment (RIVM).
VDI. 1994. VDI 2066. Part 5. Particulate matter measurement. Dust measurement in flowing gases; particle size selective measurement by impaction method. Cascade impactor. Düsseldorf, Germany: Verein Deutscher Ingenieure (VDI).
VDI. 1996. VDI 2463. Part 11. Particulate matter measurement. Measurement of mass concentration in ambient air. Filter method. Digitel DHA-80 filter changer. Düsseldorf, Germany: Verein Deutscher Ingenieure (VDI).
VDI. 1999. VDI 2463. Part 1. Particulate matter measurement. Gravimetric determination of the mass concentration of suspended particulate matter in ambient air. General principles. Düsseldorf, Germany: Verein Deutscher Ingenieure (VDI).
VDI. 2004. VDI 2066. Part 10. Particulate matter measurement. Dust measurement in flowing gases. Measurement of PM10 and PM2,5 emissions at stationary sources by impaction method. Düsseldorf, Germany: Verein Deutscher Ingenieure (VDI).
Livestock Research Report 797 | 35

VDI. 2006. VDI 2066 Part 1. Particulate matter measurement. Measuring of particulate matter in flowing
gases. Gravimetric determination of dust load. Fundamentals. Düsseldorf, Germany: Verein Deutscher Ingenieure (VDI).
Volckens, J., and D. Leith. 2003. Effects of sampling bias on gas-particle partitioning of semi-volatile compounds. Atmos. Environ. 37(24):3385-3393.
Winkel, A., M. Cambra-López, J. van Harn, T. G. van Hattum, and A. J. A. Aarnink. 2009a. Maatregelen ter vermindering van fijnstofemissie uit de pluimveehouderij: optimalisatie van een oliefilmsysteem bij vleeskuikens [Measures to reduce fine dust emission from poultry: optimization of an oil spraying system for broilers]. Report 204. Lelystad, the Netherlands: Animal Sciences Group, Wageningen University and Research Centre.
Winkel, A., J. Mosquera, J. M. G. Hol, G. M. Nijeboer, N. W. M. Ogink, and A. J. A. Aarnink. 2009b. Fijnstofemissie uit stallen: leghennen in volièrehuisvesting [Dust emission from animal houses: layer hens in aviary systems]. Report 278. Lelystad, the Netherlands: Wageningen University and Research Centre, Livestock Research.
Winkel, A., J. Mosquera, R. K. Kwikkel, F. A. Gerrits, N. W. M. Ogink, and A. J. A. Aarnink. 2009c. Fijnstofemissie uit stallen: vleeskuikens [Dust emission from animal houses: broilers]. Report 275. Lelystad, the Netherlands: Wageningen University and Research Centre, Livestock Research.
Winkel, A., R. A. van Emous, R. K. Kwikkel, N. W. M. Ogink, and A. J. A. Aarnink. 2009d. Maatregelen ter vermindering van fijnstofemissie uit de pluimveehouderij: ionisatie bij leghennen in volièrehuisvesting [Measures to reduce fine dust emission from poultry houses: ionization in aviary housing for layers]. Report 285. Lelystad, the Netherlands: Wageningen University and Research Centre, Livestock Research.
Winkel, A., J. Mosquera, J. M. G. Hol, T. G. van Hattum, E. Lovink, N. W. M. Ogink, and A. J. A. Aarnink. 2010. Fijnstofemissie uit stallen: biggen [Dust emission from animal houses: piglets]. Report 293. Lelystad, the Netherlands: Wageningen University and Research Centre, Livestock Research.
Winkel, A., J. Mosquera, H. H. Ellen, R. A. Van Emous, J. M. G. Hol, G. M. Nijeboer, N. W. M. Ogink, and A. J. A. Aarnink. 2011a. Fijnstofemissie uit stallen: leghennen in stallen met een droogtunnel [Dust emission from animal houses: laying hens in houses with a tunnel drying system]. Report 280. Lelystad, the Netherlands: Wageningen University and Research Centre, Livestock Research.
Winkel, A., J. Mosquera, J. W. H. Huis in't Veld, N. W. M. Ogink, and A. J. A. Aarnink. 2011b. Maatregelen ter vermindering van fijnstofemissie uit de pluimveehouderij: validatie van een ionisatiesysteem op vleeskuikenbedrijven [Measures to reduce fine dust emission from poultry: validation of an ionization system on broiler farms]. Report 462. Lelystad, the Netherlands: Wageningen University and Research Centre, Livestock Research.
Winkel, A., J. Mosquera, J. W. J. Huis in 't Veld, G. M. Nijeboer, and N. W. M. Ogink. 2011c. Maatregelen ter vermindering van fijnstofemissie uit de pluimveehouderij: validatie van een droogfilterwand op leghennenbedrijven [Measures to reduce fine dust emission from poultry houses: validation of a dry filter wall on layer farms]. Report 394. Lelystad, the Netherlands: Wageningen University and Research Centre, Livestock Research.
Winkel, A., J. Mosquera, J. van Harn, G. M. Nijeboer, N. W. M. Ogink, and A. J. A. Aarnink. 2011d. Maatregelen ter vermindering van fijnstofemissie uit de pluimveehouderij: validatie van een oliefilmsysteem op vleeskuikenbedrijven [Measures to reduce fine dust emission from poultry houses: validation of an oil spraying system on broiler farms; in Dutch, with English summary]. Report 392. Lelystad, the Netherlands: Wageningen University and Research Centre, Livestock Research.
Winkel, A., J. Mosquera, T. G. van Hattum, J. W. H. Huis in't Veld, G. M. Nijeboer, and N. W. M. Ogink. 2012a. Maatregelen ter vermindering van fijnstofemissie uit de pluimveehouderij: validatie van een ionisatiefilter op leghennenbedrijven [Measures to reduce fine dust emission from poultry houses: validation of an ionisation filter on layer farms]. Report 440. Lelystad, the Netherlands: Wageningen University and Research Centre, Livestock Research.
Winkel, A., R. A. van Emous, J. Mosquera Losada, G. M. Nijeboer, T. G. van Hattum, J. W. van Riel, A. J. A. Aarnink, and N. W. M. Ogink. 2012b. Maatregelen ter vermindering van fijnstofemissie uit de pluimveehouderij: optimalisatie aanbrengen oliefilm op strooisel bij leghennen in volièrehuisvesting [Measures to reduce fine dust emission from poultry: optimization of oil application on litter of aviary housing for layers]. Report 597. Lelystad, the Netherlands: Wageningen University and Research Centre, Livestock Research.
Winkel, A., J. W. H. Huis in't Veld, G. M. Nijeboer, K. Blanken, H. Schilder, T. G. Van Hattum, and N. W. M. Ogink. 2013a. Maatregelen ter vermindering van fijnstofemissie uit de pluimveehouderij: validatie van een oliefilmrobot op een leghennenbedrijf [Measures to reduce fine dust emission from poultry: validation of an oil spraying robot on a layer farm]. Report 686. Lelystad, the Netherlands: Wageningen University and Research Centre, Livestock Research.
Winkel, A., G. M. Nijeboer, J. W. H. Huis in 'T Veld, and N. W. M. Ogink. 2013b. Maatregelen ter vermindering van fijnstofemissie uit de pluimveehouderij: validatie van een ionisatiesysteem op leghennenbedrijven [Measures to reduce fine dust emission from poultry houses: validation of an
36 | Livestock Research Report 797

ionisation system on layer farms]. Report 685. Lelystad, the Netherlands: Wageningen University and Research Centre, Livestock Research.
Winkel, A., J. W. H. Huis in 't Veld, G. M. Nijeboer, and N. W. M. Ogink. 2014a. Maatregelen ter vermindering van fijnstofemissie uit de pluimveehouderij: validatie van een oliefilmsysteem op een leghennenbedrijf [Measures to reduce fine dust emission from poultry: validation of an oil spraying system on a layer farm]. Report, in press. Lelystad, the Netherlands: Wageningen University and Research Centre, Livestock Research.
Winkel, A., J. Llorens Rubio, J. W. H. Huis in’t Veld, J. Vonk, and N. W. M. Ogink. 2014b. Equivalence testing of filter-based, beta-attenuation, TEOM, and light-scattering devices for measurement of PM10 concentration in animal houses. Submitted paper.
Winkel, A., J. Mosquera, P. W. G. Groot Koerkamp, N. W. M. Ogink, and A. J. A. Aarnink. 2014c. Emissions of particulate matter from animal houses in the Netherlands. Submitted paper.
Zhao, Y., A. J. A. Aarnink, P. Hofschreuder, and P. W. G. Groot Koerkamp. 2009. Evaluation of an impaction and a cyclone pre-separator for sampling high PM10 and PM2.5 concentrations in livestock houses. Journal of Aerosol Science 40(10):868-878.
Livestock Research Report 797 | 37

Together with our clients, we integrate scientific know-how and practical experience to develop livestock concepts for the 21st century. With our expertise on innovative livestock systems, nutrition, welfare, genetics and environmental impact of livestockfarming and our state-of-the art research facilities, such as Dairy Campus and Swine Innovation Centre Sterksel, we support our customers to find solutions for current and future challenges.
The mission of Wageningen UR (University & Research centre) is ‘To explore the potential of nature to improve the quality of life’. Within Wageningen UR, nine specialised research institutes of the DLO Foundation have joined forces with Wageningen University to help answer the most important questions in the domain of healthy food and living environment. With approximately 30 locations, 6,000 members of staff and 9,000 students, Wageningen UR is one of the leading organisations in its domain worldwide. The integral approach to problems and the cooperation between the various disciplines are at the heart of the unique Wageningen Approach.
Wageningen UR Livestock ResearchP.O. Box 3386700 AH WageningenThe Netherlands T +31 (0)317 48 04 91E [email protected]/livestockresearch
Livestock Research Report 797
A pilot study
Albert Winkel, Peter Demeyer, Anders Feilberg, Malene Jørgensen, July Puterflam, Peter Engel
Measurement of particulate matter: recommendations for the VERA test protocol on air cleaning technologies
Omslag 797.indd 1 13-11-14 08:50