mcneil - all-stars for all time
TRANSCRIPT

7/25/2019 McNeil - All-Stars for All Time
http://slidepdf.com/reader/full/mcneil-all-stars-for-all-time 1/247

7/25/2019 McNeil - All-Stars for All Time
http://slidepdf.com/reader/full/mcneil-all-stars-for-all-time 2/247
A LL-STARS
FOR A LL TIME

7/25/2019 McNeil - All-Stars for All Time
http://slidepdf.com/reader/full/mcneil-all-stars-for-all-time 3/247
This page intentionally left blank

7/25/2019 McNeil - All-Stars for All Time
http://slidepdf.com/reader/full/mcneil-all-stars-for-all-time 4/247
A LSO BY W ILLIAM F. MCNEIL
AND FROM MCF ARLAND
Miracle in Chavez Ravine:The Los Angeles Dodgers in 1 988 (2008)
Black Baseball Out of Season:Pay for Play Outside of the Negro Leagues (2007)
Backstop: A History of the Catcherand a Sabermetric Ranking of 50 All-Time Greats (2006)
The Evolution of Pitching in Major League Baseball (2006)
Gabby Hartnett: The Life and Timesof the Cubs’ Greatest Catcher (2004)
The Single-Season Home Run Kings:Ruth, Maris, McGwire, Sosa, and Bonds (2d ed., 2003)
The California Winter League: America’s FirstIntegrated Professional Baseball League (2002; paperback 2008)
Cool Papas and Double Duties:The All-Time Greats of the Negro Leagues (2001; paperback 2005)
Baseball’s Other All-Stars: The Greatest Players from the Negro Leagues, the Japanese Leagues, the Mexican League,
and the Pre–1 960 Winter Leagues in Cuba,Puerto Rico and the Dominican Republic (2000)
The King of Swat: An Analysis of Baseball’s Home Run Hitters from the Major, Minor, Negro and Japanese Leagues (1997)

7/25/2019 McNeil - All-Stars for All Time
http://slidepdf.com/reader/full/mcneil-all-stars-for-all-time 5/247
This page intentionally left blank

7/25/2019 McNeil - All-Stars for All Time
http://slidepdf.com/reader/full/mcneil-all-stars-for-all-time 6/247
A LL-STARS
FOR A LL TIME A Sabermetric Ranking
of the Major LeagueBest, 1 876–2007
W ILLIAM F. MCNEIL
McFarland & Company, Inc., Publishers
Jefferson, North Carolina, and London

7/25/2019 McNeil - All-Stars for All Time
http://slidepdf.com/reader/full/mcneil-all-stars-for-all-time 7/247
LIBRARY OF CONGRESS C ATALOGUING-IN-PUBLICATION D ATA
McNeil, William. All-stars for all time : a sabermetric ranking of the major
league best, 1876–2007 / William F. McNeil.p. cm.
Includes bibliographical references and index.
ISBN 978-0-7864-3500-5
softcover : 50# alkaline paper
1. Baseball— United States— History. I. Title.
GV863.A 1M427 2009796.3570973—dc22
2008039635
British Library cataloguing data are available
©2009 William F. McNeil. All rights reserved
No part of this book may be reproduced or transmitted in any formor by any means, electronic or mechanical, including photocopying or recording, or by any information storage and retrieval system,without permission in writing from the publisher.
On the cover: Shoeless Joe Jackson (author’s collection)
Manufactured in the United States of America
McFarland & Company, Inc., Publishers Box 6 11 , Jefferson, North Carolina 28640
www.mcfarlandpub.com
7/25/2019 McNeil - All-Stars for All Time
http://slidepdf.com/reader/full/mcneil-all-stars-for-all-time 8/247
To the latest arrival in the McNeil clan, Jamie Eileen Riley,
a beautiful Irish colleen withlovely brown hair and bright blue eyes.
She weighed in at seven pounds, two ounces,at 4:55 P.M., MDT, on August 3, 2007,
in Albuquerque, New Mexico.

7/25/2019 McNeil - All-Stars for All Time
http://slidepdf.com/reader/full/mcneil-all-stars-for-all-time 9/247
Acknowledgments
I would like to acknowledge and thank the following people and organ-izations for their assistance.Pete Palmer once again came to my rescue and has generously permit-
ted me to use statistics from his book, The Baseball Encyclopedia . James R. Madden, Jr., a friend, and a fine researcher and photographer,
has authorized me to publish his photos of Barry Bonds, Randy Johnson, Alex Rodriguez, Ichiro Suzuki, and Ken Griffin, Jr.
Jay Sanford, another long-time friend, has authorized me to use severalphotos from his personal collection, including Lou Boudreau, Eddie Math-
ews, Ron Santo, and Brooks Robinson.The Boston Red Sox gave me authorization to publish the photos of
Pedro Martinez and Roger Clemens. They requested that credit for the Mar-tinez photo be given to Julie Cordeiro.
Debbie Matson, publications manager of the Boston Red Sox, deservesa special thank you, not only for her help with the Martinez and Clemensphotos, but for the above-and-beyond effort she has made over several yearsto assist me in the location and use of many photographs of Boston Red Sox players.
Authorization to use their photos was also given by John Thorn, the St.Louis Cardinals, the Texas Rangers and Jim Sundberg, the Ivan “Pudge”Rodriguez Foundation, and the New York Mets.
viii
7/25/2019 McNeil - All-Stars for All Time
http://slidepdf.com/reader/full/mcneil-all-stars-for-all-time 10/247
Contents
Acknowledgments . . . . . . . . . . . . . . . . . . . . . . . . . . . viiiPreface . . . . . . . . . . . . . . . . . . . . . . . . . . . . . . . . . 1
1. Baseball’s All-Time All-Star Teams Through the Years . . . . . . 3
2. Methodology . . . . . . . . . . . . . . . . . . . . . . . . . . 13
3. The Nineteenth-Century All-Stars . . . . . . . . . . . . . . . 36
4. Baseball’s Greatest Catchers . . . . . . . . . . . . . . . . . . . 62
5. Baseball’s Greatest Pitchers . . . . . . . . . . . . . . . . . . . 84
6. Baseball’s Greatest First Basemen . . . . . . . . . . . . . . . 113
7. Baseball’s Greatest Second Basemen . . . . . . . . . . . . . . 133
8. Baseball’s Greatest Shortstops . . . . . . . . . . . . . . . . . 147
9. Baseball’s Greatest Third Basemen . . . . . . . . . . . . . . . 161
10. Baseball’s Greatest Right Fielders and Left Fielders . . . . . . 175
11. Baseball’s Greatest Center Fielders . . . . . . . . . . . . . . . 199
12. Baseball’s Legendary All-Stars . . . . . . . . . . . . . . . . . 216
Appendix: The Steroid Problem . . . . . . . . . . . . . . . . . . . 223
Bibliography . . . . . . . . . . . . . . . . . . . . . . . . . . . . . 229
Index . . . . . . . . . . . . . . . . . . . . . . . . . . . . . . . . . 231
ix

7/25/2019 McNeil - All-Stars for All Time
http://slidepdf.com/reader/full/mcneil-all-stars-for-all-time 11/247
This page intentionally left blank
7/25/2019 McNeil - All-Stars for All Time
http://slidepdf.com/reader/full/mcneil-all-stars-for-all-time 12/247
Preface
The game of baseball is America’s National Pastime. And selecting all-starteams has been a favorite hobby of its fans since the National League beganoperations in 1876. In addition to picking annual all-star teams, it has been com-mon practice to select all-time all-star teams. Newspapers and magazines, MajorLeague Baseball, active players, retired players, managers, coaches, and fans, havebeen polled at one time or another to identify baseball’s greatest players.
In all cases, the process has been flawed. Most all-star teams that havebeen published were the result of polls conducted by the media, and werenothing more than popularity contests. The relative skills of the players were
never taken into consideration except by one’s memory, surely the most unre-liable measurement of all. In those cases where baseball players, managers,and coaches were concerned, individual biases entered the equation. Playersfrequently selected men they played with, played against, or saw play inanother league. The same was true of managers and coaches. Players they hadclose contact with, obviously, had an advantage.
In a few cases, all-time all-star teams were chosen based on a player’sstatistics, but in those cases, without exception, the players were measuredonly on their offensive contributions to the game. Defense was never takeninto consideration. And the offensive statistics were the simple measurementsof batting average and slugging average. The effect the physical dimensionsof a ballpark had on a player’s statistics were not taken into consideration.Neither were a player’s other contributions to his team’s offense, such as hisstolen bases, sacrifice hits, and the number of times he hit into double plays.
This study was undertaken to overcome those shortcomings. Formulas were developed for measuring a player’s overall contribution to his team’s suc-cess, both offensively and defensively. And the necessary adjustments were
made to put all the players on a level playing field, by accounting for differ-ences in the various ballparks and for the era-to-era differences in the phys-ical aspects of the game.
1

7/25/2019 McNeil - All-Stars for All Time
http://slidepdf.com/reader/full/mcneil-all-stars-for-all-time 13/247
This page intentionally left blank

7/25/2019 McNeil - All-Stars for All Time
http://slidepdf.com/reader/full/mcneil-all-stars-for-all-time 14/247
C HAPTER 1
Baseball’s All-Time All-Star Teams
Through the Years
The public’s fascination with baseball’s greatest players, and with select-ing all-star teams, began back in the dawn of the game. In 1860, Jimmy Creighton, a handsome, 19-year-old pitcher for the Brooklyn Excelsiors,became an overnight celebrity when he pitched his team to the mythicalnational championship. The 5'7" fastball pitcher was unbeatable as the Excel-
siors toured the Northeast, meeting and defeating the best teams in theirrespective towns. He defeated the Champion Club of Albany by a 24–6 score,knocked off the highly touted Niagaras of Buffalo, 50–19, and took the meas-ure of the Athletics of Philadelphia, 15–4, before a raucous crowd of 3,000.Included in the gatherings were more than a few young ladies. Creighton, itseems, had become a matinee idol to the female set, and they flocked to theballparks whenever the Excelsiors came to town. The attention also made theBrooklyn pitcher the fi rst professional baseball player, as the Excelsiors secretly paid him in order to keep his loyalty.
Nine years after Jimmy Creighton rose to fame, Harry Wright traveledthe East Coast looking for the best baseball players that money could buy.He was the manager of the Cincinnati Red Stockings, and he had been com-missioned by the owners to assemble baseball’s fi rst professional team. It mightalso be called baseball’s fi rst all-star team since Harry Wright signed only thecream of the crop. The highest-paid player, and probably the greatest base-ball player of his time, was Harry’s younger brother, George, a slugging short-stop who would rip the ball at a .518 clip with 59 home runs in 52 games for
Cincinnati in1869.The Redlegs put together an 80-game undefeated streak in 1869–70, the
only blemish on their record being a 17–17 tie with the Haymakers of Troy,
3

7/25/2019 McNeil - All-Stars for All Time
http://slidepdf.com/reader/full/mcneil-all-stars-for-all-time 15/247
New York. But, like all good things, the streak ended on June 14, 1870, whenthey fell to the Brooklyn Atlantics by the score of 8–7 in eleven innings. The
Atlantics, like the Redlegs, were a solid team at every position.
A true all-star team for the period could have been made up of playersfrom both teams.
Catcher: Doug Allison—CincinnatiBob Ferguson—Brooklyn
Pitcher: Asa Brainard —CincinnatiGeorge Zettlein—Brooklyn
First Base: Charley Gould—Cincinnati
Joe Start —BrooklynSecond Base: Charlie Sweasy—Cincinnati
Lipman Pike— Brooklyn
Shortstop: George Wright—CincinnatiDickey Pearce—Brooklyn
Third Base: Fred Waterman—CincinnatiCharles Smith—Brooklyn
Left Field: Andy Leonard —Cincinnati
John Chapman—Brooklyn
Center Field: Harry Wright—CincinnatiGeorge Hall—Brooklyn
Right Field: Cal McVey—CincinnatiDan McDonald—Brooklyn
The Reds disbanded after the 1870 season, but the game’s fi rst profes-sional league the National Association of Professional Baseball Players, com-
monly known as the National Association (NA) was formed shortly thereafter.Some of the great players such as Harry Wright that brought the crowds totheir feet in baseball parks up and down the East Coast were too old to play in the new professional league, but many of the younger players starred inthe National Association and its successor, the National League, for ten ormore years. The success of these players in the NA and the NL justifi ed theirselection to the all-star team.
• George Wright played in the NA for fi ve years and the NL for seven years, batting a combined .301. His tactic of intentionally dropping a popfly if there were two or more men on base and less than two out in orderto get a double play led the introduction of the infi eld fly rule.
• Asa Brainard pitched in the NA for four years, compiling a 24–53 won-lost record, including a 5–22 record in his last year.
4 A LL-STARS FOR A LL TIME

7/25/2019 McNeil - All-Stars for All Time
http://slidepdf.com/reader/full/mcneil-all-stars-for-all-time 16/247
• George “The Charmer” Zettlein played in the NA for fi ve years and inthe NL for one year, retiring with a career record of 129 wins against 112losses, including a record of 36–15 in 1873.
• Lip Pike played fi ve years in the NA and fi ve years in the NL, batting a combined .322.
• Cal McVey played for the Boston Beaneaters in the NA for fi ve years,helping the powerful Boston team to four consecutive pennants. In 1876,he batted .347 for the Chicago White Stockings as they captured the fi rstNational League pennant. McVey batted .362 in the NA and .328 during his four-year NL career.
• George Hall, another fi ve-year veteran of the NA, played two years in
the NL, and won the fi rst home run title in NL history by blasting fi veround-trippers in 268 at-bats. Hall batted .311 in the NA and hit .345in two years in the NL before he was suspended for life in a gambling scandal.
• Bob “Death to Flying Things” Ferguson enjoyed a long professionalcareer, playing in the NA for fi ve years and in the NL for nine years. Theswitch-hitting third baseman batted .254 in the NA and .271 in the NLand played sensational defense at third base.
• Dickey Pearce, who was 35 years old when the National Association wasformed, played fi ve years in the NA and two years in the NL, batting a combined .251. The 5'4", 161-pound infi elder defi ned the shortstop posi-tion. Prior to Pearce, the shortstop was more of an outfi elder than aninfi elder. Pearce also developed the fair-foul bunt that drove third base-men crazy before the rules were changed to prevent such a maneuver.
• Charlie Gould played four years in the NA and two years in the NL, bat-ting a combined .257.
• First baseman Joe “Old Reliable” Start played fi ve years in the NA fol-
lowed by an eleven-year career in the NL. He retired in 1886 at the ageof 43 with a combined batting average of .299, including an even .300average in the National League. He played on two NL pennant-winners
with the Providence Grays, hitting .319 for the 1879 squad and .276 forthe powerful 1884 club. In the fi rst World Series, matching the NL cham-pions against the American Association champions, the Grays swept theNew York Mets three straight to claim the crown.
Allen & Ginter, one of the country’s leading tobacco companies, adver-tised their “World’s Champion” athletes in 1887, a group of fi fty athletes thatincluded western rifle marksmen Annie Oakley and Buffalo Bill Cody, heavy-
weight boxing champion John L. Sullivan, several pool players and strong men, and ten baseball players, representing the game’s greatest players. Thebaseball “all-star team” consisted of:
1 . Baseball’s All-Time All-Star Teams Through the Years 5

7/25/2019 McNeil - All-Stars for All Time
http://slidepdf.com/reader/full/mcneil-all-stars-for-all-time 17/247
• Michael J. “King” Kelly, star outfi elder for the Boston Nationals, who ledthe National League in batting in 1886 with a hefty .388 average.
• Cap Anson, fi rst baseman and leader of the Chicago Cubs, who had batted.371 in 1886.
• Bob Caruthers, the St. Louis Brown’s ace pitcher, who had gone 30–14 in1886.
• John Montgomery Ward, shortstop for the New York Giants, who led theNational League in fi elding in 1887 with a .919 fi elding average.
• John Clarkson, pitcher for the Chicago Cubs, who won 36 games against17 losses in 1886.
• Tim Keefe, ace of the New York Giant pitching staff, who led the Na-tional League with 42 victories against 20 losses in 1886.
• Jack Glasscock, shortstop for the St. Louis Maroons, who led the Na-tional League in fi elding in 1886 with a .906 average while tattooing theball at a .325 clip.
• Charles Comiskey, fi rst baseman for the St. Louis Browns, who batted.325 in 1887.
• Charlie Bennett, catcher for the Detroit Wolverines, who led NationalLeague catchers in fi elding in 1886 with a .955 average.
• Joe Mulvey, third baseman for the Philadelphia Athletics, who batted.287 with an .865 fi elding average in 1887.
Various newspapers, magazines, and other media outlets continued topresent their major league baseball all-time all-star teams to interested fansdown through the years. Even the board game manufacturers got into the pic-ture. Cadaco Ellis, manufacturer of the popular Ethan Allen’s All-Star Base-ball Game that was introduced in 1941 and provided thousands of boys withhundreds of thousands of hours of enjoyment over the next half-century,
included in some editions of the game approximately 20 discs of what thecompany’s staff felt were baseball’s all-time all-stars in addition to playing discsof active players. Their selections were:
Catchers: Mickey Cochrane, Bill Dickey.
Pitchers: Walter Johnson, Grover Cleveland Alexander, Christy Mathewson,Cy Young.
First Base: Lou Gehrig, George Sisler.
Second Base: Rogers Hornsby, Eddie Collins.
Shortstop: Honus Wagner, Joe Cronin.
Third Base: Pie Traynor, Joe Dugan.
Out fi eld: Babe Ruth, Tris Speaker, Ty Cobb, Earle Combs, Paul Waner, AlSimmons.
6 A LL-STARS FOR A LL TIME
7/25/2019 McNeil - All-Stars for All Time
http://slidepdf.com/reader/full/mcneil-all-stars-for-all-time 18/247
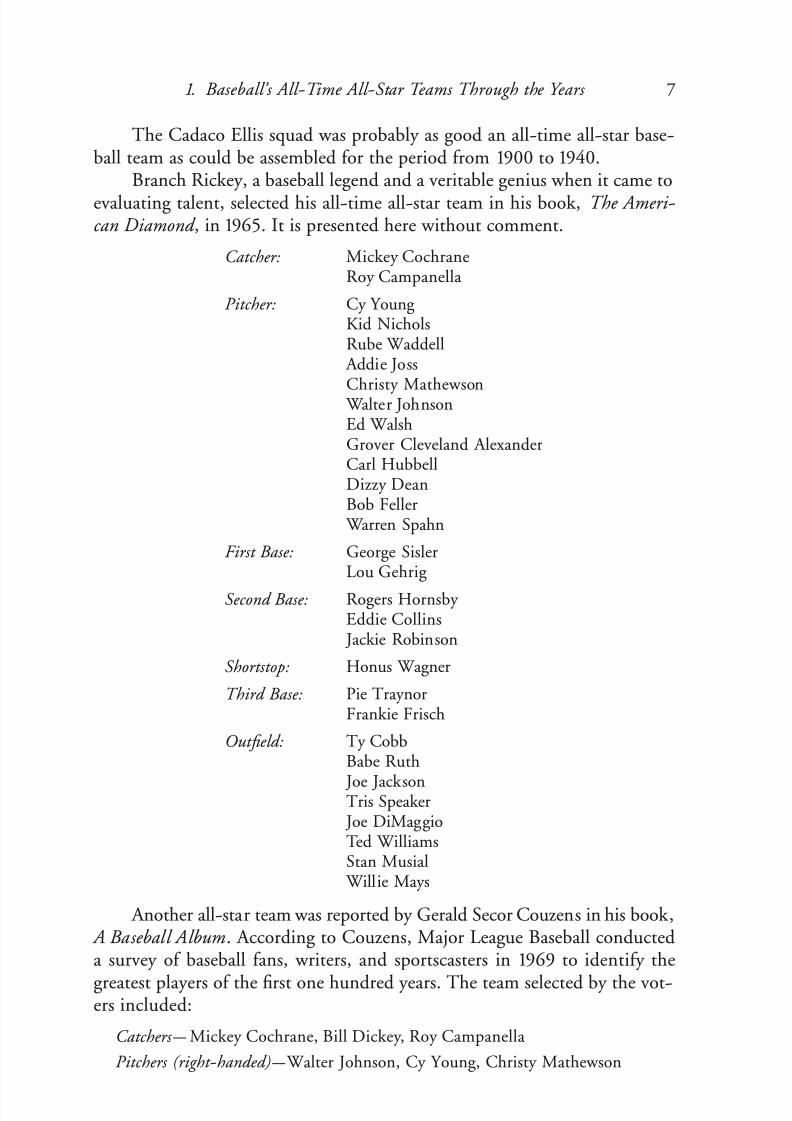
The Cadaco Ellis squad was probably as good an all-time all-star base-ball team as could be assembled for the period from 1900 to 1940.
Branch Rickey, a baseball legend and a veritable genius when it came to
evaluating talent, selected his all-time all-star team in his book, The Ameri-can Diamond , in 1965. It is presented here without comment.
Catcher: Mickey CochraneRoy Campanella
Pitcher: Cy Young Kid NicholsRube Waddell
Addie Joss
Christy Mathewson Walter JohnsonEd WalshGrover Cleveland AlexanderCarl HubbellDizzy DeanBob Feller
Warren Spahn
First Base: George SislerLou Gehrig
Second Base: Rogers Hornsby Eddie Collins
Jackie Robinson
Shortstop: Honus Wagner
Third Base: Pie TraynorFrankie Frisch
Out fi eld: Ty CobbBabe Ruth
Joe JacksonTris Speaker Joe DiMaggioTed WilliamsStan Musial
Willie Mays
Another all-star team was reported by Gerald Secor Couzens in his book, A Baseball Album. According to Couzens, Major League Baseball conducteda survey of baseball fans, writers, and sportscasters in 1969 to identify the
greatest players of the first one hundred years. The team selected by the vot-ers included:
Catchers —Mickey Cochrane, Bill Dickey, Roy Campanella
Pitchers (right-handed)—Walter Johnson, Cy Young, Christy Mathewson
1 . Baseball’s All-Time All-Star Teams Through the Years 7

7/25/2019 McNeil - All-Stars for All Time
http://slidepdf.com/reader/full/mcneil-all-stars-for-all-time 19/247
Pitchers (left-handed)—Lefty Grove, Sandy Koufax, Carl Hubbell
First Basemen—Lou Gehrig, George Sisler, Stan Musial
Second Base —Rogers Hornsby, Charlie Gehringer, Eddie Collins
Shortstop—Honus Wagner, Joe Cronin, Ernie Banks
Third Base —Pie Traynor, Jackie Robinson, Brooks Robinson
Out fi eld —Joe DiMaggio, Babe Ruth, Ty Cobb, Ted Williams, Tris Speaker, Willie Mays.
In 1990, Street & Smith’s Baseball magazine presented its Dream Team,the greatest players of the previous 50 years. The magazine polled active andretired players, managers, coaches, general managers, and media to identify
the best of the best.The team, as selected by the panel, was interesting, with the usual num-ber of popularity choices, such as Johnny Bench, Ozzie Smith, and Don Mat-tingly, but on the whole it was a valid representation of the greatest majorleague players between 1941 and 1990.
National League American League
Best Player Willie Mays Joe DiMaggio
Best Hitter Stan Musial Ted Williams
Left-handed Pitcher Sandy Koufax Whitey FordRight-handed Pitcher Bob Gibson Bob Feller
Relief Pitcher Bruce Sutter Rollie Fingers
Catcher Johnny Bench Yogi Berra
First Base Willie McCovey Don Mattingly
Second Base Joe Morgan Bobby Doerr
Shortstop Ozzie Smith Luis Aparicio
Third Base Mike Schmidt Brooks Robinson
Out fi eld Willie Mays Joe DiMaggioOut fi eld Hank Aaron Ted Williams
Out fi eld Roberto Clemente Mickey Mantle
Pinch Hitter (LH) Stan Musial Carl Yastrzemski
Pinch Hitter (RH) Ernie Banks Frank Robinson
Utility Pete Rose Harmon Killebrew
Pinch Runner Lou Brock Rickey Henderson
In 1999, Mike Kallay wrote an article forStreet & Smith’s Baseball
in which he conducted a survey to identif y the 50 greatest players of the twen-tieth century. A panel of writers and editors as well as the staff of Stats, Inc.,
were recruited to review the eligible players and to select the 50 greatest play-ers from the pack. The team called “the Team of the Century” had fi ve unan-
8 A LL-STARS FOR A LL TIME

7/25/2019 McNeil - All-Stars for All Time
http://slidepdf.com/reader/full/mcneil-all-stars-for-all-time 20/247
imous choices—Babe Ruth, Lou Gehrig, Mike Schmidt, Walter Johnson,and Sandy Koufax.
There were a few problems associated with the selection process, how-ever. To begin with, active players who had not yet experienced the down-side of their careers were included in the voting, and several of them madethe team—Ken Griffey, Jr., Roger Clemens, Mike Piazza, Tony Gwynn, Mark McGwire, Cal Ripken, Jr., and Greg Maddux. A case might be made for theinclusion of Clemens, Maddux, Ripken, McGwire, and Gwynn, whose careers
were nearing an end, but the fallacy of including active players on the eligi-bility list became clear when Griffey and Piazza suffered setbacks in theircareers after 1999. Griffey, who had been on track to hit 800 career homers,spent four years battling injuries while his career stagnated, and Piazza, suf-fering the effects of the physical abuse of many years behind the plate, saw his batting average deteriorate after 2000 and his power follow suit after 2002.
Another problem with the “Team of the Century” poll was the appar-ent need to include token Negro league players Satchel Paige and Josh Gib-son. It was obvious that many, if not most, of the panel were not familiar
with the legends of Negro league baseball; nevertheless, having to include themin the voting, they selected the two most visible names while ignoring suchgiants as Smokey Joe Williams, Oscar Charleston, and Martin Dihigo.
Noticeable by his absence was Barry Bonds, who in 1999 was considered
1 . Baseball’s All-Time All-Star Teams Through the Years 9
Barry Bonds broke Hank Aaron’s career home run record in 2007 (courtesy James R.Madden, Jr.).

7/25/2019 McNeil - All-Stars for All Time
http://slidepdf.com/reader/full/mcneil-all-stars-for-all-time 21/247
to be a very good major league player, but not one of the top 50 players of the century. But in 2000, the big left fi elder’s statistics exploded. Over a four-
year stretch, from 2001 through 2004, between the ages of 37 and 40, a time
when most players have retired, he batted a robust .349, 60 points above hisprevious career average, and crushed 209 home runs in 1,642 at-bats, an aver-age of 70 home runs for every 550 at-bats. Some respected baseball expertseven went so far as to call him the greatest baseball player of all-time. As Inoted in The Evolution of Pitching in Major League Baseball , “It is well knownthat wine gets better with age. But ballplayers, obviously with the exceptionof Barry Bonds, do not. Coincidentally, Bonds’ rise to a power icon beganafter his move to San Francisco. The big slugger has claimed that the above
batting and slugging statistics are the result of his weight-lifting program. Butpeople don’t bulk up by forty pounds and get puffy faces from lifting weights.”The men selected for Street & Smith’s “Team of the Century” were:
“A” Team “B” Team
Catcher Johnny Bench Yogi Berra
Pitchers Walter Johnson Cy Young Sandy Koufax Steve CarltonChristy Mathewson Nolan Ryan
Warren Spahn Bob FellerGrover Cleveland Alexander Juan Marichal
Relief Bob Gibson Jim PalmerLefty Grove Whitey FordRoger Clemens Greg Maddux Satchel Paige Dennis Eckersley Tom Seaver Hoyt Wilhelm
First Base Lou Gehrig Mark McGwire
Second Base Rogers Hornsby Jackie RobinsonShortstop Honus Wagner Ernie Banks
Third Base Mike Schmidt Eddie Mathews
Out fi eld Babe Ruth Hank AaronTy Cobb Roberto ClementeTed Williams Tris Speaker
Utility Willie Mays Tony GwynnStan Musial Jimmie Foxx
Joe DiMaggio Mike Piazza Mickey Mantle Cal Ripken, Jr. Josh Gibson Joe MorganPete Rose Brooks RobinsonKen Griffey, Jr. Ozzie Smith
10 A LL-STARS FOR A LL TIME

7/25/2019 McNeil - All-Stars for All Time
http://slidepdf.com/reader/full/mcneil-all-stars-for-all-time 22/247
Major League Baseball conducted its own All-Century Team poll in1999, involving fans from around the country. The objective of the poll wasto stimulate fan interest in our National Pastime and, as such, it was immensely
successful. More than one million fans cast votes for their favorite players. It was, of course, nothing more than a popularity contest, with no measure-ment of skill involved. And, as most of the voters were on the sunny side of forty, hardly any of them saw any player who played prior 1970. They werefamiliar with the exploits of such recent players as Bob Gibson, WillieMcCovey, and Brooks Robinson, and they had heard about some of the play-ers of yesteryear, the “ancients” like Ted Williams, Yogi Berra, and Mickey Mantle, but names like Honus Wagner, Nap Lajoie, and Christy Mathewson
were unfamiliar to them. As might be expected, the results were so outlandishthat MLB had to quickly convene a special panel of baseball executives, media,and historians to try to salvage the project. The panel added fi ve players tothe team, legends like Honus Wagner, Christy Mathewson, Stan Musial, War-ren Spahn, and Lefty Grove. The original team, as selected by the fans, isshown below, with the top voters listed fi rst, and so on down the line.
Catchers Johnny Bench, Yogi Berra, Carlton Fisk
Pitchers Nolan Ryan, Sandy Koufax, Cy Young, Roger Clemens, BobGibson, Walter Johnson, Greg Maddux, Steve Carlton,
Satchel PaigeFirst Basemen Lou Gehrig, Mark McGwire, Jimmie Foxx
Second Basemen Jackie Robinson, Rogers Hornsby, Joe Morgan
Shortstops Cal Ripken, Jr., Ernie Banks, Ozzie Smith
Third Basemen Mike Schmidt, Brooks Robinson, George Brett
Out fi elders Babe Ruth, Hank Aaron, Ted Williams, Willie Mays, JoeDiMaggio, Mickey Mantle, Ty Cobb, Ken Griffey, Jr., PeteRose, Roberto Clemente.
Ozzie Smith fi nished just ahead of Honus Wagner in the voting. MajorLeague Baseball, obviously realizing that to present that end result to the fansof America would be a travesty, quietly voted Wagner into the number threespot. Similar adjustments had to be made to rescue Musial (number 11), Math-ewson (number 14), Grove (number 18), and Spahn (number 10), from thegarbage heap.
The selection of all-time all-star teams via a voting process, whether by fans, writers, managers, or coaches, has never resulted in a true depiction of the greatest players in the game. Memory is a bad measure of a player’sskills. There also are the normal biases that enter into the voting, such asplayers that are liked or disliked by the voter, and the total disregard of obvi-ous baseball legends because of the lack of the historical knowledge of thevoters.
1 . Baseball’s All-Time All-Star Teams Through the Years 11
7/25/2019 McNeil - All-Stars for All Time
http://slidepdf.com/reader/full/mcneil-all-stars-for-all-time 23/247
Unfortunately, there are no perfect measuring devices for evaluating theskills of individual baseball players. The only thing baseball historians andstatisticians can do is provide the most equitable formulas that are available
to compare one player with another, offensively and defensively, in order toidentify the greatest players at each position.
12 A LL-STARS FOR A LL TIME

7/25/2019 McNeil - All-Stars for All Time
http://slidepdf.com/reader/full/mcneil-all-stars-for-all-time 24/247
C HAPTER 2
Methodology
Baseball’s All-Time All-Star team was determined by a comparison of each player’s offensive and defensive contributions as measured by his mostimportant statistics. Each position had to be evaluated separately since eachposition had unique responsibilities that required its own measurements. Forinstance, catchers had to be evaluated for their ability to throw out potentialbase stealers, while pitchers were evaluated for their success in the art of pitch-ing. Other position players were measured primarily for their success at pro-ducing runs on offense and for preventing runs on defense. Each player’sstatistics had to be adjusted to eliminate the differences in the game from one
era to another, and to eliminate any contributing factors resulting from thegeometry of a player’s home park.
There have been several statistical studies conducted over the years by the country’s foremost baseball historians and statisticians. In my opinion,the studies all have weak spots that make them unacceptable for identifying baseball’s greatest players. Bill James’ Win Shares is a theoretical evaluationsystem based on a team concept and each player’s contribution to the team’ssuccess. It does not evaluate players independently using their individual sta-tistics; player ratings are related to the supposed contributions the playermakes to his team. When James was asked for the calculations for Joe DiMag-gio’s 1937 Win Shares, he said it would take him at least eight hours to cal-culate that number because he would have to do the entire team first in orderto arrive at DiMaggio’s contribution. Win Shares does not use individual park factors, but rather one generalized park factor for each stadium. For instance,there is only one park factor for Yankee Stadium even though the distancesto the left-field area are much greater than the distances to the right-fieldarea. Under that scenario, left-handed batters like Yogi Berra and Bill Dickey,
who had individual park factors of1.34 and 2.0
1, respectively, would berewarded while right-handed batters like Joe DiMaggio and Elston Howard,
with individual park factors of 0.71 and 0.48, would be penalized. Win Shares
13

7/25/2019 McNeil - All-Stars for All Time
http://slidepdf.com/reader/full/mcneil-all-stars-for-all-time 25/247
also makes the assumption that players are getting better every year so today’splayers receive more points, based on their birthday, than players of thirty
years ago, and players of thirty years ago receive more points than players of
sixty years ago, and so on. Finally, James’ rating system includes a subjectivefactor that allows the statistician to add points to a particular player’s total if he believes it is warranted for some reason. James, as reported in Backstop,noted a quirk in his rating system that gave Mickey Mantle a higher overallrating than Ty Cobb. He admitted, “I gave Cobb a higher subjective factorthan I gave Mantle, and allowed him to edge back ahead. My heart is not init, but as I see it, the world believes that Cobb was a better player than Man-tle, and I would be unable to sustain a logical argument to the contrary under
rigorous attack . I have to give Cobb the edge.” A more detailed review of Bill James’ Wins Shares system can be found in Backstop.Pete Palmer, one of the early editors of Total Baseball and one of the edi-
tors of The Baseball Encyclopedia , has developed the best overall rating sys-tem available at the present time. His Player Overall Wins Rating system(POWR) adds a player’s batting wins, fielding wins, base running wins, andpitching wins to rate his overall value compared to an average player. But itis a value system as opposed to a skill system, which explains why a playerlike Bert Blyleven, who pitched in the major leagues for 22 years, is rated
above Sandy Koufax, who pitched for only 12 years. Blyleven has a POWR of 31.1 compared to a rating of 22.3 for Koufax. Palmer’s data is adjusted forthe era in which a player was active, but it does include a generalized park factor similar to the one used by James. As a result, depending on the park,a significant advantage could be given to a right-handed batter or a left-handed batter. In other words, all players are not competing on a level play-ing field. Pete Palmer has also noted that his system is not yet satisfactoryfor rating catchers because a caught-stealing factor is not included in hisequations.
The statistics used in this study will be outlined position by position,and the reason for using each statistic will be fully explained. First, each player
was measured for both his offensive and defensive contributions, but the weight assigned to each player’s offense compared to his defense varieddepending on his position. The shortstop position was considered to be themost critical defensive position on the team for several reasons. Since mostbatters hit right-handed, more balls are hit to the left side of the infield,between third base and second base. The shortstop is responsible for cover-ing about two-thirds of the territory between second base and third base, andsince many of the balls he runs down are in the hole between his positionand the third base position, he must have a strong throwing arm in order tothrow out the base runner before the batter reaches first base. He must alsohave quick reactions to batted balls and above-average speed in order to charge
14 A LL-STARS FOR A LL TIME

7/25/2019 McNeil - All-Stars for All Time
http://slidepdf.com/reader/full/mcneil-all-stars-for-all-time 26/247
balls that are hit slowly to his position, and he must be able to range far and wide for pop flies that are hit anywhere from the left field foul line to straight-away center field. Many teams carry a shortstop who is a defensive wizard but
who has a weak bat, in appreciation of his defensive contributions to his team’ssuccess. For this study, a shortstop’s defensive contributions were rated equalto his offensive contributions.
Another player who is often carried on a team for his defensive contri-butions to the team is the catcher. A catcher’s primary responsibility is to runthe game from his position behind the plate. He is considered to be the fieldgeneral of the team. He has the whole field in front of him, and he some-times positions the fielders depending on the particular batter, the game sit-
uation, or the strategy that is being used. He calls the pitches a pitcher throws,both the type of pitch and the location of the pitch. It is his responsibility toknow the strengths and weaknesses of every batter in the league and to keepthem off-balance by mixing up the pitches thrown by his pitcher. He mustalso be the team psychologist, who knows the temperament of every pitcheron his staff. He must know how to get the most out of each pitcher, when tostroke him, when to cajole him, and when to get tough with him.
A catcher is also responsible for keeping base runners honest by not let-ting them take too long a lead off base and by not letting them steal bases. If
a runner takes too long a lead off base, even second base, the great catchers will invariably pick him off. And if he attempts to steal a base, the great catch-ers will throw him out a high percentage of the time, usually about half thetime. Some baseball experts believe that catchers on good teams will gener-ally throw out more prospective base stealers than catchers on poor teams,but that theory is flawed. A study of the great catchers through the years hasshown that good catchers throw out a high percentage of base runners whetherthey play for a good team or a poor team. Ivan “Pudge” Rodriguez is a goodexample. He has thrown out a high percentage of base runners whether he
was playing for a pennant-contender or for a basement-dweller. So, too, didGabby Hartnett. And Wes Westrum. And Ray Mueller. And Jim Sundberg.Conversely, Mike Piazza had a poor caught-stealing record wherever he played.He usually played for a strong, pennant-contending club, yet his caught-steal-ing percentage was never above 30 percent and was often in the low teens.Other catchers who had poor caught-stealing records, even with strong teams,included Mickey Cochrane, Carlton Fisk, Bill Freehan, and Chris Hoiles.Pudge Rodriguez may be the most underrated catcher in the game today. Heis a .300 hitter with decent power and the most dominant defensive catcherstill active. His career caught-stealing percentage of 49 percent is one of thehighest ever recorded. And, in 2006, at 34 years old, an advanced age for a catcher, he gunned down 51 percent of all would-be base stealers, an amaz-ing accomplishment.
2. Methodolog y 15

7/25/2019 McNeil - All-Stars for All Time
http://slidepdf.com/reader/full/mcneil-all-stars-for-all-time 27/247
A catcher also needs to have quick reflexes in order to respond to thebatted ball, whether it is a pop-up, a bunt, or a ball that is topped in frontof the plate, and he should have good speed in order to reach those balls in
time to retire the batter. He is also responsible for backing up first base onground balls hit to the infield. Roy Campanella, a high school track star, andGabby Hartnett, who was taught the position by his father, were two of thebest at backing up first base. In addition to those characteristics, a catcherhas to be physically tough because he is responsible for blocking the plateto prevent base runners from scoring on close plays and the abuse he is sub-
jected to from base runners determined to make him drop the ball can bebrutal. Unfortunately, some of a catcher’s greatest skills are intangible and
cannot be measured, such as calling the game and handling the pitchers. Buta review of the great catchers in baseball history reveals that essentially allof them are strong in intangibles, so the fact that those strengths cannotbe measured should not affect the final ratings. For this study, the catcher’sdefensive statistics, like those of the shortstop, were rated equal to his offen-sive statistics.
Third base is known as the hot corner for good reason. The third base-man is in a direct line of fire for balls screaming off the bats of right-handedsluggers, and it is his responsibility to prevent those balls from reaching the
outfield. Admittedly, the third baseman is required to cover much less groundthan the shortstop because his position is near the foul line and, in general,his range requirement is about half that of the shortstop. Nevertheless, he stillmust protect the area between the shortstop and the third base foul line, andhe must have a cannon for a throwing arm since his throws have to make their
way across the diamond to first base, occasionally from foul territory behindthe base. He does not need to possess the speed of a shortstop, but he musthave quick reflexes, because balls hit down the line or in the hole are oftenhit hard, making it imperative that he react quickly in order to catch the ball
or stop it before it goes into the outfield that, in many cases, turns the hitinto a two-base hit. And he needs to react quickly to bunts or topped ballsdown the third base line. From an offensive standpoint, the third basemanin today’s environment is usually one of the power hitters on the team andone of its top run-producers. Since the third baseman’s offensive contribu-tion is a significant part of his overall value to the team, his offense-to-defenseratio was set at two-to-one for this study.
Second base is another key infield position that requires superior defense.The second baseman has as much ground to cover as the shortstop, but hedoes not need to have as strong a throwing arm since his throws usuallycover a much shorter distance. He does have one critical attribute that putshim in the upper echelons of team defense. He has to be an expert in start-ing or turning the double play. He has to have good foot speed to get to a
16 A LL-STARS FOR A LL TIME

7/25/2019 McNeil - All-Stars for All Time
http://slidepdf.com/reader/full/mcneil-all-stars-for-all-time 28/247
ball to start a double play or to get to the bag to force the base runner if theball is hit to another fielder, and he must have the necessary acrobatic skillsto pivot, avoid the slide of the base runner, and make a strong, accurate throw
to first base in time to retire the batter. A world-class second baseman mustalso have good foot speed in order to reach pop flies hit down the right-fieldfoul line, pop flies hit into no-man’s land between the infield and the outfield,and slow-hit infield grounders in his direction. A top second baseman is alsorequired to contribute to the offense much more than the shortstop but per-haps less than the third baseman. He is frequently a contact hitter with a goodbatting average and an above-average on-base percentage. Many of the topbase stealers in baseball history were second basemen, such as Joe Morgan,
Davey Lopes, Jackie Robinson, Eddie Collins, and Steve Sax. The offense-to-defense ratio for second basemen was set at two-to-one for this study.The first baseman is usually selected for his offensive contributions to
the team as opposed to his defensive contributions. If he is a strong defen-sive player, that’s a bonus. Often, when a team has one or more strong offen-sive players on the team, it is challenging to find a position for all of them toplay; hence, the designated first baseman. That position is usually a last resort.If the player can play the outfield without embarrassing himself, he will beassigned to either right field or left field. If he does not have the requisite skills
for playing the outfield, he may find a home at first base. And in today’s American League culture, if he and a fielder’s glove are mortal enemies, hecan serve the team as its designated hitter. For a first baseman, his offense wasconsidered to be four times as important as his defense in this study.
The center fielder is another of those critical defensive players whoseskills with the glove are paramount to a team’s success. It is an old but accu-rate truism that, for a team to contend for the title, it must be strong up themiddle. That means a team must have outstanding pitching plus strong defense at catcher, second base, shortstop, and center field. Since the right
and left fielders are often selected for their bats rather than their gloves, thecenter fielder is the key defensive player in the outfield. One humorist wrotethat on a team with slow-moving pachyderms in the corner outfield spots,the center fielder has to cover the acreage from foul line to foul line. In many cases, that is not far from the truth. Suffice it to say, center field is one of theteam’s most important defensive positions. And because the center fielder hasto cover large expanses of ground, he must have outstanding speed, and thatcharacteristic often means he is an offensive threat, particularly after he getson base. He is often one of the team’s leading base stealers. He frequently batsleadoff, is capable of drawing a significant number of bases on balls, is a goodbunter, and a good base runner. The center fielder’s offensive-to-defensiveratios in this study were set at three-to-one.
The left fielder and right fielder, as noted previously, are primarily in
2. Methodolog y 17
7/25/2019 McNeil - All-Stars for All Time
http://slidepdf.com/reader/full/mcneil-all-stars-for-all-time 29/247
the lineup for their offensive contributions, not their skill with the glove.They, like the first baseman, were weighted at four-to-one in this study.
The offensive and defensive statistics that were used to determine base-
ball’s all-time all-star team, position by position, follow.
Catcher
The offensive statistics used to determine the offensive skills of the catcherincluded on-base percentage (OBP), slugging average (SLG), stolen bases(SB), sacrifice hits (SH), and double plays grounded into (GIDP). These same
statistics were used for each of the position players. Every statistic had to beadjusted for the era in which the player was active, and the SLG also had tobe adjusted for the individual park factor. Base hits had to be eliminated fromthe XSLG calculation since they are part of OBP and to include them in
XSLG would be double-dipping. Only the extra bases in extra-base hits werecounted, not the initial base. The era adjustment was determined by select-ing a base point year, and by subtracting that value from the league averagefor the years played by the individual. The base point year selected was 1960,
which is near the midpoint for the league’s yearly averages for OBP and SLG.
Coincidentally, it is also near the midpoint of the first year of the lively ballera and the present year, and it is also the last year in which the major leagues
were represented by 16 teams. In 1961 the American League expanded to tenteams, with the addition of the Minnesota Twins and the Los Angeles Angelsand, the following year, the National League followed suit, with the additionof the Houston Colt .45s and the New York Mets. Actually, the WashingtonSenators were one of the new teams admitted to the American League in 1961,
with the existing Washington team relocating to Minnesota under its new name, “Twins.” Two of the most obvious offensive statistics, runs scored and
runs batted in (RBIs), were not used in this study, for good reason. There isa strong correlation between runs scored and OBP, meaning that players witha high OBP are the same players who have a high runs scored total. There isalso a strong correlation between SLG and runs batted in, meaning that play-ers who have a high SLG are the same players who have a high RBI total . Toinclude the runs scored and RBI statistics along with OBP and SLG wouldbe another case of double-dipping.
Finally, each statistic was normalized in order to determine not only which player was better or worse than another player in a particular category,but to what extent he was better or worse. Roy Campanella’s statistics will beused to demonstrate the method for calculating a player’s offensive and defen-sive point totals. All statistics were not rated equally. For the offensive rat-ings, normalized statistics NOBPA and NXSLGA were rated at a maximum
18 A LL-STARS FOR A LL TIME

7/25/2019 McNeil - All-Stars for All Time
http://slidepdf.com/reader/full/mcneil-all-stars-for-all-time 30/247
of 20 points, while NSB, NSH, and NGIDP were rated at one point maxi-mum, for a total of 43 points maximum.
On-Base Percentage (OBP)Hits plus walks plus hit by pitch, divided by hitsplus walks plus hit by pitch, plus official at-bats.
A DJUSTED ON-B ASE PERCENTAGE (OBPA)
Campanella’s OBPA = A ! (B ! C)OBPA = .362 ! (.332 ! .322) = .352
Where :OBPA = Official OBP adjusted for the era in which Campanella played.
A = Campanella’s official OBP, .362.B = League average OBP during Campanella’s career, .332.
C = Base point OBP (National League 1960), .322.
NORMALIZED ON-B ASE PERCENTAGE (NOBPA)
Campanella’s NOBPA = (A/B) × 20NOBPA = (.352/.401) × 20 = 17.506
Where :
NOBPA = Normalized OBPA A = Campanella’s OBPA, .352.
B = Highest OBPA of the candidates, in this case,Mickey Cochrane’s .401 OBPA.
20 = Maximum weight assigned to the statistic.
Slugging Average (SLG)The number of total bases a batter accumulates—one base for a single,
two bases for a double, and so on—divided by his official at-bats.
A DJUSTED SLUGGING A VERAGE (XSLG)
This calculation adjusted the player’s slugging average (SLG) for his indi-vidual park factor. For players from 1958 to the present, a calculation had tobe made for both a player’s home statistics and his away statistics. First, a player’s average statistics, both home and away, per 550 at-bats, had to bedetermined for runs, singles, doubles, triples, and home runs. For playersprior to 1961, with eight teams in the league, each home statistic (S, D, T,HR) was multiplied by one, then added to the player’s away statistic that wasmultiplied by seven, and the resulting sum was divided by eight to arrive at
2. Methodolog y 19

7/25/2019 McNeil - All-Stars for All Time
http://slidepdf.com/reader/full/mcneil-all-stars-for-all-time 31/247
the player’s adjusted total of singles, doubles, triples, and home runs. Theadjusted base hits were then subtracted from 550 to give the player’s adjustedat-bats for extra-base hits only. The adjusted slugging average (XSLG) was
determined by adding the player’s doubles per 550 at-bats (D × 1), triples (T× 2), and home runs (HR × 3), and dividing the sum by the player’s adjustedat-bats (550 ! base hits).
For players who played prior to 1957, for the most part, the splits of homestats and away stats were not available, so some assumptions had to be made.Home run factors (HRF) are available for every major league player, so they
were used to determine the player’s home and away home runs. A player’shome and away at-bats and his home and away doubles could be estimated
fairly accurately based on information obtained from a study of the home andaway splits for players after 1957. That study indicated that, in general, a player has 5 percent more at-bats on the road than he does at home. That iseasily explained by the fact that players often do not bat in the bottom half of the ninth inning at home, meaning they would be expected to have fewerat-bats at home than away. The study also showed that the difference in a player’s home and away home runs is normally accompanied by an equal andopposite difference in his doubles; therefore, for players whose statisticsincluded only a home run factor, an assumption was made that the player’s
doubles changed by an equal and opposite amount to his home runs. Triplesare essentially the same, home and away. In Campanella’s case, he averaged32 home runs for every 550 at-bats, and his park factor for home runs was1.37, meaning he hit 37 percent more home runs at home than on the road.His at-home home run total was 32 × 1.185 (one-half of the spread) = 38,and his away home run total was 32 divided by 1.185 = 26. He averaged 23doubles a year, so his adjusted doubles were 17 doubles at home and 29 dou-bles on the road. If there were eight teams in the league (prior to 1960), hisadjusted doubles and home run totals would be :
Adjusted home runs = (7 × 26 + 1 × 38) = 220 divided by 8 = 28 home runs. Adjusted doubles = (7 × 29 + 1 × 17) = 220 divided by 8 = 28 doubles.
As more teams entered the major leagues, a player’s away statistics becamemore and more important in determining the player’s adjusted extra-base hits.For instance, if there were 16 teams in the league, the player’s home statistics
would still be multiplied by one, but his away statistics would now be mul-tiplied by 15, with the sum of those stats divided by 16. It is obvious fromthese examples that a player’s away statistics are much more important formeasuring his skills than his home statistics are. One of the more eye-pop-ping examples of the difference between a player’s home stats and his away stats can be found in the statistics of Todd Helton of the Colorado Rockies.Helton, playing in the rarified air of Denver, Colorado, compiled a home
20 A LL-STARS FOR A LL TIME

7/25/2019 McNeil - All-Stars for All Time
http://slidepdf.com/reader/full/mcneil-all-stars-for-all-time 32/247
batting average of .374 from 1998 through 2005 compared to an away bat-ting average of .297. He also averaged 40 home runs a year at home com-pared to 25 homers on the road.
Campanella’s XSLG = (A + B + C)/D XSLG = (28 + 4 + 84)/398 = .291
Where :
XSLG = Campanella’s slugging average adjustedfor his home park factor (PF).
A = adjusted doubles per 550 at-bats × 1
B = adjusted triples per 550 at-bats × 2
C = adjusted home runs, per 550 at-bats × 3D = 550 at-bats ! 152 base hits = 398
FINAL A DJUSTED SLUGGING A VERAGE (XSLGA)
The final adjusted slugging average (XSLGA) was an era adjustment tothe XSLG to account for the difference between the league slugging averagefor the period the player was active and the base point slugging average.
Campanella’s XSLGA = A ! (B ! C)
XSLGA = .291 !
(.396 !
.388) = .283
Where :
XSLGA = Campanella’s XSLG adjusted forthe era in which the player was active.
A = Campanella’s XSLG, .291.B = League average SLG during Campanella’s career, .396.
C = Base point SLG (National League 1960), .388.
NORMALIZED FINAL A DJUSTED SLUGGING
A VERAGE (NXSLGA)
The player’s final adjusted slugging average (XSLGA) was normalized toaccount for the difference between players and the amount of the difference.
Campanella’s Normalized Adjusted Slugging Average (NXSLGA) = (A/B) × 20
NXSLGA = .283/.302 × 20 = 18.742
Where :
A = Campanella’s XSLGA.B = Highest XSLGA of the candidates, in this case, Johnny Bench’s .302.
20 = Maximum weight assigned to the statistic.
2. Methodolog y 21

7/25/2019 McNeil - All-Stars for All Time
http://slidepdf.com/reader/full/mcneil-all-stars-for-all-time 33/247
Stolen Bases (SB)
The average number of stolen bases by the player per 550 at-bats dur-ing his career.
NORMALIZED STOLEN B ASES (NSB)
Campanella’s NSB = (A/B) × 1
NSB = 3/8 × 1 = .375
Roy Campanella had the deadliest throwing arm in the history of the game.
7/25/2019 McNeil - All-Stars for All Time
http://slidepdf.com/reader/full/mcneil-all-stars-for-all-time 34/247
Where :
A = Campanella’s SB, 3.
B = Highest SB of the candidates, in this case Carlton Fisk with 8.1 = Maximum weight assigned to the statistic.
Sacrifice Hits (SH)The average number of sacrifice hits made bythe player per 550 at-bats during his career.
NORMALIZED S ACRIFICE HITS (NSH)
Campanella’s NSH = (A/B)× 1
NSH = 4/16 × 1 = .250
Where :
A = Campanella’s SH, 4.B = Highest SH of the candidates, in this case Mickey Cochrane with 16.
1 = Maximum weight assigned to the statistic.
Number of Double Plays Grounded Into (GIDP)Number of double plays grounded into by theplayer for every 550 at-bats during his career.
NORMALIZED DOUBLE PLAYS GROUNDED INTO (NGIDP)
Campanella’s NGIDP = A/B × 1
NGIDP = (10/19 × .25) × 1 = .132
Where :
A = Fewest number of DPs grounded into by a candidate,in this case Cochrane, Porter, and Tenace, with 10 each.B = Number of DPs grounded into by Campanella, 19.
.25 = GIDP factor assigned to the statistic.1 = Maximum weight assigned to the statistic.
The defensive statistics used to evaluate catchers included fielding aver-age (FA), caught stealing percentage (CS), passed balls (PB), wild pitches pre-vented (WP), range factor (RF), and other assists (ASSA). These factors werenot all rated equally. FA, CS, and RF were rated at 20 points maximum,
ASSA was rated at 10 points, PB was rated at 6 points, and WP was rated at1.5 points, for a total of 77.5 points maximum.
The defensive statistics used to evaluate all other positions, with theexception of first base, were fielding average (FA) and range factor (RF). For
2. Methodolog y 23

7/25/2019 McNeil - All-Stars for All Time
http://slidepdf.com/reader/full/mcneil-all-stars-for-all-time 35/247
first basemen, fielding runs (FR) was substituted for range factor as will beexplained in the chapter on first basemen. Range factor, in most cases, isan imperfect method of measuring a player’s defensive skills because of the
differences in the geometrical configurations of the baseball stadiums in themajor leagues. The amount of foul territory behind the plate, and aroundthe infield from first base to third base, is markedly different from park topark. And the outfield dimensions are also vastly different. The right-field
wall in Ebbets Field, for instance, had a significant effect on the rangefactor of players like Carl Furillo, who was penalized by the lack of territory to cover. And the famous Green Monster in Boston had a negative effecton the range factors of Red Sox left fielders like Ted Williams and Carl Yas-
trzemski.
Fielding Average (FA)Putouts plus assists divided by putouts plus assists plus errors.
FIELDING A VERAGE DIFFERENTIAL (FAD)
Campanella’s FAD = .988 ! .984 = + 4
Where :
.988 = Campanella’s career fielding average..984 = League fielding average for catchers during Campanella’s career.
NORMALIZED FIELDING A VERAGE DIFFERENTIAL (NFAD)
Campanella’s NFAD = ( 4 + 2)/10 × 20 = 12.000
Where :
4 = Campanella’s FAD.
2 = Adjustment to bring the most negative FADto zero (some players had a negative FAD).10 = Total range of candidate’s FADs.
20 = Maximum weight assigned to the statistic.
Caught Stealing Percentage (CS)The number of times a catcher throws out a base
runner attempting to steal a base, divided by the totalnumber of attempts, multiplied by 100.
C AUGHT STEALING PERCENTAGE DIFFERENTIAL (CSD)
Campanella CSD = 58 ! 40 = 18
Where :
24 A LL-STARS FOR A LL TIME

7/25/2019 McNeil - All-Stars for All Time
http://slidepdf.com/reader/full/mcneil-all-stars-for-all-time 36/247
58 = Campanella’s career caught stealing percentage.40 = National League average CS percent during Campanella’s career.
NORMALIZED C AUGHT STEALING PERCENTAGEDIFFERENTIAL (NCSD)
Campanella’s NCSD = A/B × 20NCSD = 18/18 × 20 = 20.000
Where :
A = Campanella’s CSD.B = The widest CS differential of the candidates,
in this case Campanella’s own1
8-point differential.20 = Maximum weight assigned to the statistic.
Passed Balls (PB)The average number of passed balls per154-game season during a player’s career.
NORMALIZED P ASSED B ALL (NPB)
Campanella’s NPB = A/B × 6
NPB = 5/7 × 6 = 4.286
Where :
A = Fewest passed balls by any candidate,in this case Mueller and Hoiles, 5.
B = Campanella’s average number of passed balls per 154 games, 7.6 = Maximum weight assigned to the statistic.
Wild Pitches (WP) Prevented Average number of wild pitches allowed by the team’s
pitching staff per 154-game season, during the player’s career.
W ILD PITCH DIFFERENTIAL (WPD)The difference between the number of wild pitches madeby the candidate’s team per 154-game season and the leagueaverage number of wild pitches per team per 154 games.
Campanella’s WPD = A ! C
WPD = 29!
30 = !1
Where :
A = Number of wild pitches thrown by Campanella’s team per 154 games.B = League average number of wild pitches per team per 154 games.
2. Methodolog y 25

7/25/2019 McNeil - All-Stars for All Time
http://slidepdf.com/reader/full/mcneil-all-stars-for-all-time 37/247
NORMALIZED W ILD PITCH DIFFERENTIAL (NWPD)
Campanella NWPD = A/B × 1.5
NWP = -1/-
16× 1
.5+
0.094 Where :
A = Campanella’s WPD, -1.B = Widest differential of any catcher in the study,
in this case Carlton Fisk with -16.1.5 = Maximum weight assigned to the statistic.
Range Factor (RF)The total number of putouts and assistsper game for the player during his career.
R ANGE F ACTOR DIFFERENTIAL (RFD)
Campanella’s RFD = A ! BRFD = 5.98 ! 4.66 = +1.32
Where :
A = Campanella’s range factor (average numberof putouts and assists per game).B = League average range factor.
NORMALIZED R ANGE F ACTOR DIFFERENTIAL (NRFD)
Campanella’s NRFD = (A + B)/CNRFD = ((1.32 + .35)/1.67) × 20 = 20.000
Where :
A = Campanella’s Range Factor = 1.32.B= Adjustment to bring the most negative range factorback to zero (some catchers had negative range factor).
C = Total range of range factors.20 = Maximum weight assigned to the statistic.
Other Assists (ASSA)The total number of a catcher’s assists, less his
caught stealing (CS) assists, per 154-game season.
OTHER A SSISTS DIFFERENTIAL (ASSAD)
Campanella’s ASSAD = A ! B ASSAD = 40 ! 45 = !5
26 A LL-STARS FOR A LL TIME

7/25/2019 McNeil - All-Stars for All Time
http://slidepdf.com/reader/full/mcneil-all-stars-for-all-time 38/247
Where :
A = Campanella’s ASSA = 40.
B = League average ASSA = 45.
NORMALIZED OTHER A SSISTS DIFFERENTIAL (NASSAD)
Campanella NASSAD = (A + B)/C × 10
Where :
A = Campanella ASSAD = ((-5 + 9)/10) × 10 = 4.000.B = Adjustment to bring the most negative ASSAD to zero = 9.
C = Total range of ASSAD’s = 10.
10 = Maximum weight assigned to the statistic.
To review, the weights that were assigned to each of the calculations were:
OFFENSE
NOBPA—20 points max.NXSLGA—20 points max.NSB—1 point max.NSH—1 point max.NGIDP—1 point max.Total—43 points max.
DEFENSE
NFAD—20 points max.NCSD—20 points max.NPB—6 points max.NWPD—1.5 points max.NRFD—20 points max.NASSAD—10 points max.Total—77.5 points max.
OFFENSIVE POINT T OTALS—EXAMPLE
Final Total Offensive
Name NOBPA NXSLGA NSB NSH NGIDP Points Rating
Campanella 17.506 18.742 .375 .250 .132 37.005 4
Hartnett 17.257 17.417 .625 .938 .167 36.404 6
2. Methodolog y 27

7/25/2019 McNeil - All-Stars for All Time
http://slidepdf.com/reader/full/mcneil-all-stars-for-all-time 39/247
28 A LL-STARS FOR A LL TIME
DEFENSIVE POINT T OTALS—EXAMPLE
Final
Total Defensive Name NFAD NCSD NPB NWPD NRFD NASSAD Points Rating
Campanella 12.000 20.000 4.286 0.094 20.000 4.000 60.380 1
Hartnett 16.000 14.545 2.727 0.094 13.054 10.000 56.420 2
To determine the catcher’s final all-around rating, based on a one-to-one offense-to-defense ratio, the total offensive points were divided by 43 andthe total defensive points were divided by 77.5. The results were addedtogether and the player with the highest point total was rated number one,
the player with the second highest total was rated number two, and so ondown the line.
FINAL A LL -A ROUND R ATING—EXAMPLE
Offense Defense Final Divided Divided Total All-Around
Name by 43 by 77.5 Points Rating
Campanella 0.861 0.779 1.640 1
Hartnett 0.847 0.728 1.575 2
Pitcher
The pitcher is a unique case in the determination of baseball’s greatestplayers in that he is not judged primarily on either his skill with the bat orhis skill with the glove. Rather, the pitcher’s primary responsibility is to keep
the opposing batters off base, by either striking them out or by causing themto hit balls that can be caught or fielded by the pitcher or his teammates. Still,a pitcher is required to bat (in the National League) and to field ground ballshit in his direction, as well as to catch an occasional pop fly or to catch a ballat first base.
In determining baseball’s greatest pitchers, they had to be evaluated forall three skills— pitching, batting, and fielding—which obviously puts mod-ern American League pitchers at a disadvantage. That disparity between thetwo leagues is unfortunate, but it had to be taken into consideration. Remem-ber, the National League has been in operation since 1876, and the pitcherhas always batted.
The American League introduced the designated hitter to major leaguebaseball fans on April 6, 1973, when Ron Blomberg of the New York Yankees

7/25/2019 McNeil - All-Stars for All Time
http://slidepdf.com/reader/full/mcneil-all-stars-for-all-time 40/247
drew a bases-loaded walk off Luis Tiant of the Boston Red Sox en route to a one-for-three day in the Yankees’ 15–5 loss to the Sox. The designated hit-ter, with no defensive position, relieved the pitcher of his batting responsi-
bility. Fortunately, the National League has kept the game pure, with a lineupof nine players, all of whom play both offense and defense.
The history of baseball is filled with pitchers who were armed and dan-gerous with a bat in their hands. In fact, during the first fifty years of thetwentieth century, there was a plethora of good hitting pitchers, including
Walter Johnson, Wes Ferrell , and Don Newcombe. Walter Johnson was one of baseball’s best hitting pitchers, recording a
career batting average of .235 with 22 doubles, 10 triples, and six home runs
for every 550 at-bats. And two-thirds of his career was in the dead ball era.He batted .268 in the lively ball era. Wes Ferrell , who was probably the greatest hitting pitcher who ever wore
a major league uniform, compiled a career batting average of .280 during a fifteen-year career. He averaged 27 doubles, six triples, 18 home runs, and 97RBIs for every 550 at-bats. In 1931, the 6'2", 192-pound right-handed hit-ter slugged the ball at a .319 clip with nine home runs in 116 at-bats, an aver-age of 43 home runs for every 550 at-bats! Five years later, he batted a sizzling .347 with seven homers in 150 at-bats. Wes Ferrell’s 38 career home runs is
still the record for a pitcher.Don Newcombe batted .271 over a ten-year career, with 15 home runs
in 858 at-bats. He had a career season in 1955 when he batted .359 with ninedoubles, seven homers, and 23 RBIs, in 117 at-bats. He also went 20–5 onthe mound with 17 complete games.
Pitchers were evaluated for their pitching skills, their batting skills, andtheir fielding skills in this study. Their pitching performance represented 90percent of their Final All-Around Rating (FAR), while their batting perform-ance represented 6 percent of their FAR and their fielding performance rep-
resented 4 percent of their FAR.
Offensive RatingsThe pitcher’s batting performance was evaluated for NOBP and NXSLG.
Final NOBPA NXSLGA Total Offensive
Name × 3 × 3 Points Rating
W. Johnson 1.989 2.658 4.647 2
C. Mathewson 2.109 2.067 4.176 3
W. Ferrell 3.000 3.000 6.000 1
2. Methodolog y 29

7/25/2019 McNeil - All-Stars for All Time
http://slidepdf.com/reader/full/mcneil-all-stars-for-all-time 41/247
Defensive RatingsThe pitcher’s defense was evaluated for NFAD and NRFD.
Final NFAD NRFD Total Defensive Name × 2 × 2 Points Rating
W. Johnson 1.839 0.451 2.290 13
C. Mathewson 1.977 1.461 3.438 3
W. Ferrell 1.793 1.490 3.283 4
Pitching Ratings
It was very difficult to arrive at a fair method for evaluating the pitch-ing skills of the individual pitchers from one era to another and select thosepitching statistics that would provide a level playing field for all pitchers dueto the many changes that have been made in the position over the years. Someof the statistics that were considered were the number of complete gamespitched per year, the number of innings per game a pitcher averaged, and a pitcher’s winning percentage. Obviously winning percentage per se could notbe used because pitchers who pitched for winning teams invariably had higher
winning percentages than pitchers who toiled for losing teams. The mental-ity of the game has changed over the decades as well, particularly with regardto pitchers. Relief pitchers have gradually grown in importance since theirintroduction in 1892 by evolving into genuine closers whose responsibility it
was to shut down the opposition for just one inning. Middle relievers andsetup men were part of the same evolutionary process, putting less emphasison the starting pitcher going the distance or even pitching seven or eightinnings. These changes made the evaluation of complete games and inningspitched per game moot points.
After a careful study of all the factors that are available to measure a pitcher’s skills, it was decided that the most equitable statistics that could beused to evaluate pitchers would be their normalized won-lost percentage andthe normalized ERA. The individual won-lost percentage was compared tothe team’s won-lost percentage, with the difference between the two num-bers identified as the differential winning percentage (WLPD). This number
was then normalized (NWLPD), with an assigned maximum point total of 45. The adjusted ERA (AERA) was a value arrived at by dividing the leagueaverage ERA by individual pitcher ERA, with the result multiplied by thepitcher’s park factor, as described in The Baseball Encyclopedia . A pitcher’spark factor, like a position player’s park factor, is the effect that a player’shome park has on his statistics, but unlike a batter’s park factor, it is a gen-eralized term that is the same for all pitchers that pitch in that park. The
30 A LL-STARS FOR A LL TIME

7/25/2019 McNeil - All-Stars for All Time
http://slidepdf.com/reader/full/mcneil-all-stars-for-all-time 42/247
pitcher’s park factor is not individualized like a batter’s park factor since thepitcher is facing both right-handed batters and left-handed batters. Theadjusted ERA was normalized (NAERA) with an assigned maximum pointtotal of 45.
Walter Johnson’s won-lost percentage differential (WLPD) was:
Walter Johnson won 417 games during his 21-year career, primarily with a second-division club.

7/25/2019 McNeil - All-Stars for All Time
http://slidepdf.com/reader/full/mcneil-all-stars-for-all-time 43/247
WLPD = A ! B WLPD = .599 minus .492 = +.107.
Where : A = Walter Johnson’s career won-lost percentage, .599.
B = Walter Johnson’s team’s won-lost percentage during his career, .492.
NORMALIZED WON-LOST PERCENTAGE DIFFERENTIAL
NWLPD = A/B × 45NWLPD = .107/.108 × 45 = 44.583
Where :
A = Walter Johnson’s WLPD, +.107.B = Highest WLPD of the candidates, in this case Grover Cleveland
Alexander’s +.108.45 = Maximum weight assigned to the statistic.
Walter Johnson’s adjusted ERA, as determined by Pete Palmer, was 145.The highest AERA belonged to Lefty Grove at 148. Therefore, Walter John-son’s normalized ERA was:
NAERA = 145 divided by 148 × 45 = 44.088.
Where :
45 = Maximum weight assigned to the statistic.
Walter Johnson’s total pitching rating (TPR) was the sum of his nor-malized won-lost differential percentage and his normalized adjusted ERA.
Total Total Pitching Name NWLPD NAERA Points Ratings (TPR)
W. Johnson 44.583 44.088 88.671 1
C. Mathewson 36.667 41.351 78.018 7
W. Ferrell 30.000 35.574 65.574 16
Final All-Around Rating
Final Pitching Offensive Defensive Total All-Around
Name @ 90% @ 6% @ 4% Points Rating W. Johnson 88.671 4.647 2.290 95.608 1
C. Mathewson 78.018 4.176 3.438 85.632 6
W. Ferrell 65.574 6.000 3.283 74.857 13
32 A LL-STARS FOR A LL TIME

7/25/2019 McNeil - All-Stars for All Time
http://slidepdf.com/reader/full/mcneil-all-stars-for-all-time 44/247
First Base
The offensive statistics used for first basemen were the same statistics that
were used for catchers: OBP, SLG, SB, SH, GIDP. There were a total of 43offensive points, as noted previously, 20 points each for OBP and SLG, onepoint each for SB, SH, and GIDP. Since first basemen have been consideredto be one of the primary offensive weapons on a team, they were normally selected for their batting prowess as opposed to their defensive skills; there-fore, in this study their offensive point total was weighted at four times theirdefensive point total. If a team is fortunate enough to find a first baseman
with both offensive and defensive skills, it is considered to be a bonus.
The defensive statistics used for first basemen were fielding average (FA)and fielding runs (FR). Other position players in the infield and outfield wererated for FA and range factor (RF), but RF is not of much value for first base-men since they have very few assists and most of their putouts are the resultof throws made to them while they are standing stationary on first base. A more valuable statistic is Pete Palmer’s fielding runs (FR), which is definedby the following formula.
FR = PFR/(PO ! SO for team) ! LFR/(PO ! SO for league) × player innings
Where :
PFR = Player fielding rate for first base = .2 × (2 × A ! E).LFR = League fielding rate.
As with Palmer’s other formulas, however, FR is a value formula, so ithas to be modified slightly to make it a skill formula. Since the FR varies withthe number of games played by the first baseman, the result had to be madeequitable for all players by adjusting the result to fixed number of games
played. The number of games played in this case was arbitrarily set at 2,000.Therefore, since Lou Gehrig played in 2,137 games during his career, hisadjusted FR formula (AFR) would be :
AFR = FR × A/B = !59 × 2000/2137 = !55
Where :
FR = Lou Gehrig’s career fielding runs, !59. AFR = Lou Gehrig’s career fielding runs adjusted to 2,000 games.
A = The 2,000 game base point.B = Lou Gehrig’s games played, 2,137.
An example of the defensive ratings for first basemen, with a maximumof 40 defensive points, is:
2. Methodolog y 33

7/25/2019 McNeil - All-Stars for All Time
http://slidepdf.com/reader/full/mcneil-all-stars-for-all-time 45/247
NFAD NAFR Total Name FA LFA DIFF. × 20 FR AFR × 20 Points Rating
Gehrig .991 .990 +1 7.500 !59 !55 5.300 12.800 17
V. Power .994 .991 +3 17.500 116 178 20.000 37.500 1
Mattingly .996 .992 +4 20.000 !19 !21 7.444 27.444 5
K. Hernandez .994 .992 +2 15.000 133 132 17.098 32.098 2
34 A LL-STARS FOR A LL TIME
Some examples of the Final All-Around Ratings for first basemen, basedon a four-to-one offense-to-defense ratio are:
Offense Defense Final Divided Divided Total All-Around
Name by 43 × 4 by 40 Points Rating
Gehrig 3.865 0.445 4.310 1
Foxx 3.620 0.659 4.279 2
V. Power 2.275 0.938 3.213 18
Second Base, Shortstop, Third Base
The offensive statistics for the second baseman, the shortstop, and thirdbaseman were the same as those used by catchers and first basemen: OBP,SLG, SB, SH, and GIDP. The defensive statistics used for second basemen,shortstops, and third basemen were fielding average (FA) and range factor(RF).
Second basemen and third basemen were rated at two-to-one for theiroffense versus their defense, while the shortstop was rated at one-to-one.
Outfielders
All outfielders were rated for OBP, SLG, SB, SH, and GIDP on offenseand FA and RF on defense. The only difference between the three outfieldpositions was that the left fielder and the right fielder were rated on an offense-to-defense ratio of four-to-one, while the center fielder was rated at three-to-one.
Fielding averages are deceptive, particularly for outfielders. Some out-fielders can catch anything that comes their way, but not all have very goodrange and can fail to reach balls they should catch that eventually fall in forbase hits. Pete Rose and Al Simmons, for instance, fall into that category.Other outfielders, like Tris Speaker, Kirby Puckett, and Willie Mays, hadexcellent fielding averages as well as outstanding range. Most of the outfield-

7/25/2019 McNeil - All-Stars for All Time
http://slidepdf.com/reader/full/mcneil-all-stars-for-all-time 46/247
ers with good range usually find themselves in center field. Unfortunately,some outfielders are penalized because of their outstanding speed. For instance,if a ball is hit beyond a fielder’s reach, it is scored a base hit. If, on the other
hand, a speedy outfielder reaches a ball after a long run and then cannot holdthe ball, he is occasionally charged with an error.
This study does not include ratings for Barry Bonds, Mark McGwire,Sammy Sosa, or Rafael Palmeiro due to the suspicion that steroids may havecontributed to their offensive statistics. If, at a future date, the steroid scan-dal is resolved favorably and Bonds, McGwire, Sosa, and Palmeiro are exon-erated, their ratings will be included in the next edition of this book. At thepresent time it appears as if the four players will have a difficult time being
elected to the National Baseball Hall of Fame in Cooperstown, New York,even though their statistics are worthy of the players’ induction. Mark McGwire, the first of the group to be eligible for election, garnered only 23.5percent of the vote in 2007, with 75 percent required for election. RafaelPalmeiro retired after the 2005 season and will be eligible for Hall of Fameconsideration in 2010. Barry Bonds and Sammy Sosa were still active in 2007.
The steroid issue is discussed in greater detail in the Appendix.
2. Methodolog y 35

7/25/2019 McNeil - All-Stars for All Time
http://slidepdf.com/reader/full/mcneil-all-stars-for-all-time 47/247
C HAPTER 3
The NineteenthCentury All-Stars
Major league baseball in the nineteenth century, from its first officialcontest in 1845 through 1899, was a game in transition. The game slowly evolved from a Saturday afternoon social event to a spirited contest betweentwo dedicated teams, and the rules were adjusted over the years to find themost equitable balance between batter and pitcher, without favoring one overthe other. Identifying the game’s greatest players during this period wasdifficult because of all the changes in the rules, such as allowing overhand
pitching, extending the pitcher’s mound from fifty feet from home plate to60'6", recording stolen bases, and awarding the batter first base after four ballshad been thrown. Still, the feeling was that the greatest players of their timeshould be recognized, just as their twentieth century counterparts would berecognized.
The relative weights given to the offense and defense for the nineteenthcentury all-stars were the same as the weights assigned to the twentieth cen-tury team:
Catchers and shortstops were rated equally for their offense and theirdefense, so their offensive skills were measured against the same maximumpoint totals as their defensive skills.
Pitchers were rated at 90 percent for their pitching, 6 percent for theirbatting, and 4 percent for their fielding.
First basemen, left fielders, and right fielders were assumed to be essen-tially offensive members of the team. Their offense received four times the
weighted point totals as did their defense.Second basemen and third basemen were rated two-to-one, offense-to-
defense.Center fielders, who were considered to be the defensive anchors in theoutfield, were rated at three-to-one, offense-to-defense.
36

7/25/2019 McNeil - All-Stars for All Time
http://slidepdf.com/reader/full/mcneil-all-stars-for-all-time 48/247
Catchers
Five catchers were rated
for their offensive and defensiveskills.
• Buck Ewing was the quietleader of the New York Gothams, later the Giants.He was one of the NationalLeague’s best hitters during the 1880s and 1890s, rapping
the ball at a .304 clip. Healso excelled on defense and
was reported to have had thestrongest throwing arm inthe league.
• Michael “King” Kelly wasa flamboyant character who
was as colorful off the field
as on it. His charisma per-haps embellished his careerachievements, but he wasstill one of the best playersof the nineteenth century,compiling a .308 career bat-ting average. And he was asfast on his feet as he wasmentally quick. He was a
daring base runner who stole312 bases over one five-yearperiod, and who once scored155 runs in 118 games.
• Charles “Chief” Zimmer, whose career covered nineteen years between1884 and 1903, was considered to be the top defensive catcher of his era.He was the first catcher to play directly behind the batter on every pitch,a strategy previously frowned upon because of the danger of injury fromfoul tips. He was not, however, much of an offensive threat, posting a career batting average of .269.
• James “Deacon” McGuire caught in the major leagues for 26 years, a prodigious accomplishment under nineteenth-century conditions. Whenhe retired, he held many catching records, two of which—most years
3. The Nineteenth-Century All-Stars 37
Buck Ewing was the field leader of the New York Giants during the 1880s.
7/25/2019 McNeil - All-Stars for All Time
http://slidepdf.com/reader/full/mcneil-all-stars-for-all-time 49/247
caught (26) and most career assists (1,859)—are still intact. The 6'1",185-pound right-handed batter was primarily a defensive backstop, buthe could also contribute at the plate, compiling a .278 career batting
average.
• Jack Clements was a unique catcher in baseball history, a left-handedreceiver who nonetheless enjoyed a 17-year major league career, primarily
with the Philadelphia Phillies. The stubby Pennsylvanian, who packed204 pounds on his 5'8" frame, was the first of the slugging catchers,averaging 10 home runs for every 550 at-bats during a time when many teams hit about 35 homers a year.
Offensive RatingsPlayer evaluations for the nineteenth century all-star team were neces-
sarily simple compared to the evaluations for the twentieth century team dueto a paucity of statistics in the early game as well as many rule changes thataffected the game, such as the four-ball rule, changes in the pitcher’s moundheight and distance to home plate, and the failure to record stolen bases. Theoffensive measurements consisted of on-base percentage differential (OBPD),and slugging average differential (SLGD). Each statistic was normalized as
discussed earlier, and was rated at a maximum of 1.000 point, giving a totalof two points maximum for offense. The individual statistics were not adjustedfor the individual park factor, but that was probably not significant sincemost of the 19th century parks were large open fields with a wide expanse of outfield grass. There were, of course, a few exceptions, most notably Lake-front Park in Chicago with its 180-foot left-field fence and its 196-foot right-field fence. Home runs flew out of Lakefront Park with abandon. The WhiteStockings hit a total of 142 home runs in 1884, most of them at home, whilethe other seven National League teams hit a total of 179 homers combined.
The following year the rules were changed to recognize balls hit over the left-and right-field fences as doubles.
As might be expected, Buck Ewing and King Kelly dominated the offen-sive statistics. Kelly’s OBP was 53 points higher than the league average whileEwing’s OBP was 22 points higher than the league average. Conversely, Chief Zimmer’s OBP was 10 points below the league average. The offensive break-down is shown below. The point totals for each category were arrived at by determining the ratio of each player’s differential to the maximum differen-tial. If some differentials were below the league average, an adjustment wasmade to bring the most negative differential back to zero, and that amount
was added to each player’s total before calculating the ratio. For example, therange for a catcher’s OBP was 63 points, so ten points had to be added toeach player’s total in order to bring Zimmer’s differential to zero. King Kelly,
38 A LL-STARS FOR A LL TIME
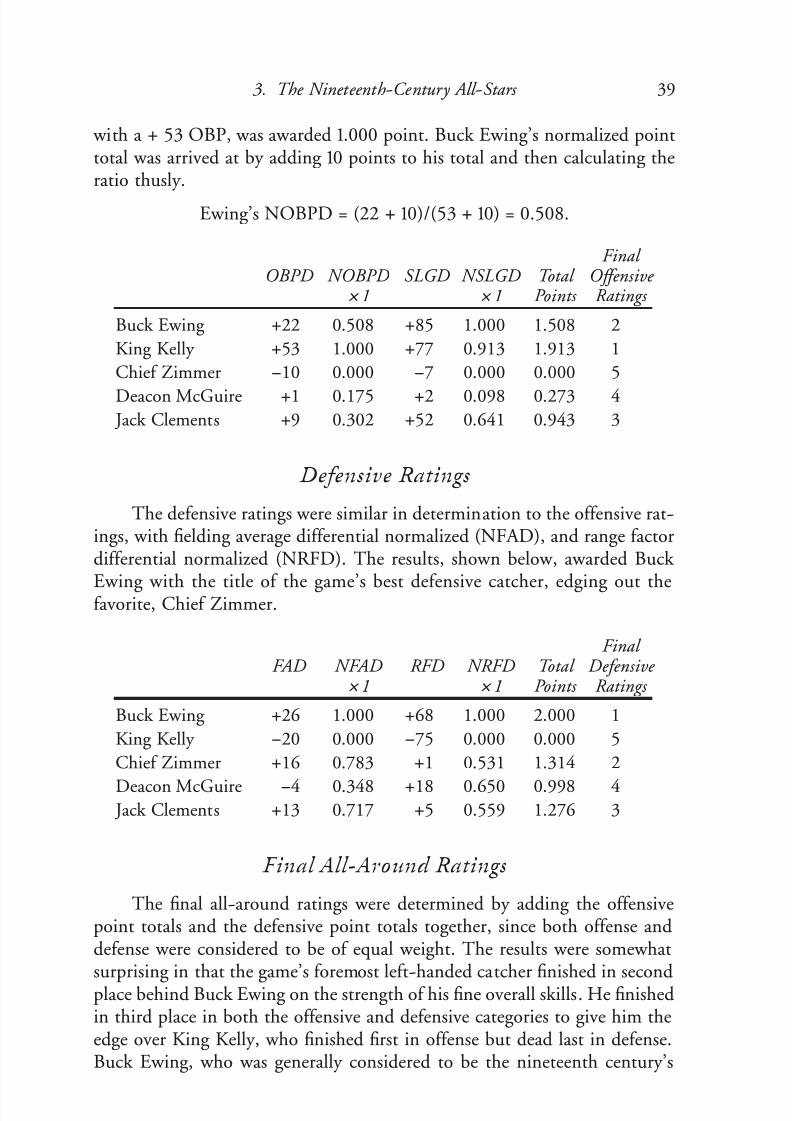
7/25/2019 McNeil - All-Stars for All Time
http://slidepdf.com/reader/full/mcneil-all-stars-for-all-time 50/247
with a + 53 OBP, was awarded 1.000 point. Buck Ewing’s normalized pointtotal was arrived at by adding 10 points to his total and then calculating theratio thusly.
Ewing’s NOBPD = (22 + 10)/(53 + 10) = 0.508.
Final OBPD NOBPD SLGD NSLGD Total Offensive
× 1 × 1 Points Ratings
Buck Ewing +22 0.508 +85 1.000 1.508 2
King Kelly +53 1.000 +77 0.913 1.913 1
Chief Zimmer !10 0.000 !7 0.000 0.000 5
Deacon McGuire +1 0.175 +2 0.098 0.273 4 Jack Clements +9 0.302 +52 0.641 0.943 3
Defensive Ratings
The defensive ratings were similar in determination to the offensive rat-ings, with fielding average differential normalized (NFAD), and range factordifferential normalized (NRFD). The results, shown below, awarded Buck
Ewing with the title of the game’s best defensive catcher, edging out thefavorite, Chief Zimmer.
Final FAD NFAD RFD NRFD Total Defensive
× 1 × 1 Points Ratings
Buck Ewing +26 1.000 +68 1.000 2.000 1
King Kelly !20 0.000 !75 0.000 0.000 5
Chief Zimmer +16 0.783 +1 0.531 1.314 2
Deacon McGuire !
4 0.348 +18 0.650 0.998 4 Jack Clements +13 0.717 +5 0.559 1.276 3
Final All-Around Ratings
The final all-around ratings were determined by adding the offensivepoint totals and the defensive point totals together, since both offense anddefense were considered to be of equal weight. The results were somewhat
surprising in that the game’s foremost left-handed catcher finished in secondplace behind Buck Ewing on the strength of his fine overall skills. He finishedin third place in both the offensive and defensive categories to give him theedge over King Kelly, who finished first in offense but dead last in defense.Buck Ewing, who was generally considered to be the nineteenth century’s
3. The Nineteenth-Century All-Stars 39

7/25/2019 McNeil - All-Stars for All Time
http://slidepdf.com/reader/full/mcneil-all-stars-for-all-time 51/247
finest all-around catcher, justified that belief by finishing second in offensebehind Kelly, finishing first in defense, and first overall.
Final Offense Defense Total All-Around × 1 × 1 Points Ratings
Buck Ewing 1.508 2.000 3.508 1
King Kelly 1.913 0.000 1.913 3
Chief Zimmer 0.000 1.314 1.314 4
Deacon McGuire 0.273 0.998 1.271 5
Jack Clements 0.943 1.276 2.219 2
Pitchers
Pitcher was the most difficult position to evaluate for nineteenth cen-tury players for the reasons noted earlier. They, like their twentieth century counterparts, were compared, not only for their pitching skills, but also fortheir batting skills and their fielding skills. After careful consideration, a pitcher’s pitching skills were set at 90 percent of the point total, batting at 6percent, and fielding at 4 percent. Pitching skills were determined by com-
paring a pitcher’s won-lost percentage differential (WLPD) and his adjustedERA (AERA). The batting and fielding categories were the same as that usedfor catchers.
A total of nine pitchers were in the running for the title of baseball’s great-est all-around pitcher of the nineteenth century.
• Tim Keefe was the ace of the New York Giant pitching staff during the1880s. From 1883 through 1888, his victory totals were 41, 37, 32, 42, 35,and 35. The side-arming right-hander, who was devastating while pitch-
ing from 50 feet, went 41–27 with 68 complete games in 68 starts in 619innings in 1883. Over the course of his career, he won 342 games (num-ber eight all-time) against 225 losses, while completing 93 percent of hisstarts.
• Michael Francis “Smiling Mickey” Welch, a pitching partner of Keefe, was a curveball specialist who also threw a changeup and a screwball.His greatest year was 1885 when he won 44 games against 11 losses for a league-leading .800 winning percentage. That year he completed all 55of his starts. Smiling Mickey pitched in the major leagues for 13 years,
winning 307 games against 210 losses while completing 96 percent of hisstarts.
• Charles “Kid” Nichols was the ace of the Boston Beaneaters’ staff from1890 through 1901. His seven consecutive 30+ victory seasons, from 1891
40 A LL-STARS FOR A LL TIME

7/25/2019 McNeil - All-Stars for All Time
http://slidepdf.com/reader/full/mcneil-all-stars-for-all-time 52/247
to 1898, has never been equaled. Nichols, who threw with an effortlessoverhand delivery, had a blazing fastball and pinpoint control. His 361
career victories rank sixth all-time, his 532 complete games are fourth,
and his 5,067 innings pitched eleventh.
• Jack Stivetts, known as “Happy Jack,” was a two-way player in the 1890s,pitching 388 games and playing other positions in 213 games. He pitchedfor eleven years, winning more than 20 games six times, with a high of35 in 1892. His career won-lost record was 203–132, with 278 completegames. But Stivetts was also a deadly slugger who compiled a careerbatting average of .298 with 10 home runs and 99 RBIs for every 550at-bats.
• Charles “Old Hoss” Radbourne had outstanding speed as well as a bewil-dering assortment of breaking pitches thrown from different arm angles.He produced baseball’s greatest pitching performance in 1884, going 60–12 on the mound for the Providence Grays, with 73 complete gamesin 73 starts, eleven shutouts, a 1.38 ERA, and 441 strikeouts in 679innings. Radbourne’s career record was 309 victories against 194 losses.
• Amos Rusie, “The Hoosier Thunderbolt,” was the major league’s primary power pitcher in the 1890s, combining a blazing fastball with a sharp-breaking curveball to freeze batters in their tracks. The 6'1", 200-poundright-hander led the league in strikeouts five times and shutouts fourtimes before tearing muscles in his shoulder, essentially ending his career
with a record of 246 wins against 174 losses.
• John Clarkson, a slender right-handed underhand pitcher, combinedspeed, pinpoint control, and confusing curves to out-think opposing batters. In 1885, he led the league in victories (53), games started (70),complete games (68), shutouts (10), innings pitched (623), and strikeouts(308). Clarkson’s twelve-year career produced 328 victories against 178
losses for a fine .648 winning percentage.• Clark Griffith, “The Old Fox,” small of stature at 5'6", 155 pounds, used
a curveball and a slow ball, combined with such illegal pitches as a scuff ball and a spitball, to carve out a successful 20-year major league career.He won more than 20 games seven times while leading the NationalLeague in winning percentage, complete games, and ERA once each.His career record showed 237 wins against 146 losses.
• Robert “Parisian Bob” Caruthers, a diminutive right-hander, was a think-ing-man’s pitcher who pitched to the batter’s weakness by using a livefastball and perfect control. His career won-lost percentage of .688, basedon 218 victories against 99 losses, is the third-highest winning percentagein baseball history, behind Dave Foutz and Whitey Ford. He was also a .282 career hitter who played the outfield when not pitching.
3. The Nineteenth-Century All-Stars 41

7/25/2019 McNeil - All-Stars for All Time
http://slidepdf.com/reader/full/mcneil-all-stars-for-all-time 53/247
Pitching Ratings
The most equitable won-lost percentage rating was determined to be the
difference between the individual’s won-lost percentage and the won-lost per-centage of his team. Since most of the pitchers in the study had impressive won-lost records, and since most of them played for championship teams thatalso had impressive won-lost records, it would have been unfair to evaluatethem based on their individual won-lost records alone. The won-lost per-centage differential was intended to identify the pitchers who stood out, evenon teams that compiled outstanding won-lost records. Surprisingly, at leastto me, Bob Caruthers, who had the highest individual won-lost percentage,also produced the highest won-lost percentage differential (WLPD). His .688
winning percentage was 83 points higher than his team’s .605 winning per-centage. He was followed by Clark Griffith at +.70, Amos Rusie at +.62, andOld Hoss Radbourne at +.55.
The adjusted ERA (AERA), as presented by Pete Palmer and Gary Gil-lette in The Baseball Encyclopedia , was arrived at by dividing the league ERA by the individual pitcher’s ERA and multiplying the result by the pitcher’spark factor. The adjusted ERA compensated for the difference between thepre–1893 era, which was a pitcher’s era with the pitcher’s mound residing between 45 and 55 feet from home plate, and the post 1893 era, which wasmore of a hitter’s era. The uncorrected ERAs confirmed that the early pitch-ers, Radbourne, Keefe, Welch, and Clarkson, topped the ratings, but when
AERA was used, the results were completely different. Chet Nichols, who hadthe sixth-lowest ERA, finished first in AERA with a mark of 139. John Clark-son was close behind at 134, followed by Amos Rusie at 130 and Tim Keefeat 125.
The WLPD and AERA were then normalized, with each result multi-plied by 45, giving a total of 90 points, or 90 percent of the final overall
pitcher ratings. Amos Rusie, who finished third in both NWLPD andNAERA, deservedly walked off with top pitching prize. Kid Nichols, whofinished first in NAERA but tied for seventh in NWLPD, was second, andBob Caruthers, who set the pace in NWLPD and finished fifth in NAERA,came in third.
Final NWLPD NAERA Total Pitching Pitching
Name × 45 × 45 Points Ratings
Amos Rusie 36.085 29.423 65.508 1
Kid Nichols 17.830 45.000 62.830 2
Bob Caruthers 45.000 17.308 62.308 3
John Clarkson 24.623 36.346 60.969 4
Clark Griffith 39.481 13.846 53.327 5
42 A LL-STARS FOR A LL TIME

7/25/2019 McNeil - All-Stars for All Time
http://slidepdf.com/reader/full/mcneil-all-stars-for-all-time 54/247
Old Hoss Radbourne 33.113 12.115 45.228 6
Tim Keefe 17.830 20.769 38.599 7
Mickey Welch 22.075 00.000 22.075 8
Jack Stivetts 00.000 12.115 12.115 9
Offensive Ratings
A pitcher’s batting skills were evaluated for on-base percentage differen-
tial (OBPD), and slugging percentage differential (SLGD). The results werenormalized, and the result was multiplied by three to produce a final offen-sive rating that was 6 percent of the total pitcher’s rating. Jack Stivetts andBob Caruthers, both of whom were outstanding hitters that often played theoutfield when not pitching, dominated the batting category. Parisian Bob hada huge advantage in OBPD with a +66 points compared to a !21 points forthe next man, Old Hoss Radbourne, and he also led in SLGD with a +52point differential to a +44 differential for Jack Stivetts. When the total nor-malized batting points were computed for NOBPD and NSLGD, Bob
Caruthers ran away from the other contenders.
Final NOBPD NSLGD Total Offensive
× 2 × 2 Points Ratings
Bob Caruthers 2.000 2.000 4.000 1
Jack Stivetts 0.842 1.884 1.726 2
Old Hoss Radbourne 0.855 0.159 1.014 3
Mickey Welch 0.487 0.464 0.951 4
Amos Rusie 0.000 0.464 0.464 8Clark Griffith 0.645 0.101 0.746 5
John Clarkson 0.013 0.478 0.491 6
Tim Keefe 0.408 0.072 0.480 7
Kid Nichols 0.066 0.000 0.066 9
Defensive Ratings
A pitcher’s defensive ratings were based on the pitcher’s fielding averagedifferential (FAD) and his range factor differential (RFD). The results werenormalized and multiplied by two to give a total of four points, or 4 percentof the overall pitcher’s ratings. In general, pitchers were better-than-averagefielders, with Nichols and Caruthers both exceeding the league fielding aver-
3. The Nineteenth-Century All-Stars 43
Final NWLPD NAERA Total Pitching Pitching
Name × 45 × 45 Points Ratings
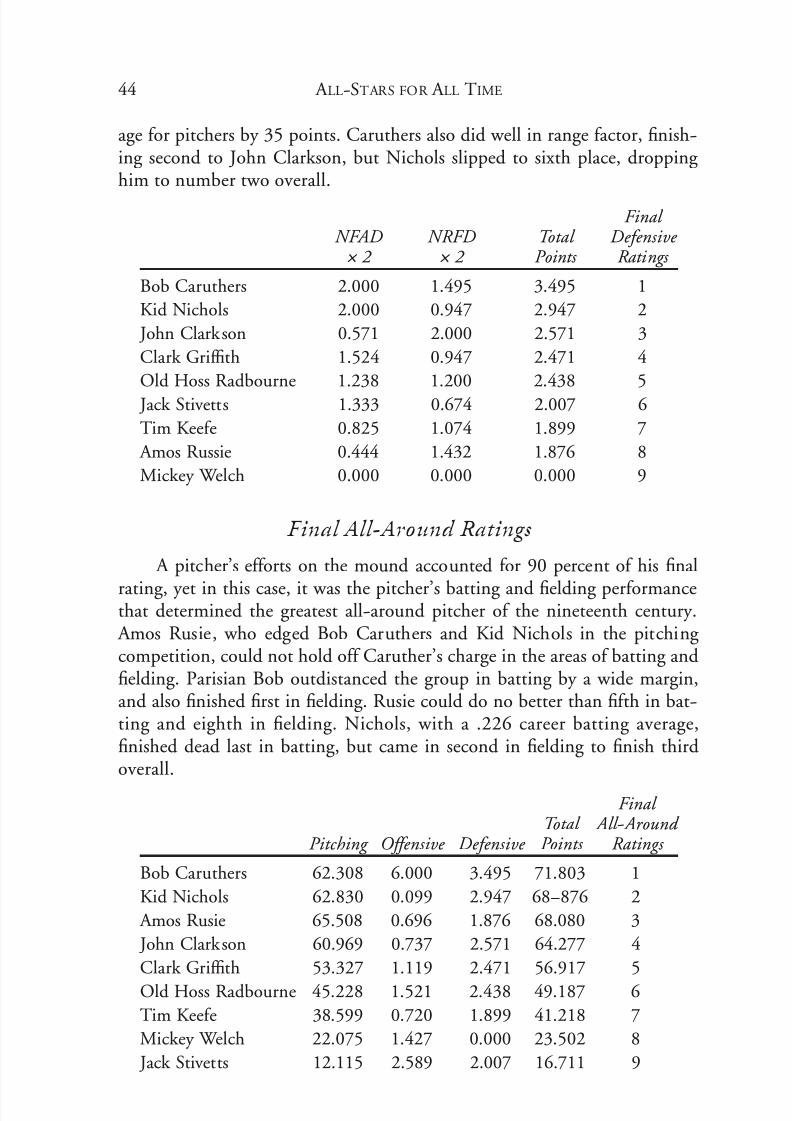
7/25/2019 McNeil - All-Stars for All Time
http://slidepdf.com/reader/full/mcneil-all-stars-for-all-time 55/247
age for pitchers by 35 points. Caruthers also did well in range factor, finish-ing second to John Clarkson, but Nichols slipped to sixth place, dropping him to number two overall.
Final NFAD NRFD Total Defensive × 2 × 2 Points Ratings
Bob Caruthers 2.000 1.495 3.495 1
Kid Nichols 2.000 0.947 2.947 2
John Clarkson 0.571 2.000 2.571 3
Clark Griffith 1.524 0.947 2.471 4
Old Hoss Radbourne 1.238 1.200 2.438 5
Jack Stivetts 1.333 0.674 2.007 6
Tim Keefe 0.825 1.074 1.899 7
Amos Russie 0.444 1.432 1.876 8
Mickey Welch 0.000 0.000 0.000 9
Final All-Around Ratings
A pitcher’s efforts on the mound accounted for 90 percent of his final
rating, yet in this case, it was the pitcher’s batting and fielding performancethat determined the greatest all-around pitcher of the nineteenth century.
Amos Rusie, who edged Bob Caruthers and Kid Nichols in the pitching competition, could not hold off Caruther’s charge in the areas of batting andfielding. Parisian Bob outdistanced the group in batting by a wide margin,and also finished first in fielding. Rusie could do no better than fifth in bat-ting and eighth in fielding. Nichols, with a .226 career batting average,finished dead last in batting, but came in second in fielding to finish thirdoverall.
Final Total All-Around
Pitching Offensive Defensive Points Ratings
Bob Caruthers 62.308 6.000 3.495 71.803 1
Kid Nichols 62.830 0.099 2.947 68–876 2
Amos Rusie 65.508 0.696 1.876 68.080 3
John Clarkson 60.969 0.737 2.571 64.277 4
Clark Griffith 53.327 1.119 2.471 56.917 5
Old Hoss Radbourne 45.228 1.521 2.438 49.187 6
Tim Keefe 38.599 0.720 1.899 41.218 7
Mickey Welch 22.075 1.427 0.000 23.502 8
Jack Stivetts 12.115 2.589 2.007 16.711 9
44 A LL-STARS FOR A LL TIME

7/25/2019 McNeil - All-Stars for All Time
http://slidepdf.com/reader/full/mcneil-all-stars-for-all-time 56/247
First Base
Five players vied for the title of the nineteenth century’s greatest all-
around first baseman.
• Cap Anson was the first player in the game to accumulate more than3,000 base hits and the first to hit more than 500 career doubles. Hiscareer batting average of .331 ranks 26th all-time. Cap, as he was called,
was not only a terrific hitter, he was also an outstanding defensive player who led the league in fielding average four times.
• Jake Beckley was a talented all-around first baseman who had a .308career batting average while also gaining a reputation as an excellent
defensive player. The 5'10", 200-pound left-handed hitter batted .300or better thirteen times in his 20-year career, with a high of .345 in 1895.On defense, he ranks number one in both games played (2,377) andputouts (23,709), and eighth in assists (1,315).
• Dan Brouthers compiled the highest slugging average of the nineteenthcentury (.519), while hitting against the dead ball from a distance of 50
to 55 feet from the pitcher. The6'2", 207-pounder, the most
feared batter of his time, aver-aged 38 doubles, 17 triples, andnine home runs for every 550at-bats while hitting a robust.342. On the other side of thecoin, he was considered a liabil-ity in the field and on the bases.
• Roger Connor, who stood 6'3"tall and weighed a husky 220
pounds, compiled a career bat-ting average of .308 with 31
doubles, 16 triples, and 10 homeruns a year. His 136 career homeruns and 811 extra-base hits bothrank number one for nineteenth-century batters, and his 233career triples are fifth all-time.He was also an excellent defen-sive first baseman as well as anexceptional base runner.
• Dave Orr packed 250 pounds onhis 5'11" frame, and he used it to
3. The Nineteenth-Century All-Stars 45
Dave Orr was the National League’s fore-most slugger until a stroke ended his careerat the age of 30 (courtesy John Thorn).

7/25/2019 McNeil - All-Stars for All Time
http://slidepdf.com/reader/full/mcneil-all-stars-for-all-time 57/247
pound out 57 extra-base hits for every 550 at-bats, the fifth highestextra-base hit totals in the nineteenth century. Sadly, Orr, who was alsoa fine defensive first baseman, suffered a paralyzing stroke in 1890, ending
his career after just eight years. He left a .342 career batting average, a.366 on-base percentage, and a .502 slugging average, the fourth-highestslugging average in the nineteenth century.
Offensive Ratings
First base has always been considered to be an offensive position, one where big, burly sluggers are positioned when there is no other position they
can play satisfactorily. First basemen who were outstanding defensive players were not in the majority, and teams who had an excellent all-around firstbaseman were fortunate. Since the position was primarily an offensive posi-tion, a first baseman’s offense was weighted at four-to-one over his defense.Dan Brouthers led the way in both published on-base percentage and slug-ging average, but when the era adjustments were made, it was a differentstory. Big Dan had the highest on-base percentage differential (OBPD), withhis .423 OBP topping the league average by 95 points. Orr, who walked only 16 times for every 550 at-bats, came in fourth. The slugging average differ-
ential was another two-man competition, with Dave Orr edging DanBrouthers +156 to +150. Overall, Brouthers claimed the title of the game’sbest offensive first baseman, accumulating 1.931 points to 1.400 for Orr, thanksto his big lead in OBP.
Final OBPD NOBPD SLGD NSLGD Total Offensive
Name × 1 × 1 Points Ratings
Dan Brouthers +95 1.000 +150 0.931 1.931 1
Dave Orr +50 0.400 +156 1.000 1.400 2Roger Connor +72 0.693 +118 0.563 1.256 3
Cap Anson +67 0.627 +76 0.080 0.707 4
Jake Beckley +20 0.000 +69 0.000 0.000 5
Defensive Ratings
First basemen were evaluated for fielding average differential (FAD) and
fielding runs differential (FRD). All the first basemen in the study had posi-tive fielding average differentials with the exception of Dan Brouthers, whoseaverage was at the league average. Roger Connor set the pace in a close com-petition, finishing five points above the league average compared to four pointsfor Orr, three points for Beckley, and two points for Anson. The fielding runs
46 A LL-STARS FOR A LL TIME

7/25/2019 McNeil - All-Stars for All Time
http://slidepdf.com/reader/full/mcneil-all-stars-for-all-time 58/247
race was another close call with Anson topping the list. Roger Connor, thanksto a first-place finish in FA and a second-place finish in FR, claimed the titleas the best defensive first baseman in the competition. Not surprisingly, Dan
Brouthers finished last in the field of five.
Final NFAD NRFD Total Defensive
Name FAD × 1 RFD × 1 Points Ratings
Jake Beckley +3 0.600 +28 1.000 1.600 1
Roger Connor +5 1.000 +18 0.412 1.412 2
Dave Orr +4 0.800 +21 0.588 1.388 3
Cap Anson+
2 0.400+
22 0.647 1.047 4Dan Brouthers 0 0.000 +11 0.000 0.000 5
Final All-Around Ratings
Obviously, the leader in the offensive ratings for first basemen had a dis-tinct advantage over his rivals in the race based on the fact that offense wascalculated at four times the defense. Big Dan Brouthers was the offensiveleader, but his sad performance in the defensive competition almost wiped
out his huge advantage over Dave Orr and Roger Connor. Still, he claimedthe crown as the era’s best all-around first baseman, followed by Connor, Orr,
Anson, and Beckley, in that order.
Final Offense Defense Total All-Around
Name × 4 × 1 Points Ratings
Dan Brouthers 7.724 0.000 7.724 1
Roger Connor 5.024 1.770 6.794 2
Dave Orr 5.600 1.084 6.684 3
Cap Anson 2.828 1.400 3.828 4
Jake Beckley 0.000 1.084 1.084 5
Second Base
Five players competed for the title of the nineteenth century’s greatest
all-around second baseman.
• John “Bid” McPhee was a threat both offensively and defensively during his 18-year career. The 5'8", 150-pound right-handed hitter compileda .272 batting average while averaging 13 triples, 65 bases on balls, 50
3. The Nineteenth-Century All-Stars 47

7/25/2019 McNeil - All-Stars for All Time
http://slidepdf.com/reader/full/mcneil-all-stars-for-all-time 59/247
stolen bases, 112 runs scored, and 71 RBIs per year. McPhee’s forté, how-ever, was defense, leading the league in fielding average eight times anddouble plays eleven times.
• Fred “Sure Shot” Dunlap earned his nickname for his hard, accuratethrows to first base. A 12-year major league veteran, he batted .292 with105 runs scored and 44 extra-base hits for every 550 at-bats. Dunlap, likeMcPhee, was considered to be a sensational defensive second baseman,once called “the greatest second baseman that ever lived” by Al Spink, thefounder of the Sporting News .
• Hardy Richardson was the best hitter of the second-base candidates, witha .299 career average, 49 extra-base hits a year, 109 runs scored, 80 RBIs,
and a .435 slugging average. He batted over .300 seven times in his 14- year career, with a high of .351 in 1886. He led the league with 189 basehits and 11 home runs that year, scored 125 runs, and contributed 27doubles and 11 triples to the Detroit Tigers’ offense.
• Fred Pfeffer was a .256 career hitter with little power, but he must havebeen an outstanding clutch hitter as he led all second-base candidates
with 86 runs batted in for every 550 at-bats. In the field, he led theleague in putouts eight times, assists four times, double plays six times,
and total chances per game seven times. Pfeffer still ranks first in totalchances per game (6.95), tenth in career putouts (4,714), and second inputouts per game (3.07).
• Thomas “Tido” Daly was recognized as a clutch hitter who was mostdangerous when there were runners in scoring position. Daly, a formercatcher, was converted to a second baseman in Brooklyn in 1893 to com-pensate for his weak throwing arm. He was an average defensive playerand earned his keep with his bat, hitting .278 over 16 years, with 40extra-base hits, 99 runs scored, 66 bases on balls, 78 RBIs, and 37 stolen
bases.
Offensive Ratings
Fred Dunlap’s career coincided with the most turbulent era in baseballhistory when the ancient game of base ball was gradually transformed intothe modern game of baseball. From 1880 to 1891, when Dunlap played, over-hand pitching became legal, four balls and three strikes were standardized,the distance from the pitching mound was lengthened from 45 feet to 55 feet,fielder’s gloves, catcher’s masks, and catcher’s chest protectors became stan-dard equipment, and stolen bases were defined and recorded. And within two
years, relief pitchers were allowed to enter the game at any time and thepitcher’s mound was established at its present distance of 60'6". Dunlap was
48 A LL-STARS FOR A LL TIME

7/25/2019 McNeil - All-Stars for All Time
http://slidepdf.com/reader/full/mcneil-all-stars-for-all-time 60/247
a standout during this hectic period and, as it turned out, he was the game’sbest hitting second baseman, out-hitting the average National Leaguer by 38points, the best performance by any second baseman. His OBP differential
(OBPD) was 45 points above the league average, again setting the standardfor second basemen. He was no slouch in the slugging department either,exceeding the National League average by 63 points, good enough for sec-ond place, behind Hardy Richardson.
Final OBPD NOBPD SLGD NSLGD Total Offensive
Name × 1 × 1 Points Ratings
Fred Dunlap +45 1.000 +63 0.862 1.862 1
Hardy Richardson +30 0.769 +75 1.000 1.769 2
Tido Daly +16 0.554 +11 0.221 0.775 3
Bid McPhee +17 0.569 +5 0.125 0.694 4
Fred Pfeffer !20 0.000 !5 0.000 0.000 5
Defensive Ratings
Bid McPhee and Fred Dunlap had a spirited competition for recogni-
tion as the greatest fielding second baseman of the nineteenth century, withMcPhee nosing out his adversary by 0.300 points. There were not many dif-ferences between the two men, but Dunlap’s range, although far above theleague average, was no better than fourth in this group, and it cost him thetitle. Hardy Richardson and Fred Pfeffer also showed to good advantage inthe competition, but Tido Daly was not in the same class with other mem-bers of the group.
Final
FAD NFAD RFD NRFD Total Defensive Name × 1 × 1 Points Ratings
Bid McPhee +25 1.000 +61 0.956 1.956 1
Fred Dunlap +22 0.906 +47 0.750 1.656 2
Hardy Richardson +10 0.531 +55 0.868 1.399 3
Fred Pfeffer +3 0.313 +64 1.000 1.313 4
Tido Daly !7 0.000 !4 0.000 0.000 5
Final All-Around RatingsSince second basemen were considered to be among the strongest defen-
sive players on the team, their offense was only given a two-to-one weightfactor over their defense. Under those conditions, and with strong showings
3. The Nineteenth-Century All-Stars 49

7/25/2019 McNeil - All-Stars for All Time
http://slidepdf.com/reader/full/mcneil-all-stars-for-all-time 61/247
on both offense and defense, Fred Dunlap and Hardy Richardson finishedone-two in the competition for baseball’s all-time nineteenth century secondbaseman, with Dunlap edging Richardson, 7.380 points to 6.829 points.
“Sure Shot” Fred held a slight advantage both offensively and defensively overhis adversary. In the final analysis, Dunlap was the top offensive second base-man of the nineteenth century and the greatest all-around second basemanof his era. Bid McPhee was identified as the greatest defensive second base-man of the nineteenth century.
Final Offense Defense Total All-Around × 2 × 1 Points Ratings
Fred Dunlap 3.724 1.656 5.380 1
Hardy Richardson 3.535 1.399 4.934 2
Bid McPhee 1.388 1.956 3.344 3
Tido Daly 1.615 0.000 1.615 4
Fred Pfeffer 0.000 1.333 1.333 5
Shortstop
Seven players competed for the title of the greatest shortstop of the nine-teenth century.
• William “Bad Bill” Dahlen, a twenty-year veteran of the National Leaguein the nineteenth century, was a defensive specialist who is sixth all-timein career games played (2,132), third in chances per game (6.26), andsecond in both putouts (4,850) and assists (7,500). He could also hit.
A .272 career batter with 40 extra-base hits and 75 RBIs a year, he hit
.359 in 1894 and .352 two years later.• Hughie “Ee-Yah” Jennings starred both offensively and defensively in the
major leagues for 18 years, compiling a .312 career batting average with 111
runs scored and 94 RBIs a season. Jennings would do anything to get onbase, even “taking one for the team,” an art he perfected with the Balti-more Orioles between 1894 and 1898 when he absorbed 202 hits to hisbody. He also led the league in fielding average four times.
• John Montgomery Ward began his career as a pitcher, going 164–103 oversix full years, then moved to shortstop when his pitching arm gave out.
Ward was a decent hitter, a good defensive player, and an exciting baserunner who stole 111 bases in 1887 and 88 in 1892. Over his career, hebatted .275 with 2,107 base hits, 1,410 runs scored, and 540 stolen bases(after stolen bases were documented, between 1886 and 1894).
50 A LL-STARS FOR A LL TIME
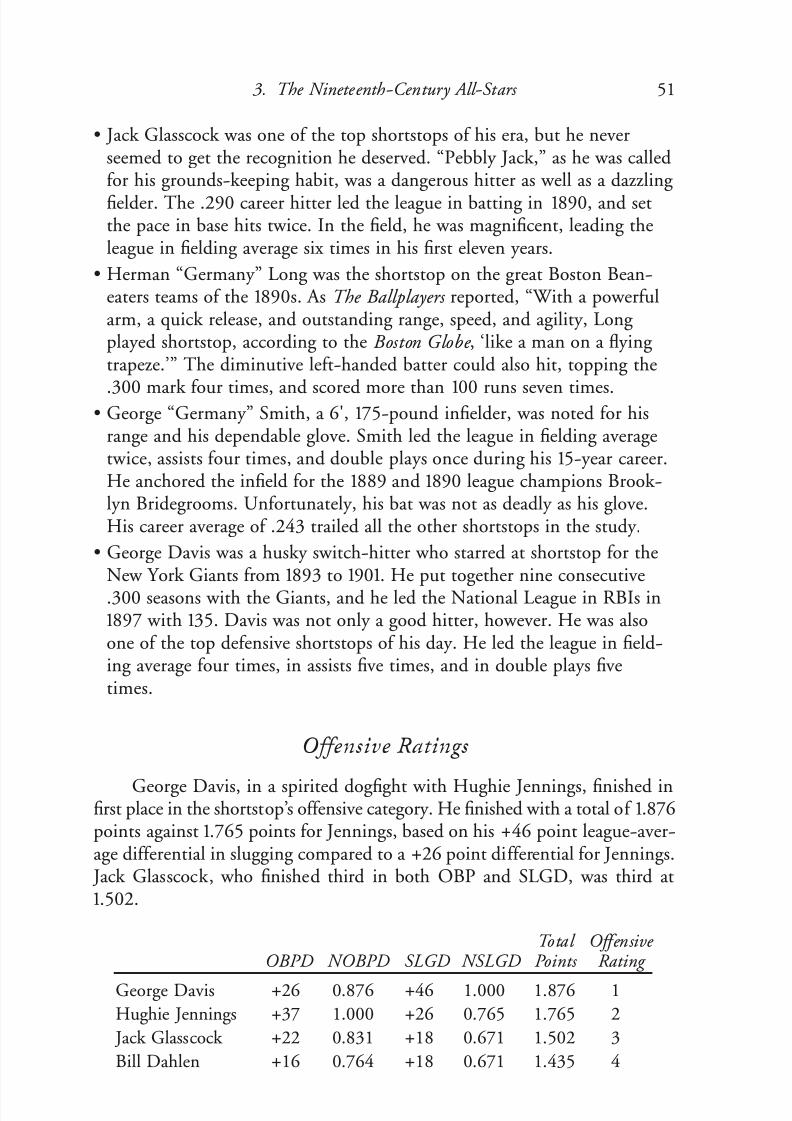
7/25/2019 McNeil - All-Stars for All Time
http://slidepdf.com/reader/full/mcneil-all-stars-for-all-time 62/247
• Jack Glasscock was one of the top shortstops of his era, but he neverseemed to get the recognition he deserved. “Pebbly Jack,” as he was calledfor his grounds-keeping habit, was a dangerous hitter as well as a dazzling
fielder. The .290 career hitter led the league in batting in 1890, and setthe pace in base hits twice. In the field, he was magnificent, leading theleague in fielding average six times in his first eleven years.
• Herman “Germany” Long was the shortstop on the great Boston Bean-eaters teams of the 1890s. As The Ballplayers reported, “With a powerfularm, a quick release, and outstanding range, speed, and agility, Long played shortstop, according to the Boston Globe , ‘like a man on a flying trapeze.’” The diminutive left-handed batter could also hit, topping the
.300 mark four times, and scored more than 100 runs seven times.• George “Germany” Smith, a 6', 175-pound infielder, was noted for his
range and his dependable glove. Smith led the league in fielding averagetwice, assists four times, and double plays once during his 15-year career.He anchored the infield for the 1889 and 1890 league champions Brook-lyn Bridegrooms. Unfortunately, his bat was not as deadly as his glove.His career average of .243 trailed all the other shortstops in the study.
• George Davis was a husky switch-hitter who starred at shortstop for theNew York Giants from 1893 to 1901. He put together nine consecutive.300 seasons with the Giants, and he led the National League in RBIs in1897 with 135. Davis was not only a good hitter, however. He was alsoone of the top defensive shortstops of his day. He led the league in field-ing average four times, in assists five times, and in double plays fivetimes.
Offensive Ratings
George Davis, in a spirited dogfight with Hughie Jennings, finished infirst place in the shortstop’s offensive category. He finished with a total of 1.876points against 1.765 points for Jennings, based on his +46 point league-aver-age differential in slugging compared to a +26 point differential for Jennings.
Jack Glasscock, who finished third in both OBP and SLGD, was third at1.502.
Total Offensive OBPD NOBPD SLGD NSLGD Points Rating
George Davis +26 0.876 +46 1.000 1.876 1
Hughie Jennings +37 1.000 +26 0.765 1.765 2
Jack Glasscock +22 0.831 +18 0.671 1.502 3
Bill Dahlen +16 0.764 +18 0.671 1.435 4
3. The Nineteenth-Century All-Stars 51

7/25/2019 McNeil - All-Stars for All Time
http://slidepdf.com/reader/full/mcneil-all-stars-for-all-time 63/247
Herman Long !11 0.348 !21 0.435 0.783 5
J.M. Ward !5 0.528 !20 0.224 0.752 6
Germany Smith !31 0.000 !52 0.000 0.000 7
Defensive Ratings
George Davis fell out of contention as a result of his poor showing inthe defensive categories, but Jack Glasscock continued his war with Hughie
Jennings, finishing first in NFAD and second in NRFD. Jennings, however,
built a big lead in NRFD, which provided him with enough of a point spreadto crown him the game’s greatest nineteenth century defensive shortstop.
Final Total Defensive
FAD NFAD RFD NRFD Points Ratings
Hughie Jennings +21 0.720 +68 1.000 1.720 1
Jack Glasscock +28 1.000 +36 0.347 1.347 2
George Davis +17 0.560 +35 0.327 0.887 3
Bill Dahlen +11 0.320 +36 0.327 0.647 5Germany Smith +15 0.480 +24 0.102 0.582 6
Herman Long +3 0.000 +32 0.265 0.265 7
Final All-Around Ratings
A shortstop’s defensive play was regarded as the most critical componentin a team’s defensive strategy. Therefore, many teams carried a shortstop witha dependable glove but a weak bat. The reverse has never been true. This study,recognizing that school of thought, measured a shortstop’s offense and defense
with equal weight. Hughie Jennings, however, demonstrated such a well-balanced game that he would have been declared the nineteenth century’sgreatest all-around shortstop whether the offense was rated at one-to-one,two-to-one, or four-to-one over defense. He led all shortstops in on-basepercentage and slugging average, and he also showed the way in range factor
while finishing second in fielding average.
Final Offense Defense Total All-Around
× 1 × 1 Points Ratings
Hughie Jennings 1.765 1.720 3.485 1
Jack Glasscock 1.502 1.347 2.849 2
52 A LL-STARS FOR A LL TIME
Total Offensive OBPD NOBPD SLGD NSLGD Points Rating

7/25/2019 McNeil - All-Stars for All Time
http://slidepdf.com/reader/full/mcneil-all-stars-for-all-time 64/247
George Davis 1.876 0.887 2.763 3
Bill Dahlen 1.435 0.647 2.082 4
Herman Long 0.783 0.265 1.048 5
J. M. Ward 0.752 0.080 0.832 6
Germany Smith 0.000 0.582 0.582 7
Third Base
Six third basemen competed for the title of the nineteenth century’s fore-most all-around protector of the hot corner.
• John McGraw was a feisty offensive sparkplug for thegreat Baltimore Orioleballclubs of the 1890s. He
was a career .334 hitter
who batted over .300 nineconsecutive years. The5'7", 155-pound New
Yorker, known as “Mugsy,” was always ready to fight when the situation war-ranted it—and sometimes
when the situation did not warrant it . His 0.93 runs
scored per game is one of the highest percentages inbaseball history.
• Billy Nash starred for theBoston Beaneaters foreleven years, from 1885 to1895, as one of the key elements in their tightinner defense. He led theNational League in field-ing average four times, inassists twice, and in dou-ble plays three times. The
3. The Nineteenth-Century All-Stars 53
Final Offense Defense Total All-Around
× 1 × 1 Points Ratings
John McGraw was a member of the famed Balti-more Orioles of the 1890s. He’s shown here in1890 as a member of the Olean, New York, club.

7/25/2019 McNeil - All-Stars for All Time
http://slidepdf.com/reader/full/mcneil-all-stars-for-all-time 65/247
career .275 hitter was also a decent offensive force, carrying 101 runs acrossthe plate for every 154 games played while driving in 92 teammates.
• Denny Lyons, a stocky 5'10", 185-pound infielder, was an offensive threatas opposed to a defensive threat. He was a career .310 hitter with a .407OBP and a .442 slugging average. He batted over .300 seven times in hiscareer with an average of .367 in 1887 and .354 in 1890. His defense was
just adequate, but he did lead the league in double plays twice and set themajor league record for putouts in a single season with 255.
• Billy Shindle was a slender 5'8", 155-pound right-handed hitter whoexcelled both on offense and defense. Although his career batting average
was just .269, he was still an offensive threat , averaging 94 runs scored
and 72 RBIs during his 13-year career. On defense, he led the league infielding average once, in assists three times and in double plays twice.
• Arlie Latham was a happy-go-lucky third baseman for the St. LouisBrowns when they captured four consecutive American Association pen-nants in the 1880s. The .269 career hitter’s contributions to the Browns’success included a league-leading 152 runs scored in 1886, a league-lead-ing 109 stolen bases in 1888, and two .300+ batting seasons. He led theleague’s third basemen in both assists and double plays twice.
• Lave Cross played major league baseball for 21
years, compiling 2,651
base hits to become the only nineteenth century third baseman with morethan 2,000 base hits. The Milwaukee native batted .292 during his career
while averaging 81 runs scored a season. He was also an outstanding defensive third baseman, leading the league in fielding average five times,assists four times, and double plays twice. He ranks fourteenth in careerassists with 3,715.
Offensive Ratings
John McGraw and Denny Lyons were the most dangerous offensive thirdbasemen of the nineteenth century. McGraw had a .466 OBP to Lyons’ .407,but Lyons had more pop in his bat as evidenced by his 47 extra-base hits com-pared to Mugsy’s 29. Lyons drove in 97 runners a year, McGraw just 65. AndLyons’ huge slugging average differential put him over the top. No other thirdbaseman was close to the top two. Lave Cross had a decent .292 batting aver-age but, like McGraw, had little power.
Final Total Offensive
OBPD NOBPD SLGD NSLGD Points Ratings
Denny Lyons +62 0.652 +75 1.000 1.652 1
John McGraw +108 1.000 +21 0.476 1.476 2
54 A LL-STARS FOR A LL TIME

7/25/2019 McNeil - All-Stars for All Time
http://slidepdf.com/reader/full/mcneil-all-stars-for-all-time 66/247
Billy Nash +18 0.318 !
4 0.233 0.551 3
Lave Cross !13 0.083 +12 0.388 0.471 4
Arlie Latham !3 0.159 !28 0.000 0.159 5
Billy Shindle !24 0.000 !18 0.097 0.097 6
Defensive Ratings
Lave Cross’ five season fielding average titles were no mirage. His career
fielding average differential of +36 topped his closest competitor, Billy Nash,by 16 points. Nash had a better range factor than Cross, but his advantage
was not enough to overtake Cross in the final rating. Denny Lyons, the offen-sive titlist, finished fifth in defense, and John McGraw brought up the rear.
Final Total Defensive
FAD NFAD RFD NRFD Points Ratings
Lave Cross +36 1.000 +13 0.811 1.811 1
Billy Nash +20 0.484 +22 0.981 1.465 2Billy Shindle +12 0.226 +23 1.000 1.226 3
Arlie Latham +5 0.000 +13 0.811 0.811 4
Denny Lyons +11 0.194 +1 0.585 0.779 5
John McGraw +6 0.032 !30 0.000 0.032 6
Final All-Around Ratings
Since third base was considered to be one of the more important defen-sive positions on a ballclub, the offense-to-defense ratio was set at two-to-one. The offense was the all-determining factor in this race, with the offensiveleaders finishing in the same order in the final overall ratings. In fact, even if the offense-to-defense had been rated at one-to-one, Denny Lyons would stillhave been awarded the title as the nineteenth century’s greatest all-aroundthird baseman. The only difference in the final ratings would have been LaveCross nosing out John McGraw for second place.
Final Offense Defense Total All-Around × 2 × 1 Points Ratings
Denny Lyons 3.304 0.779 4.083 1
John McGraw 2.952 0.032 2.984 2
3. The Nineteenth-Century All-Stars 55
Final Total Offensive
OBPD NOBPD SLGD NSLGD Points Ratings

7/25/2019 McNeil - All-Stars for All Time
http://slidepdf.com/reader/full/mcneil-all-stars-for-all-time 67/247
Lave Cross 0.942 1.811 2.753 3
Billy Nash 1.102 1.465 2.567 4
Billy Shindle 0.194 1.226 1.420 5
Arie Latham 0.318 0.811 1.129 6
Right Field and Left Field
The right field and left field positions were considered to be primarily offensive positions. Therefore, the offense-to-defense ratio was set at four-to-one for those positions. A total of eleven players competed for the title asthe nineteenth century’s greatest all-around right or left fielder.
• Ed Delahanty had the fourth-highest career batting average in majorleague history, a sizzling .346. He led the league in doubles five times,triples once, home runs twice, RBIs three times, batting average twice,on-base percentage twice, slugging average five times, and stolen basesfour times. He collected 2,597 base hits, with 1,600 runs scored and1,466 RBIs, in 16 years. He won two batting titles, with a high of .410 in1899.
• Harry Stovey could hit, hit with power, run, field, and throw. Playing when the plate was only 50 to 55 feet from the mound, Stovey batted.289 while averaging 31 doubles, 16 triples, and 11 home runs for every 550 at-bats. He also was one of the top base stealers of his time, leading the league with 68 stolen bases in 1886 and 97 stolen bases four yearslater. His 1.00 runs per game scoring average is number three all-time.
• Hugh Duffy, a .326 lifetime batter, has the highest single-season batting average in baseball history, hitting .440 in 1894. The diminutive right-handed hitter became the game’s first Triple Crown winner that year,smashing 18 home runs and driving in 145 teammates. He also led theleague in base hits (237) and doubles (51). The native of Cranston,Rhode Island, was one of the top defensive outfielders of his era as well.
• Samuel “Big Sam” Thompson was one of the top sluggers of the nine-teenth century, pounding the ball at a .341 clip over 15 years, with 31
doubles, 15 triples, 12 home runs, and 119 runs batted in a year. His .505career slugging average is the second-highest in the nineteenth century.He was also one of the league’s best fly-chasers, with a steel trap for a glove and rifle for a throwing arm. He led the league in fielding averageand assists twice.
56 A LL-STARS FOR A LL TIME
Final Offense Defense Total All-Around × 2 × 1 Points Ratings

7/25/2019 McNeil - All-Stars for All Time
http://slidepdf.com/reader/full/mcneil-all-stars-for-all-time 68/247
• Pete Browning was strictly an offensive outfielder who batted a torrid .341over a 13-year career, number twelve all-time and number four in thenineteenth century. He led the league in batting average three times dur-
ing his career with a high of .378 in 1882. He also had a .403 OBP and a .467 slugging percentage during his career. On the other hand, he was a defensive liability who was nicknamed “the Gladiator” for his fierce bat-tles with fly balls.
• James “Orator Jim” O’Rourke enjoyed a 23-year major league career,from 1872 to 1894, and he made the most of it, batting .310 with 2,304base hits. The man who was credited with the first base hit in NationalLeague history in 1876 batted over .300 thirteen times with a high of
.362 in 1877. The loquacious Irishman retired at the age of 43 but cameback for one more game when he was 54 years old.
• Mike Tiernan was a .311 career batter for the New York Giants from 1887to 1899. His .463 slugging average is the fourth-best of the sixteenoutfielders in this study. He played on two world championship teams
with the Giants, in 1888 and 1889, leading the league in runs scored with147 in 122 games in 1888. Two years later, he led the National League
with 13 home runs and a .495 slugging average.
• Thomas “Oyster” Burns starred for the league champion Brooklyn Bride-grooms in 1889 and 1890, leading the National League with 13 homersand 128 RBIs in 1890. He was a lifetime .300 hitter who averaged 103runs scored and 99 runs batted in during his eleven-year major leaguecareer. The stocky Burns was a decent defensive outfielder with a reliableglove, but his lack of speed was a liability.
• Jesse “the Crab” Burkett tattooed opposing pitchers to the tune of .338during his 16-year career. He was not a slugger of note, but he battedover .400 twice with a high of .410 in 1896, and he captured three bat-
ting titles and led the league in base hits three times and runs scoredtwice. Burkett’s outstanding .415 on-base percentage contributed to his112 runs scored for every 550 at-bats.
• Billy Hamilton, a .344 career hitter, had an exceptional batting eye thatproduced an average of 104 bases on balls for every 550 at-bats and that,along with his 189 base hits, contributed to his 1.06 runs scored per gameaverage, the highest such average in the annals of the game. Hamilton’sskill at reaching base combined with his blazing speed earned him fivestolen-base crowns en route to a career total of 914 stolen bases.
• Willie “Wee Willie” Keeler, a tiny 5'4", 140-pound left-handed hitter who advised other players to “hit ’em where they ain’t,” was essentially a singles hitter, but he hit enough of them to produce a .341 career batting average with 110 runs scored a year. Keeler’s .424 batting average in 1897
3. The Nineteenth-Century All-Stars 57

7/25/2019 McNeil - All-Stars for All Time
http://slidepdf.com/reader/full/mcneil-all-stars-for-all-time 69/247
is the fifth-highest average inmajor league history. The littleman led the league in fielding
average twice and assists once.
Offensive Ratings
Billy Hamilton’s .455 OBP was forty points higher than JesseBurkett’s and 44 points higher thanEd Delahanty’s; he easily won the
OBPD race, finishing1
00 pointsabove the league average. Dela-hanty, who had a .411 OBP com-pared to .403 for Pete Browning,lost his spot to Browning when theadjusted OBPs were determined,
with Burkett slipping into thirdplace. Sam Thompson easily wonthe normalized adjusted slugging
average category. He was tied withDelahanty for the official slugging average, but when the era adjustments weremade, Thompson nosed out Delahanty, +129 to +125. Overall, Pete Brown-ing captured first place in the offensive rating with 2.767 points to 2.391 forDelahanty. Hamilton finished fourth behind Orator Jim O’Rourke, withThompson nailing down the fifth spot.
Defensive Ratings
Ed Delahanty finished first in the defensive ratings with 1.513 total points.The fleet-footed outfielder covered acres of ground in left field andhe kept base runners honest with a powerful throwing arm. His 243 careerassists place him ninth all-time in assists per game. Hugh Duffy came in sec-ond with 1.255 points and Billy Hamilton was third with 1.076 points.
Final All-Around Ratings
The offensive leader obviously had a huge advantage in the final all-around ratings since the offense was weighted at four times the defense. And,holding true to form, Pete Browning was crowned as the best all-aroundright-left fielder of the nineteenth century, although Ed Delahanty made a close race of it thanks to his outstanding performance in the defensive rat-
58 A LL-STARS FOR A LL TIME
Willie Keeler of “Hit ’em where they ain’t”fame batted .341 during his 19-year majorleague career.

7/25/2019 McNeil - All-Stars for All Time
http://slidepdf.com/reader/full/mcneil-all-stars-for-all-time 70/247
ings, where he beat Browning by 0.835 points. If the offense-to-defense hadbeen rated at two-to-one instead of four-to-one, Ed Delahanty would havefinished first.
Final Offense Defense Total All-Around × 4 × 1 Points Ratings
Pete Browning 7.068 0.678 7.746 1
Ed Delahanty 6.172 1.513 7.685 2
Billy Hamilton 5.448 1.076 6.524 3
Sam Thompson 5.376 0.999 6.375 4
Harry Stovey 4.636 0.900 5.536 5
Jesse Burkett 4.896 0.510 5.406 6
Mike Tiernan 4.396 0.439 4.835 7
Jim O’Rourke 3.592 0.838 4.430 8
Oyster Burns 3.728 0.579 4.307 9
Willie Keeler 3.120 0.769 3.889 10
Hugh Duffy 2.408 1.255 3.663 11
Center FieldThe center-field position, along with the catcher, second baseman, and
shortstop, was considered to be one of the keys to a team’s defense. The oldadage, “To win a pennant, a team has to be strong up the middle,” was as truein the nineteenth century as it was in the twentieth century. There were fiveplayers competing for the title of the nineteenth century’s greatest all-aroundcenter fielder. Their offense was weighted at three-to-one over their defense.
• Mike Griffin was an outstanding center fielder for the Brooklyn Dodgersduring the 1890s, leading the league in fielding average five times andassists twice. He also led the league with 152 runs scored in 137 gamesin 1889, and with 36 doubles in 1892. Griffin batted .296 over 12 years,averaging 29 doubles, 10 triples, and four home runs for every 550 at-bats.
• Paul Hines was a 16-year major leaguer who was one of the best all-around center fielders of his era. The husky right-handed hitter, whocompiled a career batting average of .301, was an offensive threat who ledthe league in doubles three times, home runs once, RBIs once, and slug-
ging average once. He also showed the way in fielding average twice andassists once.
• George Gore, another career .301 hitter, batted over .300 eight times infourteen years, with a high of .360 in 1890 when he won the batting title.
3. The Nineteenth-Century All-Stars 59

7/25/2019 McNeil - All-Stars for All Time
http://slidepdf.com/reader/full/mcneil-all-stars-for-all-time 71/247
He also led the league in on-base percentage (.399) and slugging average(.463) that year. Gore, who scored over 100 runs seven times, is numbertwo all-time in runs scored per game with 1.01. He averaged 136 runs
scored a year, thanks to punching out 166 base hits and drawing 74 baseson balls.
• Steve Brodie was an important cog in the Baltimore Orioles’ three con-secutive National League pennants from 1894 to 1896. The 5'11", 180-pound left-handed hitter played all 392 games during that span, batting .338 with 71 doubles, 32 triples, and 317 runs scored. During his 12-yearmajor league career, Brodie led the league’s outfielders in fielding averagethree times and assists twice.
• George Van Haltren was a southpaw pitcher during his first three years inthe major leagues, going 39–31, but was converted to a strong-armedoutfielder who became the pride of New York during the 1890s. Van Hal-tren put together a .316 career batting average with 112 runs scored, 20doubles, 11 triples, and five home runs for every 550 at-bats.
Offensive Ratings
There was not much to choose from as far as the offensive statistics of
the five center-field candidates were concerned. George Gore nosed out PaulHines for the number one spot based on his on-base percentage. Both menhad a career .301 batting average, but Gore, thanks to his 74 bases on balls a
year, built a .386 on-base percentage, while Hines, who drew only 32 walksa year, had to settle for a .343 OBP. In addition, Gore enjoyed a +70 pointera adjustment while Hines had to be content with a +40 point adjustment.Hines out-pointed Gore in SLGD, but it was not enough to offset the hugelead Gore had built in OBPD.
Defensive Ratings
Mike Griffin was a sensational all-around outfielder, and he dominatedboth the fielding average category and the range factor category, compiling a perfect 2.000 point total. His closest rival was Steve Brodie, who finished sec-ond in both categories with a 1.689 point total. Paul Hines was a close thirdin both categories and third overall. George Gore, who had set the pace onoffense, came in a miserable fourth for defense.
Final All-Around Ratings
Mike Griffin, who finished a distant third in the offensive ratings, sweptthe defensive ratings to capture the title as the greatest all-around nineteenth
60 A LL-STARS FOR A LL TIME

7/25/2019 McNeil - All-Stars for All Time
http://slidepdf.com/reader/full/mcneil-all-stars-for-all-time 72/247
century center fielder, based on a three-to-one offense to defense rating sys-tem. His 3.941 point total edged George Gore by a mere 0.008 points. PaulHines was third with 3.818 points.
Final Offense Defense Total All-Around × 3 × 1 Points Ratings
Mike Griffin 1.941 2.000 3.941 1
George Gore 3.132 0.801 3.933 2
Paul Hines 2.406 1.412 3.818 3
George Van Haltren 1.767 0.625 2.392 4
Steve Brodie 0.000 1.689 1.689 5
M AJOR L EAGUE B ASEBALL ’SNINETEENTH C ENTURY A LL -STAR T EAM
First Team Second Team
Catcher Buck Ewing Jack Clements
Pitcher Bob Caruthers Kid Nichols
First Base Dan Brouthers Roger ConnorSecond Base Fred Dunlap Hardy Richardson
Shortstop Hughie Jennings Jack Glasscock
Third Base Denny Lyons John McGraw
Right-Left Field Pete Browning Billy HamiltonEd Delahanty Sam Thompson
Center Field Mike Griffin George Gore
3. The Nineteenth-Century All-Stars 61

7/25/2019 McNeil - All-Stars for All Time
http://slidepdf.com/reader/full/mcneil-all-stars-for-all-time 73/247
C HAPTER 4
Baseball’s Greatest Catchers
There were a total of twenty catchers competing for the title of base-ball’s greatest all-around catcher.
• Gene Tenace was one of the game’s most underrated catchers. He was a solidly built six-footer weighing 190 pounds. A right-handed hitter,Tenace hit with power and had an excellent on-base-percentage. He isoften overlooked because his batting average was a mediocre .241, and hestruck out 125 times for every 550 at-bats. In his support, he walked 123times a year, giving him an excellent .388 on-base percentage (OBP) that
was significantly higher than the league average. And his power, whichproduced 25 home runs and 84 RBIs a year, gave him a .429 slugging average that was considerably higher than most other catchers. Ondefense, Tenace had a better-than-average fielding average and caught-stealing percentage. Unfortunately, shoulder problems curtailed hiscatching career after 892 games, sending him to first base, where hisbad shoulder would not affect his game and where he could still helpthe team with his big bat.
Gene Tenace was a member of the 1972–74 world championship Oak-
land Athletics and, in 1972, he was voted the World Series’ Most ValuablePlayer after smashing four home runs in seven games, driving in nine of the 16 runs the A’s scored in the Series, and batting .348.
• Mickey Cochrane was a member of Connie Mack’s powerful Philadelphia Athletics, American League champions of 1929–31. The feisty backstop who won two world titles with the A’s also won two American Leaguepennants and one world championship with the 1934–35 Detroit Tigers.Cochrane was a tough field general who hated to lose and did whatever ittook to leave the field victorious. Over the course of his 13-year major
league career, “Black Mike,” as he was called, compiled a .320 batting average, the highest career batting average for any major league catcher.
62

7/25/2019 McNeil - All-Stars for All Time
http://slidepdf.com/reader/full/mcneil-all-stars-for-all-time 74/247
He also had the highest on-base percentage and one of the game’s betterslugging averages. On defense, he was the field general, positioning play-ers, running the game from behind the plate, and keeping his pitchers
focused on the job at hand. His only defensive weakness was a poorthrowing arm that left him below the league average in caught-stealing percentage. However, he did lead the league a total of twelve times in thefour major defensive categories, fielding average, putouts, assists, anddouble plays.
• Gabby Hartnett learned the art of catching from his father, a formersemi-pro catcher and a tough taskmaster. Hartnett, who caught hisfather’s pitches in the back yard every evening after his father got home
from work, was an excellent defensive catcher before the age of fifteen,and he possessed what may be the strongest throwing arm in majorleague history. During Hartnett’s 19-year career with the Chicago Cubs,fans used to go out to the park several hours before game-time just to
watch him rifle the ball around the infield. The big catcher had no weak-nesses. On offense, he hit for average (.297 career), hit with power (20homers and 101 RBIs for every 550 at-bats), and he could also advancebase runners with well-placed sacrifice bunts if the situation warranted it.
And, thanks to his father, Gabby’s defense was flawless, even to protect-
ing against passed balls and wild pitches. He was taught to shift his feetand get his body in front of any balls that were wide of the plate ratherthan trying to backhand balls like Johnny Bench and most of today’scatchers do. In addition to his other skills, Hartnett was a fearless gunner
who would throw to any base at any time and, as a result , he had one of the highest pickoff averages of all the world-class catchers. During hiscareer he led the league in a combined total of twenty-two of the fourmajor defensive categories. And if a catcher’s caught-stealing rating wasavailable as an official statistic, he would have added another ten or more
stars to his crown. He is number four all-time in career double plays with163.
• Bill Dickey was considered by some baseball experts to be the heart andsoul of the great New York Yankee teams of the 1930s. He was an out-standing field leader and a great handler of pitchers as well as a durablecatcher who established a major league record for catching 100 or moregames in 13 straight seasons. In addition to his defensive strengths, he wasalso a force to be reckoned with on offense, compiling a .313 career bat-
ting average, second only to Mickey Cochrane among catchers. He wasconsidered by many opposing players to be the toughest clutch hitter onthe Yankee squad, even though he played with such legends as LouGehrig, Babe Ruth, and Joe DiMaggio. During his 17-year major leaguecareer, Dickey played on eight American League pennant winners and
4. Baseball’s Greatest Catchers 63

7/25/2019 McNeil - All-Stars for All Time
http://slidepdf.com/reader/full/mcneil-all-stars-for-all-time 75/247
seven world championship teams. Dickey led the league in a total of fourteen times in the major defensive categories.
• Roy Campanella was the epitome of the baseball catcher. He was a solidoffensive presence who was a .300 hitter when he was healthy. He hadgood plate discipline, seldom struck out, and was capable of coaxing a base on balls. He could also hit for power or sacrifice a runner along witha bunt when needed. But as good as he was on offense, he prided himself on his defensive capabilities. He turned professional at the age of 15, play-ing with the Baltimore Elites in the Negro leagues. He learned the art of catching under Biz Mackey, arguably the greatest all-around catcher inNegro league history. Campanella’s stocky physique gave the mistaken
impression that he was a slow runner, but nothing could be further fromthe truth. A former high school track star, he was fast on his feet, oftenbeating the runner to first base while backing up throws on ground ballsto the infield. He also had extremely quick reflexes, whether pouncing ona ball in front of the plate or digging potential wild pitches out of thedirt, so quick, in fact, that New York writers dubbed him “the Cat.” Hisgreatest strength was his powerful throwing arm. His arm might not havebeen as strong as Gabby Hartnett’s, but he more than made up for it inaccuracy, finishing his career with the highest career caught-stealing per-
centage in major league history. Over his brief career, he led the leagueeleven times in the four major defensive categories and, if a catcher’scaught-stealing record was available, he would have added another six ormore awards to his total.
• Joe Torre enjoyed an 18-year major league career, playing 2,209 games,including 903 games behind the plate. He also played first base and thirdbase. Torre’s biggest problem was that he was versatile and cooperative.He was the first-string catcher for the Milwaukee and Atlanta Braves dur-ing his first nine years in the National League, and he was a two-time
Gold Glove catcher. After he was traded to the St. Louis Cardinals, heplayed wherever he was needed. When Ted Simmons arrived in St. Louis,Torre moved to third base to make room, and after Ken Reitz arrived,Torre moved across the diamond to first base. But wherever Torre played,he did a superb job defensively, and he always had that big bat to keephim happy. Over his career, he batted .297, with 24 doubles, four triples,18 home runs, and 83 RBIs for every 550 at-bats. In 1971, he was votedthe Most Valuable Player in the National League while leading the leaguein four categories: batting with a .363 average; base hits with 230; totalbases with 352; and runs batted in with 137.
• Darrell Porter was a hard-hitting backstop in the mold of Gene Tenace,except that he batted left-handed. He had a mediocre .247 batting aver-age, but he averaged 91 bases on balls a year to go along with 24 doubles,
64 A LL-STARS FOR A LL TIME

7/25/2019 McNeil - All-Stars for All Time
http://slidepdf.com/reader/full/mcneil-all-stars-for-all-time 76/247
five triples, 19 home runs, and 83 RBIs, giving him a fine .354 on-basepercentage and a .409 slugging average. His best year at the plate was1979 when he hit a career-high .291 with 23 doubles, 10 triples, 20 homeruns, 101 runs scored, and 112 RBIs. His league-leading 121 bases on ballsgave him an outstanding .421 on-base percentage and a .484 slugging average. On defense, the 6', 193-pound Porter was considered to be a
4. Baseball’s Greatest Catchers 65
Gabby Hartnett, 1938.

7/25/2019 McNeil - All-Stars for All Time
http://slidepdf.com/reader/full/mcneil-all-stars-for-all-time 77/247
good handler of pitchers and an above-average defensive catcher with a strong throwing arm.
• Ernie Lombardi was one of the top offensive catchers in major league his-tory, and one of only five catchers with a career batting average over .300.His .306 average ranks fourth behind Mickey Cochrane, Bill Dickey, andBabe Phelps, who hit .310. Called the “Schnozz” because of his largenose, the affable giant who stood 6'3" and weighed 230 pounds wasnoted for his powerful line drives that frequently ricocheted off outfieldfences around the National League. He had extra-base power similar toTorre and Porter, while averaging 93 RBIs a season. He was also notedfor his lack of speed, often leading the league in grounding into double
plays. His slowness afoot was so obvious that infielders played back onthe grass, challenging him to beat out an infield hit, something he seldomdid. But, in spite of his lack of speed, the right-handed slugger won twobatting titles, hitting .342 in 1938 and .330 four years later, the only catcher to achieve that honor. Lombardi called a good game and was a good handler of pitchers, but in all other aspects of the game he was anaverage defensive catcher.
• Johnny Bench was one of the best catchers of the 1960s to 1980s, along with Carlton Fisk, Gary Carter, Jim Sundberg, and Bill Freehan. The
fact that Bench is invariably rated as the greatest catcher in baseball his-tory by modern observers can be traced to two things. First, he was oneof the more visible players on the Big Red Machine championship teamsof the 1970s, and one of the game’s first television celebrities. Second, he
was the game’s biggest self-promoter. Oftentimes, when he was quoted orinterviewed, he began the discussion by saying, “Whenever people talk about great catchers, they begin with me.” He was also quoted as saying,“I can throw out any man alive.” Johnny Bench had many admirablequalities but modesty was not one of them. He was, however, one of the
catching profession’s greatest power hitters and one of its best defensiveplayers. He is seventh all-time in career putouts with 9,260. During his17-year career, Bench led the league just five times in the four majordefensive categories, the fourteenth-best out of the twenty catchers in thestudy. He led the league in putouts twice, and in fielding average, assists,and double plays once each.
• Yogi Berra’s metamorphosis from an ugly duckling backstop to one of baseball’s greatest defensive catchers under the tutelage of New York Yan-
kee legend Bill Dickey was almost miraculous. The stocky youngster fromSt. Louis could always hit, but when he was promoted to the New York Yankees he was a mediocre outfielder. Manager Casey Stengel, desperately trying to find a position Berra could handle so he could keep his bat inthe lineup, eventually converted him to a catcher, a move that looked for
66 A LL-STARS FOR A LL TIME

7/25/2019 McNeil - All-Stars for All Time
http://slidepdf.com/reader/full/mcneil-all-stars-for-all-time 78/247
awhile like a monumental blunder. Berra looked lost behind the plate. Inthe 1947 World Series, the Brooklyn Dodgers, with Jackie Robinson, Pee
Wee Reese, and company, ran the bases with abandon, stealing seven
bases in less than four games and forcing the Yankee manager to benchhis protégé in Game Five. Stengel then brought Bill Dickey on board inspring training to teach the 22-year-old backstop the rudiments of thecatching position. At the time, Dickey said he thought that Berra couldbe a good (not great, but good) catcher. Yogi proved him wrong. With anold-time work ethic, lightning-fast reflexes, and a strong throwing arm,Berra soon became one of the greatest defensive catchers in the annals of the sport. He went on to lead the American League in double plays six times while throwing out 49 percent of runners who attempted to stealon him. He was outstanding at calling a game, handling a pitching staff,and blocking balls in the dirt, and he pounced on a bunt as Casey Stengelliked to say, “like it was a dollar bill.” Berra is number ten in careerputouts with 8,729, and number three in career double plays with 175.He led the league in a total of nineteen of the four major defensive cate-gories, including eight times in putouts and six times in double plays.
• Jim Sundberg was a great defensive catcher who led the American Leaguein fielding percentage, putouts, and assists six times each and in double
plays five times, the best defensive record of any catcher in this study. His.993 career fielding average is tied for the highest norm in baseball his-tory, and his 9,414 career putouts rank fifth. He had a powerful throwing arm that discouraged base runners from attempting to steal against him,and he had the quick reflexes required to run down pop fouls or fieldbunts. And he was durable, catching 140 or more games in six consecutiveseasons, and more than 130 games ten times. Sundberg’s weakness was hisoffense. He carried a career batting average of just .248 with only 34extra-base hits for every 550 at-bats.
• Gary Carter was a 6'2", 215-pound firebrand who starred in the majorleagues for 19 years, primarily with the Montreal Expos and New York Mets. The California native could do it all, on defense and offense. Heled the National League in fielding percentage twice, in most chances six times, and putouts, assists and double plays five times, a defensive recordexceeded by only two other catchers—Jim Sundberg and Gabby Hart-nett. He is number one in career putouts with 10,360, number three ingames caught with 2,056, and number eight in double plays with 149. He
was an expert in blocking balls in the dirt and preventing wild pitches by his pitchers. He once set a record with just one passed ball in 150 games.But unlike many of his peers, Carter could more than hold his own witha bat in his hands. His career total of 324 home runs has been exceededby only four other catchers. He hit 20 or more home runs nine times
4. Baseball’s Greatest Catchers 67

7/25/2019 McNeil - All-Stars for All Time
http://slidepdf.com/reader/full/mcneil-all-stars-for-all-time 79/247
with a high of 32 homers in1
985, and he drove in more than1
00 runsfour times with a high of a league-leading 106 RBIs in 1984. Carter is oneof the few catchers to accumulate more than 2,000 base hits in his career.In the 1986 World Series with the New York Mets, Carter batted .276
with two home runs and a Series-high nine RBIs in seven games.
Jim Sundberg was one of the best defensive catchers ever to don the “tools of igno-rance” (courtesy of the Texas Rangers).
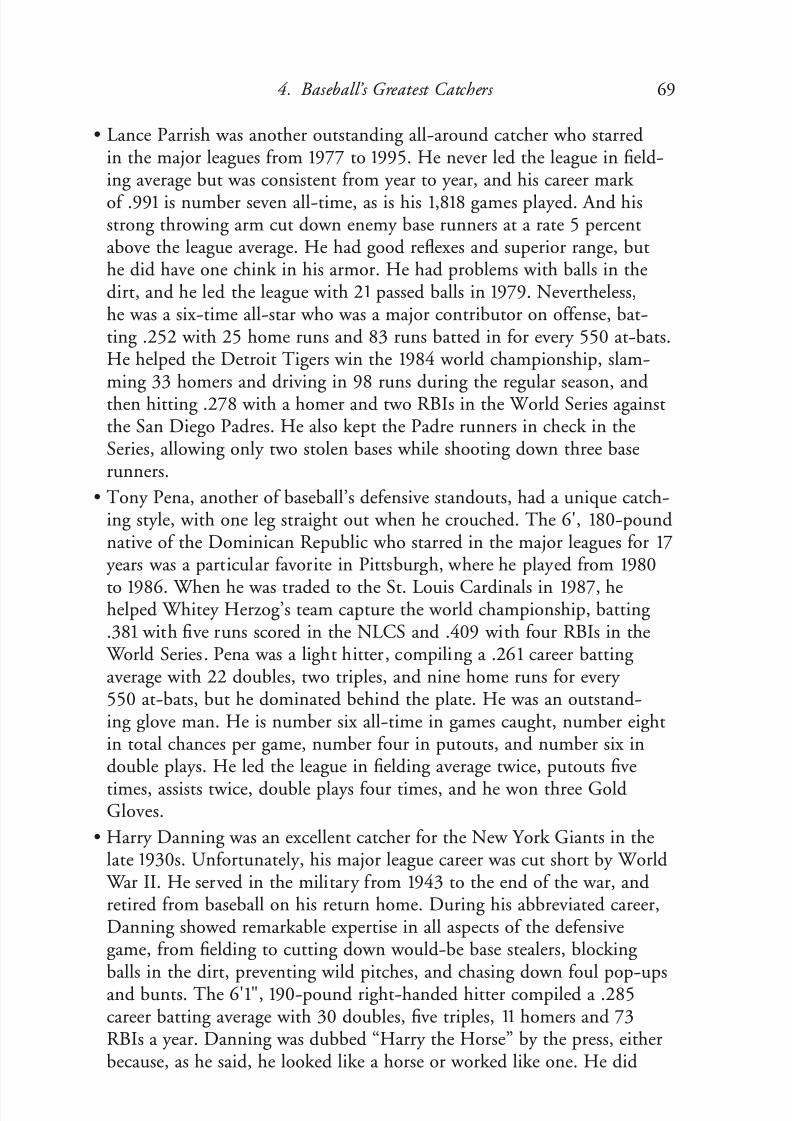
7/25/2019 McNeil - All-Stars for All Time
http://slidepdf.com/reader/full/mcneil-all-stars-for-all-time 80/247
• Lance Parrish was another outstanding all-around catcher who starredin the major leagues from 1977 to 1995. He never led the league in field-ing average but was consistent from year to year, and his career mark
of .991 is number seven all-time, as is his 1,818 games played. And hisstrong throwing arm cut down enemy base runners at a rate 5 percentabove the league average. He had good reflexes and superior range, buthe did have one chink in his armor. He had problems with balls in thedirt, and he led the league with 21 passed balls in 1979. Nevertheless,he was a six-time all-star who was a major contributor on offense, bat-ting .252 with 25 home runs and 83 runs batted in for every 550 at-bats.He helped the Detroit Tigers win the 1984 world championship, slam-ming 33 homers and driving in 98 runs during the regular season, andthen hitting .278 with a homer and two RBIs in the World Series againstthe San Diego Padres. He also kept the Padre runners in check in theSeries, allowing only two stolen bases while shooting down three baserunners.
• Tony Pena, another of baseball’s defensive standouts, had a unique catch-ing style, with one leg straight out when he crouched. The 6', 180-poundnative of the Dominican Republic who starred in the major leagues for 17
years was a particular favorite in Pittsburgh, where he played from 1980
to 1986. When he was traded to the St. Louis Cardinals in 1987, hehelped Whitey Herzog’s team capture the world championship, batting .381 with five runs scored in the NLCS and .409 with four RBIs in the
World Series. Pena was a light hitter, compiling a .261 career batting average with 22 doubles, two triples, and nine home runs for every550 at-bats, but he dominated behind the plate. He was an outstand-ing glove man. He is number six all-time in games caught, number eightin total chances per game, number four in putouts, and number six indouble plays. He led the league in fielding average twice, putouts five
times, assists twice, double plays four times, and he won three GoldGloves.
• Harry Danning was an excellent catcher for the New York Giants in thelate 1930s. Unfortunately, his major league career was cut short by World
War II. He served in the military from 1943 to the end of the war, andretired from baseball on his return home. During his abbreviated career,Danning showed remarkable expertise in all aspects of the defensivegame, from fielding to cutting down would-be base stealers, blocking
balls in the dirt, preventing wild pitches, and chasing down foul pop-upsand bunts. The 6'1", 190-pound right-handed hitter compiled a .285career batting average with 30 doubles, five triples, 11 homers and 73RBIs a year. Danning was dubbed “Harry the Horse” by the press, eitherbecause, as he said, he looked like a horse or worked like one. He did
4. Baseball’s Greatest Catchers 69

7/25/2019 McNeil - All-Stars for All Time
http://slidepdf.com/reader/full/mcneil-all-stars-for-all-time 81/247
work like one, that’s for sure. Like most old-time ballplayers, Danning had an admirable work ethic and an apparent disregard for pain thatallowed him to play through numerous injuries.
• Ray Mueller was one of baseball’s top defensive catchers, but also one of its slowest. He had a below-average range factor, and he was alwaysamong the league leaders in grounding into double plays. Other thanthat, he was a standout behind the plate or with a bat in his hand. Hehad the highest fielding average differential of any catcher in the study (tied with Jim Sundberg), and he had the fourth-highest caught-stealing differential (also tied with Sundberg). He allowed the fewest passed ballsper game of any of the twenty catchers, and was number three in the
fewest wild pitches allowed (tied with Berra). As a batter, he hit a modest.252 with just 38 extra-base hits for every 550 at-bats.
• Chris Hoiles was a fine all-around catcher during the 1990s, but anunlucky one who spent most of his ten-year career playing with andthrough injuries. Finally, when the pain from his leg and hip injuriesproved to be too restrictive, he graciously retired from the game. Butduring his brief career, he established himself as one of the game’s topcatchers, both offensively and defensively. On defense, he had the fewestpassed balls and permitted the fewest wild pitches of any catcher in the
study. He also had an excellent fielding average and an above-averagerange factor. His one weakness was his throwing arm that caught just 28percent of the runners attempting to steal. As a hitter, he averaged 29home runs for every 550 at-bats, one of the highest rates of any of thetwenty catchers. He was also among the leaders in on-base percentageand slugging percentage. In 1993, he became just the fifth AmericanLeague catcher to bat .300 with at least 25 doubles and 25 homers in a season. Three years later, in a game against the Seattle Mariners, he expe-rienced his most exciting moment. Coming to the plate in the bottom of
the ninth inning with the bases full and his team trailing by three runs,he took a full-count pitch downtown, a walk-off, grand-slam home run.
And, on August 14, 1998, he had a game to remember, smashing twogrand-slam homers in the same game.
• Bill Freehan was a Detroit Tiger mainstay for 15 years, from 1961 through1976. By the time he retired, he had accumulated numerous records. His.993 career fielding average is tied for the highest career norm for a catcher in baseball history. He led the league in fielding average three
times, putouts six times, and double plays once. He is number three all-time in total chances per game with 6.79, and number three in putouts with 9,941. Freehan had quick reflexes and good speed for a big man, andhe also had a quick bat. The 6'2", 205-pound right-handed hitter batted.262 over 15 years, with 22 doubles, three triples, and 18 home runs a
70 A LL-STARS FOR A LL TIME

7/25/2019 McNeil - All-Stars for All Time
http://slidepdf.com/reader/full/mcneil-all-stars-for-all-time 82/247
year. Three times in his career he hit 20 or more home runs with a highof 25 in 1968, the year the Tigers won the world championship. He bat-ted .263 that year with 84 RBIs and 73 runs scored, in support of Gib-
son, Cash, Horton, and company. The Michigan native was testedcontinuously by the Cardinal rabbits, who had stolen 110 bases during theregular National League season. They swiped eleven more bases during the Series, including seven by Lou Brock, but Freehan gunned down fiveof them to keep the games under control.
• Earl Battey was a key factor in the Minnesota Twins’ march to the 1965 American League pennant. The California native, a career .270 hitter,stroked the ball at a .297 clip that year, with 60 runs batted in in 394 at-
bats. In the World Series he ran into a railing, neck-first, while chasing a pop foul, but like the warrior he was, he shook off the injury and caughtthe rest of the Series. During his 13-year career, Battey was equally asgood on offense and defense. His batting average was supplemented by 16homers a year, a .351 on-base-percentage, and a .409 slugging average.His adjusted OBP was the sixth-best of the twenty catchers in the study.
As noted in The Ballplayers , “A three time Gold Glove winner, Battey topped all ML catchers in 1962 with a .280 BA, threw out 24 runners,and picked off 13.” The publication also noted that Battey routinely
played through injuries that included dislocated fingers, a bad knee, anda goiter problem that occasionally added 60 pounds to his weight. Dur-ing his career he led the league four times each in putouts and assists, andtwice in double plays.
• Carlton Fisk was baseball’s most durable catcher, catching a major leaguerecord 2,229 games over a memorable 24-year career. He is also numberfour in putouts with 9,428 and tenth in double plays by a catcher with147. Fisk was more an offensive catcher than a defensive one, but hecalled a good game, handled a pitching staff with great skill, and was out-standing in preventing passed balls and wild pitches. At the plate he wasone of the best. His .269 career batting average included 2,356 base hits,one of the highest base-hit totals for any catcher in the annals of thegame. His 421 career doubles, 376 home runs, 1,276 runs scored, and1,386 runs batted in also rank with the best. The 220-pound right-handed slugger hit 20 or more home runs six times, with a high of 37homers in 1985. The image of Fisk that sticks in most people’s minds isthat of his frantic hand-waving as he tried to steer a high fly ball he had
hit to left field into home run territory in Game Six of the1
976 WorldSeries. The pleading worked as his ball ricocheted off the foul pole for a walk-off homer that knotted the Series at three games apiece. Unfortu-nately, the Cincinnati Reds won Game Seven, 4–3, to claim the worldchampionship.
4. Baseball’s Greatest Catchers 71

7/25/2019 McNeil - All-Stars for All Time
http://slidepdf.com/reader/full/mcneil-all-stars-for-all-time 83/247
• Two of the foremost world-class catchers were still active when this study was conducted —Ivan “Pudge” Rodriguez and Mike Piazza. Their statis-tics and ratings were not included in the study, but their potential futureratings were discussed at the end of the section. Rodriguez, through the2006 season, boasted a .304 batting average and had gunned down 48
72 A LL-STARS FOR A LL TIME
Mike Piazza, baseball’s greatest offensive catcher.

7/25/2019 McNeil - All-Stars for All Time
http://slidepdf.com/reader/full/mcneil-all-stars-for-all-time 84/247
4. Baseball’s Greatest Catchers 73
Pudge Rodriguez has the major leagues’ best throwing arm since Roy Campanella (courtesy Ivan “Pudge” Rodriguez Foundation).

7/25/2019 McNeil - All-Stars for All Time
http://slidepdf.com/reader/full/mcneil-all-stars-for-all-time 85/247
percent of all base runners who dared challenge his arm. Piazza, who wasprimarily an offensive catcher, batted .309 through 2006, with 35 homeruns and 108 RBIs for every 550 at-bats.
Offensive Ratings
The offensive ratings for catchers included on-base percentage (OBP),slugging average (SLG), stolen bases (SB), sacrifice hits (SH), and doubleplays grounded into (GIDP). The published slugging statistics were firstadjusted for the individual player’s park factor, then adjusted for the era in
which the player played, and finally normalized. The on-base percentages were era adjusted and then normalized, and the SB, SH, and GIDP statistics were all normalized. The two most important offensive statistics for catchers were OBP and SLG. Players in general who had high OBPs also had highruns scored averages, and players who had high SLGs also had high RBI rates;after all, teams that score the most runs win the most games. For this study,NOBPA and NXSLGA were rated at a maximum of twenty points each whileNSB, NSH, and NGIDP, were rated at a maximum of one point each, giv-ing a total of 43 points that could be realized by a catcher for his offensivecontribution.
Normalized AdjustedOn-Base Percentage (NOBPA)
As noted above, some catchers were underrated since their low batting averages caused their overall offensive contributions to be overlooked. A com-plete measure of a player’s offense must include his ability to reach base by
drawing bases on balls. The most notable example of a player who fell throughthe offensive cracks was Gene Tenace, whose mediocre .241 batting averagecaused him to be disregarded by most baseball experts. However, Tenace hada good batting eye that brought him 123 bases on balls a year, and increasedhis OBP from a lowly .241 to a healthy .388. Although Tenace’s batting aver-age was the lowest in the study, his OBP was the second-highest of the twenty catchers, trailing only Mickey Cochrane, who had a sensational .419 OBP.Cochrane had the highest career batting average at .320, and combined with
his 91
bases on balls a year, it helped him retain his top spot in the OBP cat-egory. Another catcher who was helped by his keen batting eye was DarrellPorter, who hit just .247 but drew 90 walks a year to give him one of the topadjusted on-base percentages in the study. Gene Tenace’s on-base percent-age, adjusted to the era in which he played (OBPA), was .392, second to
74 A LL-STARS FOR A LL TIME

7/25/2019 McNeil - All-Stars for All Time
http://slidepdf.com/reader/full/mcneil-all-stars-for-all-time 86/247
Cochrane’s .401. Other catchers who had excellent OBPAs included BillDickey (.368), Joe Torre (.363), the aforementioned Darrell Porter (.362),and Earl Battey (.359). The leader in OBPA, Mickey Cochrane, posted the
maximum point total of 20.000 for the normalized adjusted on-base percent-age (NOBPA). Gene Tenace’s normalized point total was .392/.401 × 20 =19.551. He was followed by Bill Dickey (18.354), Joe Torre (18.105), DarrellPorter (18.055), and Earl Battey (.17.905). Bringing up the rear was Tony Pena, whose .298 OBPA gave him a normalized point total of 14.863, Ray Mueller, whose .308 OBPA resulted in a 15.362 point total, and Lance Par-rish, whose .309 average gave him 15.411 points.
Normalized Adjusted Slugging Average (XSLGA)The catchers with the highest career slugging averages were Roy
Campanella, who sported a fancy .500 career slugging average, Gabby Hart-nett (.489), Bill Dickey (.486), and Yogi Berra (.482). Jim Sundberg helddown the bottom spot with a career slugging average of .348, and he wasclosely followed by Tony Pena at .364 and Ray Mueller at .368. They werethe only three catchers in the study with career slugging averages under.400. When the slugging averages were adjusted for individual park factors
and the era in which the player was active, there were some minor changesto the slugging ratings. For instance, Johnny Bench, thanks to a favorable era adjustment of 17 points, overtook Roy Campanella to claim the top spot inthe adjusted slugging average ratings with a XSLGA of .302 compared to.283 for Campanella, who lost eight points in the era adjustment. GeneTenace, with a favorable seven-point era adjustment, slipped past Gabby Hartnett into third place, with Hartnett fourth and Darrell Porter fifth.Bill Dickey was hurt by his highly unfavorable park factor that saw him hit24 home runs for every 550 at-bats at home compared to just 11 home
runs on the road. And he was further penalized by a three-point negative era adjustment.
Normalized Stolen Bases (NSB)
Catchers, for the most part, are not noted for their base-stealing skills,but occasionally a catcher comes along who brings with him a very aggres-sive base running game, including the ability to steal bases. Carlton Fisk wassuch a catcher. He ran the bases with abandon and in the process stole anaverage of eight bases for every 154 games played, the highest total for any of the twenty catchers evaluated in this study. Mickey Cochrane and Tony Pena
with seven stolen bases and Gene Tenace and Johnny Bench with five werethe only other catchers with more than four stolen bases a year.
4. Baseball’s Greatest Catchers 75

7/25/2019 McNeil - All-Stars for All Time
http://slidepdf.com/reader/full/mcneil-all-stars-for-all-time 87/247
Normalized Sacrifice Hits (NSH)
Catchers, for whatever reason, were not very adept at laying down
sacrifice hits. That situation was partially caused more by philosophicalchanges in baseball strategy as opposed to incompetence on the part of thecatchers. However, the statistic is part of the offensive evaluation for all play-ers, so it may be that some players were penalized through no fault of theirown. Catchers of long ago, like Mickey Cochrane with 16 sacrifice hits a yearand Gabby Hartnett with 10 sacrifice hits a year, were not only dangeroushitters, they were also skilled in the art of laying down a sacrifice bunt to movea runner along at a critical juncture in the ball game. Over the past sixty
years, only one catcher has averaged more than four sacrifice hits a year. Jim
Sundberg had eleven.
Normalized Double PlaysGrounded Into (NGIDP)
As most people know, catchers have never been noted for their blazing speed and, as a result, they have recorded some of the highest frequencies forgrounding into double plays of any players at any position. Not surprisingly,Ernie Lombardi, long recognized as one of the slowest men ever to play thegame, grounded into an average of 25 double plays for every 154 games played.Ray Mueller with 21 double plays grounded into and Tony Pena with 20 wereclose behind. At the other end of the spectrum, Mickey Cochrane, GeneTenace, and Darrell Porter grounded into only ten double plays a year. Of the active players, Mike Piazza averages 19 GIDPs a year and Ivan Rodriguezaverages 14.
Final Offensive Ratings
Mickey Cochrane led all catchers in three important offensive cate-gories—NOBPA, NSH, and NGIDP—and he was a close second in NSB.Cochrane was no better than twelfth in NXSLGA, and his lack of powerallowed Gene Tenace to overtake him for the number one spot in the finaloffensive ratings. Tenace, whose 123 bases on balls a year gave him a second-place finish in the NOBPA category, was also number one in NGIDP.
Final NOBPA NXSLGA .05NSB .05NSH .05NGIDP Total Offensive
Name × 20 × 20 × 20 × 20 × 20 Points Ratings
Tenace 19.551 17.748 .625 .188 1.000 39.112 1
Cochrane 20.000 14.371 .875 1.000 1.000 37.246 3
Hartnett 17.257 17.417 .625 .938 .167 36.404 6
76 A LL-STARS FOR A LL TIME

7/25/2019 McNeil - All-Stars for All Time
http://slidepdf.com/reader/full/mcneil-all-stars-for-all-time 88/247
Dickey 18.354 14.901 .375 .250 .167 34.047 10Campanella 17.506 18.742 .375 .250 .132 37.005 4
Torre 18.105 16.623 .250 .063 .125 35.166 8
Porter 18.055 17.086 .500 .125 1.000 36.768 5
Lombardi 17.506 16.159 .125 .125 .100 34.015 11
Bench 17.207 20.000 .625 .063 .179 38.074 3
Berra 17.257 16.821 .375 .063 .227 34.743 9
Sundberg 16.259 9.007 .250 .625 .167 26.308 18
Carter 16.808 16.026 .375 .125 .208 33.542 13Parrish 15.411 15.695 .250 .125 .167 31.648 15
Pena 14.863 9.404 .875 .375 .125 25.642 19
Danning 15.960 6.755 .250 .250 .147 23.362 20
Mueller 15.362 10.596 .375 .125 .119 26.577 17
Hoiles 17.756 15.695 .125 .125 .192 33.893 12
Freehan 17.656 13.974 .250 .188 .208 32.276 14
Battey 17.905 11.788 .250 .375 .132 30.450 16
Fisk 17.207 17.020 1.000 .125 .192 35.544 7
Defensive Ratings
The defensive ratings for catchers were determined by comparing field-ing average (FA), caught stealing percentage (CS), passed balls (PB), wildpitches by the pitching staff (WP), range factor (RF), and assists other thancaught stealing assists (ASSA). FA, CS, RF, WP, and ASSA were comparedto the league average and the difference was normalized. PB were normal-ized. Unfortunately, many of a catcher’s defensive responsibilities cannot bemeasured directly, such as calling a game, handling a pitching staff, and back-ing up bases, but verbal evidence presented by baseball experts, historians,and former players indicates that all the world-class catchers, particularly those in the top ten, were rated high in all the intangible categories. For thisstudy, NFAD, NCSD, and NRFD were rated at a maximum of twenty pointseach, NASSAD was rated at ten points, NPB was rated at six, and NWPD
was rated at 1.5, for a total maximum of 77.5 points.
Normalized Fielding Average Differential (NFAD)
Jim Sundberg, long noted as one of the game’s foremost defensive catch-ers, led the way in fielding average differential with a +8 differential, his .993
4. Baseball’s Greatest Catchers 77
Final NOBPA NXSLGA .05NSB .05NSH .05NGIDP Total Offensive
Name × 20 × 20 × 20 × 20 × 20 Points Ratings

7/25/2019 McNeil - All-Stars for All Time
http://slidepdf.com/reader/full/mcneil-all-stars-for-all-time 89/247
career fielding average being eight points above the .985 league average. He was joined in the top spot by Ray Mueller, whose .988 career fielding aver-age was eight points above the .980 league average. Most catchers had field-
ing averages that were better than the league average. The exceptions wereDarrell Porter, whose .982 career fielding average was two points below theleague average, and Ernie Lombardi, whose .979 average fell one point shortof the league average. The fielding average differentials (FAD) were adjustedupward by two points to bring Porter’s fielding average differential to zerobefore calculating NFAD.
Normalized Caught-Stealing
Percentage Differential (NCSD)Roy Campanella was head and shoulders above all other world-class
backstops when it came to gunning down would-be base stealers. His careercaught-stealing percentage of 58 percent does not begin to do justice to hisskill in that area. During his first five years in the National League, his caught-stealing percentage (CS) was a glittering 63 percent. One time he went 52games without allowing a stolen base, and another time he threw out 13 con-secutive runners who tested his powerful throwing arm. Injuries over his last
five years reduced his career averages, but he still retained his number onerating, and he averaged 18 percent better than the league average. Gabby Hartnett, who may have had baseball’s strongest throwing arm, could notmatch Campanella in quickness or accuracy. Still, he finished second toCampy with a 53 percent CS and a 12 percent caught-stealing differential(CSD). Johnny Bench’s numbers were 44 percent CS versus a 35 percentleague CS, for a 9 percent CSD. Jim Sundberg and Ray Mueller, both witha 6 percent CSD, trailed the three leaders. Ivan “Pudge” Rodriguez, who isstill active, may give Campanella a run for his money by the time he retires.
Through the 2006 season, baseball’s latest hired gun enjoyed a 49 percentcaught-stealing percentage and a healthy 17 percent caught-stealing differen-tial. The caught-stealing differentials (CSD) were all adjusted upward by fourpoints to bring Chris Hoiles’ four-point negative differential to zero beforecalculating the NCSD.
Normalized Passed Balls (NPB)
Ray Mueller and Chris Hoiles, two of the game’s best defensive catch-ers, were charged with just five passed balls a year, giving them the maximumtotal of six points. Gary Carter and Harry Danning, two other outstanding glove men, were charged with six passed balls. Lance Parrish was one of base-ball’s top defensive catchers, but he was weak on passed balls, piling up an
78 A LL-STARS FOR A LL TIME
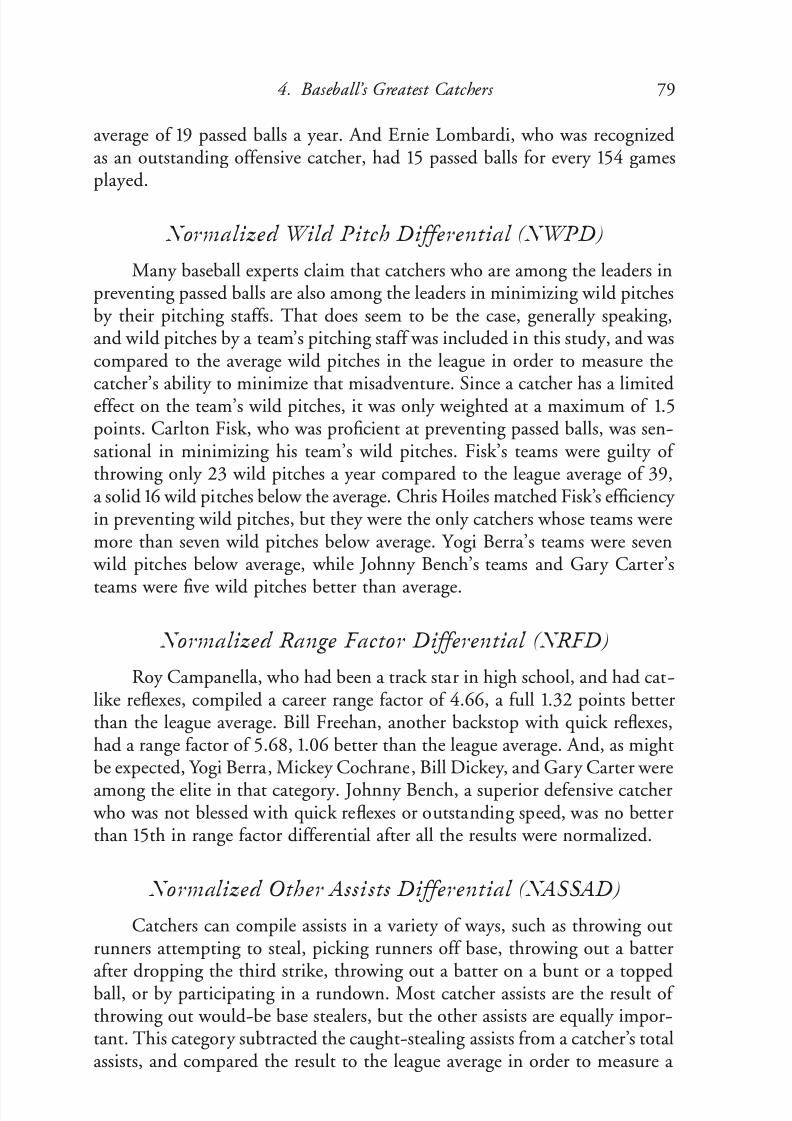
7/25/2019 McNeil - All-Stars for All Time
http://slidepdf.com/reader/full/mcneil-all-stars-for-all-time 90/247
average of 19 passed balls a year. And Ernie Lombardi, who was recognizedas an outstanding offensive catcher, had 15 passed balls for every 154 gamesplayed.
Normalized Wild Pitch Differential (NWPD)
Many baseball experts claim that catchers who are among the leaders inpreventing passed balls are also among the leaders in minimizing wild pitchesby their pitching staffs. That does seem to be the case, generally speaking,and wild pitches by a team’s pitching staff was included in this study, and wascompared to the average wild pitches in the league in order to measure the
catcher’s ability to minimize that misadventure. Since a catcher has a limitedeffect on the team’s wild pitches, it was only weighted at a maximum of 1.5points. Carlton Fisk, who was proficient at preventing passed balls, was sen-sational in minimizing his team’s wild pitches. Fisk’s teams were guilty of throwing only 23 wild pitches a year compared to the league average of 39,a solid 16 wild pitches below the average. Chris Hoiles matched Fisk’s efficiency in preventing wild pitches, but they were the only catchers whose teams weremore than seven wild pitches below average. Yogi Berra’s teams were seven
wild pitches below average, while Johnny Bench’s teams and Gary Carter’s
teams were five wild pitches better than average.
Normalized Range Factor Differential (NRFD)
Roy Campanella, who had been a track star in high school, and had cat-like reflexes, compiled a career range factor of 4.66, a full 1.32 points betterthan the league average. Bill Freehan, another backstop with quick reflexes,had a range factor of 5.68, 1.06 better than the league average. And, as mightbe expected, Yogi Berra, Mickey Cochrane, Bill Dickey, and Gary Carter were
among the elite in that category. Johnny Bench, a superior defensive catcher who was not blessed with quick reflexes or outstanding speed, was no betterthan 15th in range factor differential after all the results were normalized.
Normalized Other Assists Differential (NASSAD)
Catchers can compile assists in a variety of ways, such as throwing outrunners attempting to steal, picking runners off base, throwing out a batterafter dropping the third strike, throwing out a batter on a bunt or a toppedball, or by participating in a rundown. Most catcher assists are the result of throwing out would-be base stealers, but the other assists are equally impor-tant. This category subtracted the caught-stealing assists from a catcher’s totalassists, and compared the result to the league average in order to measure a
4. Baseball’s Greatest Catchers 79

7/25/2019 McNeil - All-Stars for All Time
http://slidepdf.com/reader/full/mcneil-all-stars-for-all-time 91/247
catcher’s proficiency in the other areas. Surprisingly, only seven of the twenty catchers in the study had other assists that exceeded the league average. Thereason for that is unknown. Gabby Hartnett, who had a reputation for throw-
ing to any base at any time in an effort to pick runners off base, led the group with a +6 differential in other assists. Johnny Bench at +4, Gary Carter at+3, Lance Parrish at +2, and Jim Sundberg, Tony Pena, and Ray Mueller at+1 were the other catchers who exceeded the league average.
Final Defensive Ratings
The usual suspects finished at the top of the defensive catcher ratings.
In another close race, Roy Campanella nosed out Gabby Hartnett, the prideof Millville, Massachusetts, by a score of 60.380 to 56.420. Campanella’s big lead in the caught-stealing category clinched the victory for him. Jim Sund-berg, the greatest catcher in Texas Ranger history, came in third, thanks tohis excellent showing in the fielding average category and the range factor cat-egory. He was followed by Gary Carter, who was strong in almost all cate-gories, and Lance Parrish, who also was strong in most categories with theexception of passed balls and wild pitches prevented. Bill Dickey was sixth,but some of the other favorites finished far down the list, including Johnny
Bench (10th), Yogi Berra (12th), and Mickey Cochrane (13th). Gene Tenace was a decent though not outstanding defensive catcher and his 18th-placefinish in the final defensive ratings would cost him dearly in the final all-around ratings.
80 A LL-STARS FOR A LL TIME
Final NFAD NCSD NPB NWPD NRFD NASSAD Total Defensive
Name × 20 × 20 × 6 × 1.5 × 20 × 10 Points Ratings
Tenace 8.000 4.545 2.308 .071 0 2.000 16.924 18
Cochrane 14.000 1.818 3.333 .094 14.611 2.000 35.856 13Hartnett 16.000 14.545 2.727 .094 13.054 10.000 56.420 2
Dickey 16.000 4.545 4.286 .088 14.491 3.333 42.743 6
Campanella 12.000 20.000 4.286 .094 20.000 4.000 60.380 1
Torre 8.000 5.455 1.998 .075 4.671 3.333 23.532 17
Porter 0.000 5.455 2.308 .083 2.275 2.000 12.121 20
Lombardi 2.000 3.636 1.998 .088 5.629 3.333 16.684 19
Bench 10.000 10.000 3.750 .125 6.707 8.667 39.249 10
Berra 8.000 8.182 4.286 .150 14.731 1.333 36.681 12
Sundberg 20.000 9.091 2.727 .079 11.497 6.667 50.061 3
Carter 14.000 7.273 5.000 .125 14.251 8.000 48.649 4
Parrish 14.000 8.182 1.875 .079 12.575 7.333 44.044 5
Pena 12.000 6.364 3.750 .088 12.575 6.667 41.444 8

7/25/2019 McNeil - All-Stars for All Time
http://slidepdf.com/reader/full/mcneil-all-stars-for-all-time 92/247
Final All-Around RatingsThe Final All-Around Ratings were determined by adding the Offen-
sive Point Totals to the Defensive Point Totals in a one-to-one ratio since a catcher’s defense was considered to be equal to his offense in this study. Inmy book, Backstop, which compared the top fifty world-class catchers forboth their offensive and defensive skills, a catcher’s offense was rated at twicehis defense for identifying baseball’s greatest all-around catcher, Gabby Hart-nett. This study differed from that study in two important aspects. First, the
catcher’s offense and defense were rated equal in this study. Second, this study was slightly more sophisticated and more accurate than the previous study.It measured not only who was better or worse in a particular category, but by how much better or worse. The previous study did not measure the magni-tude of difference between players. As a result, this study identified Roy Cam-panella as baseball’s greatest all-around catcher, edging Gabby Hartnett in a close race, 1.640 to 1.575. A few other players also changed their positionssignificantly from that study to this. For instance, Gary Carter catapultedfrom 13th place to third place, Johnny Bench moved up from seventh placeto fourth place, and Jim Sundberg improved his position from 35th (out of 50) to ninth. On the other hand, Yogi Berra lost four places, to eighth place,
Joe Torre fell from ninth to 17th place, and Gene Tenace plummeted fromeighth place to 15th place.
Offense Defense Final Divided Divided Total All-Around
Name by 43 by 77.5 Points Ratings HOF
Tenace .910 .218 1.128 15
Cochrane .866 .463 1.329 6 *
Hartnett .847 .728 1.575 2 *
Dickey .792 .552 1.344 5 *
Campanella .861 .779 1.640 1 *
4. Baseball’s Greatest Catchers 81
Danning 14.000 5.455 5.000 .075 9.581 6.000 40.111 9
Mueller 20.000 9.091 6.000 .150 .599 6.667 42.507 7
Hoiles 12.000 0.000 6.000 1.500 11.617 4.000 35.117 14
Freehan 16.000 0.909 3.000 .100 16.886 0.000 36.895 11
Battey 6.000 7.273 2.308 .100 10.539 6.000 32.220 15
Fisk 8.000 0.909 3.333 1.500 9.940 4.667 28.349 16
Final NFAD NCSD NPB NWPD NRFD NASSAD Total Defensive
Name × 20 × 20 × 6 × 1.5 × 20 × 10 Points Ratings

7/25/2019 McNeil - All-Stars for All Time
http://slidepdf.com/reader/full/mcneil-all-stars-for-all-time 93/247
Torre .818 .304 1.122 17
Porter .855 .156 1.011 19
Lombardi .791 .215 1.006 20 *
Bench .885 .506 1.391 4 *
Berra .808 .473 1.281 8 *
Sundberg .612 .646 1.258 9
Carter .780 .628 1.408 3 *
Parrish .736 .568 1.304 7
Pena .596 .535 1.131 14Danning .543 .518 1.061 18
Mueller .618 .548 1.166 13
Hoiles .788 .453 1.241 10
Freehan .751 .476 1.227 11
Battey .708 .416 1.124 16
Fisk .827 .366 1.193 12 *
Note: HOF denotes a member of the National Baseball Hall of Fame through the Class
of 2007.
T HE T OP T EN
82 A LL-STARS FOR A LL TIME
Offense Defense Final Divided Divided Total All-Around
Name by 43 by 77.5 Points Ratings HOF
Offense
1. Gene Tenace
2. Johnny Bench
3. Mickey Cochrane
4. Roy Campanella
5. Darrell Porter
6. Gabby Hartnett
7. Carlton Fisk
8. Joe Torre
9. Yogi Berra
10. Bill Dickey
Defense
1. Roy Campanella
2. Gabby Hartnett
3. Jim Sundberg
4. Gary Carter
5. Lance Parrish
6. Bill Dickey
7. Ray Mueller
8. Tony Pena
9. Harry Danning
10. Johnny Bench
Baseball’s Greatest All-Around Catchers
1. Roy Campanella
2. Gabby Hartnett
3. Gary Carter
4. Johnny Bench
5. Bill Dickey
6. Mickey Cochrane
7. Lance Parrish
8. Yogi Berra
9. Jim Sundberg
10. Chris Hoiles
Pudge Rodriguez and Mike Piazza were still active as of 2007. Their sta-tistics were reviewed during this study but their ratings were not tabulatedsince their ratings will more than likely decline as their careers wind down.
At this point in his career, Mike Piazza has an excellent chance to be one of

7/25/2019 McNeil - All-Stars for All Time
http://slidepdf.com/reader/full/mcneil-all-stars-for-all-time 94/247
the top five offensive catchers of all-time after he retires, and he may finishas high as number three, behind Gene Tenace and Mickey Cochrane. If hehad retired after the 2006 season, he might even have captured the number
one spot. His weak showing on defense, however, might cost him a spot inbaseball’s top ten all-around catchers when he finally calls it a day. PudgeRodriguez, on the other hand, has made a strong showing on both offenseand defense, and he has a good chance to finish in the top ten all-around,possibly as high as number seven.
4. Baseball’s Greatest Catchers 83

7/25/2019 McNeil - All-Stars for All Time
http://slidepdf.com/reader/full/mcneil-all-stars-for-all-time 95/247
C HAPTER 5
Baseball’s Greatest Pitchers
There were a total of twenty-two pitchers competing for the title of base-ball’s greatest all-around pitcher.
• Walter Johnson is almost always selected as baseball’s greatest pitcher inany poll conducted by baseball experts, the media, or fans. One exception
was Major League Baseball’s infamous All-Century team selected by base-ball fans across the country in 1999 that placed Johnson in sixth place,behind Nolan Ryan, Roger Clemens, and Bob Gibson. “The Big Train,”as he was called, came out of the California oil fields in 1907 to dominatethe American League for 21 years. He won 417 games during his career, a total that would have been much higher if he had pitched for a contenderinstead of the Washington Senators, who were the doormats of theleague, finishing in the second division ten times, including five seventh-place finishes and two basement finishes. Walter Johnson and Nolan Ryanare the only pitchers in the study whose teams had a winning percentagebelow .500. The 6'1", 200-pound right-hander threw a blazing fastball
with an easy sidearm motion that came by way of third base and instilledfear into the hearts of the right-handed batters. Even the great Ty Cobb,
a lefty, confessed to being intimidated by him. Johnson left many recordsbehind when he retired, including the major league career record of 3,509strikeouts in an era when batters considered it a disgrace to strike out.The next highest strikeout total was Cy Young’s 2,803 strikeouts. John-son also owned the major league record for throwing 56 consecutivescoreless innings and 110 shutouts, twenty more than the closest competi-tor. And he held the American League record for 16 consecutive victories.During his illustrious career, Johnson led the league in victories six times,
winning percentage twice, complete games six times, shutouts seven
times, innings pitched five times, strikeouts twelve times (including eight years in a row) and earned run average five times. He is second all-time
84

7/25/2019 McNeil - All-Stars for All Time
http://slidepdf.com/reader/full/mcneil-all-stars-for-all-time 96/247
in career victories, fourth in complete games with 531 out of 666 gamesstarted (80 percent), third in innings pitched (5,914), and seventh in ERA (2.17).
• Grover Cleveland “Old Pete” Alexander, a contemporary of Walter Johnson, pitched for the Philadelphia Phillies, Chicago Cubs, and St.Louis Cardinals from 1911 to 1930, winning 373 games against 208 losses.He led the league in victories six times, with a high of 33 victories in1916. He also led the league in complete games six times, with a high of 38 complete games in 1916, innings pitched seven times, strikeouts fivetimes, and ERA five times. The tall, lanky right-hander was plagued withepilepsy and alcoholism throughout his career, but that rarely affected his
work on the mound as he won more than 20 games a year nine times andpitched more than 300 innings a year nine times. He threw with an easy three-quarter overhand motion, relying almost exclusively on a live fast-ball and a sharp-breaking curveball to retire batters. His impeccable con-trol—just 1.65 walks a game—allowed him to keep the ball low and onthe outside corner of the plate, making him almost unhittable. Alexan-der’s greatest moment in baseball came in the twilight of his career, afterhe helped pitch the St. Louis Cardinals into the 1926 World Series. OldPete was handed the ball in Game Two after New York had taken the
opener by a 2–1 margin, and he handcuffed Miller Huggins’ team, win-ning 6–2 with 10 strikeouts. He came back to beat the Yankees again inGame Six, winning 10–2. Then in the finale the following day, he wascalled into the game in the seventh inning to face Tony Lazzeri with twomen out, the bases loaded, and the Cardinals clinging to a 3–2 lead. Thecrafty 39-year-old veteran worked the count to 1–2 and then gave the
Yankee rookie a sweeping, low outside curveball that had Lazzeri lunging for it and coming up with nothing but air. Alexander went on to blank the Yankees for two more innings, earning the save as the Cardinals
claimed the world championship. Even though he retired nearly 80 yearsago, he remains third all-time in career victories, twelfth in completegames with 437, second in shutouts with 90, and tenth in inningspitched with 5,190.
• Christy Mathewson, “Big Six,” according to The Ballplayers , “looked likethe classic American hero: tall, blond, and blue-eyed, with a reputationfor clean living and good sportsmanship that was often held up as a splendid example for the nation’s youth.” The Pennsylvania native
attended Bucknell University before becoming a professional baseballplayer in 1899. He became an icon almost overnight, and was idolizedby millions of baseball fans, men and women alike, throughout his majorleague career. The New York Giants bought him from Norfolk in theVirginia League after he had dazzled the Virginians with a 20–2 record.
5. Baseball’s Greatest Pitchers 85

7/25/2019 McNeil - All-Stars for All Time
http://slidepdf.com/reader/full/mcneil-all-stars-for-all-time 97/247
Mathewson had a brief learning curve, where he went a combined 34–34
his first two years in New York, but then exploded. Using a completepitching repertoire that included his famous fadeaway pitch, he went30–13 in 1903 and 33–12 the following year. The 6'1", 190-pound right-hander also had near-perfect control, walking only 1.59 men a game
while striking out 4.7 men. He set a record in the 1905 World Series that
86 A LL-STARS FOR A LL TIME
Christy Mathewson excelled in all phases of the game—pitching, batting, and fielding.

7/25/2019 McNeil - All-Stars for All Time
http://slidepdf.com/reader/full/mcneil-all-stars-for-all-time 98/247
will probably never be broken. Over a period of six days, Big Six tossedthree shutouts at Connie Mack’s Philadelphia Athletics, winning by scoresof 3–0, 9–0, and 2–0. He held the A’s to just 14 base hits in 27 innings
while striking out 18 against a single walk. Mathewson is third all-time incareer victories, seventh in winning percentage, thirteenth in completegames with 434, third in shutouts with 79, and fifth in ERA with 2.13.
America’s hero died of tuberculosis in 1925 at the age of 47.
• Lefty Grove was arguably baseball’s greatest southpaw pitcher, and may have been baseball’s all-time greatest all-around pitcher. The hot-tem-pered Maryland native pitched for the Philadelphia Athletics and BostonRed Sox from 1925 to 1941, winning 20 or more games eight times. His
best year was193
1 when he went 3
1–4 with a 2.06 ERA, a full 2.32earned runs per game below the league average. Grove led the league in
many categories that year, including wins, winning percentage (.886),complete games (27), shutouts (four), strikeouts (175), and ERA. Thelegendary lefty, who was noted for his temper tantrums, hated to lose.One of his teammates said he hated to go into the clubhouse after Grovehad lost a game because there would be clothing, bats, stools, and buck-ets flying all over the room. Fortunately, the 6'3", 190-pound southpaw did not lose that often as his 300–141 record showed. He pitched in three
World Series for the A’s between 1929 and 1931, going 4–2 with a 1.74earned run average. During his career he led the league in victories fourtimes, winning percentage five times, complete games and shutouts threetimes each, strikeouts his first seven years in the major leagues, and ERA nine times. He is fourth all-time in winning percentage (.680), and num-ber one in adjusted ERA, a measure of how a pitcher’s ERA compares tothe league average ERA.
• Sandy Koufax is frequently ignored by all-time rating systems because his12-year career was really two separate and distinct careers: the first six
years one of a pitcher trying to find himself, and the second six years oneas baseball’s greatest pitcher. From 1955 through 1960, Koufax won 36games and lost 40, with 22 complete games in 103 starts, while continu-ally struggling with his control, walking five men a game with a 4.00+ERA. Once he learned to control his fastball, he was almost unbeatable.From 1961 through 1966, Koufax went 129–47, with 115 complete gamesin 201 starts. And from 1963 to 1966, he was even more dominant, going 97–27 with a sparkling 1.85 ERA, 1.60 earned runs below the league
average. He averaged 298 innings pitched a year, with 307 strikeoutsand just 65 bases on balls. The smooth-throwing southpaw set the majorleague record for strikeouts in a season with 382 in 1965. He also threw no-hitters in four consecutive years, including a 1–0 perfect game againstthe Chicago Cubs in 1965. Koufax was at his best in his last two years,
5. Baseball’s Greatest Pitchers 87

7/25/2019 McNeil - All-Stars for All Time
http://slidepdf.com/reader/full/mcneil-all-stars-for-all-time 99/247
going 26–8 in 1965 and 27–9 in 1966. His combined totals included 54complete games in 82 starts (a 66 percent completion rate), 699 strike-outs in 658 innings pitched, and a brilliant 1.89 ERA. He led the league
in ERA in each of his last five years with the Dodgers. Unfortunately, he was forced to retire after the 1966 season because of arthritis in his pitch-ing elbow. His career ERA of 2.76 is the third best all-time in the lively ball era. Koufax pitched in four World Series, going 4–3 with a miniscule0.95 ERA and 61 strikeouts in 57 innings, including 15 strikeouts in a 5–2 win over the New York Yankees in 1963.
• Bob Feller pitched against the St. Louis Cardinals in an exhibition game when he was only 17 years old, and he struck out eight Redbirds in three
innings. He made his major league debut the same year and fanned15 St.Louis Browns. Later he fanned 17 Philadelphia Athletics before returning
to high school to finish his junior year. The fireballing right-hander went5–3 that year, upped his record to 9–7 the next year, went 17–11 with a league-leading 240 strikeouts as a 19-year-old, then exploded in 1939
when he went 24–9 and led the American League in victories, completegames (24), innings pitched (296), and strikeouts (246). He also posteda 2.85 earned run average. Feller led the league in victories the following two years with 27 and 25, respectively. The 6', 185-pound pitcher, now
known as “Rapid Robert,” stood on the threshold of greatness. He hadcompiled a record of 107–54 with 1,233 strikeouts—and he had yet tocelebrate his 23rd birthday. But then fate took a hand. World War IIbegan on December 7, 1941, and Feller was one of the first major leaguersto enlist. He spent most of the next four years in the United States Navy,serving in the Pacific theatre of war where he earned eight battle starsbefore returning to baseball in time to post a 5–3 slate at the end of the1945 season. Feller went on to enjoy three more 20-victory seasons, throw three no-hitters and 12 one-hitters, and set a major league season strike-
out record of 348. The Van Meter, Iowa, native completed a memorable18-year career with 266 victories against 162 losses, with 2,581 strikeouts.He probably lost 100 or more victories because of his military service, buthe never complained about his lost time. He was a patriot and he washonored to serve his country. In his career, he led the league in victoriessix times, complete games three times, innings pitched five times, ERA once, and strikeouts seven times.
• Warren Spahn was a graceful, smooth-throwing southpaw who lookedlike he would pitch forever. He completed a notable 21-year major leaguecareer in 1965 at the age of 44. During his career, most of which he spent
with the Boston and Milwaukee Braves, the master of consistency won 20or more games in 13 different seasons, with a high of 23 in 1953. Spahn,like all of the old-time pitchers, took pride in finishing what he started,
88 A LL-STARS FOR A LL TIME

7/25/2019 McNeil - All-Stars for All Time
http://slidepdf.com/reader/full/mcneil-all-stars-for-all-time 100/247
tossing 382 complete games in 665 starts, with many of his starts going 14 innings or more. One of his finest efforts ended in a loss in 1952 when
he dropped a tough 2–1 decision to the Chicago Cubs. He struck out18 batters in the 15-inning game and gave his team its only run with a homer, all to no avail. Spahn was a role model for older ball players,tossing three no-hitters, all after the age of 39, and leading the NationalLeague in victories five consecutive years from age 36 to 40. The classy 6', 175-pounder, who relied primarily on a fastball and a curve early inhis career, led the league in victories eight times, complete games ninetimes, innings pitched and strikeouts four times each, and ERA three
times. His long career put him in elite company. His 363 victories arefifth all-time, and the most wins ever recorded by a southpaw. He iseleventh in games started, eighth in innings pitched (5,243), and sixth inshutouts (63). He also holds the National League record for the mostcareer home runs by a pitcher, with 35. He was elected to the National
5. Baseball’s Greatest Pitchers 89
Warren Spahn was one of baseball’s greatest southpaw pitchers, winner of 363 games.
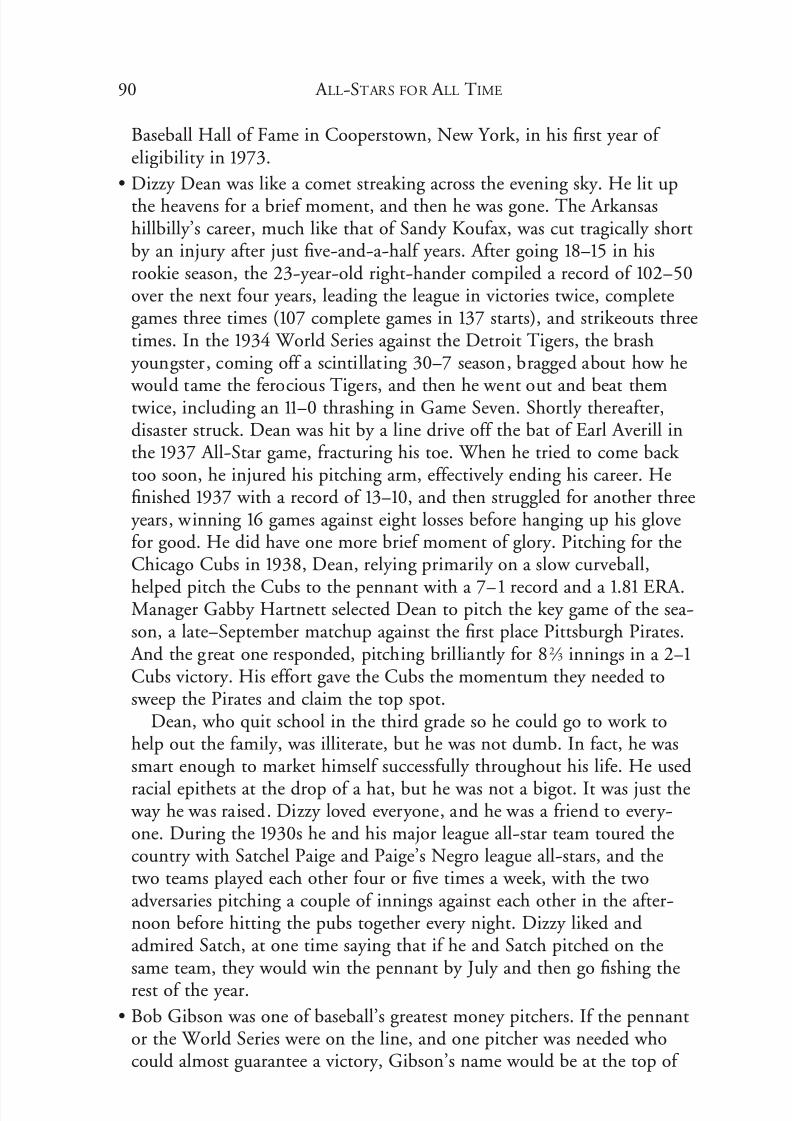
7/25/2019 McNeil - All-Stars for All Time
http://slidepdf.com/reader/full/mcneil-all-stars-for-all-time 101/247
Baseball Hall of Fame in Cooperstown, New York, in his first year of eligibility in 1973.
• Dizzy Dean was like a comet streaking across the evening sky. He lit upthe heavens for a brief moment, and then he was gone. The Arkansashillbilly’s career, much like that of Sandy Koufax, was cut tragically shortby an injury after just five-and-a-half years. After going 18–15 in hisrookie season, the 23-year-old right-hander compiled a record of 102–50over the next four years, leading the league in victories twice, completegames three times (107 complete games in 137 starts), and strikeouts threetimes. In the 1934 World Series against the Detroit Tigers, the brash
youngster, coming off a scintillating 30–7 season, bragged about how he
would tame the ferocious Tigers, and then he went out and beat themtwice, including an 11–0 thrashing in Game Seven. Shortly thereafter,disaster struck. Dean was hit by a line drive off the bat of Earl Averill inthe 1937 All-Star game, fracturing his toe. When he tried to come back too soon, he injured his pitching arm, effectively ending his career. Hefinished 1937 with a record of 13–10, and then struggled for another three
years, winning 16 games against eight losses before hanging up his glovefor good. He did have one more brief moment of glory. Pitching for theChicago Cubs in 1938, Dean, relying primarily on a slow curveball,
helped pitch the Cubs to the pennant with a 7–1 record and a 1.81 ERA.Manager Gabby Hartnett selected Dean to pitch the key game of the sea-son, a late–September matchup against the first place Pittsburgh Pirates.
And the great one responded, pitching brilliantly for 82 ⁄ 3 innings in a 2–1
Cubs victory. His effort gave the Cubs the momentum they needed tosweep the Pirates and claim the top spot.
Dean, who quit school in the third grade so he could go to work tohelp out the family, was illiterate, but he was not dumb. In fact, he wassmart enough to market himself successfully throughout his life. He used
racial epithets at the drop of a hat, but he was not a bigot. It was just the way he was raised. Dizzy loved everyone, and he was a friend to every-one. During the 1930s he and his major league all-star team toured thecountry with Satchel Paige and Paige’s Negro league all-stars, and thetwo teams played each other four or five times a week, with the twoadversaries pitching a couple of innings against each other in the after-noon before hitting the pubs together every night. Dizzy liked andadmired Satch, at one time saying that if he and Satch pitched on thesame team, they would win the pennant by July and then go fishing therest of the year.
• Bob Gibson was one of baseball’s greatest money pitchers. If the pennantor the World Series were on the line, and one pitcher was needed whocould almost guarantee a victory, Gibson’s name would be at the top of
90 A LL-STARS FOR A LL TIME

7/25/2019 McNeil - All-Stars for All Time
http://slidepdf.com/reader/full/mcneil-all-stars-for-all-time 102/247
the list. The 6'2", 195-pound right-hander with the blazing fastball andan intimidating mean streak pitched in three World Series, starting ninegames, completing eight, and racking up a 7–2 record. He holds the
World Series career strikeout record with 92 in 81 innings. He also holds World Series records for the most strikeouts in a game with 17 and themost strikeouts in one Series with 35. In season play, Gibson won 20 ormore games five times en route to a career record of 251–174. His greatestseason was 1968 when he went 22–9 with 13 shutouts and a miniscule1.12 earned run average, the fourth-lowest ERA in major league history,and the lowest season ERA since 1914. Gibson’s career would have beeneven more impressive if not for the injuries he had to play through,including a broken leg, knee surgery, and a strained elbow. When he
was healthy, he owned the plate and he demanded it, pitching insidefrequently to keep the batter loose. One time a reporter suggested thatGibson would even hit his own mother, to which Gibson replied, “I
would if she crowded the plate.”
• Tom Seaver, or “Tom Terrific” as New York fans called him, was a hard- working right-handed pitcher who possessed a blazing fastball and out-standing control over his 20-year major league career. The handsomeCalifornian reeled off five 20-win seasons while leading the league in vic-
tories three times, strikeouts five times, and ERA three times. He pitchedthe New York Mets to their first National League pennant and first worldchampionship in 1969 when he compiled a 25–7 record with a league-leading .781 winning percentage and a 2.21 ERA. He went 1–1 with a 3.00ERA in the Series, winning Game Four 2–1 in ten innings. Four yearslater, he posted a 2.40 ERA in the World Series but lost his only decisionby a 3–1 score. Seaver had many memorable moments over his career.On April 22, 1970, he struck out 19 batters in a nine-inning game,including the last ten men in succession. Eight years later, on June 16,
1978, he hurled a no-hitter at the St. Louis Cardinals, winning 4–0. Healso tossed three one-hitters during his career. By the time he retired in1986, Seaver had 311 victories to his credit against 205 losses, with 231
complete games in 647 starts. He is seventh all-time in career shutouts(61), sixth in strikeouts (3,640), and 12th in games started. He was theNational League Rookie of the Year in 1967, an eleven-time all-star, anda three-time Cy Young Award winner.
• Jim Palmer, a high-kicking right-hander with a wide assortment of
pitches and good control, rebounded from two years of arm problemsto become the biggest winner in Baltimore Oriole history. The 6'3", 195-pound New Yorker began his major league career in 1965 at the age of 19,and one year later he became the youngest pitcher to hurl a complete-game victory in the World Series, defeating Sandy Koufax and the Los
5. Baseball’s Greatest Pitchers 91

7/25/2019 McNeil - All-Stars for All Time
http://slidepdf.com/reader/full/mcneil-all-stars-for-all-time 103/247
Angeles Dodgers, 6–0, in the Orioles’ shocking four-game sweep of theNational League champions. Palmer’s bubble burst the next spring whenhis arm went dead, dashing his dreams of a long, successful career. Hemissed most of the next two seasons before arm surgery gave him a sec-ond chance, and he made the most of it. Shortly after he returned toaction, he pitched an 8–0 no-hitter against the Oakland Athletics, enroute to a dream-like 16–4 season. From there, his career took off. He
won 20 or more games eight times over the next nine seasons, sparking Earl Weaver’s team to five American League pennants and two more
92 A LL-STARS FOR A LL TIME
Tom Seaver, a career 311-game winner, struck out 19 San Diego Padres in 1970,including ten in a row to end the game (courtesy New York Mets).

7/25/2019 McNeil - All-Stars for All Time
http://slidepdf.com/reader/full/mcneil-all-stars-for-all-time 104/247
world championships. He appeared in six World Series overall, going4–2 with a 3.20 ERA. And he added a 4–1 record with a 1.96 ERA inthe LCS. The three-time Cy Young Award winner compiled a 268–152
won-lost record over his 19-year career, with 221 complete games in 521
starts, a 40 percent completion rate. Jim Palmer’s 2.86 ERA is the fourth-lowest ERA since the lively ball was introduced in 1920, trailing only Hoyt Wilhelm, Whitey Ford and Sandy Koufax.
• Juan Marichal, another high-kicking flamethrower, was the mainstay of the San Francisco Giants’ pitching staff during the 1960s and early 1970s.Back in the days when men were men and major league pitchers took pride in completing their starts, the big right-hander threw 244 complete
games in 457 starts, a 53 percent completion rate. Marichal, whose vastpitching repertoire included a curve, slider, and screwball in addition tohis heater, was a control artist who walked less than two men per nineinnings, while striking out six. He won 20 or more games six times in hiscareer, with a high of 26 in 1968, when he led the league in wins, com-plete games (30 in 38 starts, or 79 percent), and innings pitched (326).Five years earlier, he had put together a brilliant 25–8 mark, leading theleague in victories and innings pitched (321). Two of his more memorablegames were pitched that year. On June 15, he no-hit the Houston Colt
.45s, 1–0, and a little more than two weeks later he hurled 16 innings todefeat Warren Spahn of the Milwaukee Braves, 1–0, in one of the game’sgreat pitching duels. Overall, Marichal won 242 games against 142 lossesin his 16-year major league career, with a 2.89 career ERA, number six all-time in the lively ball era. He was enshrined in the Baseball Hall of Fame, joining the other immortals, in 1983.
• Steve Carlton’s 329 career victories are second to Warren Spahn for themost victories ever recorded by a left-handed pitcher. The hard-throwing Floridian was a menacing presence on the mound, standing 6'4" tall,
and weighing a solid 210 pounds. He threw smoke whenever he neededa strikeout, but he was more than just a one-pitch pitcher. He also hada decent curveball and a devastating slider. He broke upon the majorleague stage in 1965 at the age of 20, pitching in 15 games with no deci-sions, and he became a regular starter two years later when he won 14games against nine losses with a 2.98 earned run average. Carlton spenthis first seven years with the St. Louis Cardinals before a salary disputeended with his being traded to the Philadelphia Phillies, one of the worsttrades in Cardinal history. Lefty had just won 20 games with St. Louisin 1971, and in his first year in the City of Brotherly Love, he led theNational League with 27 victories, 30 complete games, 346 inningspitched, 310 strikeouts, and a miniscule 1.97 ERA. Overall, he led theleague in victories four times, complete games three times, innings
5. Baseball’s Greatest Pitchers 93

7/25/2019 McNeil - All-Stars for All Time
http://slidepdf.com/reader/full/mcneil-all-stars-for-all-time 105/247
pitched and strikeouts five times, and ERA once. Carlton pitched infour World Series, going 2–2 with a 2.56 ERA. In the 1980 Fall Classic,he defeated the Kansas City Royals twice, including a 4–1 victory in the
deciding seventh game. He is eleventh all-time in career victories, fifth ingames started with 709, fourteenth in shutouts with 55, ninth in inningspitched with 5,217, and fourth in strikeouts with 4,136.
• Eddie Plank was one of Connie Mack’s money pitchers during Philadel-phia Athletics’ glory days between 1910 and 1914, when they won four
American League pennants and three world championships. Plank pitched in three of the World Series, but he was a hard-luck pitcher,
winning just two games against five losses in spite of a brilliant 1.32 ERA.
In the1911
Series, he defeated the New York Giants, 3–1, in Game Three,then lost Game Five in relief. Two years later he lost a heartbreaking 3–0
game to Christy Mathewson and the Giants, a 10-inning thriller that saw Mathewson single in the winning run. Plank had the last laugh, however,
when he out-pitched Mathewson, 3–1, in Game Seven to give the A’s the world championship. In 1914, the year of the miracle Boston Braves, helost another heartbreaker, a 1–0 decision to Bill James. “Gettysberg Eddie,” as he was known, spent all but three years of his 17-year majorleague career in Philadelphia, winning 20 games eight times, on his way
to a career record of 326–194. He is number 11 in career victories, num-ber 15 in complete games with 410 in 529 games started, a 78 percentcompletion rate, number five in shutouts with 69, and number 13 inERA with 2.35. He is a 1946 inductee into the Baseball Hall of Fame.
• Whitey Ford, the “Chairman of the Board,” was Casey Stengel’s secret weapon during the New York Yankees’ historic pennant runs in the 1950sand 1960s. Ford pitched for the Yankees for 16 years, winning 11 AmericanLeague pennants and six world championships. In Series play, he won 10games against eight losses, the most World Series victories by any pitcher.
In regular-season play he was dominant, winning 236 games against 106losses, a .690 winning percentage, tied with Dave Foutz for the highestcareer winning percentage in major league history. Ford had a season
winning percentage of more than .700 on seven occasions. In his rookieseason, he went 9–1 for a .900 winning percentage. Three years later, he
was 18–7, .720, and the next year he led the league with a .760 winning percentage on the basis of a 19–6 record. His greatest season was 1961,
when he went 25–4, leading the league in wins, winning percentage
(.862), and innings pitched (283). He wrapped up his career season by going 2–0 in the World Series, with a perfect 0.00 ERA in 15 innings.Ford’s 2.75 career ERA is the second-lowest major league ERA since1920, trailing only Hoyt Wilhelm. The only chink in Ford’s armor washis lack of stamina that often prevented him from pitching nine innings.
94 A LL-STARS FOR A LL TIME

7/25/2019 McNeil - All-Stars for All Time
http://slidepdf.com/reader/full/mcneil-all-stars-for-all-time 106/247
He completed only 36 percent of his starts in an era when the top majorleague pitchers were completing at least half of their starts. WarrenSpahn, for instance, completed 57 percent of his starts, Bob Lemon
completed 54 percent of his starts, and Robin Roberts completed 50percent of his starts. One year, when a reporter asked Ford if he thoughthe could win 20 games that year, Ford said, “I think I can if Arroyo’s armholds out,” referring to the New York fireman, Luis Arroyo.
• Addie Joss, one of baseball’s greatest pitchers, had his career cut short by tubercular meningitis in 1911 at the age of 31. But during his brief nine-
year career, the slim 6' 3", 185-pound right-hander proved his greatness,so much, in fact, that the Veterans Committee in 1978 bypassed the Hall
of Fame’s minimum10-year requirement for induction and welcomedhim into the prestigious bastion of baseball’s legendary players. Joss began
his major league career with the Cleveland Naps (later the Indians) of the American League in 1902, and he tossed a one-hitter en route to a 17–13season. He pitched for the Naps through the 1910 season, winning 20 ormore games four times, with a high of 27 in 1907. His greatest game wasunquestionably the October 2, 1908, contest that matched him against“Big Ed” Walsh in the heat of the pennant race. Joss responded to thechallenge by throwing a perfect game at the Chicago White Sox, winning
1–0. Walsh tossed a four-hitter and struck out 15 Naps in the loss. Jossno-hit the White Sox again in 1909. His health began to decline that yearand he finished the season at 14–14, followed by a 5–5 year in 1910 whenhe pitched in just 13 games. He died on Opening Day, April 14, 1911.
Addie Joss compiled a record of 160–97 during his career, with 234 com-plete games in 260 starts, an amazing 90 percent completion rate. His1.89 career ERA is second all-time behind Ed Walsh, who had a 1.82ERA, and his 1.16 ERA in 1908 is the eighth-lowest season ERA in majorleague history.
• Ed Walsh, known as “Big Ed,” was a spitball artist who was the ace of theChicago White Sox’s staff from 1906 through 1912, winning 168 gamesover that period, an average of 24 wins a year. He paced the White Sox to the American League pennant in 1906, his first full year in the league.He went 17–13 during the season, pitching 278 innings. Then, in the
World Series against their cross-town rivals, the Chicago Cubs, he wontwo games without a loss, including a 3–0 shutout in Game Three. Two
years later, he put together a career season, winning 40 games, secondonly to Jack Chesbro’s 41 wins for the most single-season wins in thetwentieth century. Big Ed led the American League in many pitching cat-egories that year, including victories, winning percentage (.727), gamespitched (66), complete games (42), shutouts (11), saves (six), inningspitched (464), and strikeouts (269). Walsh’s career, like Joss’, was rela-
5. Baseball’s Greatest Pitchers 95

7/25/2019 McNeil - All-Stars for All Time
http://slidepdf.com/reader/full/mcneil-all-stars-for-all-time 107/247
tively short. He had only nine years in which he pitched more than 100innings. Supposedly, his spitball was easy on the arm and allowed him topitch over 400 innings twice during his career and over 367 innings three
other years. But the wear and tear on his arm took its toll, and in 1909he threw just 230 innings. Then, after three more heavy-duty seasonsof 369, 368, and 393 innings pitched, his arm went dead. He struggledthrough five more years, winning just 13 games total, before retiring in1917. Walsh retired with 195 victories against 126 losses and baseball’sall-time lowest ERA, a dazzling 1.82.
• Mordecai “Three Finger” Brown lost his right forefinger and mangled hismiddle finger in a farm accident when he was just seven years old. As it
turned out, it might have been a blessing in disguise because he devel-oped a sharp-breaking curveball that rolled off his damaged fingers, lead-ing to an outstanding 14-year major league career, primarily with theChicago Cubs. Brown, who was noted for his vigorous training regimen,paced the Cubs to four National League pennants and two world champi-onships between 1906 and 1910. The 1908 pennant race became legendary
when New York Giant first baseman Fred Merkle failed to touch secondbase after an apparent game-winning hit, forcing a playoff between theGiants and Cubs to determine the pennant winner. Three Finger Brown
out-pitched Christy Mathewson by a 4–2 count in the playoff game tosend the Cubbies to the Series. The Cubs faced the Chicago White Sox,known as “the Hitless Wonders” in the 1906 Fall Classic, with the WhiteSox coming out on top in six games. In 1907, the Tinker-to-Evers-to-Chance combination took the measure of the Detroit Tigers and theirsensational 20-year-old batting champion, Ty Cobb, in five games.Brown won the deciding game, 2–0, while holding Cobb to a single infour at-bats. In a rematch the next year, the Cubs came out on top againin five games, with Brown winning Game One in relief before blanking
the Bengals, 3–0, in Game Four. After falling to second place in 1909,Chicago roared back in 1910 to win the pennant by a whopping 13 gamesover the New York Giants. This time, they lost to the Philadelphia
Athletics in five games, with Brown going 1–2, including a 7–2 thrashing in Game Five.
Brown was a workhorse for the Cubs for ten years as both a starter andreliever. He pitched in relief 149 times during his career in addition tostarting 332 games. He led the National League in saves for four con-secutive years, 1908 through 1911, on his way to a major league record49 saves, a record that lasted until 1926. His overall won-lost record was239–130, giving him a .648 winning percentage. He had 271 completegames, an 82 percent completion rate, 55 shutouts, and a 2.06 careerERA. He stands fifteenth all-time in winning percentage, fourteenth in
96 A LL-STARS FOR A LL TIME
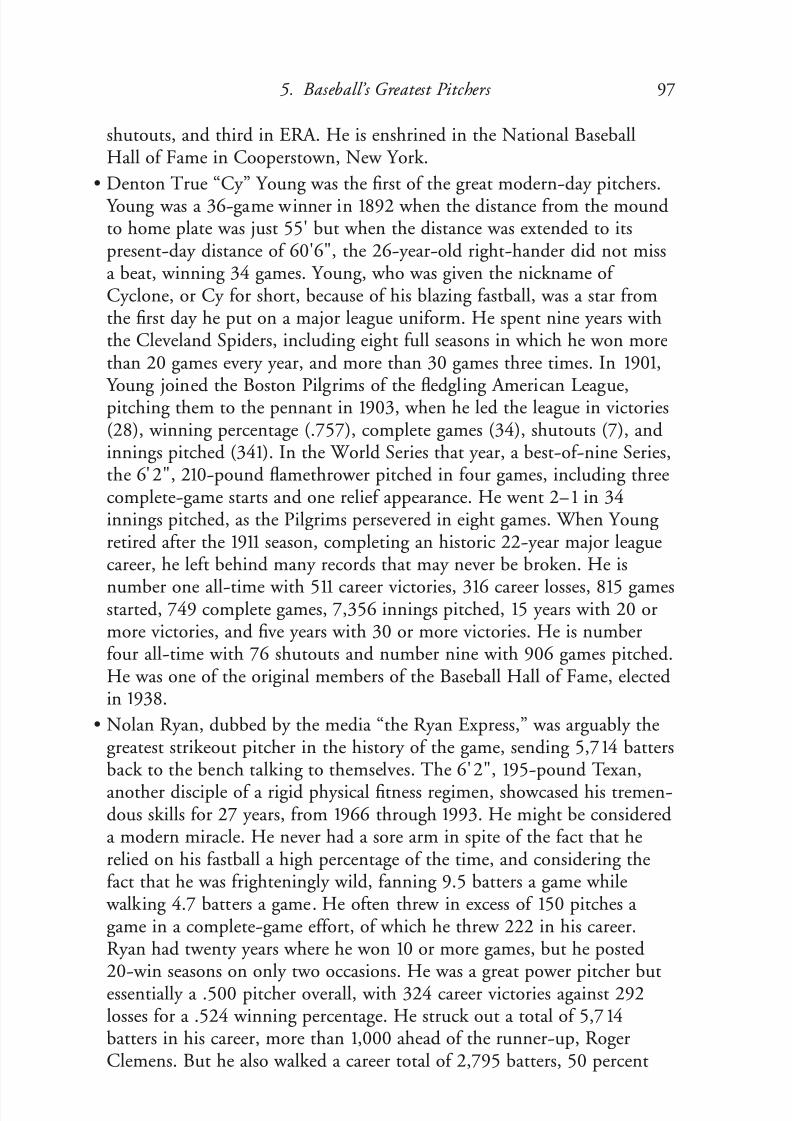
7/25/2019 McNeil - All-Stars for All Time
http://slidepdf.com/reader/full/mcneil-all-stars-for-all-time 108/247
shutouts, and third in ERA. He is enshrined in the National BaseballHall of Fame in Cooperstown, New York.
• Denton True “Cy” Young was the first of the great modern-day pitchers. Young was a 36-game winner in 1892 when the distance from the moundto home plate was just 55' but when the distance was extended to itspresent-day distance of 60'6", the 26-year-old right-hander did not missa beat, winning 34 games. Young, who was given the nickname of Cyclone, or Cy for short, because of his blazing fastball, was a star fromthe first day he put on a major league uniform. He spent nine years withthe Cleveland Spiders, including eight full seasons in which he won morethan 20 games every year, and more than 30 games three times. In 1901,
Young joined the Boston Pilgrims of the fledgling American League,pitching them to the pennant in 1903, when he led the league in victories(28), winning percentage (.757), complete games (34), shutouts (7), andinnings pitched (341). In the World Series that year, a best-of-nine Series,the 6'2", 210-pound flamethrower pitched in four games, including threecomplete-game starts and one relief appearance. He went 2–1 in 34innings pitched, as the Pilgrims persevered in eight games. When Young retired after the 1911 season, completing an historic 22-year major leaguecareer, he left behind many records that may never be broken. He is
number one all-time with 511 career victories, 316 career losses, 815 gamesstarted, 749 complete games, 7,356 innings pitched, 15 years with 20 ormore victories, and five years with 30 or more victories. He is numberfour all-time with 76 shutouts and number nine with 906 games pitched.He was one of the original members of the Baseball Hall of Fame, electedin 1938.
• Nolan Ryan, dubbed by the media “the Ryan Express,” was arguably thegreatest strikeout pitcher in the history of the game, sending 5,714 battersback to the bench talking to themselves. The 6'2", 195-pound Texan,
another disciple of a rigid physical fitness regimen, showcased his tremen-dous skills for 27 years, from 1966 through 1993. He might be considereda modern miracle. He never had a sore arm in spite of the fact that herelied on his fastball a high percentage of the time, and considering thefact that he was frighteningly wild, fanning 9.5 batters a game while
walking 4.7 batters a game. He often threw in excess of 150 pitches a game in a complete-game effort, of which he threw 222 in his career.Ryan had twenty years where he won 10 or more games, but he posted20-win seasons on only two occasions. He was a great power pitcher butessentially a .500 pitcher overall, with 324 career victories against 292losses for a .524 winning percentage. He struck out a total of 5,714batters in his career, more than 1,000 ahead of the runner-up, RogerClemens. But he also walked a career total of 2,795 batters, 50 percent
5. Baseball’s Greatest Pitchers 97

7/25/2019 McNeil - All-Stars for All Time
http://slidepdf.com/reader/full/mcneil-all-stars-for-all-time 109/247
more than any other pitcher in the history of the game. When his fastball was humming, the Ryan Express was unhittable, leading the league instrikeouts eleven times, including four consecutive years after he turnedforty years of age. In 1973, he set the major league single-season strikeoutrecord with 383, one more than Sandy Koufax. In 1989, he became the
oldest pitcher ever to strikeout 300 batters in a season, fanning 301
menat the age of 42. Ryan also threw an unbelievable seven no-hitters, twoof which came after he turned 43. He also had a record 12 one-hitters,a total tied with Bob Feller. The native of Alvin, Texas, is number 12 incareer victories, number three in career losses, number two in games
Randy Johnson is the most dominant strikeout pitcher the game has ever produced.He struck out an average of 10.8 batters per game through the 2007 season (cour-tesy James R. Madden, Jr.).

7/25/2019 McNeil - All-Stars for All Time
http://slidepdf.com/reader/full/mcneil-all-stars-for-all-time 110/247
started, number seven in shutouts, number five in innings pitched, num-ber one in bases on balls, and number one in strikeouts. He was electedto the Baseball Hall of Fame in his first year of eligibility in 1999.
• Wes Ferrell was baseball’s greatest hitting pitcher, smashing 38 careerhome runs, an average of 18 homers for every 550 at-bats, while knocking in 97 runs and posting a .280 career batting average. Ferrell was part of one of baseball’s most famous brother acts, pitching to his brother,catcher Rick Ferrell, on the Boston Red Sox for four years. Rick Ferrell
was elected to the Baseball Hall of Fame in 1984. Brother Wes is still waiting, but hopefully the Veterans Committee will see fit to let him joinRick in the Hall in the near future. Wes Ferrell was a big, strong 6'2",
195-pound North Carolina farmboy who pitched in his first major leaguegame in 1927 at the age of 19. Two years later, he was a 20-game winner,going 21–10 for the Cleveland Indians. He won 20 games in each of thenext four years and, after two sub-par years caused by a sore arm, theformer fireballer bounced back with a new-found curveball to lead the
American League in victories with 25, in complete games with 31, and ininnings pitched with 322. Ferrell was called a prima donna and a hotheadby the media, and he was that. He hated to lose, and he took it out onhimself and everything around him after a tough loss. But he was also a
winner, who won 193 games against 128 losses during his 15-year career.• Carl Hubbell, a.k.a. “King Carl,” was the ace of the New York Giant
pitching staff for 16 years, during which time he pitched the Giants intothree World Series. When Bill Terry’s team took the measure of the
Washington Senators in 1934, King Carl won two of the five games, winning 4–2 in the opener and taking Game Four by a 2–1 count in 11
innings. Overall, Hubbell went 4–2 in the three World Series with a 1.79ERA. The lanky, left-handed screwball artist won more than 20 games in
five consecutive seasons, from1933 through
1937, leading the league invictories and ERA in three of those years. He is best remembered for his
1934 All-Star Game performance when he fanned five American Leaguersin succession—Ruth, Gehrig, Foxx, Simmons, and Cronin. He also won24 consecutive games over two seasons, winning his last 16 games in 1936and his first eight games in 1937. Over the course of his career, the 6',170-pound hurler compiled a record of 253–154 with an excellent 2.98ERA.
Other former pitchers who were reviewed but who did not make the top22 included Hoyt Wilhelm and Don Sutton.There are several world-class pitchers who are still active and are candi-
dates for the all-time all-star team, including Roger Clemens, Pedro Mar-tinez, Greg Maddux, Randy Johnson, and Tom Glavine. Their statistics
5. Baseball’s Greatest Pitchers 99
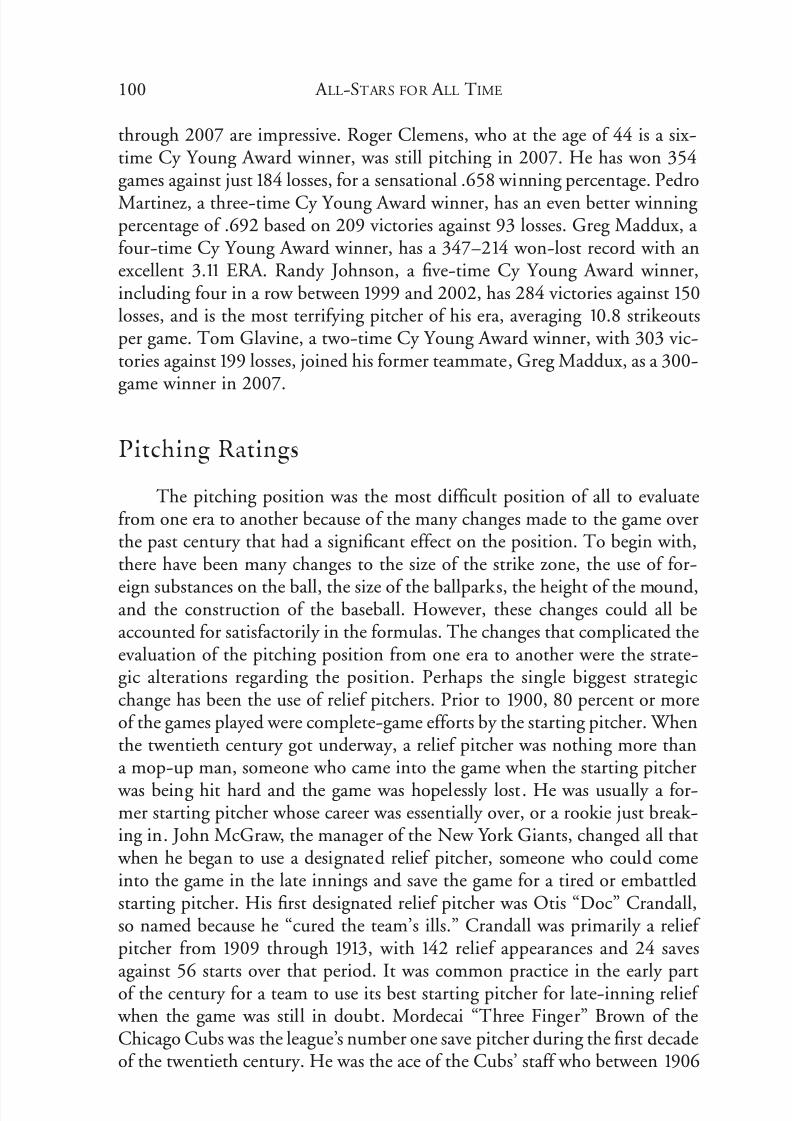
7/25/2019 McNeil - All-Stars for All Time
http://slidepdf.com/reader/full/mcneil-all-stars-for-all-time 111/247
through 2007 are impressive. Roger Clemens, who at the age of 44 is a six-time Cy Young Award winner, was still pitching in 2007. He has won 354games against just 184 losses, for a sensational .658 winning percentage. Pedro
Martinez, a three-time Cy Young Award winner, has an even better winning percentage of .692 based on 209 victories against 93 losses. Greg Maddux, a four-time Cy Young Award winner, has a 347–214 won-lost record with anexcellent 3.11 ERA. Randy Johnson, a five-time Cy Young Award winner,including four in a row between 1999 and 2002, has 284 victories against 150losses, and is the most terrifying pitcher of his era, averaging 10.8 strikeoutsper game. Tom Glavine, a two-time Cy Young Award winner, with 303 vic-tories against 199 losses, joined his former teammate, Greg Maddux, as a 300-
game winner in 2007.
Pitching Ratings
The pitching position was the most difficult position of all to evaluatefrom one era to another because of the many changes made to the game overthe past century that had a significant effect on the position. To begin with,there have been many changes to the size of the strike zone, the use of for-
eign substances on the ball, the size of the ballparks, the height of the mound,and the construction of the baseball. However, these changes could all beaccounted for satisfactorily in the formulas. The changes that complicated theevaluation of the pitching position from one era to another were the strate-gic alterations regarding the position. Perhaps the single biggest strategicchange has been the use of relief pitchers. Prior to 1900, 80 percent or moreof the games played were complete-game efforts by the starting pitcher. Whenthe twentieth century got underway, a relief pitcher was nothing more thana mop-up man, someone who came into the game when the starting pitcher
was being hit hard and the game was hopelessly lost . He was usually a for-mer starting pitcher whose career was essentially over, or a rookie just break-ing in. John McGraw, the manager of the New York Giants, changed all that
when he began to use a designated relief pitcher, someone who could comeinto the game in the late innings and save the game for a tired or embattledstarting pitcher. His first designated relief pitcher was Otis “Doc” Crandall,so named because he “cured the team’s ills.” Crandall was primarily a relief pitcher from 1909 through 1913, with 142 relief appearances and 24 savesagainst 56 starts over that period. It was common practice in the early partof the century for a team to use its best starting pitcher for late-inning relief
when the game was still in doubt. Mordecai “Three Finger” Brown of theChicago Cubs was the league’s number one save pitcher during the first decadeof the twentieth century. He was the ace of the Cubs’ staff who between 1906
100 A LL-STARS FOR A LL TIME

7/25/2019 McNeil - All-Stars for All Time
http://slidepdf.com/reader/full/mcneil-all-stars-for-all-time 112/247
and 1911 won 20 or more games each year, throwing 154 complete games in182 starts. But, in addition to his heavy starting pitching workload, he alsorelieved in 81 games, accumulating 38 saves. He led the league in saves four
consecutive years, from 1908 to 1911. Ed Walsh of the Chicago White Sox wasanother one-man team, starting 315 games and relieving in 115 others during his career. He had 34 saves in 14 years and led the American League in savesfive times. Grover Cleveland Alexander had 96 relief appearances with 32saves in 20 years and Walter Johnson had 136 relief appearances in 21 years,
with 34 saves. As the game entered the third decade of the century, relief pitching began
to evolve into a specialized responsibility, with names like Firpo Marberry,
Wilcy Moore and Johnny Murphy appearing in the box scores frequently.The Yankee-Dodger rivalry dominated the 1940s, and their firemen, Joe Pageand Hugh Casey, made the figure a sport’s celebrity. Page, in particular, pop-ularized the position. He pitched in four of the seven games in the 1947 WorldSeries, with one win and one save, and he held the powerful Dodgers to a single base hit over the final five innings of the finale, as New York prevailed,5–2. He was often photographed wearing a fireman’s helmet and climbing over the low bullpen fence on his way to putting out another fire. Throughthe 1950s and 1960s, firemen became more and more important to the for-
tunes of the team, with relievers like Ron Perranoski pitching as many as six innings in a game. The single most important baseball event in the twenti-eth century was probably the abolition of the reserve clause and the birth of free agency that gave players the opportunity to negotiate with any team afterfulfilling their contractual responsibilities to their original team. That deci-sion, made by arbitrator Peter Seitz, set in motion a chaotic era that contin-ues to this day, with skyrocketing salaries caused by teams bidding for theservices of the best players. Free agency also resulted in the appearance of player agents, who helped their clients negotiate more lucrative contracts. As
a result of free agency and the new salary scale, club owners and player agentsalike began to be more protective of their valuable property. Over the nexttwo decades, starting pitchers pitched fewer and fewer complete games asowners, who were concerned about possible injuries to a pitcher’s multi-mil-lion dollar arm, did not want to overwork them. Relief pitchers were broughtinto a game earlier and earlier each decade. As a result, relief pitching becamemore specialized, developing to the point in which today every team has long relievers, situational pitchers, setup men, and closers who normally pitch only one inning in a game and seldom pitch two consecutive games.
Originally, pitchers were evaluated based only on their pitching contri-butions, their won-lost percentage, the number of complete games they pitched, the number of innings per game they pitched, and their earned runaverage. As the game has evolved, other more equitable means of comparing
5. Baseball’s Greatest Pitchers 101

7/25/2019 McNeil - All-Stars for All Time
http://slidepdf.com/reader/full/mcneil-all-stars-for-all-time 113/247

7/25/2019 McNeil - All-Stars for All Time
http://slidepdf.com/reader/full/mcneil-all-stars-for-all-time 114/247
Alexander finished first in the category with a +.108 differential and the max-imum 45.000 point total. Walter Johnson came in second with a +.107 dif-ferential and a point total of 44.583. He was followed closely by Sandy Koufax,
who had a differential of +.105 and a point total of 43.750. Whitey Ford, whohad the highest winning percentage of any pitcher, finished eighth with a +.089 differential and a 37.083 point total. Jim Palmer was last in the cate-gory with a winning percentage differential of +.049 and a point total of 20.416.
Normalized AdjustedEarned Run Average (NAERA)
The Adjusted ERA was arrived at by comparing the pitcher’s ERA to theleague average ERA and then factoring in the pitcher’s home park factor. Theunadulterated ERAs of the 22 pitchers ranged from 1.82 for Ed Walsh to 4.04for Wes Ferrell. Naturally the lowest ERAs belonged to pitchers whose careersspanned the dead ball era, between 1902 and 1917—Ed Walsh and Addie Joss.The highest ERA of 4.04 belonged to Wes Ferrell, who pitched in the firsthigh ERA era, between 1929 and 1938, when the league ERA fluctuatedbetween 4.04 and 5.04, with an average in the 4.50 range. That era also
defined the greatness of Lefty Grove, whose career paralleled that of Wes Fer-rell. While the rest of the American League was showing an ERA of about4.50, Grove was sensational with a career ERA of 3.06.
Grove, not surprisingly, compiled an adjusted ERA of 1.48 that won himfirst place with a normalized point total of 45.000. Walter Johnson (2.17 ERA)and Ed Walsh (1.82 ERA) finished in a tie for second place with a point totalof 44.088. Steve Carlton finished 21st with an adjusted ERA of 1.15 and a point total of 34.966. Nolan Ryan was 22nd with an adjusted ERA of 1.12and a point total of 34.054.
Final Pitching Ratings
The final pitching ratings are shown below. The point totals for pitch-ing accounted for 90 percent of the pitchers’ final all-around point totals. A pitcher’s offense accounted for 6 percent of his final point totals and his field-ing accounted for 4 percent of the total.
Final NWLPD NAERA Total Pitching
Name × 45 × 45 Points Ratings
Walter Johnson 44.583 44.088 88.671 1
Lefty Grove 42.500 45.000 87.500 2
5. Baseball’s Greatest Pitchers 103

7/25/2019 McNeil - All-Stars for All Time
http://slidepdf.com/reader/full/mcneil-all-stars-for-all-time 115/247
G.C. Alexander 45.000 41.047 86.047 3
Cy Young 42.500 41.959 84.459 4
Sandy Koufax 43.750 39.831 83.581 5
Tom Seaver 42.500 38.615 81.115 6
Christy Mathewson 36.667 41.351 78.018 7
Whitey Ford 37.083 40.439 77.522 8
Dizzy Dean 34.583 39.527 74.110 9
Nolan Ryan 40.000 34.054 74.054 10
Carl Hubbell 32.389 39.527 71.916 11Ed Walsh 26.667 44.088 70.755 12
Mordecai Brown 27.500 41.959 69.459 13
Juan Marichal 31.250 37.095 68.345 14
Addie Joss 24.167 43.176 67.343 15
Wes Ferrell 30.000 35.574 65.574 16
Bob Gibson 26.667 38.615 65.282 17
Warren Spahn 27.917 35.878 63.795 18
Bob Feller 23.750 37.095 60.845 19Eddie Plank 22.500 37.095 59.595 20
Jim Palmer 20.416 38.007 58.423 21
Steve Carlton 22.083 34.966 57.049 22
Offensive Ratings
Pitchers from the early days of the game, from 1893 to the 1920s and
beyond, were expected to excel in the offensive and defensive categories com-pared to their more modern counterparts. In the early days, with limited ros-ters, players had to be more versatile and were expected to help the team withtheir bat and glove. Jack Stivetts, for instance, one of the aces of the BostonBeaneater championship teams of the 1890s, played outfield in 192 games,plus every infield position, while pitching in 388 games with a 203–132 won-lost record. Walter Johnson played the outfield in California before he joinedthe Washington Senators, and he even played 13 games in the outfield for theSenators. And Wes Ferrell played 13 games in the outfield in 1933 for theCleveland Indians to take advantage of his big bat. He also fielded 1.000 that
year. One pitcher, Smoky Joe Wood, even reinvented himself as an outfielderafter his arm went dead in 1913. The fireballing right-hander, who sparkedthe Boston Red Sox to the world championship in 1912 when he went 34–5,
104 A LL-STARS FOR A LL TIME
Final NWLPD NAERA Total Pitching
Name × 45 × 45 Points Ratings
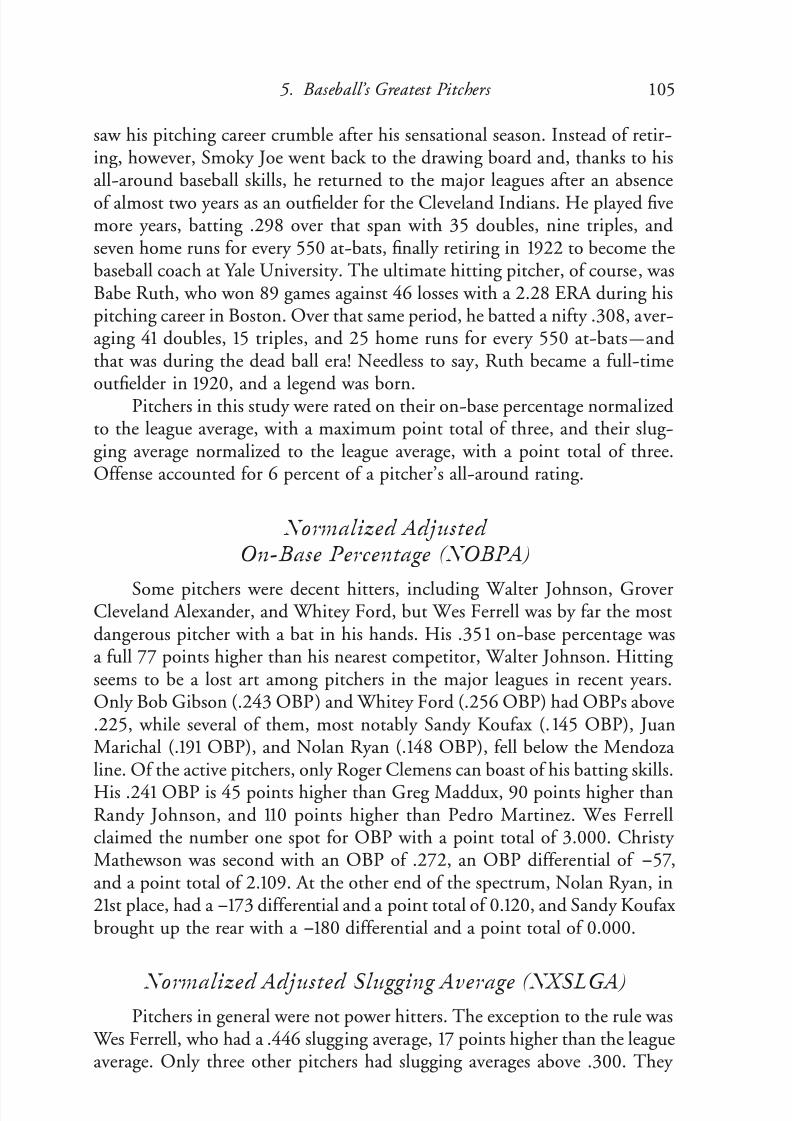
7/25/2019 McNeil - All-Stars for All Time
http://slidepdf.com/reader/full/mcneil-all-stars-for-all-time 116/247
saw his pitching career crumble after his sensational season. Instead of retir-ing, however, Smoky Joe went back to the drawing board and, thanks to hisall-around baseball skills, he returned to the major leagues after an absence
of almost two years as an outfielder for the Cleveland Indians. He played fivemore years, batting .298 over that span with 35 doubles, nine triples, andseven home runs for every 550 at-bats, finally retiring in 1922 to become thebaseball coach at Yale University. The ultimate hitting pitcher, of course, wasBabe Ruth, who won 89 games against 46 losses with a 2.28 ERA during hispitching career in Boston. Over that same period, he batted a nifty .308, aver-aging 41 doubles, 15 triples, and 25 home runs for every 550 at-bats—andthat was during the dead ball era! Needless to say, Ruth became a full-time
outfielder in1
920, and a legend was born.Pitchers in this study were rated on their on-base percentage normalizedto the league average, with a maximum point total of three, and their slug-ging average normalized to the league average, with a point total of three.Offense accounted for 6 percent of a pitcher’s all-around rating.
Normalized AdjustedOn-Base Percentage (NOBPA)
Some pitchers were decent hitters, including Walter Johnson, GroverCleveland Alexander, and Whitey Ford, but Wes Ferrell was by far the mostdangerous pitcher with a bat in his hands. His .351 on-base percentage wasa full 77 points higher than his nearest competitor, Walter Johnson. Hitting seems to be a lost art among pitchers in the major leagues in recent years.Only Bob Gibson (.243 OBP) and Whitey Ford (.256 OBP) had OBPs above.225, while several of them, most notably Sandy Koufax (.145 OBP), JuanMarichal (.191 OBP), and Nolan Ryan (.148 OBP), fell below the Mendoza line. Of the active pitchers, only Roger Clemens can boast of his batting skills.
His .241 OBP is 45 points higher than Greg Maddux, 90 points higher thanRandy Johnson, and 110 points higher than Pedro Martinez. Wes Ferrellclaimed the number one spot for OBP with a point total of 3.000. Christy Mathewson was second with an OBP of .272, an OBP differential of !57,and a point total of 2.109. At the other end of the spectrum, Nolan Ryan, in21st place, had a !173 differential and a point total of 0.120, and Sandy Koufax brought up the rear with a !180 differential and a point total of 0.000.
Normalized Adjusted Slugging Average (NXSLGA)Pitchers in general were not power hitters. The exception to the rule was
Wes Ferrell, who had a .446 slugging average, 17 points higher than the leagueaverage. Only three other pitchers had slugging averages above .300. They
5. Baseball’s Greatest Pitchers 105

7/25/2019 McNeil - All-Stars for All Time
http://slidepdf.com/reader/full/mcneil-all-stars-for-all-time 117/247
were Walter Johnson (.342), Dizzy Dean (.301) and Bob Gibson (.301). Of course, slugging averages have been on the increase in recent times becauseof the lively ball and the smaller ballparks. When Addie Joss pitched, the
league slugging average was just .334, and during Walter Johnson’s career, it was .359. It spiked to .402 in the 1930s, fell as low as .339 in 1968, bouncedback to the .370s and .380s in the 1980s, and then exploded to about .430after the Costa Rican rabbit ball was introduced in 1993. In 2006, the leagueslugging averages were .420 in the American League and .409 in the NationalLeague. Today’s pitchers, however, have not kept pace with the league. Ingeneral, they are a sorry lot with a bat in their hands. Of the four active pitch-ers who were reviewed in this study, only Roger Clemens (.212) and Greg
Maddux (.21
2) had slugging averages above .200. Randy Johnson was at .1
57,and Pedro Martinez could do no better than .114.
Final Offensive Ratings
It was strictly no contest for the game’s greatest offensive pitcher. WesFerrell was number one for both NOBPA and NXSLGA by wide margins.
Walter Johnson and Christy Matheson finished second and third, respectively, while Sandy Koufax and Carl Hubbell anchored the list .
Final NOBPA NXSLGA Total Offensive
Name × 3 × 3 Points Ratings
W. Johnson 1.989 2.658 4.647 2
G.C. Alexander 1.389 1.755 3.144 10
C. Mathewson 2.109 2.067 4.176 3
L. Grove 0.393 0.621 1.014 19
S. Koufax 0.000 0.000 0.000 22B. Feller 0.789 0.942 1.731 18
W. Spahn 1.440 1.707 3.147 9
D. Dean 1.218 1.776 2.994 11
B. Gibson 1.560 1.887 3.447 6
T. Seaver 1.218 1.095 2.313 15
J. Palmer 0.960 1.173 2.133 16
J. Marichal 0.789 0.963 1.752 17
S. Carlton 1.200 1.515 2.715 12
E. Plank 1.818 1.827 3.645 4
W. Ford 1.782 0.882 2.664 13
A. Joss 1.113 1.374 2.487 14
E. Walsh 1.440 2.088 3.528 5
106 A LL-STARS FOR A LL TIME

7/25/2019 McNeil - All-Stars for All Time
http://slidepdf.com/reader/full/mcneil-all-stars-for-all-time 118/247
M. Brown 1.491 1.857 3.348 7
Cy Young 1.251 1.947 3.198 8
N. Ryan 0.120 0.402 0.522 20
W. Ferrell 3.000 3.000 6.000 1
C. Hubbell 0.717 0.108 0.825 21
With a near .700 winning percentage, Pedro Martinez will go down in baseball loreas one of the greatest pitchers in the history of the game (courtesy Julie Cordeiro).
Final NOBPA NXSLGA Total Offensive
Name × 3 × 3 Points Ratings

7/25/2019 McNeil - All-Stars for All Time
http://slidepdf.com/reader/full/mcneil-all-stars-for-all-time 119/247

7/25/2019 McNeil - All-Stars for All Time
http://slidepdf.com/reader/full/mcneil-all-stars-for-all-time 120/247

7/25/2019 McNeil - All-Stars for All Time
http://slidepdf.com/reader/full/mcneil-all-stars-for-all-time 121/247
Nevertheless, the ratings demonstrated without a doubt that the individual’spitching skills far outweighed any other skill the pitcher might have had.
Final NPitching NOffense NDefense Total All-Around
Name × 90 × 6 × 4 Points Ratings HOF
W. Johnson 88.671 4.647 2.290 95.608 1 *
G. Alexander 86.047 3.144 3.137 92.328 2 *
Cy Young 84.459 3.198 2.740 90.397 3 *
Lefty Grove 87.500 1.014 1.748 90.262 4 *
Tom Seaver 81.115 2.313 2.412 85.840 5 *
C. Mathewson 78.018 4.176 3.438 85.632 6 *Sandy Koufax 83.581 0.000 1.310 84.891 7 *
Whitey Ford 77.522 2.664 2.621 82.807 8 *
Dizzy Dean 74.110 2.994 1.598 78.702 9 *
Ed Walsh 70.755 3.528 3.770 78.053 10 *
Nolan Ryan 74.054 0.522 1.127 75.703 11 *
M. Brown 69.459 3.348 2.770 75.577 12 *
Carl Hubbell 71.916 0.825 2.186 74.927 13 *
Wes Ferrell 65.574 6.000 3.283 74.857 14
Addie Joss 67.343 2.487 3.626 73.456 15 * Juan Marichal 68.345 1.752 2.342 72.439 16 *
Bob Gibson 65.282 3.447 1.953 70.282 17 *
Warren Spahn 63.795 3.147 2.186 69.128 18 *
Eddie Plank 59.595 3.649 2.415 65.659 19 *
Bob Feller 60.845 1.731 1.893 64.469 20 *
Jim Palmer 58.423 2.133 2.541 63.097 21 *
Steve Carlton 57.049 2.715 1.781 61.545 22 *
Note: HOF denotes a member of the National Baseball Hall of Fame.
One question remained to be addressed and resolved before the ratingscould be finalized. Several polls over the years have selected Sandy Koufax asthe greatest pitcher of all-time, but in this study, based on a player’s entirecareer, Koufax finished in seventh place. The great Dodger southpaw actu-ally had two distinct and separate careers, as noted earlier. Between 1961 and1966, he completely dominated the National League, leading the league in
ERA five times, strikeouts four times, victories three times, winning percent-age twice, complete games twice, shutouts three times, and innings pitchedtwice. In an effort to clarify Koufax’s place in pitching history, his statistics
were re-evaluated using only his last six years, his “Hall of Fame” years, todetermine his rating. When that was done, Koufax did finish number one all-
110 A LL-STARS FOR A LL TIME

7/25/2019 McNeil - All-Stars for All Time
http://slidepdf.com/reader/full/mcneil-all-stars-for-all-time 122/247

7/25/2019 McNeil - All-Stars for All Time
http://slidepdf.com/reader/full/mcneil-all-stars-for-all-time 123/247
C. Young 77.0 70.0 2 3
N. Ryan 21.5 15.9 20 11
W. Ferrell 31.1 62.2 6 14
C. Hubbell 38.8 51.7 8 13
The active pitchers noted at the beginning of this chapter were also eval-uated for their pitching, batting, and fielding skills, using the same formulasas were used above. Their Pitching Wins (PW) was also reviewed, and by either method, at least three of them—Pedro Martinez, Roger Clemens, and
Randy Johnson—gave indications that, when they retire, they could be ratedin the top ten all-time. Pedro Martinez has an outside chance of challenging
Walter Johnson as the greatest pitcher in baseball history, but depending onthe severity of Martinez’s downside as his career comes to a close, he may fallshort of the top spot. Greg Maddux may not make the top ten because of hislow ratings for both his won-lost differential and his adjusted ERA. TomGlavine may also fail to make the top ten for the same reasons, and will prob-ably fall somewhere below Maddux.
112 A LL-STARS FOR A LL TIME
PW per PW McNeil Name PW 20 Years Rating Rating

7/25/2019 McNeil - All-Stars for All Time
http://slidepdf.com/reader/full/mcneil-all-stars-for-all-time 124/247
C HAPTER 6
Baseball’s GreatestFirst Basemen
There were a total of 20 first basemen competing for the title of base-ball’s greatest first baseman.
• Lou Gehrig was an outstanding pitcher in college, once striking out 17men in a game against Williams College. Like Ruth and other pitchers
who carried a big bat, he was converted to an everyday player, a firstbaseman, when he entered professional baseball. The husky 6', 200-
pound left-handed slugger was one of the game’s great hitters, but he was never more than an average defensive first baseman in spite of themany hours he worked on his fielding. Gehrig was one of baseball’s mostdurable players. Called “the Iron Horse,” he set a major league record by playing in 2,130 consecutive games, a record that lasted fifty years untilCal Ripken, Jr., broke it. Gehrig’s career was filled with highlights. In1927, when the entire American League hit 439 home runs, Babe Ruthhit 60 for the Yankees and Gehrig was right behind him with 47. Thenext-highest home run total was 18 hit by teammate Tony Lazzeri. In
1935, Lou Gehrig won the Triple Crown, batting .363 with 49 homeruns and 165 RBIs. In all, the Iron Horse led the league in home runsthree times and in runs batted in five times. His 0.92 RBIs per game isthe highest average in modern major league history. And like most of thegreat hitters of the early days, he was a contact slugger, rarely striking out. During his career, Gehrig averaged 34 homers for every 550 at-bats,
while striking out only 54 times and walking 103 times. He was electedto the Baseball Hall of Fame in 1939.
• Jimmie Foxx was a rarity, a catcher who was versatile enough to play most any position on the field. When he arrived in Philadelphia in1925, Connie Mack already had a catcher, a young man named Mickey
113

7/25/2019 McNeil - All-Stars for All Time
http://slidepdf.com/reader/full/mcneil-all-stars-for-all-time 125/247
114 A LL-STARS FOR A LL TIME
Lou Gehrig (left) and Hank Greenberg were two of the most devastating sluggers of the 1930s.

7/25/2019 McNeil - All-Stars for All Time
http://slidepdf.com/reader/full/mcneil-all-stars-for-all-time 126/247
Cochrane. Cochrane had been tried at several other positions and hadbeen found wanting. Foxx, on the other hand, was a talented and skillfuloutfielder and third baseman, and he played third base for a short time.
When injuries finally ended Joe Hauser’s career, the affable Foxx movedacross the diamond to first base, where he became one of the greatest firstbasemen in major league history. In addition to his slugging prowess,leading the league in batting twice, on-base percentage three times, homeruns four times, slugging average five times, and runs batted in threetimes, he also led the league in fielding percentage three times. Thesolidly built farm boy from Sudlersville, Maryland, with the unsettling nickname “the Beast,” packed 195 pounds of muscle on his six-foot
frame, and he tortured opposing pitchers for 20 years, driving extra-basehits to all parts of the ballpark, off the fences and over them, while com-piling a .325 career batting average. Foxx entered the Baseball Hall of Fame in 1951.
• Hank Greenberg was one of baseball’s great clutch hitters, averaging 0.92runs batted in per game, just behind Lou Gehrig. The 6'3", 210-poundright-handed hitter was also one of the game’s first free swingers, averag-ing 85 strikeouts a game in an era when most players felt it was humiliat-ing to strike out. “Hammerin’ Hank,” as he was called, led the AmericanLeague in RBIs four times, doubles twice, home runs four times, bases onballs twice, slugging percentage once, and fielding percentage once. TheNew York native was one of the first players to enlist in the U.S. military in World War II, entering the army in the spring of 1941 while at thepeak of his baseball career. He served his country for four years, being discharged in 1945. He retired after the 1947 season at the age of 36.Some of Greenberg’s feats were otherworldly. For instance, he slammed63 doubles in 1934, the fourth-highest total of all-time. Three years later,
he drove in 183 runs, the third-highest total in baseball history, and in1938 he hit 58 home runs, second to Babe Ruth at the time. When Hank Greenberg began his professional career in 1930, he was considered to beclumsy and uncoordinated, but through countless hours of hard work, hebecame a better-than-average defensive first baseman with a reliable gloveand good range. He is a 1956 member of the Baseball Hall of Fame.
• Harmon Killebrew was a powerful six-foot tall, 215-pound right-handedslugging machine from Payette, Idaho, who starred for the Washington
Senators and Minnesota Twins, beginning in1
954 before playing forKansas City in his final season in 1975. During the peak of his career,from 1959 through 1971, the man they called “Killer” terrorized AmericanLeague pitchers, averaging over 40 home runs a year. He hit more than40 home runs eight times, with a high of 49 homers in both 1964 and
6. Baseball’s Greatest First Basemen 115

7/25/2019 McNeil - All-Stars for All Time
http://slidepdf.com/reader/full/mcneil-all-stars-for-all-time 127/247

7/25/2019 McNeil - All-Stars for All Time
http://slidepdf.com/reader/full/mcneil-all-stars-for-all-time 128/247
homers for every 550 at-bats. Still, the graceful left-handed hitting Mize,like many of the other big sluggers of his day, also had a good batting eye, striking out only 43 times a season, while walking 73 times and driv-
ing in 114 runs. He batted over .300 nine times in twelve years and drovein more than 100 runs eight times. He led the league in batting once,home runs four times, doubles once, triples once, runs batted in threetimes, and slugging percentage four times. He hit 51 home runs in 1947,
when hitting 51 home runs meant something, and he hit three home runsin a Game Six times. Johnny Mize was elected to the Baseball Hall of Fame in 1981.
• George Sisler was a smooth-swinging left-handed contact hitter with lit-
tle power. He had a .340 career batting average, number 14 all-time, andhe struck out only 22 times a season. At the same time, he had only 46extra-base hits, including six home runs, and he walked only 31 times,giving him a .379 on-base percentage and a .468 slugging average.Known as “Gorgeous George,” the 5'11", 170-pound first sacker wasconsidered to be one the top two first basemen in baseball history during the first thirty years of the twentieth century, but his standing has slippedsomewhat with the emergence of the big sluggers who now dominate theposition. Sisler twice batted over .400, leading the league in batting in
1920 with an average of .407 and repeating in 1922 when he hit .420. Inthe former year, he set a major league record of 257 base hits that stoodfor more than eighty years until it was broken by Ichiro Suzuki. In 1922,he also led the league with 134 runs scored, 246 base hits, and 18 triples.The Ballplayers noted that “In the field Sisler was fast, adroit, and grace-ful, a combination that gave elegance to his execution of plays.” Sisler’s1,528 career assists rank third all-time behind Eddie Murray and KeithHernandez. He was elected to the Baseball Hall of Fame in 1939.
• Willie “Stretch” McCovey, standing an imposing 6'4" tall and weighinga powerful 210 pounds, struck fear into the hearts of opposing pitchers.The left-handed slugger enjoyed a 22-year career in the major leagues,most of it with the San Francisco Giants, where in 1962 he came withinan inch or two of becoming a legend. In the World Series that year, theGiants were trailing the New York Yankees, 1–0, in the bottom of theninth inning of Game Seven, when they put the potential tying and
winning runs on second and third with two men out. Yankee pitcherRalph Terry faced McCovey, who had tripled in his previous at bat. Terry
worked the count to 1–1 when McCovey, a dead pull hitter, tied into a pitch and sent a screamer toward right-center field. Yankee second base-man Bobby Richardson moved slightly to his left, threw his glove intothe air, and snatched the ball, ending the Series and McCovey’s dream
6. Baseball’s Greatest First Basemen 117

7/25/2019 McNeil - All-Stars for All Time
http://slidepdf.com/reader/full/mcneil-all-stars-for-all-time 129/247
of glory. The big first baseman, who was noted for his bat and not hisglove, averaged 35 home runs for every 550 at-bats, one of the highesthome run averages in major league history. He led the league in homeruns three times, RBIs twice, and slugging average three times. He wasa 1986 entry to the Baseball Hall of Fame.
• Eddie Murray, at 6'2" tall and weighing 220 pounds, was one of thegame’s greatest switch-hitters, and one of its best all-around first base-men. His 22-year major league career produced 3,255 base hits, 504home runs, 1917 RBIs, and a .993 fielding average. He was voted the
American League’s Rookie of the Year in 1977, when he was used as a designated hitter. Later, after becoming Baltimore’s first baseman, he won
three consecutive Gold Gloves. Murray, who accumulated 560 doubles,35 triples, and 504 home runs in his notable career, is one of the few major league hitters to accumulate more than 1,000 extra-base hits. Heis eighth all-time in games played, fifth in at-bats, 11th in base hits, 13thin doubles, 15th in home runs, ninth in total bases, eighth in RBIs, thirdin putouts, first in assists, and second in double plays. His outstanding all-around play earned him election to the Baseball Hall of Fame in2003.
• Keith Hernandez was another of the outstanding all-around first basementhat thrilled baseball fans across the country during the twentieth cen-tury. The handsome Californian played major league baseball for seven-teen years, including nine years with the St. Louis Cardinals and six years
with the New York Mets. He helped both teams win world champion-ships, the Cardinals in 1982 and the Mets four years later. Hernandez’steams won 15 games against eight losses in post-season play, including theNational League Championship Series, and although he batted a modest.263, he drove in 16 runs. During his career, the smooth-swinging lefty
batted a cool .296, averaging 32 doubles, four triples, and 12 home runsfor every 550 at-bats. In 1979 he tied for the National League’s MostValuable Player award, while leading the league in batting (.344), runsscored (116), doubles (48), and on-base percentage (.421). On defense,Hernandez had no equal. He won eleven straight Gold Gloves and set a major league record for the most consecutive seasons leading the leaguein double plays with six. He led the National League in fielding averagetwice, assists five times, and putouts four times. He is tied for ninth all-time in career fielding average, sixth in career double plays, and second in
career assists.
• Norm Cash was a long ball-hitting first baseman who also excelled in thefield. He had a career season with the bat in 1961, leading the AmericanLeague in batting with an average of .361, in base hits with 193, and in
118 A LL-STARS FOR A LL TIME

7/25/2019 McNeil - All-Stars for All Time
http://slidepdf.com/reader/full/mcneil-all-stars-for-all-time 130/247

7/25/2019 McNeil - All-Stars for All Time
http://slidepdf.com/reader/full/mcneil-all-stars-for-all-time 131/247
while leading the league in fielding average three times, double playsthree times, putouts twice, and assists six times. In 1959, he led all Amer-ican League first basemen in games played, innings played, fielding aver-age, putouts, assists, and double plays. The following year he led theleague in all categories except putouts. His .994 career fielding average isnumber nine all-time. But the 5'11", 195-pound right-handed hitter wasmore than just a defensive player. He was also a contact hitter who struck out only 22 times for every 550 at-bats and compiled a career batting average of .284. He batted over .300 three times, including .312 in 1958,
when he led the league with 10 triples, while also hitting 37 doubles and16 home runs with 80 RBIs. Although Power was a good contact hitter,
he was also impatient at the plate, and he walked only 27 times a year,giving him a mediocre .317 on-base percentage.
• Boog Powell was a mighty hulk of a man, standing 6'4" tall and weigh-ing a muscular 240 pounds. The left-handed slugger, Baltimore’s cleanuphitter for the better part of thirteen years, was an imposing figure as hestood at the plate. His handsome, freckled face, topped with a shock of red hair, was a disarming visage that often led to serious difficulty for theopposing pitcher. Powell averaged 27 homers and 92 RBIs a year during his 17-year career. His best years were 1966 (34 homers and 109 RBIs),1969 (when he stroked the ball at a .304 clip with 37 homers and 121
RBIs), and 1970 (35 homers and 114 RBIs). The Orioles won pennantsin each of those years, and they added world championships to the 1966and 1970 American League titles. They also won the American Leaguepennant in 1971 when Powell hit 22 homers and drove in 92 runs. Inaddition to his slugging prowess, Powell was also a decent fielder whosaved his infielders numerous errors by scooping their low throws outof the dirt. He led the league in fielding average in 1975 with a .997
fielding percentage.• Orlando Cepeda, “the Baby Bull,” patrolled first base for the San Fran-
cisco Giants for eight years and the St. Louis Cardinals for three yearsduring his 17-year major league career. He was another powerful sluggerat 6'2", 210 pounds, and he tattooed opposing pitchers to the tune of .297 with 26 home runs and 95 RBIs a year. Unlike Boog Powell, who
was a patient hitter who averaged 101 strikeouts and 82 bases on balls a year, Cepeda walked only 42 times and struck out 81 times for every 550at-bats. The native of Puerto Rico, whose nickname was derived fromhis father’s nickname, Perucho, (“the Bull”), compiled ten .300+ seasons
with a high of .317 in 1959. His best season was 1961 when he batted .311
while leading the National League with 46 home runs and 142 runs bat-ted in. He was also a competent, if not spectacular fielder.
120 A LL-STARS FOR A LL TIME

7/25/2019 McNeil - All-Stars for All Time
http://slidepdf.com/reader/full/mcneil-all-stars-for-all-time 132/247

7/25/2019 McNeil - All-Stars for All Time
http://slidepdf.com/reader/full/mcneil-all-stars-for-all-time 133/247

7/25/2019 McNeil - All-Stars for All Time
http://slidepdf.com/reader/full/mcneil-all-stars-for-all-time 134/247
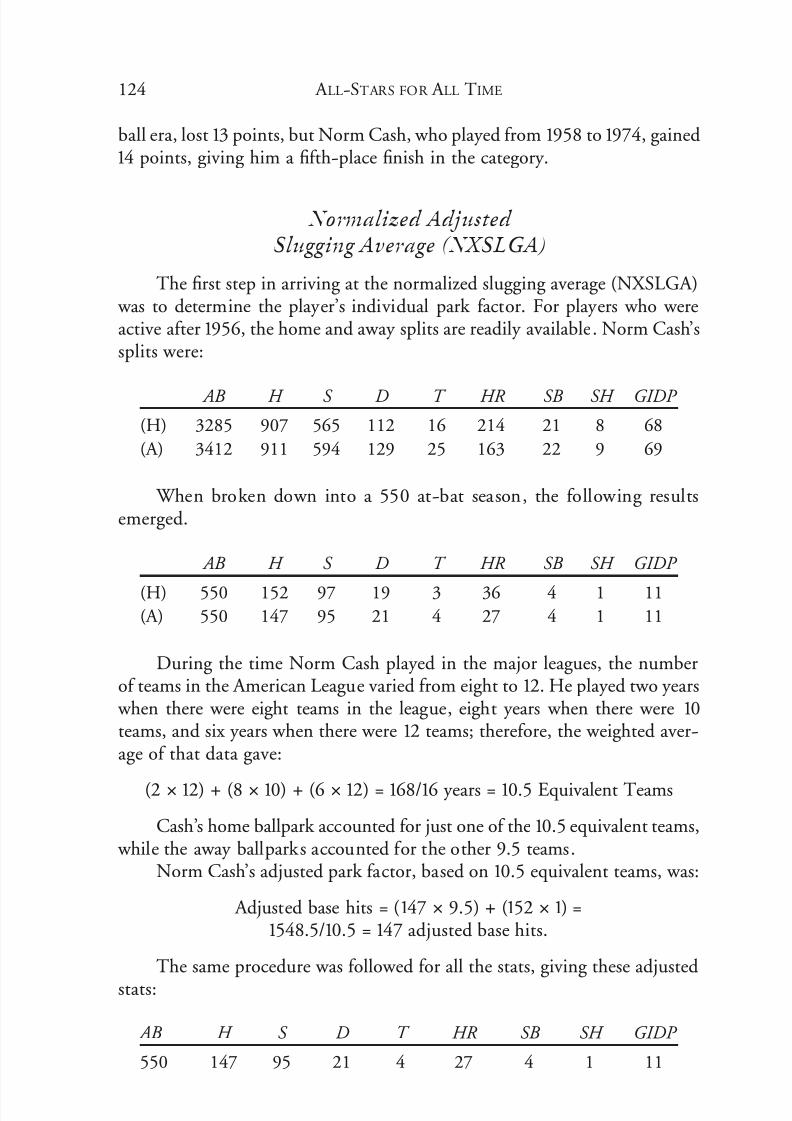
7/25/2019 McNeil - All-Stars for All Time
http://slidepdf.com/reader/full/mcneil-all-stars-for-all-time 135/247

7/25/2019 McNeil - All-Stars for All Time
http://slidepdf.com/reader/full/mcneil-all-stars-for-all-time 136/247

7/25/2019 McNeil - All-Stars for All Time
http://slidepdf.com/reader/full/mcneil-all-stars-for-all-time 137/247

7/25/2019 McNeil - All-Stars for All Time
http://slidepdf.com/reader/full/mcneil-all-stars-for-all-time 138/247

7/25/2019 McNeil - All-Stars for All Time
http://slidepdf.com/reader/full/mcneil-all-stars-for-all-time 139/247
ratings rise, and for Pujols, the sky is the limit. Thome, Thomas, and Helton, who are in decline, will probably see their ratings drop by the time they retire.
As can be seen from the above table, the players with a high NOBPA
were those players who had a decent batting average plus a knack for draw-ing bases on balls. Lou Gehrig, with a .340 batting average and an averageof 105 bases on balls for every 550 at-bats, and Jimmie Foxx, with a .325 bat-ting average and 98 walks, finished first and second, respectively. Anotherplayer who had a good NOBPA was Keith Hernandez, who batted .296 anddrew 80 bases on balls. Sluggers like Gehrig, Foxx, and Greenberg dominatedthe NXSLGA category, while players with less power, like Don Mattingly,Vic Power, George Sisler, and Keith Hernandez, brought up the rear. Not
surprisingly, most first basemen stole very few bases with the exception of George Sisler, who averaged 25, Jeff Bagwell, who averaged 14, and OrlandoCepeda, who averaged 10. The sacrifice hit category is a sign of the times. Inthe old days, prior to 1960, many first basemen were capable of laying downa well-executed sacrifice bunt now and then, but in today’s game the firstbaseman is counted on to hit a home run in that situation. George Sisler aver-aged 15 sacrifice hits a year, Bill Terry averaged 12, and even Lou Gehrig aver-aged seven. In today’s world Fred McGriff never sacrificed in his major leaguecareer, while Jeff Bagwell laid down only three. Not unexpectedly, most first
basemen, being big sluggers, hit into a fair amount of double plays. Only Johnny Mize with eight and Will Clark with nine grounded into fewer than10 double plays a year.
Defensive Ratings
Normalized Fielding Average Differential (NFAD)
The fielding average of the candidates was compared to the league field-ing average during the player’s career, and the differential was normalized,
with a maximum point total of 20. Don Mattingly had the highest fielding average differential, and was awarded 20 points. Vic Power, an outstanding defensive first baseman from 1954 to 1965, had a career fielding average of .994 compared to a league average of .991, giving him 17.500 points. KeithHernandez, Gil Hodges, Bill Terry, Johnny Mize, and Jimmie Foxx, all of
whom had a fielding average that was two points above the league average,earned 15.000 points for their defensive prowess.
Normalized Adjusted Fielding Runs (NAFR)
Range Factor was not considered to be a good measuring stick for firstbasemen since most of their putouts resulted from handling throws on infield
128 A LL-STARS FOR A LL TIME

7/25/2019 McNeil - All-Stars for All Time
http://slidepdf.com/reader/full/mcneil-all-stars-for-all-time 140/247

7/25/2019 McNeil - All-Stars for All Time
http://slidepdf.com/reader/full/mcneil-all-stars-for-all-time 141/247

7/25/2019 McNeil - All-Stars for All Time
http://slidepdf.com/reader/full/mcneil-all-stars-for-all-time 142/247

7/25/2019 McNeil - All-Stars for All Time
http://slidepdf.com/reader/full/mcneil-all-stars-for-all-time 143/247

7/25/2019 McNeil - All-Stars for All Time
http://slidepdf.com/reader/full/mcneil-all-stars-for-all-time 144/247

7/25/2019 McNeil - All-Stars for All Time
http://slidepdf.com/reader/full/mcneil-all-stars-for-all-time 145/247

7/25/2019 McNeil - All-Stars for All Time
http://slidepdf.com/reader/full/mcneil-all-stars-for-all-time 146/247

7/25/2019 McNeil - All-Stars for All Time
http://slidepdf.com/reader/full/mcneil-all-stars-for-all-time 147/247
the league average, his 5,369 career putouts are sixth all-time, his 7,068career assists rank second, and his 1,444 double plays are fifth. TheMechanical Man made everything look easy, on both offense and defense.
• Ryne Sandberg was probably the greatest second baseman in ChicagoCubs history. He was a dazzling defensive second baseman who couldalso contribute with a bat in his hand. He is the all-time leader in careerfielding average with a sensational .989 average, and he is number eightin career assists with 6,363. He established the National League recordfor highest season fielding percentage (.994) and fewest errors in a season(5) in 1986. The eight-time Gold Glove winner led the league in fielding percentage four times, assists seven times, and double plays once. On
offense he was the third major leaguer to steal 50 bases and hit 25 homeruns in the same season, and he led the National League in home runs in1990 with 40. In perhaps his greatest offensive season, in 1984, the 6'2",180-pound right-handed hitter batted .314, with a league-leading 114 runsscored, 200 base hits, 36 doubles, a league-leading 19 triples, 19 homeruns, and 32 stolen bases. And he also led the league in fielding that year
with a .993 average. Over his career, he averaged 86 runs scored, 26 dou-bles, five triples, 18 home runs, and 70 RBIs for every 550 at-bats.
• Rod Carew was one of the greatest hitters of his era. His .328 career bat-
ting average is number thirty all-time. The smooth-swinging left-handedhitter led the American League in hitting seven times, with a high of .388in 1977 when he flirted with the magical .400 mark for most of the sum-mer before tailing off. That year, he led the league in batting, runs scored(128), base hits (239), triples (16), and on-base percentage (.449). Inaddition to his sensational 1997 batting average, he also compiled seasonaverages of .366, .350, .364, and .359. Carew’s secret was his superior batcontrol, his use of the entire field, and his outstanding speed that kept thethird baseman honest. He hit over .300 for fifteen consecutive years, be-
ginning when he won his first batting title at the age of 23. Carew wasalso recognized as one of the game’s best base runners, averaging 21 stolenbases a year, and routinely taking an extra base on lackadaisical outfield-ers. His defense was above average, but not up to that of his world-classrivals.
• Roberto Alomar, a native of Ponce, Puerto Rico, was an outstanding all-around second baseman who batted over .300 nine times on his way to a career .300 batting average, and who led the American League in fielding
percentage three times. The 6',1
80-pound switch-hitter averaged 90 runsscored, 30 doubles, five triples, 13 home runs, and 29 stolen bases forevery 550 at-bats. He was at his best in post-season play where he hit a cool .313 in 58 games, including .347 in two World Series, both won by his Toronto Blue Jays. In the field, he was sure-handed with quick reflexes
136 A LL-STARS FOR A LL TIME
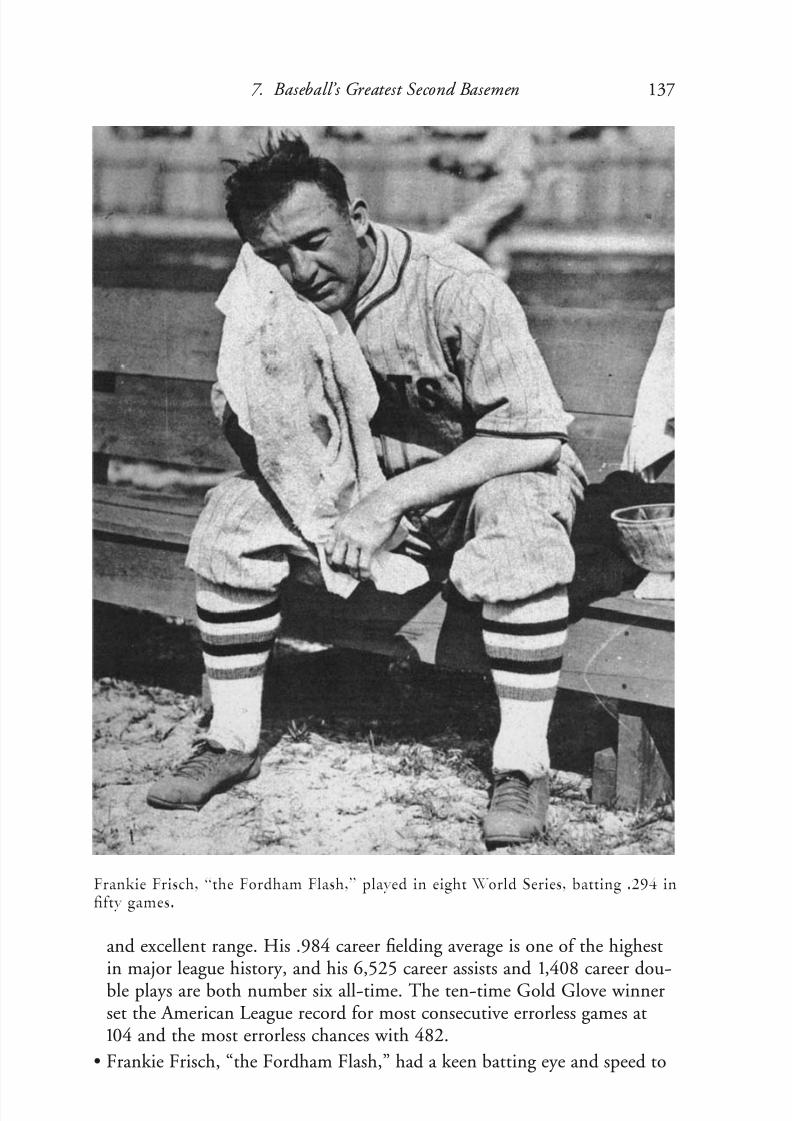
7/25/2019 McNeil - All-Stars for All Time
http://slidepdf.com/reader/full/mcneil-all-stars-for-all-time 148/247

7/25/2019 McNeil - All-Stars for All Time
http://slidepdf.com/reader/full/mcneil-all-stars-for-all-time 149/247

7/25/2019 McNeil - All-Stars for All Time
http://slidepdf.com/reader/full/mcneil-all-stars-for-all-time 150/247

7/25/2019 McNeil - All-Stars for All Time
http://slidepdf.com/reader/full/mcneil-all-stars-for-all-time 151/247

7/25/2019 McNeil - All-Stars for All Time
http://slidepdf.com/reader/full/mcneil-all-stars-for-all-time 152/247
when it came to on-base percentage, which also took into account bases onballs, the OBP leaders were Hornsby (.434), Collins (.424), Jackie Robinson(.409), and Charlie Gehringer (404). Lajoie, who walked only 30 times a
year, and Carew, who walked 60 times, fell back into the pack. Carew, how-ever, profited from the era adjustment that increased his OBP from .393 to
7. Baseball’s Greatest Second Basemen 141
Bobby Doerr was one of the game’s top defensive second basemen.

7/25/2019 McNeil - All-Stars for All Time
http://slidepdf.com/reader/full/mcneil-all-stars-for-all-time 153/247

7/25/2019 McNeil - All-Stars for All Time
http://slidepdf.com/reader/full/mcneil-all-stars-for-all-time 154/247
Morgan laid down three bunts a year, and Joe Gordon and Bill Mazeroskihad four sacrifice hits a year to their credit.
Normalized Double PlaysGrounded Into (NGIDP)
Second basemen were among the faster players on the team and, as a result, they hit into few double plays. Unlike the catchers, who hit into asmany as 25 double plays a year, second basemen only hit into between six and 17 double plays a year. They were led by Joe Morgan with six and Craig Biggio with seven, followed by Lou Whitaker and Ryne Sandberg with nine
each and Nellie Fox with10. Rogers Hornsby, Joe Gordon, and Frankie Frischgrounded into 17 double plays each to bring up the rear.
Final Offensive Ratings
In the final offensive ratings, Rogers Hornsby’s huge lead in the on-basepercentage and slugging average categories were more than enough to earnhim the title of the game’s greatest offensive second baseman. Joe Morganfinished in second place, nosing out Nap Lajoie thanks to his outstanding
speed that gave him important point advantages in both the stolen base andthe grounded into double plays categories. Joe Gordon’s second-place finishin the slugging category was enough to give him fourth place in the finaloffensive ratings, just ahead of Jackie Robinson.
Final NOBPA NXSLGA .05 NSB .05 NSH .05 NGIDP Total Offensive
Name × 20 × 20 × 20 × 20 × 20 Points Rating
J. Robinson 18.863 13.134 0.585 0.429 0.462 33.473 5
R. Hornsby 20.000 20.000 0.220 0.536 0.353 41.109 1 J. Morgan 18.720 13.612 1.000 0.107 1.000 34.439 2
N. Lajoie 18.341 14.328 0.537 0.464 0.462 34.132 3
E. Collins 20.000 10.388 1.000 1.000 0.462 32.850 6
C. Gehringer 18.294 12.955 0.268 0.321 0.545 32.383 7
R. Sandberg 16.303 11.761 0.561 0.071 0.667 29.363 12
R. Carew 19.052 9.791 0.512 0.286 0.462 30.103 10
R. Alomar 17.156 10.507 0.707 0.321 0.462 29.126 13
F. Frisch 16.777 9.313 0.610 0.500 0.353 27.553 15
C. Biggio 17.156 11.284 0.561 0.179 0.857 30.037 11
L. Whitaker 17.251 10.448 0.220 0.214 0.667 28.800 14
J. Gordon 16.398 16.597 0.220 0.143 0.353 33.711 4
B. Doerr 16.635 13.552 0.098 0.321 0.375 30.981 9
7. Baseball’s Greatest Second Basemen 143

7/25/2019 McNeil - All-Stars for All Time
http://slidepdf.com/reader/full/mcneil-all-stars-for-all-time 155/247

7/25/2019 McNeil - All-Stars for All Time
http://slidepdf.com/reader/full/mcneil-all-stars-for-all-time 156/247
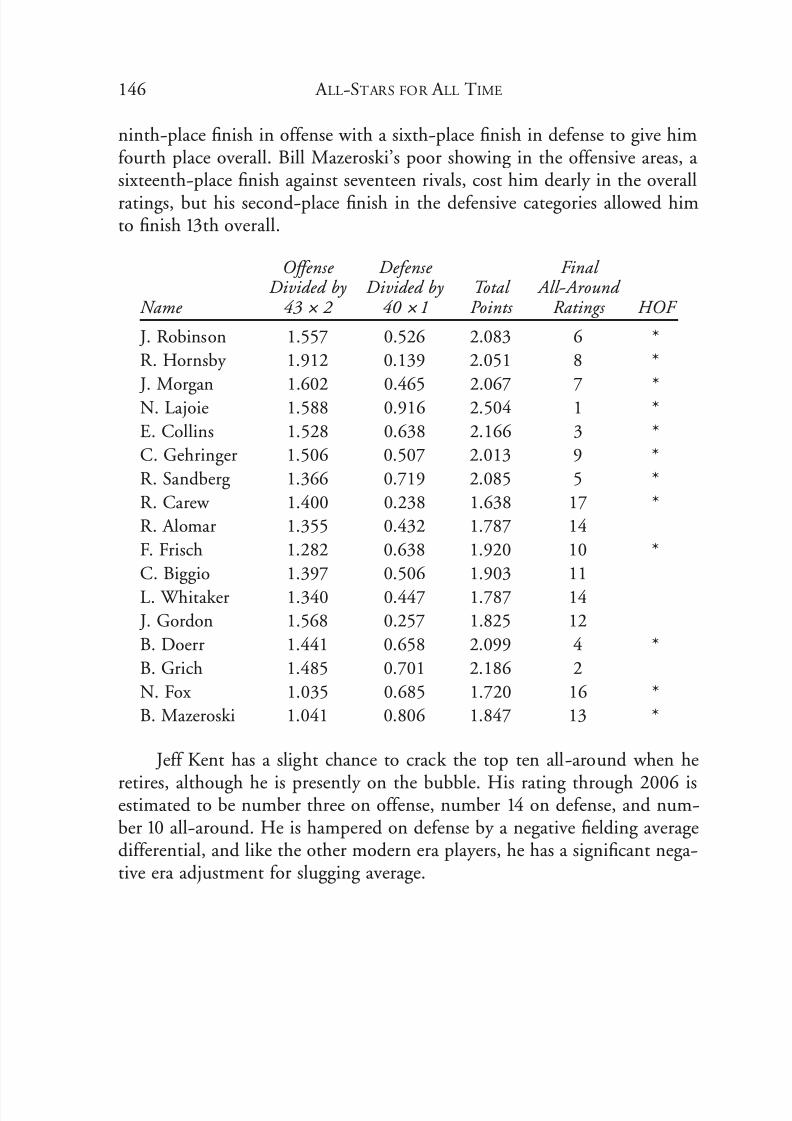
7/25/2019 McNeil - All-Stars for All Time
http://slidepdf.com/reader/full/mcneil-all-stars-for-all-time 157/247
ninth-place finish in offense with a sixth-place finish in defense to give himfourth place overall. Bill Mazeroski’s poor showing in the offensive areas, a sixteenth-place finish against seventeen rivals, cost him dearly in the overall
ratings, but his second-place finish in the defensive categories allowed himto finish 13th overall.
Offense Defense Final Divided by Divided by Total All-Around
Name 43 × 2 40 × 1 Points Ratings HOF
J. Robinson 1.557 0.526 2.083 6 *
R. Hornsby 1.912 0.139 2.051 8 *
J. Morgan 1.602 0.465 2.067 7 *N. Lajoie 1.588 0.916 2.504 1 *
E. Collins 1.528 0.638 2.166 3 *
C. Gehringer 1.506 0.507 2.013 9 *
R. Sandberg 1.366 0.719 2.085 5 *
R. Carew 1.400 0.238 1.638 17 *
R. Alomar 1.355 0.432 1.787 14
F. Frisch 1.282 0.638 1.920 10 *
C. Biggio 1.397 0.506 1.903 11
L. Whitaker 1.340 0.447 1.787 14
J. Gordon 1.568 0.257 1.825 12
B. Doerr 1.441 0.658 2.099 4 *
B. Grich 1.485 0.701 2.186 2
N. Fox 1.035 0.685 1.720 16 *
B. Mazeroski 1.041 0.806 1.847 13 *
Jeff Kent has a slight chance to crack the top ten all-around when he
retires, although he is presently on the bubble. His rating through 2006 isestimated to be number three on offense, number 14 on defense, and num-ber 10 all-around. He is hampered on defense by a negative fielding averagedifferential, and like the other modern era players, he has a significant nega-tive era adjustment for slugging average.
146 A LL-STARS FOR A LL TIME

7/25/2019 McNeil - All-Stars for All Time
http://slidepdf.com/reader/full/mcneil-all-stars-for-all-time 158/247
C HAPTER 8
Baseball’sGreatest Shortstops
Fifteen players competed for the title of major league baseball’s greatestall-time, all-around shortstop.
• Cal Ripken was one of the game’s most amazing players. He becamebaseball’s “Iron Man” on September 6, 1995, when he broke Lou Gehrig’srecord of playing in 2,130 consecutive games. He added another 502games to that record before he took himself out of the lineup on Septem-
ber 20,1998, setting a major league mark that may never be broken—2,632 consecutive games played. But Ripken was more than somebody
who played every day. He was also one of baseball’s greatest shortstops,both offensively and defensively. He was a .276 hitter who averaged 32doubles, 21 home runs, and 81 RBIs for every 550 at-bats. He leads allshortstops in at-bats (11,551), is second to Ernie Banks in home runs(431), second to Honus Wagner in base hits (3,184) and RBIs (1695),and third to Luis Aparicio and Ozzie Smith in games played at shortstop(2,302). On defense, the 6'4", 225-pound Ripken led the league in field-
ing average five times, putouts six times, assists seven times, and doubleplays eight times. His .979 career fielding average is the fifth-highestfielding average in the history of the game. He is number seven in assists(6,977) and number two in double plays (1,565). According to his peers,he was unmatched in positioning himself in the field according to thegame strategy, the score, the pitch count, as well as who the pitcher andbatter were. He always seemed to be in the right place at the right time.
• Honus Wagner has been called the greatest shortstop that ever lived by most baseball experts and with good reason. “The Flying Dutchman,”as he was called, was one of baseball’s first superstars. He was a big,rugged right-handed batter who dominated the shortstop game for
147

7/25/2019 McNeil - All-Stars for All Time
http://slidepdf.com/reader/full/mcneil-all-stars-for-all-time 159/247
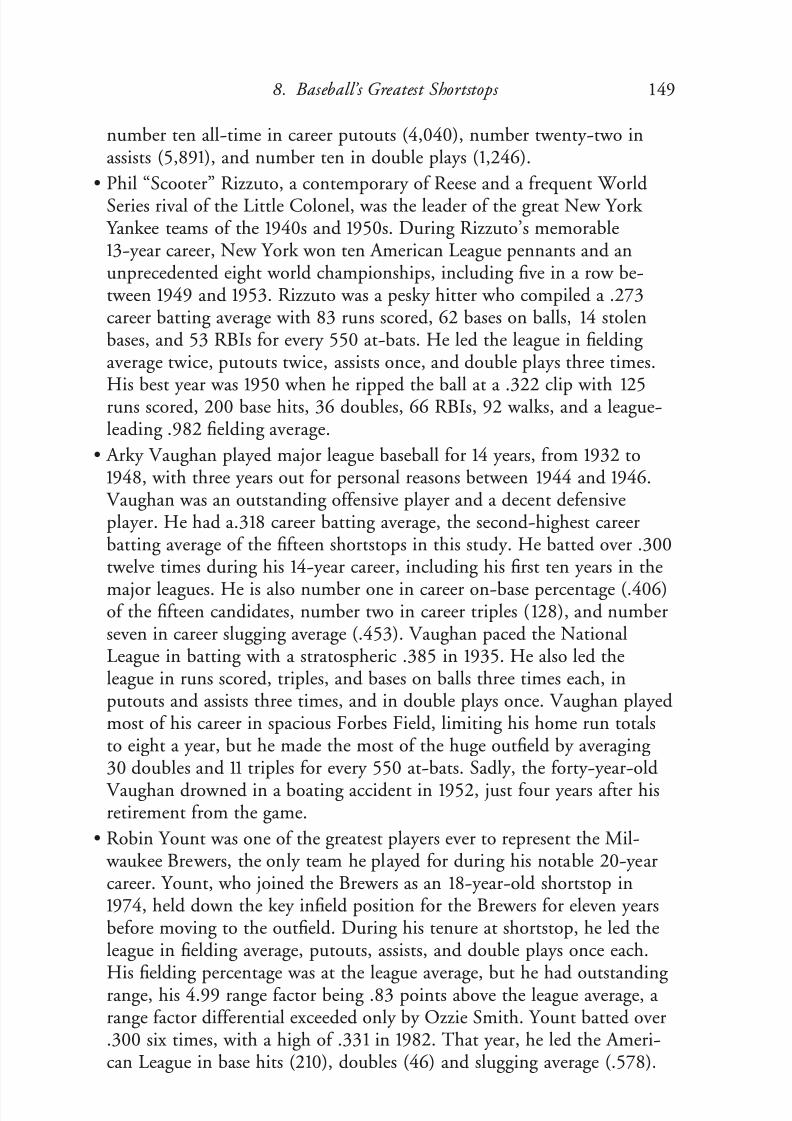
7/25/2019 McNeil - All-Stars for All Time
http://slidepdf.com/reader/full/mcneil-all-stars-for-all-time 160/247

7/25/2019 McNeil - All-Stars for All Time
http://slidepdf.com/reader/full/mcneil-all-stars-for-all-time 161/247

7/25/2019 McNeil - All-Stars for All Time
http://slidepdf.com/reader/full/mcneil-all-stars-for-all-time 162/247
in 1953 after two years with the Kansas City Monarchs of the Negro American League. Banks, who quickly became one of the top sluggersin the big leagues, was a lithe 6'1", 180-pound bundle of energy. As a 23-
year-old rookie in 1954, the man who would earn the sobriquet of “Mr.Cub” smashed 19 home runs and drove in 79 runs, a major accomplish-ment for the youngster. The next year he exploded, batting .295, ham-mering 44 homers, driving in 117 teammates, and leading the NationalLeague with a .972 fielding percentage. During the six-year period from1955 to 1960, Banks slugged 248 home runs, more than any other majorleaguer, including Mickey Mantle (236) and Willie Mays (214). Fromthere his career blossomed into a 19-year love affair with the game hecherished. He was famous for walking into the Cubs’ locker room with a big smile on his face and joyfully pleading, “Let’s play two today.” ErnieBanks retired in 1971 with 512 career home runs, the most home runsever hit by a shortstop. He also hit 407 doubles and 90 triples for a totalof 1,009 extra base hits, number 24 all-time. In the field, he excelled as
well, leading the league in fielding percentage three times, assists twice,and putouts and double plays once each.
• Joe Cronin entered the major leagues in 1926 at the age of 19, and stayedfor twenty years, starring at shortstop both at the plate and in the field.
He fashioned a fancy .301 career batting average over that period, with 37doubles, nine triples, 12 home runs, and 103 RBIs for every 550 at-bats.He led the American League in doubles twice, with 45 in 1933 and with51 in 1938. He also led the league in triples in 1932 with 18. The stocky six-footer was no slouch in the field either, leading the league in fielding percentage twice, and putouts, assists, and double plays three times each.He batted over .300 ten times, with a high of .346 in 1930, the notorious“year of the hitter.” Cronin was famous, not only for his play on the field,but also for his managerial career that began in 1933 when the 26-year-
old shortstop assumed the reins of the Washington Senators and imme-diately led them to the American League pennant. Cronin’s managerialcareer lasted 15 years, during which time his teams won a total of 1,236games against 1,055 losses for an excellent .540 winning percentage.
• Luke Appling, “Old Aches and Pains” as he was called for his constantcomplaints about his physical condition, was a career .310 hitter, thefourth-highest career batting average of the fifteen shortstops in thisstudy. The 5'10", 183-pound right-handed hitter was primarily a singles
hitter, with just 27 doubles, six triples, and three home runs for every 550 at-bats. He had a keen batting eye that rewarded him with 8 1 baseson balls against 33 strikeouts, giving him a .399 on-base percentage, sec-ond only to Arky Vaughan. His .398 slugging percentage, however, wasno better than eleventh out of fifteen. Appling also suffered on defense.
8. Baseball’s Greatest Shortstops 151

7/25/2019 McNeil - All-Stars for All Time
http://slidepdf.com/reader/full/mcneil-all-stars-for-all-time 163/247
His .948 career fielding average was actually four points below the leagueaverage, and his range factor was in the middle of the pack. He did excelin two defensive categories. He led the league in assists seven times and
in double plays three times. He is number seven all-time in careerputouts with 4,398, number five in assists with 7,218, and number fourin double plays with 1,424.
• Lou Boudreau was recognized as the best shortstop in the AmericanLeague almost from day one of his career. He joined the Cleveland Indi-ans in 1939 as a 22-year-old shortstop, and one year later he captured thehearts of the Cleveland fans with his all-around play. He led the leaguein fielding and double plays, and also wielded a potent bat, hitting .295,
with 46 doubles,10 triples, nine home runs, and
105 RBIs. Two yearslater, the precocious infielder was named player-manager of the Cleve-
land team, becoming the youngest manager in major league history. Hecontinued his outstanding all-around play throughout the 1940s, leading the American League in fielding percentage eight times in nine years, andhitting the ball with authority, even winning the batting championship in1944 with a .327 average. In 1948, Boudreau put it all together, guiding the Indians to the world championship with a masterful display of man-aging, hitting, and fielding. First he led his team to the American League
pennant by defeating the Boston Red Sox, 8–3, in a one-game playoff after the two teams had finished the season in a tie for first place. Theboy manager not only made all the right strategic moves, he also puttwo home runs over Fenway Park’s Green Monster and added a single topace his team at the plate. Then, in the World Series against the BostonBraves, won by Cleveland four games to two, he hit .273 with four dou-bles and three RBIs. And Boudreau received one final honor to cap offhis dream season. He won the American League’s Most Valuable Playeraward after ripping the ball at a .355 clip during the regular season, with
18 home runs and 106 RBIs, in addition to leading the league in fielding average and double plays. During his career, Lou Boudreau compiled a career .973 fielding average, a full 19 points above the league average, by far the widest differential of any shortstop in this study.
• Luis Aparicio was a dazzling all-around shortstop for the Chicago WhiteSox from 1956 to 1962, and again from 1968 to 1970. During his 18-yearcareer, the 5'9", 160-pound rabbit covered acres of ground, both offen-sively and defensively, leading the American League in stolen bases his
first nine years in the league and setting the pace in fielding average eightconsecutive years, from 1959 to 1966. Aparicio, as a member of thefamous “Go-Go” Chicago White Sox that ran wild on the bases during the late 1950s by stealing more than 100 bases a year from 1957 through1961 with a high of 113 stolen bases in 1959, led the way with 56 stolen
152 A LL-STARS FOR A LL TIME

7/25/2019 McNeil - All-Stars for All Time
http://slidepdf.com/reader/full/mcneil-all-stars-for-all-time 164/247
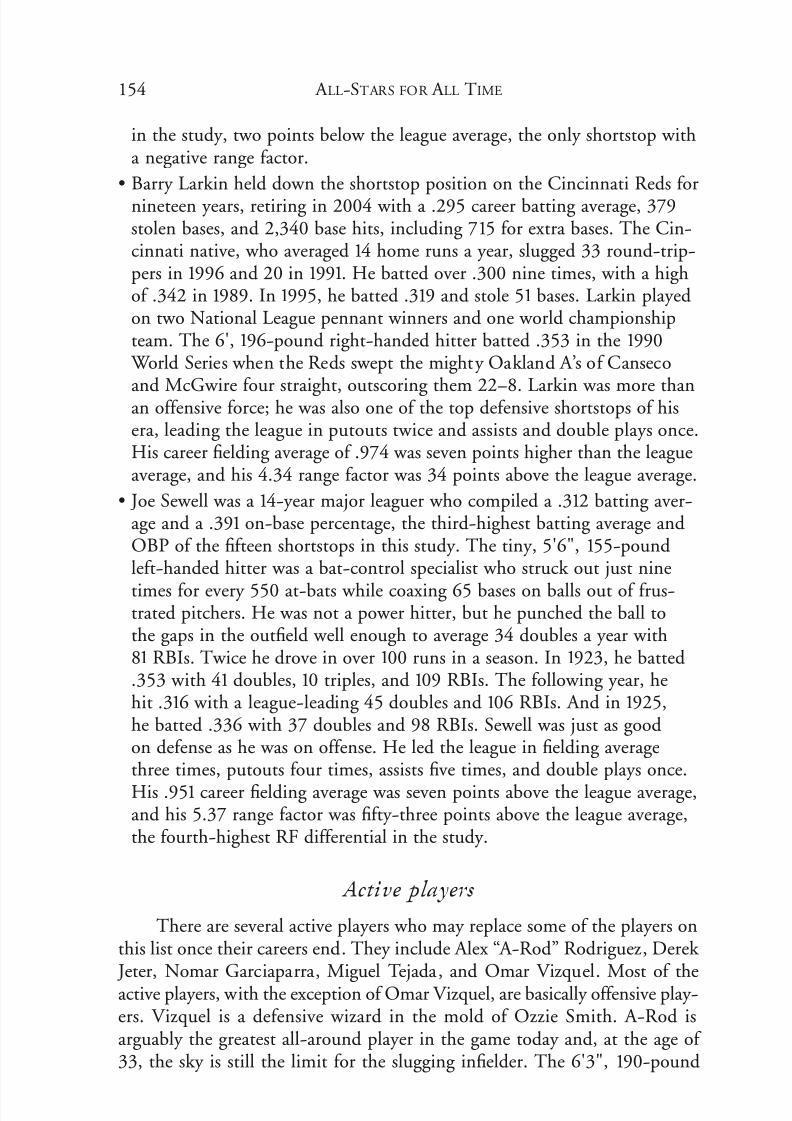
7/25/2019 McNeil - All-Stars for All Time
http://slidepdf.com/reader/full/mcneil-all-stars-for-all-time 165/247
in the study, two points below the league average, the only shortstop witha negative range factor.
• Barry Larkin held down the shortstop position on the Cincinnati Reds fornineteen years, retiring in 2004 with a .295 career batting average, 379stolen bases, and 2,340 base hits, including 715 for extra bases. The Cin-cinnati native, who averaged 14 home runs a year, slugged 33 round-trip-pers in 1996 and 20 in 1991. He batted over .300 nine times, with a highof .342 in 1989. In 1995, he batted .319 and stole 51 bases. Larkin playedon two National League pennant winners and one world championshipteam. The 6', 196-pound right-handed hitter batted .353 in the 1990
World Series when the Reds swept the mighty Oakland A’s of Canseco
and McGwire four straight, outscoring them 22–8. Larkin was more thanan offensive force; he was also one of the top defensive shortstops of hisera, leading the league in putouts twice and assists and double plays once.His career fielding average of .974 was seven points higher than the leagueaverage, and his 4.34 range factor was 34 points above the league average.
• Joe Sewell was a 14-year major leaguer who compiled a .312 batting aver-age and a .391 on-base percentage, the third-highest batting average andOBP of the fifteen shortstops in this study. The tiny, 5'6", 155-poundleft-handed hitter was a bat-control specialist who struck out just nine
times for every 550 at-bats while coaxing 65 bases on balls out of frus-trated pitchers. He was not a power hitter, but he punched the ball tothe gaps in the outfield well enough to average 34 doubles a year with81 RBIs. Twice he drove in over 100 runs in a season. In 1923, he batted.353 with 41 doubles, 10 triples, and 109 RBIs. The following year, hehit .316 with a league-leading 45 doubles and 106 RBIs. And in 1925,he batted .336 with 37 doubles and 98 RBIs. Sewell was just as goodon defense as he was on offense. He led the league in fielding averagethree times, putouts four times, assists five times, and double plays once.
His .951 career fielding average was seven points above the league average,and his 5.37 range factor was fifty-three points above the league average,the fourth-highest RF differential in the study.
Active players
There are several active players who may replace some of the players onthis list once their careers end. They include Alex “A-Rod” Rodriguez, Derek
Jeter, Nomar Garciaparra, Miguel Tejada, and Omar Vizquel. Most of theactive players, with the exception of Omar Vizquel, are basically offensive play-ers. Vizquel is a defensive wizard in the mold of Ozzie Smith. A-Rod isarguably the greatest all-around player in the game today and, at the age of 33, the sky is still the limit for the slugging infielder. The 6'3", 190-pound
154 A LL-STARS FOR A LL TIME

7/25/2019 McNeil - All-Stars for All Time
http://slidepdf.com/reader/full/mcneil-all-stars-for-all-time 166/247
right-handed hitter, now in his fifth year as a third baseman for the New York Yankees, was a shortstop during his first ten years in the major leagues. He isbaseball’s biggest offensive threat at the present time, averaging 39 homers
and 112 RBIs a year to go along with a .306 batting average. He smashed his500th career home run in 2007 and may well crack the 800 home run bar-rier if his health holds up. He is also solid on defense. Jeter is primarily anoffensive player with a career .317 batting average, 102 runs scored, 14 homeruns, and 69 RBIs for every 550 at-bats. Garciaparra is essentially a mirrorimage of Jeter, but he has been injury-prone over the past four years, and thathas had an unfavorable effect on his statistics. Through 2007, Garciaparra hada career batting average of .315, with 93 runs scored, 23 home runs, and 93
RBIs. Tejada, a 31
-year-old run-producer, has a .287 batting average, with86 runs scored, 23 home runs, and 94 RBIs a season. Vizquel, who is near-ing the end of a brilliant career, has a .274 batting average over 18 years, with78 runs scored, four home runs, and 50 RBIs a year. In the field, the forty-one-year-old Venezuelan is a magician, still making defensive plays that tax the imagination. He has led the league in fielding average six times, putoutsonce, and double plays once. Only A-Rod among the other active players hasled the league in fielding average, and he did it once. Vizquel’s .984 careerfielding average is the highest in baseball history.
Offensive Ratings
Normalized AdjustedOn Base Percentage (NOBPA)
Arky Vaughan was the only shortstop with an on-base percentage greaterthan .400, at .406. Luke Appling had an OBP of .399, Joe Sewell and Honus
Wagner were at .391, and Joe Cronin checked in with an even .390. Whenthe statistics were adjusted for the era in which the player was active, Vaughanstill retained his number one ranking with an OBPA of .399, edging Honus
Wagner by .007. Appling finished with an OBPA of .387, the only otherplayer with an OBPA above .373.
Normalized AdjustedSlugging Average (NXSLGA)
There were some notable sluggers patrolling the short field over thedecades, led by Ernie Banks, whose 512 career home runs, an average of 30home runs for every 550 at-bats, propelled him to a career slugging averageof .500. Joe Cronin was next in line, but his .468 SLG left him far in arrears.
8. Baseball’s Greatest Shortstops 155
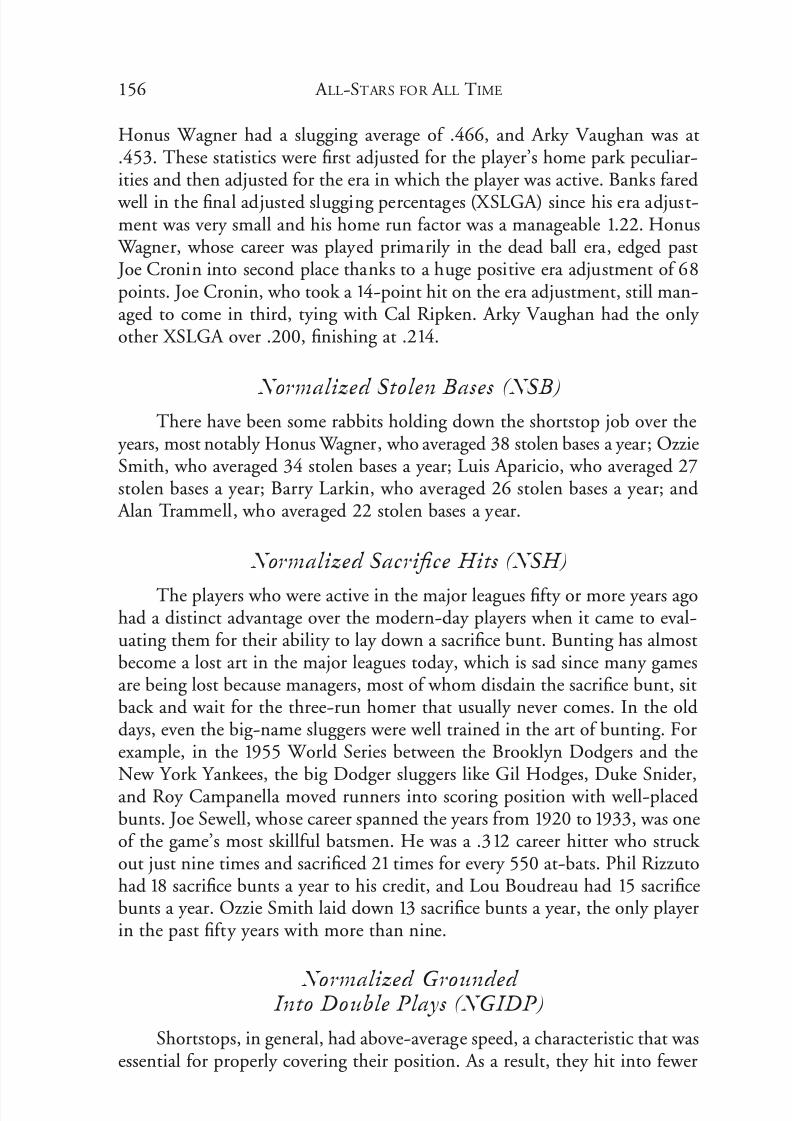
7/25/2019 McNeil - All-Stars for All Time
http://slidepdf.com/reader/full/mcneil-all-stars-for-all-time 167/247
Honus Wagner had a slugging average of .466, and Arky Vaughan was at.453. These statistics were first adjusted for the player’s home park peculiar-ities and then adjusted for the era in which the player was active. Banks fared
well in the final adjusted slugging percentages (XSLGA) since his era adjust-ment was very small and his home run factor was a manageable 1.22. Honus
Wagner, whose career was played primarily in the dead ball era, edged past Joe Cronin into second place thanks to a huge positive era adjustment of 68points. Joe Cronin, who took a 14-point hit on the era adjustment, still man-aged to come in third, tying with Cal Ripken. Arky Vaughan had the only other XSLGA over .200, finishing at .214.
Normalized Stolen Bases (NSB)There have been some rabbits holding down the shortstop job over the
years, most notably Honus Wagner, who averaged 38 stolen bases a year; OzzieSmith, who averaged 34 stolen bases a year; Luis Aparicio, who averaged 27stolen bases a year; Barry Larkin, who averaged 26 stolen bases a year; and
Alan Trammell, who averaged 22 stolen bases a year.
Normalized Sacrifice Hits (NSH)
The players who were active in the major leagues fifty or more years agohad a distinct advantage over the modern-day players when it came to eval-uating them for their ability to lay down a sacrifice bunt. Bunting has almostbecome a lost art in the major leagues today, which is sad since many gamesare being lost because managers, most of whom disdain the sacrifice bunt, sitback and wait for the three-run homer that usually never comes. In the olddays, even the big-name sluggers were well trained in the art of bunting. Forexample, in the 1955 World Series between the Brooklyn Dodgers and theNew York Yankees, the big Dodger sluggers like Gil Hodges, Duke Snider,and Roy Campanella moved runners into scoring position with well-placedbunts. Joe Sewell, whose career spanned the years from 1920 to 1933, was oneof the game’s most skillful batsmen. He was a .312 career hitter who struck out just nine times and sacrificed 21 times for every 550 at-bats. Phil Rizzutohad 18 sacrifice bunts a year to his credit, and Lou Boudreau had 15 sacrificebunts a year. Ozzie Smith laid down 13 sacrifice bunts a year, the only playerin the past fifty years with more than nine.
Normalized GroundedInto Double Plays (NGIDP)
Shortstops, in general, had above-average speed, a characteristic that wasessential for properly covering their position. As a result, they hit into fewer
156 A LL-STARS FOR A LL TIME
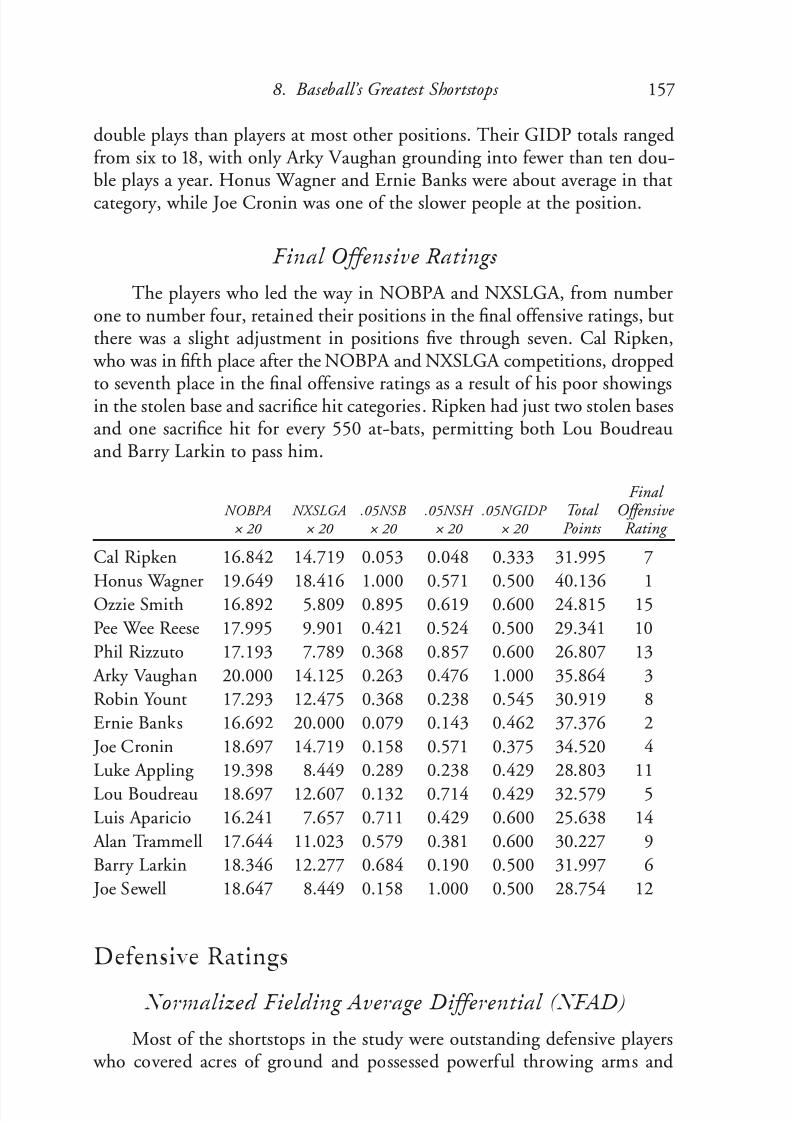
7/25/2019 McNeil - All-Stars for All Time
http://slidepdf.com/reader/full/mcneil-all-stars-for-all-time 168/247
double plays than players at most other positions. Their GIDP totals rangedfrom six to 18, with only Arky Vaughan grounding into fewer than ten dou-ble plays a year. Honus Wagner and Ernie Banks were about average in that
category, while Joe Cronin was one of the slower people at the position.
Final Offensive Ratings
The players who led the way in NOBPA and NXSLGA, from numberone to number four, retained their positions in the final offensive ratings, butthere was a slight adjustment in positions five through seven. Cal Ripken,
who was in fifth place after the NOBPA and NXSLGA competitions, dropped
to seventh place in the final offensive ratings as a result of his poor showingsin the stolen base and sacrifice hit categories. Ripken had just two stolen basesand one sacrifice hit for every 550 at-bats, permitting both Lou Boudreauand Barry Larkin to pass him.
Final NOBPA NXSLGA .05NSB .05NSH .05NGIDP Total Offensive × 20 × 20 × 20 × 20 × 20 Points Rating
Cal Ripken 16.842 14.719 0.053 0.048 0.333 31.995 7
Honus Wagner 19.649 18.416 1.000 0.571 0.500 40.136 1Ozzie Smith 16.892 5.809 0.895 0.619 0.600 24.815 15
Pee Wee Reese 17.995 9.901 0.421 0.524 0.500 29.341 10
Phil Rizzuto 17.193 7.789 0.368 0.857 0.600 26.807 13
Arky Vaughan 20.000 14.125 0.263 0.476 1.000 35.864 3
Robin Yount 17.293 12.475 0.368 0.238 0.545 30.919 8
Ernie Banks 16.692 20.000 0.079 0.143 0.462 37.376 2
Joe Cronin 18.697 14.719 0.158 0.571 0.375 34.520 4
Luke Appling 19.398 8.449 0.289 0.238 0.429 28.803 11
Lou Boudreau 18.697 12.607 0.132 0.714 0.429 32.579 5
Luis Aparicio 16.241 7.657 0.711 0.429 0.600 25.638 14
Alan Trammell 17.644 11.023 0.579 0.381 0.600 30.227 9
Barry Larkin 18.346 12.277 0.684 0.190 0.500 31.997 6
Joe Sewell 18.647 8.449 0.158 1.000 0.500 28.754 12
Defensive Ratings
Normalized Fielding Average Differential (NFAD)
Most of the shortstops in the study were outstanding defensive players who covered acres of ground and possessed powerful throwing arms and
8. Baseball’s Greatest Shortstops 157

7/25/2019 McNeil - All-Stars for All Time
http://slidepdf.com/reader/full/mcneil-all-stars-for-all-time 169/247
dependable gloves. Lou Boudreau, the defensive genius of the great Cleve-land Indian teams of the late 1940s, compiled a brilliant .973 career fielding average, nineteen points above the league average. And he accomplished that
in an era when a shortstop’s glove was half the size of today’s gloves and hada minimum of webbing between the thumb and forefinger. Honus Wagner,the clumsy-looking shortstop of the Pittsburgh Pirates during the first twodecades of the twentieth century, had huge hands and long arms, and he dug balls out of the dirt as if he were wearing a shovel on his arms. Still, his .940fielding average was a full thirteen points above the league average, the sec-ond-best fielding average differential of any of the top fifteen shortstops. OzzieSmith, the “Wizard of Oz,” had a twelve-point differential, while Alan Tram-
mell and Cal Ripken were close behind with ten-point differentials. Ripken’s.979 career fielding average and Smith’s .978 average are numbers five and six all-time, respectively. Alan Trammell’s .977 career fielding average was thetenth-best all-time. Luke Appling and Robin Yount were the only shortstops
who did not have a fielding average above the league average. Yount finishedexactly at the league average, while Appling’s .948 career fielding average wasfour points below the league average.
Normalized Range Factor Differential (NRFD)
Most of the shortstops had outstanding range factors compared to theleague average. The exception was Alan Trammell, whose range factor wastwo points below average. Ozzie Smith, not surprisingly, covered more groundthan God, finishing 93 points above the league average with a range factorof 5.03. Robin Yount’s 4.99 RF gave him an 83-point advantage, the only othershortstop with a range factor differential of more than plus 55. Ripken at plus55 and Joe Sewell and Luis Aparicio at plus 53 points each followed Ripkenand Yount. Honus Wagner, who covered more ground than any other short-
stop of his time, had a 5.63 range factor, 45 points above the league average.
Final Defensive Ratings
Ozzie Smith, who finished third in Normalized Fielding Average Dif-ferential and first in Normalized Range Factor Differential, was crowned king of the defensive shortstops with a convincing lead over Lou Boudreau, whofinished first in NFAD, but could do no better than ninth in NRFD. Honus
Wagner finished third based on his second-place finish in NFAD and sixth-place finish in NRFD. Cal Ripken, in fourth place, finished in a tie for fourthplace in NFAD and in third place in NRFD. Robin Yount, who finished sec-ond in NRFD, came in fifth overall as a result of his poor showing in thefielding average category.
158 A LL-STARS FOR A LL TIME

7/25/2019 McNeil - All-Stars for All Time
http://slidepdf.com/reader/full/mcneil-all-stars-for-all-time 170/247
Final NFAD NRFD Total Defensive × 20 × 20 Points Ratings
Cal Ripken 12.174 12.000 24.174 4
Honus Wagner 14.783 9.895 24.678 3
Ozzie Smith 13.913 20.000 33.913 1
Pee Wee Reese 6.957 5.895 12.852 12
Phil Rizzuto 11.304 4.000 15.304 10
Arky Vaughan 5.217 5.263 10.480 14
Robin Yount 3.478 17.895 21.373 6
Ernie Banks 9.565 9.684 19.249 8
Joe Cronin 7.826 7.158 14.984 11Luke Appling 0.000 8.211 8.211 15
Lou Boudreau 20.000 7.579 27.579 2
Luis Aparicio 11.304 11.579 22.883 5
Alan Trammell 12.174 0.000 12.174 13
Barry Larkin 9.565 6.947 16.512 9
Joe Sewell 9.565 11.579 21.144 7
Final All-Around Ratings
The Final All-Around Ratings for shortstops were pretty much asexpected, although it was a close race for the first five positions, with a spreadof only 15 percent separating the first-place finisher from the fifth-placefinisher. Honus Wagner, who finished first in offense and third in defense,
won the title of baseball’s greatest all-around shortstop. He was followed by Lou Boudreau, who finished fifth in offense and second in defense, and Ozzie
Smith, who finished first in defense, but whose fifteenth-place finish in offensedoomed his chances for the title. Ernie Banks, who finished second in offenseand eighth in defense, came in fourth overall, and Cal Ripken, based on hissixth-place finish in offense and fourth-place finish in defense, won the num-ber five spot.
Offense Defense Final Divided Divided Total All-Around by 43 by 40 Points Ratings HOF
Cal Ripken 0.744 0.604 1.348 5 *
Honus Wagner 0.933 0.617 1.550 1 *
Ozzie Smith 0.577 0.848 1.425 3 *
Pee Wee Reese 0.682 0.321 1.003 14 *
8. Baseball’s Greatest Shortstops 159

7/25/2019 McNeil - All-Stars for All Time
http://slidepdf.com/reader/full/mcneil-all-stars-for-all-time 171/247
Phil Rizzuto 0.623 0.383 1.006 13 *
Arky Vaughan 0.834 0.262 1.096 11 *
Robin Yount 0.719 0.534 1.253 6 *
Ernie Banks 0.869 0.481 1.350 4 *
Joe Cronin 0.803 0.375 1.178 8 *
Luke Appling 0.670 0.205 0.875 15 *
Lou Boudreau 0.758 0.689 1.447 2 *
Luis Aparicio 0.596 0.572 1.168 9 *
Alan Trammell 0.703 0.304 1.007 12Barry Larkin 0.744 0.413 1.157 10
Joe Sewell 0.669 0.529 1.198 7 *
The estimated rankings of the active players as of 2007 are shown below.
Estimated Estimated Final Estimated Offensive Defensive All-Around Rating Rating Rating
Alex Rodriguez 2 12 6
Derek Jeter 10 17 17
Miguel Tejada 6 14 13
Nomar Garciaparra 3 15 15
Omar Vizquel 16 8 12
Jeter and Tejada are in the declining stages of their careers, and prob-ably will drop below their present estimated ratings. Jeter’s defensive prob-
lems revolve around his poor range factor differential that, at minus six, isthe lowest range factor differential of any of the candidates, active or retired.Garciaparra has been playing first base since 2006, and may be a close callfor the fifteenth position. Omar Vizquel’s career is about over, so he may notsee much more of a decline, making him a good prospect to finish in the topfifteen. A-Rod, who is about number six all-around, has been playing thirdbase since 2004, so his high rating at shortstop may hold up. He could fallbelow number 12 on defense, but he shows no sign of slowing down on offense,
which should help him retain his number six all-around rating.
160 A LL-STARS FOR A LL TIME
Offense Defense Final Divided Divided Total All-Around by 43 by 40 Points Ratings HOF

7/25/2019 McNeil - All-Stars for All Time
http://slidepdf.com/reader/full/mcneil-all-stars-for-all-time 172/247
C HAPTER 9
Baseball’s GreatestThird Basemen
Fifteen players competed for the title of baseball’s greatest all-time, all-around third baseman.
• Michael Jack Schmidt, a husky 6'2", 200-pound right-handed hitter,began playing minor league baseball in 1971 at the age of twenty-one.
Within two years, the free-swinging youngster became a fixture at thirdbase for the Philadelphia Phillies, a position he held for the next eighteen
years. Initially, Schmidt had no idea of the strike zone, and althoughhe led the National League in home runs with 38 in 1975, he also wentdown swinging 180 times. Over the years he became more disciplined atthe plate, but he still averaged 124 strikeouts for every 550 at-bats. Hecompensated for that flaw by drawing 99 bases on balls, giving him a superior .376 on-base percentage. And when he did make contact withthe ball, he made the pitcher pay, averaging 36 home runs and 105 RBIsa year. During his career, Schmidt led the league in home runs eighttimes, RBIs three times, bases on balls four times, on-base percentage
three times, and slugging average five times.Schmidt was also one of the top defensive third basemen of his genera-
tion. He was a ten-time Gold Glove winner who led the league in assistsseven times and in double plays six times. He was noted for his depend-able glove and for his outstanding range in the field, reaching balls thatthe average third baseman would not even come close to. He won thefirst of his three Most Valuable Player awards in 1980, and he celebratedby pacing the Phillies to the world championship, ripping the ball ata .381 clip with two homers and seven RBIs in Philadelphia’s six-game
victory over the Kansas City Royals.• Eddie Mathews was the big gun in the Milwaukee Braves’ lineup during
161

7/25/2019 McNeil - All-Stars for All Time
http://slidepdf.com/reader/full/mcneil-all-stars-for-all-time 173/247
the 1950s, helping the Braves to two National League pennants and one world championship, a coveted World Series win over the New York Yan-kees in 1957. The stocky Texan averaged 33 homers and 94 RBIs over a
17-year career, giving him a total of 512 career homers, trailing only MikeSchmidt’s 548 career homers for third basemen. Mathews led the NationalLeague in home runs twice, with 47 homers in 1953 and 46 homers in1959. He had a fine .376 career on-base percentage and an excellent .509slugging average, again second to Schmidt’s .527 slugging average. Hisprowess with the bat was reported by The Ballplayers . “Mathews had a remarkable physique, and his powerful stroke and bat speed were mar-veled at by opponents, ‘He swings the bat faster than anyone I ever saw,’
commented Carl Erskine. ‘You think you’ve got a called strike past himand he hits it out of the catcher’s glove.’ Even Ty Cobb, not known forhis appreciation of the modern ballplayer, was impressed. ‘I’ve only knownthree or four perfect swings in my time. This lad has one of them.’” ButMathews was more than a great slugger. He was a standout on defense as
well, noted for his powerful throwing arm, his errorless play in the field,and his above-average range. He led the league in fielding average once,putouts twice, assists three times, and double plays once.
• Al Rosen, a contemporary of Eddie
Mathews, played major league base-ball for only seven full years. Hiscareer totals would pale next tomost of the other third basemen inthis study, but he did not have totake a back seat to anyone when itcame to playing the game. He was26 years old when he played his firstfull season in Cleveland, and he was
32 when he retired. The tough for-mer amateur boxer who had hisnose broken eleven times led the
American League in home runs as a rookie in 1950 with 37, and in 1953
with 43. He also led the league inRBIs twice and in slugging averageonce. Over his short career he aver-
aged 28 home runs and1
06 RBIsfor every 550 at-bats, while striking out just 57 times and drawing 87bases on balls. He had an excellentOBP and SLG. It was his defense
162 A LL-STARS FOR A LL TIME
Eddie Mathews was a hard-hittingthird baseman who also excelled withthe glove (courtesy Jay Sanford).

7/25/2019 McNeil - All-Stars for All Time
http://slidepdf.com/reader/full/mcneil-all-stars-for-all-time 174/247
that did him in. He overcame his early fielding problems to become a better-than-average defensive third baseman, but certainly not in theclass of Brooks Robinson or Mike Schmidt. He retired after the 1956
season as a result of nagging injuries that reduced his skills considerably,particularly in the field.
• George Brett was one of the top hitters of his generation, with a .305career batting average, and 35 doubles, seven triples, 17 home runs, and85 RBIs for every 550 at-bats. In 1980, he had the baseball world in a tizzy as he challenged the sacred .400 mark for most of the summerbefore tapering off to .390. He also led the league that year in OBP with.454 and SLG with .664. The husky left-handed hitter, who stood six
feet tall and weighed 200 pounds, led the league in batting two other years, with a .333 average in 1976 and a .329 average in 1990, and he ledthe league in slugging average two other years as well. Brett had excellentrange at third base, his plus 40 range factor differential being the fourth
widest differential in this study, but his work with the glove left some-thing to be desired. His career fielding average of .951 was two pointsbelow the league average. Some experts point out that his excellent rangefactor allowed him to reach balls that other players could not get to andthat that skill accounted for many of his errors. That may be true, but
when measured against other world-class third basemen, the mediocrefielding average hurt him in the ratings. George Brett’s career offensivestatistics included 1,583 runs scored, 3,154 base hits, 665 doubles (num-ber five all-time), 137 triples, 317 home runs, and 1,595 RBIs.
• Wade Boggs burst upon the major league scene like a runaway freighttrain, hitting a sensational .349 as a rookie, and following that up withfive batting titles in the next six years. After the 1988 season, with seven
years in the major leagues under his belt, Boggs owned a stratospheric.356 lifetime batting average, the fourth-highest career batting average
in major league history, .0004 behind “Shoeless Joe” Jackson. He scoredmore than 100 runs and stroked over 200 hits in each of his first seven
years. But the 30-year-old superstar could not maintain that pace as hetailed off dramatically over the final eleven years of his career, finally retiring in 1999 with a lifetime batting average of .328, number 29 all-time. The left-handed place hitter was not a power threat, averaging 35doubles, four triples, and five home runs a year, but his base hits com-bined with 85 bases on balls a year gave him a sensational .4 15 on-basepercentage. He led the league in OBP six times, with a high of .476 in1988. Boggs, who was not a polished third baseman when he arrived inthe major leagues, worked on his defense until he became one of thebetter third basemen in the league. He led the league in fielding averagetwice, putouts three times, assists once, and double plays four times.
9. Baseball’s Greatest Third Basemen 163

7/25/2019 McNeil - All-Stars for All Time
http://slidepdf.com/reader/full/mcneil-all-stars-for-all-time 175/247
• Frank “Home Run” Baker became an overnight sensation and earned hisnickname after hitting home runs off New York Giant aces Rube Mar-quard and Christy Mathewson on consecutive days to pace the Philadel-
phia Athletics to a World Series victory in 1911. Baker led the AmericanLeague in home runs four times, doubles once, and RBIs twice. He wasalso adept at other phases of the offensive game, averaging 22 stolen basesand 14 sacrifice bunts a year. On defense, he was a sure-handed fielder
who led the league in fielding average three times, putouts seven times,assists twice, and double plays three times. He was a member of ConnieMack’s famous $100,000 infield, joining Stuffy McInnis, Eddie Collins,and Jack Barry, who helped the A’s capture four American League pen-
nants and three world championships between1
91
0 and1
91
4.• Bob Elliott was a hard-hitting third baseman for the Pittsburgh Piratesand Boston Braves in the 1940s. He led the Braves to the 1948 NationalLeague pennant by slamming 24 doubles and 23 home runs with 100RBIs, plus a league-leading 131 bases on balls. He continued his can-nonading in a losing effort against the Cleveland Indians in the WorldSeries, leading the Braves with a .333 batting average while poling twohome runs with five RBIs in six games. Elliott, who was often referredto as “Mr. Team,” enjoyed a notable 15-year career that included a .289
career batting average, a fine .375 OBP, and a .440 slugging average.On defense, Elliott was better than average but probably not in the samecategory as the other candidates in this study, although he did lead the
164 A LL-STARS FOR A LL TIME
Brooks Robinson became a legend during the 1970 World Series when he dazzledthe fans with one spectacular play after another at third base (courtesy Jay Sanford).

7/25/2019 McNeil - All-Stars for All Time
http://slidepdf.com/reader/full/mcneil-all-stars-for-all-time 176/247

7/25/2019 McNeil - All-Stars for All Time
http://slidepdf.com/reader/full/mcneil-all-stars-for-all-time 177/247

7/25/2019 McNeil - All-Stars for All Time
http://slidepdf.com/reader/full/mcneil-all-stars-for-all-time 178/247
the second-best OBP in the study. Hack added to his team’s offense by stealing 12 bases a year, and he hit into the fewest double plays, six, of
any third baseman in the study. Smiling Stan was also an excellent gloveman who led the league in the four major defensive categories a total of 12 times, including five times in putouts, three times in double plays,and twice each in fielding average and assists. Hack’s .957 career fielding average was eleven points above the league average, the second-widest
9. Baseball’s Greatest Third Basemen 167
Ron Santo gave the Cubs outstanding defense and a powerful bat for fifteen years(courtesy Jay Sanford).

7/25/2019 McNeil - All-Stars for All Time
http://slidepdf.com/reader/full/mcneil-all-stars-for-all-time 179/247

7/25/2019 McNeil - All-Stars for All Time
http://slidepdf.com/reader/full/mcneil-all-stars-for-all-time 180/247
Bando doubled home the tying run and then scored the eventual Series- winning run on a double by Gene Tenace. Bando’s .959 career fielding average was six points higher than the league average and his 2.83 range
factor was thirteen points higher than the league average. He led theleague in putouts twice and double plays once.
Active players
The two active players who stand ready to assume a place on the rosterof the game’s greatest players are Scott Rolen and Chipper Jones. Jones, a thir-teen-year major league veteran who turned 35 in 2007, is nearing the end of
a memorable career that, to date, has contributed to the Atlanta Braves’ elevenconsecutive division titles, three National League pennants, and one worldchampionship. He owns a .307 career batting average with 31 home runs and104 RBIs for every 550 at-bats. Rolen, an excellent all-around third baseman,has completed eleven years of major league service through 2007 with a .283batting average, 26 homers and 101 RBIs a year. He is also in the upper ech-elon for fielding average and range factor.
Offensive Ratings
Normalized AdjustedOn-Base Percentage (NOBPA)
Wade Boggs’ .415 on-base percentage was the highest OBP of the thirdbase candidates. Eddie Yost and Stan Hack were next with .394 each. Boggsand Yost maintained their lead after the era adjustments were made, but StanHack, who had a negative 19-point era adjustment, fell from third place to
sixth. Sal Bando had a plus 11 era adjustment, while Brooks Robinson enjoyeda plus 13 adjustment. Pie Traynor had one of the larger negative era adjust-ments, a huge 18-point drop, while the active players, Scott Rolen and Chip-per Jones, currently have a minus 11 era adjustment.
Normalized AdjustedSlugging Average (NXSLGA)
Mike Schmidt, with a .527 career slugging average, and Eddie Math-ews, with a .509 slugging average, were the only players to have a career slug-ging average over 5.00. Al Rosen with .495 and George Brett with .487 werethe nearest competitors. As usual, there were several era adjustments, bothfavorable and unfavorable. Home Run Baker had the biggest positive era
9. Baseball’s Greatest Third Basemen 169

7/25/2019 McNeil - All-Stars for All Time
http://slidepdf.com/reader/full/mcneil-all-stars-for-all-time 181/247
adjustment, plus 43. Brooks Robinson was plus 15; Ron Santo was plus 13;Stan Hack was plus 14; Sal Bando was plus 17; Mike Schmidt was plus 13;and Bob Elliott was plus 12. On the flip side, Wade Boggs was penalized by
a huge negative 23-point era adjustment, and Paul Molitor was minus 18. Theindividual park factors also played havoc with some of the candidates. RonSanto, who averaged 23 home runs for every 550 at-bats during his career,had a highly unfavorable 1.71 home run factor (HRF) that significantly affectedhis overall park factor, reducing his average home runs to 18 per 550 at-bats.
Al Rosen had a 1.19 HRF, and Graig Nettles had a 1.29 HRF. Curiously, only one player, George Brett, had a favorable home run factor, 0.79, that increasedhis average home runs per year from 17 to 19. When all the smoke cleared,
the first four places were left unchanged, with Mike Schmidt still atop theheap, followed by Eddie Mathews, Al Rosen, and George Brett, in that order.One person who benefited from the era adjustment was Eddie Yost, whose.371 SLG was last out of fifteen players. But Yost, who had a slightly favor-able era adjustment, finished ahead of Boggs, who had a huge negative era adjustment as noted above, and Hack, whose lack of power doomed him tofourteenth place, just ahead of Boggs.
Normalized Stolen Bases (NSB)
Very few third basemen were threats to steal bases on a regular basis.Only Paul Molitor, with an average of 26 stolen bases a year, and Home RunBaker, with 22, stole more than 12 bases a year. Mike Schmidt and Stan Hack had 12 stolen bases a year, and Pie Traynor had 12. Sal Bando was next withseven.
Normalized Sacrifice Hits (NSH)
Pie Traynor was the leader in sacrifice hits with 17 a year. Home RunBaker had 14, and Stan Hack had nine. It is quite obvious from the statisticsthat the sacrifice hit has become a lost art in recent years. Most modern-day players show only one or two sacrifice hits a year. The exceptions are Bandoand Brooks Robinson with five, and Molitor with four.
Normalized GroundedInto Double Plays (NGIDP)
Third basemen were average when it came to grounding into doubleplays. The range of GIDP stretched from six to 20. Stan Hack grounded intoonly six double plays a year. Eddie Mathews grounded into eight double playsa year, and George Brett and Mike Schmidt grounded into nine. At the other
170 A LL-STARS FOR A LL TIME

7/25/2019 McNeil - All-Stars for All Time
http://slidepdf.com/reader/full/mcneil-all-stars-for-all-time 182/247
end of the spectrum, Pie Traynor grounded into 20 double plays a year, and Al Rosen grounded into eighteen double plays a year.
Final Offensive Ratings
Mike Schmidt’s early lead in NOBPA and NXSLGA combined held upthroughout the remainder of the offensive competition, giving him a slightlead over Eddie Mathews and making him the top offensive third basemanin baseball history.
Final NOBPA NXSLGA .05NSB .05NSH .05NGIDP Total Offensive × 20 × 20 × 20 × 20 × 20 Points Ratings
Mike Schmidt 18.301 20.000 0.462 0.059 0.667 39.489 1
Eddie Mathews 18.252 18.781 0.115 0.118 0.889 38.155 2
Al Rosen 18.252 16.233 0.231 0.059 0.333 35.108 3
Home Run Baker 17.767 13.130 0.846 0.824 0.429 32.996 4
George Brett 18.010 13.629 0.192 0.118 0.667 32.616 5
Sal Bando 17.621 12.853 0.269 0.294 0.500 31.537 6
Bob Elliott 17.816 12.299 0.192 0.294 0.429 31.030 7
Ron Santo 18.816 12.299 0.077 0.059 0.316 30.567 8Paul Molitor 17.864 9.917 1.000 0.235 0.600 29.616 9
Eddie Yost 18.932 8.864 0.192 0.059 0.600 28.647 10
Graig Nettles 16.214 11.745 0.115 0.000 0.462 28.536 11
Stan Hack 18.204 8.144 0.462 0.529 1.000 28.339 12
Brooks Robinson 16.262 10.693 0.077 0.294 0.353 27.679 13
Pie Traynor 16.699 8.753 0.423 1.000 0.300 27.175 14
Wade Boggs 20.000 6.427 0.077 0.118 0.429 27.051 15
Defensive Ratings
Normalized Fielding Average Differential (NFAD)
Brooks Robinson, to no one’s surprise, had the highest fielding averagein baseball history at .971 as well as the highest fielding average differential,a whopping eighteen points above the league average. Stan Hack had aneleven-point fielding average differential and, what might be a surprise tomany people, Wade Boggs also checked in with an eleven-point differential,two points better than the New York Yankee vacuum cleaner, Graig Nettles.Paul Molitor and George Brett anchored the bottom of the list with a nega-tive two point differential.
9. Baseball’s Greatest Third Basemen 171

7/25/2019 McNeil - All-Stars for All Time
http://slidepdf.com/reader/full/mcneil-all-stars-for-all-time 183/247
Normalized Range Factor Differential (NRFD)
Mike Schmidt, who was in the middle of the pack with regard to field-
ing average, captured first place in the range factor category, with a range fac-tor of 3.00, giving him a plus 55-point range factor differential. George Brett
was second with a plus 40 differential, and Brooks Robinson and Graig Net-tles were close behind Brett with 36-point differentials each.
Final Defensive Ratings
The favorites justified everyone’s confidence in them when the finalreturns were in to identify the game’s greatest defensive third baseman. Brooks
Robinson, who was first in fielding average differential and third in rangefactor differential, edged Mike Schmidt for first place in the final defensiveratings. Schmidt was number one in range factor differential, but could dono better than a tie for sixth in fielding average differential. Ron Santo, witha sixth-place tie for FAD and a second-place finish in RFD, came in third,
just ahead of Graig Nettles, who finished third in FAD and tied for fifth inRFD.
172 A LL-STARS FOR A LL TIME
Mike Schmidt did it all—hit 548 home runs, drove in 1,595 teammates, and wonten Gold Gloves—during his 18-year career.

7/25/2019 McNeil - All-Stars for All Time
http://slidepdf.com/reader/full/mcneil-all-stars-for-all-time 184/247
Final NFAD NRFD Total Defensive × 20 × 20 Points Ratings
Mike Schmidt 8.000 20.000 28.000 2Eddie Mathews 8.000 8.727 16.727 7 Al Rosen 9.000 0.727 9.727 14George Brett 0.000 14.545 14.545 9 Wade Boggs 13.000 10.545 23.545 5Home Run Baker 8.000 6.909 14.909 10Bob Elliott 2.000 4.364 6.364 15Brooks Robinson 20.000 13.090 33.090 1
Pie Traynor 2.000 10.909 12.909 11Ron Santo 8.000 17.818 25.818 3Paul Molitor 0.000 15.636 15.636 8Stan Hack 13.000 4.000 17.000 6Graig Nettles 11.000 13.090 24.090 4Eddie Yost 5.000 5.091 10.091 13Sal Bando 8.000 4.727 12.727 12
Final All-Around RatingsThe final all-around ratings for third basemen were based on the assump-
tion that, although the position is regarded as a power position, it is also con-sidered to be an important defensive position. It is not considered as importantdefensively as shortstop or catcher, but it ranks above most of the other posi-tions, and it is considered to be on par with second base. Both positionsrequire tenacious glove-work. The second baseman has to be adept at mak-ing the double play, but the third baseman has to have a powerful throwing
arm in order to make the difficult plays around the hot corner. The final rat-ings for third basemen, therefore, rate the offense at twice the defense, thesame ratio used for evaluating second basemen. Under those conditions, MikeSchmidt was able to sneak past Brooks Robinson to claim the title as thegame’s greatest all-around third baseman. Robinson’s spectacular defenseallowed him to hold off a challenge from Eddie Mathews, but Mathews’ explo-sive offense was more than enough to overtake both Ron Santo and Graig Nettles for third place overall.
Offense Defense Final Divided by Divided Total All-Around 43 × 2 by 40 Points Ratings HOF
Mike Schmidt 1.837 0.700 2.537 1 *Brooks Robinson 1.287 0.827 2.114 2 *
9. Baseball’s Greatest Third Basemen 173

7/25/2019 McNeil - All-Stars for All Time
http://slidepdf.com/reader/full/mcneil-all-stars-for-all-time 185/247
Eddie Mathews 1.684 0.418 2.102 3 *Ron Santo 1.422 0.645 2.067 4 *
Graig Nettles 1.327 0.602 1.929 5
George Brett 1.517 0.370 1.887 6 *
Al Rosen 1.633 0.243 1.876 7
Wade Boggs 1.258 0.589 1.847 8 *
Home Run Baker 1.437 0.373 1.810 9 *
Sal Bando 1.467 0.318 1.785 10
Paul Molitor 1.377 0.391 1.768 11 *Stan Hack 1.225 0.425 1.650 12
Bob Elliott 1.443 0.159 1.602 13
Eddie Yost 1.332 0.252 1.584 14
Pie Traynor 1.184 0.323 1.507 15 *
Scott Rolen and Chipper Jones have an excellent chance of competing for a place on the roster of the legendary all-star team. Based on his impres-sive .401 OBP and .538 SLG, and in spite of large negative era and park fac-tor adjustments, Jones still has an outside chance of finishing in the top fiveoffensively, but his average defensive statistics, which currently rank him aboutfourteenth, could drop him out of the top ten all-around, although he couldstill finish in the top fifteen. Rolen is in a better position to complete his career
with a top ten finish, although his career has probably passed its peak as well.The eleven-year major league veteran turned 31 in 2007, so his statistics willprobably begin to decline from this point on. He too will have a significantnegative era adjustment, but he will probably retain his positive park factor,
and that will serve him well in the final evaluation. At the present time, hisstatistics would give him about a number three finish in the offensive cate-gory, and his defensive numbers are even better. His career fielding averageof .966 is thirteen points above the league average, while his plus 56 rangefactor differential is the best ever recorded. Those numbers, if they were tohold up throughout the remainder of his career, would give him a numberone rating defensively and a number two rating overall, just 0.004 behindMike Schmidt. But with perhaps another eight to ten years remaining in hiscareer, his final rating is in danger of falling.
174 A LL-STARS FOR A LL TIME
Offense Defense Final Divided by Divided Total All-Around
43 × 2 by 40 Points Ratings HOF

7/25/2019 McNeil - All-Stars for All Time
http://slidepdf.com/reader/full/mcneil-all-stars-for-all-time 186/247
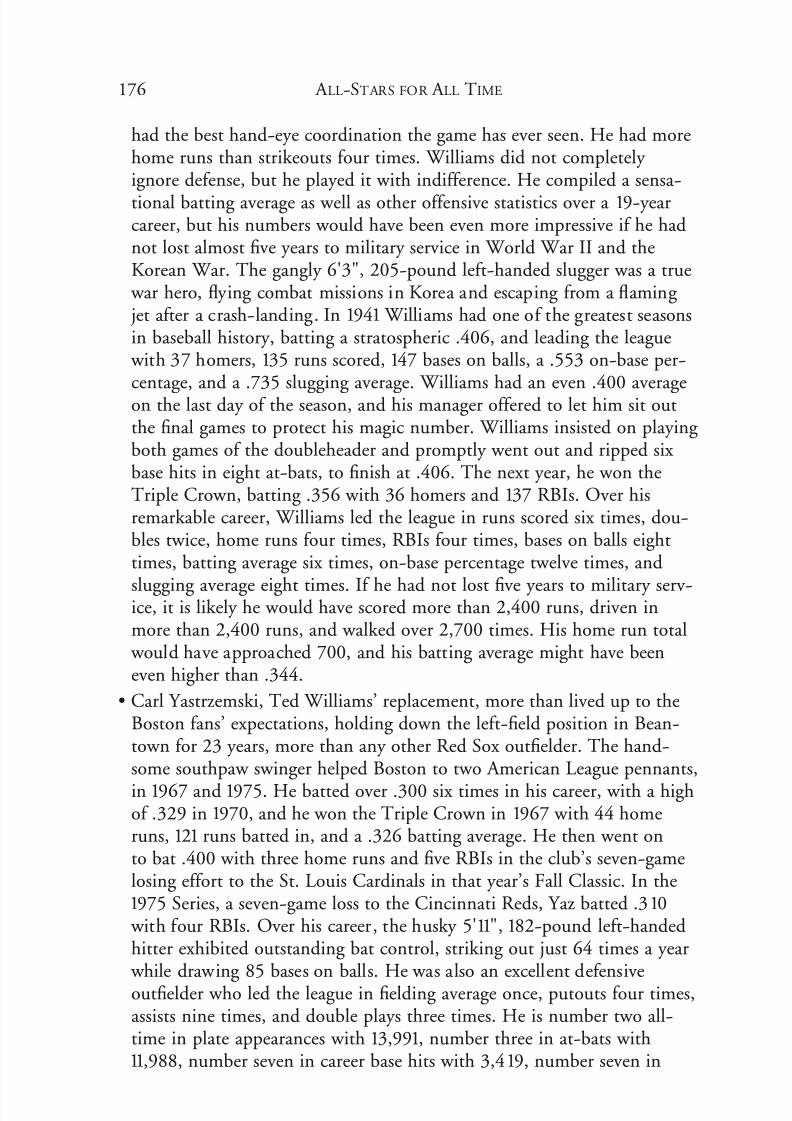
7/25/2019 McNeil - All-Stars for All Time
http://slidepdf.com/reader/full/mcneil-all-stars-for-all-time 187/247
had the best hand-eye coordination the game has ever seen. He had morehome runs than strikeouts four times. Williams did not completely ignore defense, but he played it with indifference. He compiled a sensa-
tional batting average as well as other offensive statistics over a 19-yearcareer, but his numbers would have been even more impressive if he hadnot lost almost five years to military service in World War II and theKorean War. The gangly 6'3", 205-pound left-handed slugger was a true
war hero, flying combat missions in Korea and escaping from a flaming jet after a crash-landing. In 1941 Williams had one of the greatest seasonsin baseball history, batting a stratospheric .406, and leading the league
with 37 homers, 135 runs scored, 147 bases on balls, a .553 on-base per-
centage, and a .735 slugging average. Williams had an even .400 averageon the last day of the season, and his manager offered to let him sit outthe final games to protect his magic number. Williams insisted on playing both games of the doubleheader and promptly went out and ripped six base hits in eight at-bats, to finish at .406. The next year, he won theTriple Crown, batting .356 with 36 homers and 137 RBIs. Over hisremarkable career, Williams led the league in runs scored six times, dou-bles twice, home runs four times, RBIs four times, bases on balls eighttimes, batting average six times, on-base percentage twelve times, and
slugging average eight times. If he had not lost five years to military serv-ice, it is likely he would have scored more than 2,400 runs, driven inmore than 2,400 runs, and walked over 2,700 times. His home run total
would have approached 700, and his batting average might have beeneven higher than .344.
• Carl Yastrzemski, Ted Williams’ replacement, more than lived up to theBoston fans’ expectations, holding down the left-field position in Bean-town for 23 years, more than any other Red Sox outfielder. The hand-some southpaw swinger helped Boston to two American League pennants,
in 1967 and 1975. He batted over .300 six times in his career, with a highof .329 in 1970, and he won the Triple Crown in 1967 with 44 homeruns, 121 runs batted in, and a .326 batting average. He then went onto bat .400 with three home runs and five RBIs in the club’s seven-gamelosing effort to the St. Louis Cardinals in that year’s Fall Classic. In the1975 Series, a seven-game loss to the Cincinnati Reds, Yaz batted .310
with four RBIs. Over his career, the husky 5'11", 182-pound left-handedhitter exhibited outstanding bat control, striking out just 64 times a year
while drawing 85 bases on balls. He was also an excellent defensiveoutfielder who led the league in fielding average once, putouts four times,assists nine times, and double plays three times. He is number two all-time in plate appearances with 13,991, number three in at-bats with11,988, number seven in career base hits with 3,419, number seven in
176 A LL-STARS FOR A LL TIME

7/25/2019 McNeil - All-Stars for All Time
http://slidepdf.com/reader/full/mcneil-all-stars-for-all-time 188/247

7/25/2019 McNeil - All-Stars for All Time
http://slidepdf.com/reader/full/mcneil-all-stars-for-all-time 189/247
eight years in the big leagues. His career slowed slightly during his 30s,but he still maintained a .300 average with good power for another seven
years.
• Rickey Henderson was the quintessential leadoff hitter, a 5'10", 180-pound right-handed batter with blazing speed and a powerful bat. Heholds the all-time record for the most career home runs by a leadoff
178 A LL-STARS FOR A LL TIME
Al Simmons batted .334 over a memorable 20-year career.

7/25/2019 McNeil - All-Stars for All Time
http://slidepdf.com/reader/full/mcneil-all-stars-for-all-time 190/247

7/25/2019 McNeil - All-Stars for All Time
http://slidepdf.com/reader/full/mcneil-all-stars-for-all-time 191/247
assist. In his last year in the major leagues, Jackson batted a robust .382 with 42 doubles, a league-leading 20 triples, 12 homers, and 121 RBIs.His .356 career batting average is the third highest in baseball history,trailing only Ty Cobb (.366) and Rogers Hornsby (.358).
• Willie “Pops” Stargell was the heart and soul of the great PittsburghPirate teams of the 1960s and 1970s. He led the Pirates to six division
180 A LL-STARS FOR A LL TIME
Shoeless Joe Jackson may have been the greatest natural hitter in the history of thegame.

7/25/2019 McNeil - All-Stars for All Time
http://slidepdf.com/reader/full/mcneil-all-stars-for-all-time 192/247
titles and two world championships. He batted .315 in fourteen WorldSeries games with three home runs and eight RBIs. His two-run homerin the sixth inning of the seventh game of the 1979 Fall Classic provided
the winning margin in a 4–1 Pirate triumph. Pops held down the left fieldspot in the Pittsburgh lineup for twenty-one years, but defense was nothis strong suit. He was primarily a slugger who was paid to produce runs.
And he did that with gusto, driving in an average of 107 runs a year. Hisbest year was 1973 when he led the league in doubles with 43, home runs
with 44, RBIs with 119, and slugging average with .646. He also led theleague in home runs in 1971 with 48. Over his long career, Stargell batted.282 with 33 homers a year. And because he was not a strong defensiveoutfielder, opposing runners challenged his arm, often to their disap-pointment. He led the National League in assists four times and doubleplays three times.
• Pete Rose was one of the most competitive players ever to put on a uni-form. The man they called “Charlie Hustle” gave 110 percent on every play, even if there was a wide discrepancy in the score. He always playedhard and he always played to win. Rose did not have an abundance of talent, but he had desire and a dedicated work ethic that made him oneof the top players in the game. His 24-year major league career produced
seven division titles, six World Series appearances, and three world cham-pionships. In 1975, Rose pummeled Pittsburgh Pirate pitching to thetune of .357 in the NLCS, and he kept up the barrage against the BostonRed Sox in the World Series, hitting .370 as the Big Red Machine rolledto the world championship in seven games. Rose led the league in many offensive and defensive categories during his career. He led the league inruns scored four times, base hits seven times, doubles five times, batting average three times, on-base percentage twice, fielding average threetimes, putouts five times, and assists four times. His best year may have
been 1969 when he led the league in batting (.348) and runs scored (120).Or it could have been 1976 when he led the league in runs scored (130),base hits (215), and doubles (42), while stroking the ball at a .323 clip.
When he retired in 1986, he left a barrel of records behind. He brokeTy Cobb’s record for the most base hits in a career in 1985, finishing
with 4,256. He is also number one in games played (3,562) and at-bats(14,053), number six in runs scored (2,156), number two in doubles(746), number seven in total bases (5,752), and number five in careerfielding average (.991).
• Joe Medwick, called “Ducky-Wucky” because of the way he walked, was one of the game’s top sluggers during the 1930s. The rugged 5'10",187-pound right-handed hitter was a notorious bad-ball hitter who hitballs off his shoe-tops or above his shoulders, driving them to all fields
1 0. Baseball’s Greatest Right Fielders and Left Fielders 181

7/25/2019 McNeil - All-Stars for All Time
http://slidepdf.com/reader/full/mcneil-all-stars-for-all-time 193/247
for extra bases. Over the course of his 17-year career, Medwick averaged39 doubles, eight triples, 15 home runs, and 100 runs batted in for every 550 at-bats. He disdained the base on balls, as evidenced by his 31 walks
a year, but he seldom struck out, fanning only 40 times a year. Medwick joined the St. Louis Cardinals as a 20-year-old outfielder in 1932 afterliterally destroying the pitching in the Texas League with a .354 batting average and 82 extra-base hits in 139 games. He batted .349 with St.Louis in 26 games at the end of that season, and went on to hit over .300in each of the next eleven years. He won the National League’s last TripleCrown in 1937, batting a sizzling .374 with 31 homers and 151 RBIs. He
won the MVP that year while also leading the league in runs scored (111),base hits (237), doubles (56), slugging average (.641), and fielding average(.988). In all, Medwick led the league in base hits one more time, RBIstwice more, triples once, and doubles twice more, with a National Leaguerecord 64 in 1936, second only to Earl Webb’s 67 doubles in major leaguehistory. He retired in 1948 with a career batting average of .324.
• Harry Heilmann, a big 200-pound right-handed hitter, was strictly anoffensive player. After playing a mediocre outfield in Detroit for four
years, he was moved to first base, but when he led the league in errors fortwo years, he was returned to the outfield where he finished his career. He
might not have been a standout with the glove, but he was a terror withthe bat, winning four batting titles in seven years. In 1921, he beat Ty Cobb out of the batting title, hitting a blistering .394 to Cobb’s .389.Two years later, Heilmann topped the magic .400 mark, taking his sec-ond batting title with a .403 average, ten points better than Babe Ruth’s.393. He won his third crown in 1925 with a .393 average, four pointsbetter than Tris Speaker’s .389, and in 1927 he ripped seven base hits in a season-ending doubleheader to come from behind to edge Al Simmons,.398 to .392. The man known as “Slug” arrived on the big league scene
in 1914 as a 19-year-old phenom from the Northwest League, but it took him a few years to get his sea legs. He batted .320 in 1919, his fifth yearin the American League, and followed that with a .309 season. Then,
with the lively ball in full use in 1921, he went on a tear, averaging .380over the next seven years. When arthritis in his wrists forced him to callit a day in 1930 at the age of 35, he could still hit, stinging the ball at a .333 clip in his last full season. His career batting average of .342 is num-ber ten all-time and number three in the lively ball era, beginning in1920.
• Stan Musial was a thorn in the side of all National League teams during his 22-year career, but he was particularly hard on the Brooklyn Dodgers’pitchers, raking them for a .356 batting average. During one visit toEbbets Field, St. Louis swept a three-game series, with Musial’s 11-for-15
182 A LL-STARS FOR A LL TIME

7/25/2019 McNeil - All-Stars for All Time
http://slidepdf.com/reader/full/mcneil-all-stars-for-all-time 194/247
performance at the plate leading the attack as usual. As he stepped to the
plate for his last at-bat, one depressed Dodger rooter moaned, “Herecomes that man again.” The moniker stuck, and Musial was respectfully referred to as “Stan the Man” the rest of his career. The smooth-swinging left-handed hitter with the curious coiled batting stance had an excellentbatting eye, striking out only 35 times a year while drawing 80 bases
1 0. Baseball’s Greatest Right Fielders and Left Fielders 183
Stan Musial was a seven-time batting champion en route to a career .331 battingaverage.

7/25/2019 McNeil - All-Stars for All Time
http://slidepdf.com/reader/full/mcneil-all-stars-for-all-time 195/247
on balls. He also hit for average and hit with power, averaging .331 with
36 doubles, nine triples, 24 home runs, 98 runs scored, and 98 RBIs forevery 550 at-bats. He is the greatest National League hitter-slugger of thelast eighty years and second only to Rogers Hornsby in the lively ball era.Stan the Man led the National League in hitting seven times, with a highof .376 in 1948. He also led the league in runs scored four times, base
184 A LL-STARS FOR A LL TIME
Babe Ruth was baseball’s all-time greatest home run hitter.

7/25/2019 McNeil - All-Stars for All Time
http://slidepdf.com/reader/full/mcneil-all-stars-for-all-time 196/247
hits six times, doubles eight times, triples five times, RBIs twice, on-basepercentage six times, slugging average six times, and fielding average threetimes. He is number six in games played with 3,026, number eight in
plate appearances with 12,712, number nine in at-bats with 10,972, num-ber eight in runs scored with 1,949, number four in base hits with 3,630,number three in doubles with 725, number 19 in triples with 177 (num-ber one in the lively ball era), number two in extra-base hits with 1,377,number two in total bases with 6,134, number five in RBIs with 1,951,number eleven in bases on balls with 1,599, number 20 in on base per-centage with .417, and number 22 in slugging average with .559.
• Babe Ruth. The name conjures up visions of a Bunyan-type character
standing astride the baseball world like a colossus. And in Ruth’s case,truth is stranger than fiction. He almost single-handedly saved baseballafter the infamous Black Sox scandal. The Baltimore native was the
American League’s top southpaw pitcher for several years, a two-timetwenty-game winner prior to being converted to the outfield in 1918.The man known as “the Bambino” and “the Sultan of Swat” suddenly exploded with the bat when he became a full-time outfielder, hitting monstrous home runs from New York to St. Louis. In 1919 his 29 homeruns broke the single-season record of 27 home runs set by Ned
Williamson in 1884. He went on to break his own record three times,culminating in his sensational 60-home run season in 1927. Twice he hitmore home runs than every other team in the American League—notman, but TEAM—in 1920 and again in 1927. Ruth set the career homerun record with 139 in 1921, breaking the twenty-five-year-old mark setby Roger Connor. Every home run he hit after that just increased his ownrecord. When he retired in 1935 with 714 home runs, his nearest rivals,Lou Gehrig and Jimmie Foxx, had just 378 homers and 302 homers,respectively. Gehrig retired with 493 homers, and Foxx retired with 534
homers, leaving him 180 home runs shy of Ruth’s record. No other playerof Ruth’s era hit more than 301 home runs in his career; that is how goodthe Bambino was! He led the American League in home runs twelvetimes. Hank Aaron led the league four times, Barry Bonds twice, Mark McGwire four times, and Roger Maris once. In the most importantoffensive categories—batting average, runs scored, doubles, triples, homeruns, RBIs, bases on balls, OBP, and SLG—Ruth led the league a total of 49 times. Ty Cobb was second with 42 times, and no other player inbaseball history has led the league in those categories more than 31 times.
• Mel Ott was the greatest slugger produced by the New York Giants untilthe arrival of Willie Mays, and he took advantage of the short right-field
wall in the Polo Grounds like no one else. Ott crushed 511 home runsduring his 22-year career, and he quickly became proficient at lofting
1 0. Baseball’s Greatest Right Fielders and Left Fielders 185

7/25/2019 McNeil - All-Stars for All Time
http://slidepdf.com/reader/full/mcneil-all-stars-for-all-time 197/247
fly balls over the friendly 257-foot right-field wall at the Polo Grounds,hitting 323 homers at home against 188 homers on the road. “MasterMelvin” compiled a career batting average of .304 with the Giants, lead-
ing the league in runs scored twice, home runs six times, RBIs once,bases on balls five times, on-base percentage four times, and slugging average once. He was a dangerous hitter who hit 30 or more homers eighttimes and knocked in over 100 runs ten times. But he was also a patienthitter who drew 99 bases on balls a year against just 52 strikeouts. Andhe was just as dangerous in the three World Series he played in. Whenthe Giants won their only world championship with a four games-to-one
win over the Washington Senators in 1933, Ott batted .389 with twohomers and four RBIs. He is still number eleven in both runs scored
with 1,859 and RBIs with 1,860, and number eight in bases on balls with1,708.
• Al Kaline was an outstanding all-around outfielder and a true five-toolplayer who could hit for average, hit with power, run, field, and throw.The 6'2", 180-pound right-handed hitter burst upon the major leaguescene in 1953 at the age of 18. In his first full year, in 1954, he batted.276, and the following year he tore the league apart, capturing the bat-ting title with a .340 average. He also led the league in base hits with
200, scored 121 runs, drove in 102 runners, and collected 24 doubles,eight triples, and 27 home runs. He continued in the same vein for thenext nineteen years, batting over .300 eight more times, and helping theTigers win two American League pennants and one world championship.Detroit defeated the St. Louis Cardinals in the 1968 Fall Classic, fourgames to three, with Mickey Lolich tossing three complete-game victo-ries. Kaline chipped in with a torrid .379 batting average with two dou-bles, two home runs, and eight runs batted in. Over his career, Kalineonly led the league once in base hits and once in doubles, but he was
extremely consistent from year to year offensively, and he led the leaguein defensive categories ten times, including fielding average five times.
When he retired in 1974, he left behind a .297 batting average and a totalof 3,007 base hits, one of just 25 players with 3,000 or more hits. He isnumber six all-time in career games played in the outfield with 2,488,and number ten in career putouts with 5,035.
• Roberto Clemente along with Honus Wagner, is one of the PittsburghPirates’ greatest players. The flamboyant native of San Juan, Puerto Rico,
was snatched out of the Brooklyn Dodger farm system in 1954 where theDodgers were trying to hide him. The next year, the twenty-year-oldoutfielder played 124 games for the Pirates, batting .255, and in 1956 heupped his average to .311. He hit his stride in 1960, batting .314 with 16homers and 94 RBIs. He batted over .300 in 13 of his last 14 years in a
186 A LL-STARS FOR A LL TIME

7/25/2019 McNeil - All-Stars for All Time
http://slidepdf.com/reader/full/mcneil-all-stars-for-all-time 198/247
Pittsburgh uniform, winning four batting championships—.351 in 1961,.339 in 1964, .329 the next year, and .357 in 1967. He also led the leaguein eleven defensive categories, including six times in assists. He is still
number nine in games played in the outfield with 2,370. Clementeplayed on three National League pennant winners and in two WorldSeries, winning the world championship both times. In 1960, the yearBill Mazeroski hit his dramatic ninth-inning home run off Bill Terry tobury the New York Yankees in Game Seven, Clemente batted .310. Eleven
years later, when the Bucs edged the Baltimore Orioles in seven games,Clemente led both teams at bat with two doubles, one triple, two homeruns, four RBIs and a .414 batting average. His fourth-inning home runin Game Seven proved to be the winning margin in the Pirates’ 2–1 vic-tory, and gave him the Series MVP trophy. His career ended prematurely on New Years Eve, 1972, when the plane he was on, carrying relief sup-plies to Managua, Nicaragua, crashed into the Atlantic Ocean. There
were no survivors.
• Dwight “Dewey” Evans was one of the best right fielders in Boston RedSox history. He arrived on the scene in 1972 at the age of twenty with a reputation as a strong-armed outfielder, and he was that, but he was alsoa threat with the bat. He played major league baseball for twenty years,
all but one in Boston. He batted a tough .272, with 30 doubles, fourtriples, 24 home runs, 90 runs scored, and 85 RBIs for every 550 at-bats.He also drew 85 bases on balls a year, giving him a fancy .370 on-basepercentage. Evans’ best year was 1987 when he batted .305 with 37 dou-bles, 34 homers, 109 runs scored, and 123 RBIs. He led the league in runsscored once during his career, home runs once, walks three times, andOBP once. Even though he was a dangerous offensive player, he was bestknown as one of the game’s best defensive outfielders with probably thestrongest throwing arm in the major leagues during his career. The eight-
time Gold Glove winner led the American League in fielding averagethree times, putouts and assists four times each, and double plays threetimes. He might have led the league in assists several more years but very few base runners challenged his arm. Evans played in two World Series,but was on the losing side both times. In 1975, when the Sox lost to theCincinnati Reds in seven games, Evans batted .292 with a home run andfive RBIs. In Game Six, eventually won by Boston on Carlton Fisk’sdramatic twelfth-inning home run, Evans saved the game in the eleventh
inning when he robbed Joe Morgan of a home run and started an inning-ending double play. In the 1986 Series, known for Bill Buckner’s error inthe ninth inning of Game Six that opened the door for an eventual Metvictory in seven games, Evans crushed the ball at a .308 clip with twodoubles, two homers, and nine RBIs.
1 0. Baseball’s Greatest Right Fielders and Left Fielders 187

7/25/2019 McNeil - All-Stars for All Time
http://slidepdf.com/reader/full/mcneil-all-stars-for-all-time 199/247
• Bob Johnson, known as “Indian Bob,” played in the American League forthirteen years, primarily with the Philadelphia Athletics. He was a hard-hitting outfielder who averaged .296 during his career, with 31 doubles,
eight triples, 23 home runs, 98 runs scored, and 102 RBIs for every 550at-bats. His 85 bases on balls a year combined with his good batting average gave him an excellent .393 on-base percentage. Indian Bob hit 20or more home runs his first nine years in the major leagues, and he drovein more than 100 runs seven consecutive years. He did not have a bestseason; he was consistently good many years, with a good balance of runsscored, home runs, RBIs, and batting average. He did have several mem-orable days, however. On August 29, 1937, he set a major league recordby hitting a grand slam homer and a two-run double in the same inning,good for six RBIs. In another game, he went six-for-six with two doublesand two homers. The seven-time All-Star retired from the game in 1945at the age of 39, hitting a solid .280 in his final season.
• Reggie Smith may have been the greatest right fielder in Boston Red Sox history, although fans of Dewey Evans and Harry Hooper might objectto the statement. Smith, who was a fixture in Fenway Park’s right-fieldpasture for seven years, had a strong throwing arm and good range, buthe was noted more for his big bat than his reliable glove. He batted over
.300 six times in his 17-year major league career, with a high of .322 withthe Los Angeles Dodgers in 1980. His best year was probably 1977, whenhe helped the Dodgers take the National League pennant. The 6', 190-pound switch-hitter caressed the ball to the tune of .307 that year, with104 runs scored, 32 homers, and a league-leading .427 on-base percent-age. He, Steve Garvey, Dusty Baker, and Ron Cey became the first quar-tet to hit 30 or more home runs each in the same season. Smith batted.287 over his career, averaging 28 doubles, 25 home runs, 88 runs scored,and 85 runs batted in for every 550 at-bats. He led the league in doubles
twice, putouts twice, and assists and double plays once each.• Paul Waner, known as “Big Poison,” was one of the greatest hitters in
Pittsburgh Pirate history, stroking the ball to the tune of .333 over a20-year career. The 5'8", 153-pound left-handed hitter was never a power hitter, but he could hit the ball in the gaps as well as anyone,averaging 35 doubles, 11 triples, and seven home runs a year. He andhis brother Lloyd, a .316 hitter known as “Little Poison,” patrolled theForbes Field outfield from 1927 to 1941, giving Pirate fans some of the
most exciting baseball ever seen in the Steel City. Paul Waner joinedthe San Francisco Seals in 1923 at the age of twenty, and after putting together averages of .369, .356, and .401 in the Pacific Coast League,his contract was purchased by Pittsburgh. In his rookie season, he batted.336 with a league-leading 22 triples. He went on to hit over .300 the
188 A LL-STARS FOR A LL TIME

7/25/2019 McNeil - All-Stars for All Time
http://slidepdf.com/reader/full/mcneil-all-stars-for-all-time 200/247
next twelve years, winning three batting championships along the way, with averages of .380, .362, and .373. He also led the league in runsscored twice, base hits twice, doubles twice, triples twice, and RBIs once.
He scored over 100 runs nine times and posted eight seasons with morethan 200 base hits. One of the keys to Waner’s success was his keen bat-ting eye. He struck out an average of just 22 times a year while walking 63 times, giving him an outstanding .404 on-base percentage, the tenth-highest OBP of the twenty players in the study.
Active Players
There are several active players who might deserve a place on this listonce they retire, including Gary Sheffield, Vladimir Guerrero, Ichiro Suzuki,and Manny Ramirez. Gary Sheffield has been one the game’s most dangeroushitters for 19 years. He has averaged .296 over that span with 99 runs scored,31 home runs, and 102 runs batted in a year. He won the batting champi-onship in 1992 with a .330 average. He is a decent defensive outfielder,although not outstanding. Vladimir Guerrero, who is in the middle of a potential Hall of Fame career, is primarily an offensive player. He sported a .325 career batting average through the 2007 season, with 33 homers and 107
RBIs for every 550 at-bats. Ichiro Suzuki, who played for ten years in Japan with a .355 batting average, was hitting .333 after seven years in the majorleagues. He is a talented all-around player who has blazing speed on the basesand in the outfield. He averages 90 runs scored and 31 stolen bases a year. Healso is among the leaders in outfield defense, with excellent range and a pow-erful throwing arm. Manny Ramirez is another pure hitter who is less thaninterested in playing defense. The 34-year-old right-handed hitter has a .313batting average for 15 years in the big leagues, with an average of 105 runsscored, 38 home runs, and 125 RBIs a year. He had 490 career home runs
through 2007 and broke the 500 career home run barrier in 2008.
Offensive Ratings
Normalized AdjustedOn-Base Percentage (NOBPA)
Ted Williams had the highest published on-base percentage of any playerin the study as well as the highest on-base percentage of any major leagueplayer in the history of the game. His .482 OBP is eight points higher thanthe next man, Babe Ruth. His 121-point favorable OBP differential from theleague average was also the best of any player and again gave him the edge
1 0. Baseball’s Greatest Right Fielders and Left Fielders 189

7/25/2019 McNeil - All-Stars for All Time
http://slidepdf.com/reader/full/mcneil-all-stars-for-all-time 201/247
over Ruth, and he maintained that advantage after the era adjustment wasmade. Babe Ruth finished second to Williams in NOBPA, followed by Joe
Jackson and Stan Musial. Ott, Heilmann, and Henderson, who had pub-lished OBPs over .400, rounded out the top five, but Paul Waner, who hada .404 OBP, had a negative era adjustment, allowing Al Kaline to pass himin the ratings.
Normalized AdjustedSlugging Average (NXSLGA)
Once again, Babe Ruth and Ted Williams stood head and shouldersabove the competition in the slugging category. This time, Babe Ruth wasnumber one with a .690 published slugging average, and Ted Williams wasclose behind at .634. Neither man had a significant advantage in either era adjustment or park factor, enabling Ruth to protect his first-place lead to
190 A LL-STARS FOR A LL TIME
Vladimir Guerrero, a .325 hitter who is averaging 34 home runs a year, is in the mid-dle of a potential Hall of Fame career.

7/25/2019 McNeil - All-Stars for All Time
http://slidepdf.com/reader/full/mcneil-all-stars-for-all-time 202/247
the end. Stan Musial (.559), Frank Robinson (.537), Al Simmons (.535), MelOtt (.533), Willie Stargell (.529), Harry Heilmann (.520), Joe Jackson (.517),Bob Johnson (.506), Ducky Medwick (.505), and Goose Goslin (.500), had
published slugging averages over .500, and all of them except Goslin had a favorable differential to the league average of more than 100 points. WillieStargell, thanks to favorable era and park factor adjustments, leapfroggedMusial, Robinson, Simmons, and Ott to finish in third place in NXSLGA.
Al Simmons’ negative era and park factor adjustments dropped him fromfifth place to ninth place in the category. Musial held down fourth place, butMel Ott, thanks to his higher batting average, was fifth, ahead of Frank Robinson.
Normalized Stolen Bases (NSB)
Ricky Henderson had no competition in the stolen-base category withhis 72 stolen bases a year average. Joe Jackson, with 22 stolen bases, rankedsecond, while Frank Robinson with 12, Goose Goslin with 11, and Reggie
1 0. Baseball’s Greatest Right Fielders and Left Fielders 191
Ted Williams was the greatest hitter of the lively ball era, after 1920.

7/25/2019 McNeil - All-Stars for All Time
http://slidepdf.com/reader/full/mcneil-all-stars-for-all-time 203/247
Smith with 10 were the only other candidates to have ten or more stolen basesa year.
Normalized Sacrifice Hits (NSH)
The corner gardeners were not big on sacrifice hits. Their job was to drivethe ball for extra bases, not bunt. Harry Heilmann, although a slugger of note, laid down an average of 20 sacrifice bunts a year. Joe Jackson, anotherslugger, had 14, and Paul Waner had 10. No other candidate had more thanseven.
Normalized Grounded IntoDouble Plays (NGIDP)
The big men in this category hit into more double plays than the aver-age player. Al Simmons topped the list with 21 GIDPs. He was followed by Goose Goslin with 17 and Frank Robinson and Roberto Clemente with 16each. Only Ricky Henderson and Willie Stargell with nine GIDPs each andMel Ott with seven were below 10 GIDPs.
Final Offensive Ratings
There were some minor shifts, up and down, due to a player’s skills inthe stolen base, sacrifice hits, and grounded into double plays categories, butfor the most part the players who led the way after the OBP and SLG com-petitions also led the way in the final offensive ratings. Babe Ruth and Ted
Williams finished one-two, but Joe Jackson, thanks to his huge advantage overStan Musial in stolen bases and sacrifice hits, passed “Stan the Man,” for a third-place finish in the offensive ratings. The biggest change in the ratings
was Rickey Henderson’s jump from 18th place in the combined OBP andSLG categories to 14th place in the final overall ratings, thanks to his excel-lent showings in stolen bases and grounding into double plays. Passed by MelOtt, Stan Musial dropped from third to fifth place because of his poor show-ing in the stolen base and sacrifice hit categories.
Final NOBPA NXSLGA .05NSB .05NSH .05NGIDP Total Offensive × 20 × 20 × 20 × 20 × 20 Points Rating
Frank Robinson 16.674 12.351 0.167 0.050 0.438 29.680 6
Ted Williams 20.000 16.716 0.028 0.000 0.528 37.244 2
Carl Yastrzemski 16.421 8.582 0.111 0.000 0.467 25.581 17
Goose Goslin 15.453 10.187 0.153 0.500 0.412 26.705 13
192 A LL-STARS FOR A LL TIME

7/25/2019 McNeil - All-Stars for All Time
http://slidepdf.com/reader/full/mcneil-all-stars-for-all-time 204/247

7/25/2019 McNeil - All-Stars for All Time
http://slidepdf.com/reader/full/mcneil-all-stars-for-all-time 205/247
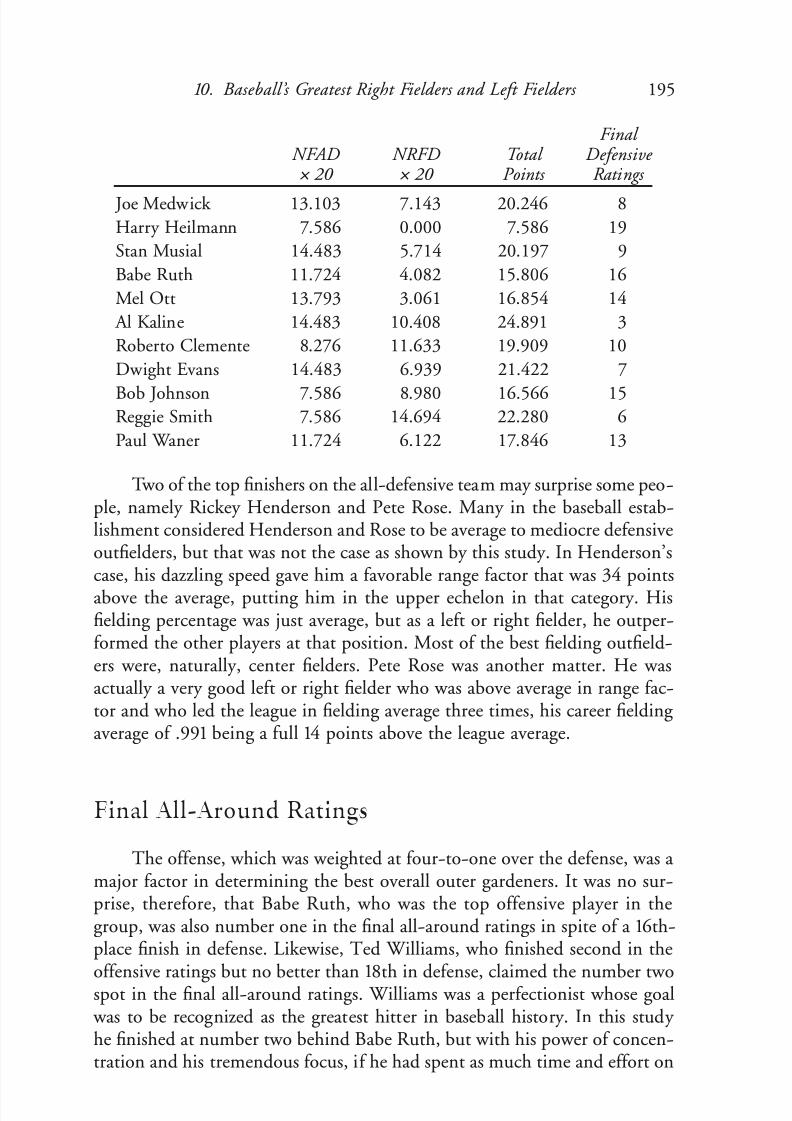
7/25/2019 McNeil - All-Stars for All Time
http://slidepdf.com/reader/full/mcneil-all-stars-for-all-time 206/247

7/25/2019 McNeil - All-Stars for All Time
http://slidepdf.com/reader/full/mcneil-all-stars-for-all-time 207/247
196 A LL-STARS FOR A LL TIME
Ichiro Suzuki, Japan’s all-time greatest hitter with a career average of .353, posted a .331 batting average after six years in the major leagues (courtesy James R. Madden, Jr.).

7/25/2019 McNeil - All-Stars for All Time
http://slidepdf.com/reader/full/mcneil-all-stars-for-all-time 208/247
his defensive play as he did on his offensive play, it is very possible that hecould have become a very solid outfielder, joining the same class as Al Sim-mons and Pete Rose. Under those circumstances, he might have passed Babe
Ruth in combined offense-defense and been rated as the greatest all-aroundoutfielder in major league baseball history. And, as noted above, Williams wasprobably penalized in the range factor category by the geometry of Fenway Park’s tiny left-field area that greatly reduces a fielder’s opportunities forputouts and assists.
Offense Defense Final Divided by Divided by Total All-Around
43 × 4 40 × 1 Points Ratings HOF
Frank Robinson 2.761 0.576 3.337 5 *
Ted Williams 3.465 0.278 3.743 2 *
Carl Yastrzemski 2.380 0.495 2.875 14 *
Goose Goslin 2.484 0.342 2.826 17 *
Al Simmons 2.485 0.760 3.471 7 *
Rickey Henderson 2.444 0.593 3.037 10
Joe Jackson 2.902 0.476 3.378 3
Willie Stargell 2.735 0.066 2.801 20 *
Pete Rose 2.116 0.750 2.866 15 Joe Medwick 2.413 0.506 2.919 12 *
Harry Heilmann 2.613 0.189 2.802 19 *
Stan Musial 2.855 0.505 3.360 4 *
Babe Ruth 3.755 0.395 4.150 1 *
Mel Ott 2.876 0.421 3.297 6 *
Al Kaline 2.540 0.622 3.162 8 *
Roberto Clemente 2.311 0.498 2.809 18 *
Dwight Evans 2.360 0.536 2.896 13Bob Johnson 2.541 0.414 2.955 11
Reggie Smith 2.539 0.567 3.106 9
Paul Waner 2.397 0.446 2.843 16 *
Barry Bonds and Sammy Sosa are in limbo at the present time. If at somefuture date they qualif y for the study, Bonds has an excellent chance to finishin the top three all-around, while Sosa might crack the top twenty.
Gary Sheffield’s offensive contributions give him a fighting chance of crashing this list, perhaps in the top ten, if he can maintain his current levelof production for the rest of his career; like other active players, he is ham-pered by negative era adjustments. His defense is above average for right andleft fielders, and that should help him in the final overall ratings. Vladimir
1 0. Baseball’s Greatest Right Fielders and Left Fielders 197

7/25/2019 McNeil - All-Stars for All Time
http://slidepdf.com/reader/full/mcneil-all-stars-for-all-time 209/247

7/25/2019 McNeil - All-Stars for All Time
http://slidepdf.com/reader/full/mcneil-all-stars-for-all-time 210/247
C HAPTER 11
Baseball’s GreatestCenter Fielders
There were ten players competing for the title of baseball’s greatest all-around center fielder.
• Willie Mays, a graduate of the Negro leagues, was a flashy bundle of tal-ent and energy who was called “the Say Hey Kid” because of his way of addressing people. The 5'11", 180-pound right-handed hitter has beencalled the greatest player of the twentieth century by many baseball
experts, or at least the greatest player of the last half of the century, shar-ing the honor with Joe DiMaggio. Mays was the prototypical five-toolplayer. He could hit for average, hit with power, run, field, and throw.He played for the Giants in both New York and San Francisco for 22
years, retiring in 1973 with a career average of .302, 3,283 base hits, 660home runs, and 2,062 runs scored. He is number seven all-time in careerruns scored, number ten in base hits, number four in home runs, andnumber nine in RBIs. Mays was Mister Giant during his career, leading the team to four World Series match-ups and one world championship,
with the New York Giants in 1954. His back-to-the-plate catch of a driveoff the bat of Vic Wertz in the eighth inning of Game One of that Series
with two men on base protected a 2–2 tie, and the Giants eventually wonthe game in the bottom of the tenth inning on a three-run homer by Dusty Rhodes. Mays’ catch has become legendary over the years, and hasbeen called the greatest catch in World Series history. Mays did make a sensational catch off Wertz, but in many situations he demonstrated hisflair for the dramatic by making the routine look extraordinary. Forinstance, he reportedly wore a hat one size too big so when he ran after a
fly ball, his hat would fly off, giving the impression of much greater speedon his part. And he would often time his pursuit of a fly ball in order to
199

7/25/2019 McNeil - All-Stars for All Time
http://slidepdf.com/reader/full/mcneil-all-stars-for-all-time 211/247
catch the ball on the run, giving the impression that he had made a sen-sational catch when in fact he had choreographed the entire scenario.Some outfielders, like Hank Aaron and Tris Speaker, would instinctively run to the spot where they had projected the ball to land, then turn andmake the routine catch. Not so with Willie Mays. Nothing he did was
Willie Mays, shown here in a Minneapolis Millers uniform from 1951, may havebeen baseball’s greatest all-around player during the second half of the twentiethcentury.

7/25/2019 McNeil - All-Stars for All Time
http://slidepdf.com/reader/full/mcneil-all-stars-for-all-time 212/247
routine. Still, in spite of his showmanship, he was one of the greatestplayers of his time. During his career, he led the league in batting onetime, with a .345 batting average in 1954. He led the league in runs
scored twice, base hits once, triples three times, home runs four times,on-base percentage three times, slugging average five times, stolen basesfour times, putouts once, assists twice, and double plays five times. Hescored over 100 runs for twelve consecutive years, drove in more than 100runs ten times, and hit more than 30 home runs eleven times, with highsof 52 home runs in 1965 and 51 in 1955. He is number one all-time incareer putouts by an outfielder with 7,095. In 1957, he put together a sea-son unmatched in baseball history, hitting 26 doubles, a league-leading
20 triples, 35 home runs, and a league-leading 38 stolen bases, becoming the first and only player to equal or exceed 20 in all four categories.
• Mickey Mantle, “the Commerce Comet,” might have been the greatestplayer to ever step on a baseball field if he could have exorcised hisdemons, but the demons got the best of him and slowly eroded his enor-mous skills. Several of Mantle’s male ancestors, including his father, haddied young, victims of Hodgkins disease. Mantle believed he would die
young as well, and tried to enjoy life to the fullest while he lived. Theresult was a decade of debauchery and all-night partying in the night-
spots around the American League, a practice that made him a shadow of his former self by the time he was 32. In addition to his wanton lifestyle,he also suffered from various knee injuries as well as from osteomyelitis, a severe bone disease that severely limited his range in the outfield and hisbase running capabilities. Still, the handsome, colorful 5'11", 198-pounderbecame one of the game’s legends and the greatest switch-hitter the gamehas ever known. The Oklahoma strongman hit some of the longest homeruns ever seen in a major league park, from both sides of the plate, in-cluding a 502-foot blast to right-center field in Yankee Stadium and a
565-foot homer over the left-field wall in Griffith Stadium. Mantle, whobroke into the New York Yankee lineup in 1951 as a 19-year-old phenom,hit just .267 in 96 games in his rookie season. The following year, heupped his average to .311 with 23 home runs, and in 1955, entering theprime of his career, he batted .306 while leading the American League intriples with 11, home runs with 37, bases on balls with 113, on-base per-centage with .431, and slugging average with .611. He went on to lead theleague in runs scored six times, triples once, home runs four times, RBIs
once, bases on balls five times, batting average once, on-base percentagethree times, slugging average four times, fielding average once, assistsonce, and double plays twice. His greatest year was 1956, when he wonthe Triple Crown and led the American League in batting (.353), runsscored (132), home runs (52), RBIs (130), and slugging average (.705).
11 . Baseball’s Greatest Center Fielders 201
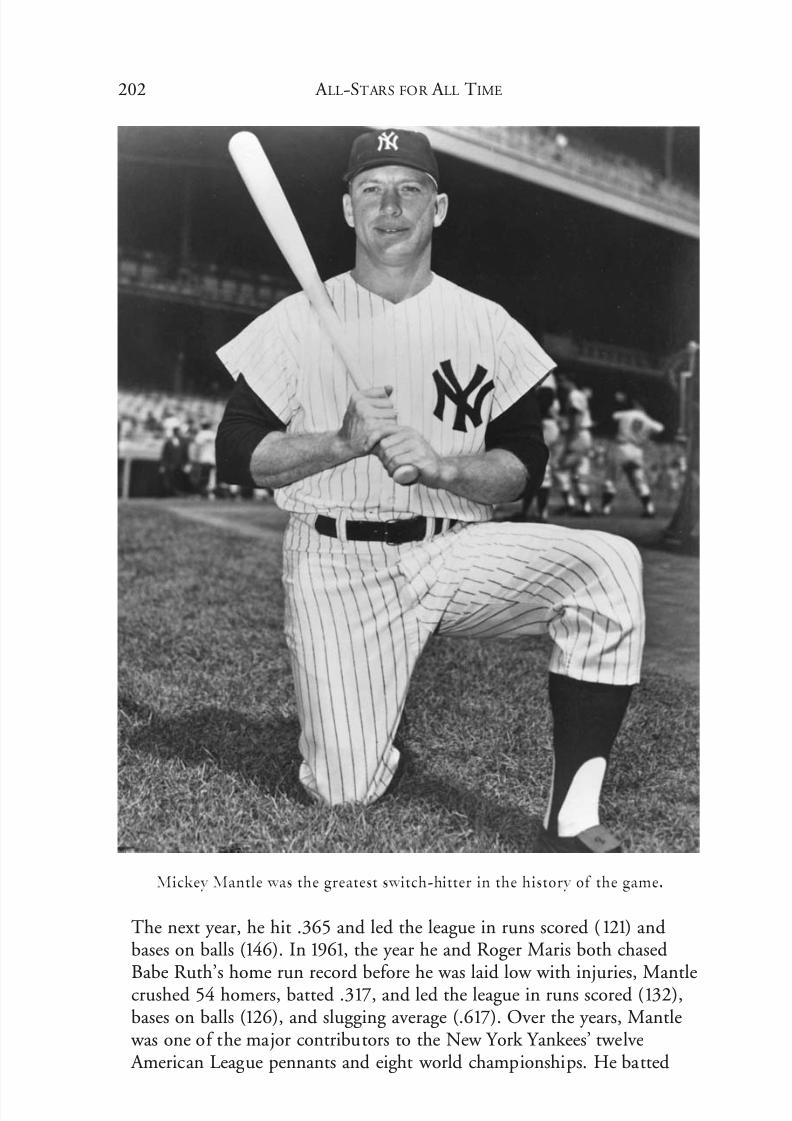
7/25/2019 McNeil - All-Stars for All Time
http://slidepdf.com/reader/full/mcneil-all-stars-for-all-time 213/247
The next year, he hit .365 and led the league in runs scored (121) andbases on balls (146). In 1961, the year he and Roger Maris both chased
Babe Ruth’s home run record before he was laid low with injuries, Mantlecrushed 54 homers, batted .317, and led the league in runs scored (132),bases on balls (126), and slugging average (.617). Over the years, Mantle
was one of the major contributors to the New York Yankees’ twelve American League pennants and eight world championships. He batted
202 A LL-STARS FOR A LL TIME
Mickey Mantle was the greatest switch-hitter in the history of the game.

7/25/2019 McNeil - All-Stars for All Time
http://slidepdf.com/reader/full/mcneil-all-stars-for-all-time 214/247
a modest .257 in 65 Series clashes and 230 at-bats, but he establishedtwo World Series career records with 18 home runs and 45 RBIs. Mantle,
who always swung as hard as he could on every pitch, struck out an
average of 118 times a season over his 18-year career, but he also walked116 times, and averaged 36 home runs, 114 runs scored, and 102 RBIs
with a .421 on-base percentage, the third highest OBP of the tencandidates. Once while Detroit Tiger star Al Kaline was signing auto-graphs, a young boy said to him, “You’re not half as good as Mickey Mantle,” to which Kaline replied, “Son, nobody is half as good as Mickey Mantle.”
• Joe DiMaggio, “the Yankee Clipper,” has been called the greatest all-
around player of the twentieth century by many baseball experts, and hisperformance on the field for 13 years would seem to justify that title. Joltin’ Joe arrived in New York in 1936 at the age of 21 after punishing Pacific Coast League pitching to the tune of .398, and he immediately took the big city by storm. He ripped into American League pitching
with gusto, batting .323 with 44 doubles, a league-leading 15 triples, 29home runs, 132 runs scored, and 125 RBIs. He continued his hard-hitting in the World Series with a .346 average as the Yankees took the measureof the New York Giants in six games. DiMaggio batted over .300 eleven
times in his 13-year career, but lost three years in the prime of his life tomilitary service during World War II. He led the American League inbatting in both 1939 and 1940 with averages of .381 and .382, respec-tively, hit .357 in 1941, tailed off to .305 the next year, and then left to
join the U.S. Army. The interruption robbed him of his best baseball years, but he did hit over .300 four more times after the war before retir-ing in 1951 at the age of 36. DiMaggio was a five-tool player and one of the game’s greatest center fielders. He could do it all, and unlike some of his rivals, he did it with class, making everything look easy. He had quick
reflexes, outstanding speed, and a powerful throwing arm, and he seemedto glide after fly balls. At the plate, his wide stance, short stride, andquick wrists gave him tremendous power, but unfortunately his power
was neutralized by Yankee Stadium’s enormous left-center field area,called “Death Valley,” that extended 457 feet from home plate. Joe D.averaged just 24 home runs for every 550 at-bats in Yankee Stadium dur-ing his career, but he pounded 36 home runs away from the Bronx. Healso had a great batting eye, striking out only 30 times a year while hit-ting 29 home runs. And he was an outstanding base runner, who ran thebases like a ballet dancer, gracefully and effortlessly. In 1941, DiMaggioset a major league record that has never been threatened. He hit in 56consecutive games, from May 18 to July 17, when Jim Bagby of Clevelandfinally shut him down in four at-bats with help from third baseman
11 . Baseball’s Greatest Center Fielders 203

7/25/2019 McNeil - All-Stars for All Time
http://slidepdf.com/reader/full/mcneil-all-stars-for-all-time 215/247
Ken Keltner, who made two sensational plays to rob the Yankee Clipper
of base hits. DiMaggio was one of the main cogs in the great Yankeemachine that won ten American League pennants and nine World Cham-pionships between 1936 and 1951. He won three Most Valuable Playertrophies during his career, and retired with a career batting average of .325.
204 A LL-STARS FOR A LL TIME
Joe DiMaggio was arguably baseball’s greatest all-around player during the first half of the twentieth century.

7/25/2019 McNeil - All-Stars for All Time
http://slidepdf.com/reader/full/mcneil-all-stars-for-all-time 216/247
• Duke Snider, Brook-lyn’s answer to Mantleand Mays, out-hit hit
his two rivals over thefive-year period from1953 through 1957,averaging 41 homersand 116 RBIs a year,compared to 39 and100 for Mays and 37and 112 for Mantle.
Unfortunately forSnider, the Dodgersmoved to Los Angelesin 1958, and Sniderhad to contend withthe L.A. Coliseum’svast right-field terri-tory that dramatically reduced his home run
totals and took its tollon his aging legs. Theman known as “theSilver Fox” was a Dodger fixture from1948 until 1963, whenhe was traded to thefledgling New York Mets. During his 18-year career, Snider batted .295
with 27 doubles, 31 home runs, 97 runs scored, and 102 RBIs a year. He
led the National League in runs scored three times, base hits, home runs,RBIs, bases on balls, and on-base percentage once each, and slugging average twice. Snider’s greatest day in baseball may have been May 30,1950, when he hit three home runs against the Philadelphia Phillies andmissed a fourth one when the ball struck the right-field wall one footfrom the top. Five years later, against Milwaukee, the big slugger hitthree home runs and a double, driving in six runs in an 11–8 win over theBraves. “The Duke of Flatbush” played in six World Series, winning one
World Championship. In 36 World Series games and 133 at-bats, he bat-ted .286, with a National League record eleven home runs and 26 RBIs.Twice he hit four home runs in a Series, tying Babe Ruth’s record for a single Series. He is the only man to ever hit four home runs in each of two World Series.
11 . Baseball’s Greatest Center Fielders 205
Duke Snider hit forty or more home runs in five con-secutive seasons.

7/25/2019 McNeil - All-Stars for All Time
http://slidepdf.com/reader/full/mcneil-all-stars-for-all-time 217/247
• Tris Speaker, “the Gray Eagle,” was so-named because, like Duke Snider,his hair was prematurely gray. Speaker has long been considered thegreatest defensive center fielder in baseball history. He was noted for
playing an exceptionally shallow center field, with the quick reflexes andspeed that was necessary to chase down and catch balls hit over his head.He was a great judge of how far and in what direction a batted ball
would travel, and was able to turn his back on the ball when it was hit,run to the spot where the ball would land, turn and make a routinecatch. The Gray Eagle was also an outstanding hitter and a dangerousbase runner. The 6', 193-pound left-handed hitter played 22 years in thebig leagues and hit over .300 eighteen times, including his first ten years
as a full-time player, with a high of .389 in1
925. Six times he battedover .370, and in 1916 he led the league in batting with a .386 average.He also led the league twice in base hits, eight times in doubles, once intriples, four times in on-base percentage, once in slugging average, twicein fielding average, seven times in putouts, three times in assists, and six times in double plays. The Hubbard, Texas, native was not a power hitterbut he drove the ball to the gaps in the outfield with regularity. His keenbatting eye and his patience at the plate rewarded him with 75 bases onballs a year against just 15 strikeouts. The walks, combined with his .345
career batting average, gave him the best career on-base percentage .428,of any of the center field candidates. His 792 career doubles are the mostin baseball history, and his 222 triples are number six all-time. He isnumber ten in runs scored (1,882) and extra-base hits (1,131), numbernine in on-base percentage (.428), number five in batting average (.345),number two in putouts (6,788), and number one in assists (148) anddouble plays (139).
• Jimmy Wynn, “the Toy Cannon,” so-named because of his explosive bat,played in the major leagues for fifteen years, most of it with the HoustonColt .45s, later the Astros. He was small by slugger standards, standing
just 5'9" tall , but he weighed a husky 170 pounds, and he hit the ball with authority, averaging 24 doubles and 24 home runs for every 550at-bats. The free-swinging Wynn struck out 118 times a year, but he alsodrew 101 bases on balls, scored 91 runs, and drove in 80. He led theleague in walks twice, with 148 in 1969 and 127 in 1976. His best year
was 1974 with the Los Angeles Dodgers when he hit .271 with 32 homeruns, 104 runs scored, and 108 RBIs. He also had a big year in 1967
when, in spite of a mediocre .247 batting average, he slammed 37homers, scored 102 runs, and drove in 107. Defensively, Wynn led theleague in fielding average and putouts twice, assists three times, anddouble plays four times.
206 A LL-STARS FOR A LL TIME

7/25/2019 McNeil - All-Stars for All Time
http://slidepdf.com/reader/full/mcneil-all-stars-for-all-time 218/247
• Hank Aaron was the consummate baseball player. He could do it all—hit for average, hit for power, run, field, and throw. The man who brokeBabe Ruth’s career home run record was more than a slugger. In addition
to leading the league in home runs three times, he also led the league inbatting twice, runs scored three times, doubles four times, RBIs fourtimes, and slugging average four times. He scored more than 100 runs ina season fifteen times in sixteen years, and drove in more than 100 runseleven times. He hit 30 or more home runs fifteen times, with a high of 47 homers in 1971. He stole 240 bases during his 23-year career, and hebatted over .300 fourteen times, finishing his career with a .305 batting average. One of his best years was 1963 when he batted .319, stole 31
bases, and led the league with1
21
runs scored, 44 homers,1
30 RBIs, anda .586 slugging average. His greatest day (or night) had to have been April 8, 1974, when he took an Al Downing slider downtown, depositing it into the Atlanta Braves’ bullpen in left-center field for career home runnumber 715, breaking the record of Babe Ruth that had stood for 47
years. Hammerin’ Hank was one of the game’s most consistent players,and he was most dangerous and best in post-season play, where he hita combined .362 with six home runs and 16 RBIs in 17 games. In 1957,after hitting the pennant-clinching home run for Atlanta, he went on to
punish New York Yankee pitching in the World Series to the tune of a .393 batting average, with three home runs and seven RBIs, as the Bravesspanked Casey Stengel’s Bronx Bombers, four games to three. The next
year, in a losing effort, Aaron batted .333 with two RBIs. And in 1969,in a losing National League Championship Series, he scorched the ballat a .357 clip with three home runs and seven RBIs in three games.
Aaron was a humble man who did his job in a workman-like manner while serving as an excellent role model for the young children aroundthe country. The man from Mobile, Alabama, quietly went about his
business, maintaining a low profile while all the while establishing hislegacy as a great all-around player. Offensively, he is number two incareer home runs (755), number two in at-bats (12,364), number fourin runs scored (2,174), number three in base hits (3,771), number ninein doubles (624), and number one in extra-base hits (1,477), total bases(6,856), and runs batted in (2,297). He was also one of the top defensiveoutfielders in the major leagues, leading the National League in putoutsthree times, assists once, and double plays four times, and he is numberseven in career putouts with 5,539.
• Kirby Puckett, a squat 5'8", 210-pound right-handed hitter, was theheart and soul of the Minnesota Twins for twelve years until eye problemsended his career at the age of 34. The Chicago native raced throughMinnesota’s minor league farm system like a fiery comet, leading the
11 . Baseball’s Greatest Center Fielders 207

7/25/2019 McNeil - All-Stars for All Time
http://slidepdf.com/reader/full/mcneil-all-stars-for-all-time 219/247
Appalachian League in batting with an average of .382 in 1982, and thenhitting .314 for Visalia in the California League before moving up to
AAA ball. Midway through the 1984 season, Puckett was promoted to
the major league roster where he proceeded to punch out four base hitsin his debut en route to winning American League Rookie of the Yearhonors. In 1986, the 25-year-old center fielder suddenly blossomed intoa power hitter. After hitting just four home runs in his first two years,covering 1,248 at-bats, Puckett pounded 31 homers in 680 at-bats, togo along with a .328 batting average, 223 base hits, 119 runs scored, 37doubles, 96 RBIs, and 20 stolen bases. The next year he produced similarnumbers while leading the Twins to the American League pennant. He
batted only .205 as the Twins dumped the Detroit Tigers in the ALCSfour game to one, but he sizzled in the World Series, batting .357 to leadTom Kelly’s team to a seven-game triumph over Whitey Herzog’s St.Louis Cardinals. In 1988, Kirby Puckett had one of his best years, batting a career-high .356 with 109 runs scored and a league-leading 234 basehits to go with 42 doubles, 24 homers, and 121 RBIs. The following yearhe won the batting title with a .339 average and once again led the league
with 215 base hits. The Twins, with Puckett leading the way, beat theChicago White Sox by eight games in the Western Division of the Amer-
ican League, and then took the measure of the Toronto Blue Jays in the ALCS, four games to one, with Puckett hitting a stratospheric .429 withtwo homers and six RBIs. In the Fall Classic, a four games-to-three vic-tory over the Atlanta Braves, Puckett hit only .250, but he rose to theoccasion in the last two games. With the Twins trailing the Braves threegames to two, Puckett smashed an RBI triple off Steve Avery in the firstinning of Game Six, and then carried the second run across himself. Inthe third inning, he quenched an Atlanta rally by making a sensationalcatch against the left-center field wall, robbing Ron Gant of an extra-base
hit and the Braves of at least one run. Two innings later, he hit sacrificefly to snap a 2–2 tie, after the Braves had scored in the top of the inning.
And then he put the icing on the cake by driving a game-winning homerun in the bottom of the eleventh inning, forcing Game Seven, an excit-ing pitching duel between Jack Morris and John Smoltz, won by theTwins, 1–0, in the bottom of the tenth inning on a bases-loaded singleby Gene Larkin. Puckett’s career ended four years later when glaucoma,a debilitating eye disease, forced him into premature retirement. During his career, he batted .318 and led the league in batting once, base hitsfour times, RBIs once, putouts three times, assists five times, and doubleplays four times.
• Ty Cobb compiled baseball’s all-time highest batting average, stroking the ball at a .366 clip for twenty-four years. He may have been baseball’s
208 A LL-STARS FOR A LL TIME

7/25/2019 McNeil - All-Stars for All Time
http://slidepdf.com/reader/full/mcneil-all-stars-for-all-time 220/247
most hated player, but he played the game with a passion unmatched inbaseball history by doing whatever it took to win a game. He was a fiercebase runner who set the standard for stolen bases in the early part of the
twentieth century. He was known to sharpen his spikes, sometimes in thedugout in full view of the opposing team, before a game so he couldcause serious damage to an infielder when he slid into a base. Cobb, a sleek 6'1", 175-pound left-handed batter, had blazing speed that stoodhim in good stead both on the bases and in the field. It has been erro-neously assumed that “the Georgia Peach” was strictly a singles hitter,but his .512 career slugging average belies that belief. Over his career,most of which was played in the dead-ball days, he averaged 35 doubles,1
4 triples, six home runs,1
08 runs scored, and 93 RBIs a year. He wasa scientific hitter who held the bat with his hands several inches apart sohe could shift them with the pitch and either pull a ball into right field orpush a line drive to left. And his exceptional eyesight permitted him to
wait until the last second to commit to a pitch. Cobb was one of the few players who did not adjust his approach to batting when the lively ballcame into play in 1920. When many of his counterparts began holding the bat down at the end to generate more power, Cobb continued tochoke up on the bat with his hands apart. He was always a sensational
hitter who, after batting just .240 as an 18-year old rookie in 1905, ranoff 23 consecutive years of hitting over .300, a major league record that
will probably never be broken. He won twelve batting championships,including nine in a row, and had seven consecutive years over .367, witha high of .420 in 1911. He also led the league five times in runs scored,eight times in base hits, three times in doubles, four times in triples,four times in RBIs, six times in on-base percentage, and eight times inslugging average. In the field, he led the league in fielding average andputouts once each, assists twice, and double plays four times. Cobb’s
biggest disappointments were probably the three straight humiliations histeams suffered at the hands of National League clubs in the World Seriesand his sub-par performances. The toothless Bengals were defeated by theChicago Cubs in the 1907 Fall Classic, four games to none with one tie.They fell to the Cubs again in 1908 in five games, and they were edged by the Pittsburgh Pirates the following year in seven games. Cobb batted a combined .262 in 17 games in the three Series after hitting a robust .350during regular-season play.
• Tony Gwynn, the pride of San Diego, was the major league’s leading bat-smith during the 1980s and 1990s, placing the ball neatly to all fieldsdepending on the pitch, the location of the pitch, and the game situation.The roly-poly left-handed hitter stroked the ball at a .338 clip during his20-year career, the seventeenth-highest career batting average in baseball
11 . Baseball’s Greatest Center Fielders 209

7/25/2019 McNeil - All-Stars for All Time
http://slidepdf.com/reader/full/mcneil-all-stars-for-all-time 221/247
history, and the highest career batting average since Ted Williams retiredin 1960. Over his career, Gwynn won eight batting titles, tying theNational League record set by Honus Wagner in 1911. In 1994, he chal-
lenged the magic .400 mark most of summer but fell six points short,finishing with a .394 average when the baseball season was suddenly cutshort by a players strike on August 11. In all, he batted over .367 fourtimes and hit over .350 on three other occasions. He led the Padres intothe postseason on three occasions and into the World Series twice, but histeam never grabbed the gold ring, falling to the Detroit Tigers in fivegames in 1984 prior to being swept by the New York Yankees in 1998. Inaddition to winning eight batting championships, Gwynn led the league
in runs scored once, base hits seven times, and on-base percentage once.He also had some outstanding seasons running the bases. He stole 319bases during his career, including 56 stolen bases in 1987 and 40 stolenbases in 1989. Defensively, Gwynn became a good outfielder through hard
work, and he combined his work ethic with exceptional speed to lead theleague in fielding average, assists, and double plays once each and putoutsthree times.
Active Players
Ken Griffey, Jr., is theonly active center fielder
who appears ready to claima place on this team whenhe retires. Cincinnati’s sen-sational center fielder wason track to hit 800 careerhome runs until injuries
derailed him in 2001. Hesuffered through six years of nagging injuries, hitting only 125 home runs overthat stretch, but he wasback on track in 2007. Hecan still top the 700 careerhome run mark if he playsanother five years, but hisdreams of hitting 800 homeruns and perhaps being hailed as baseball’s all-timegreatest all-around player
210 A LL-STARS FOR A LL TIME
Ken Griffey, Jr., cracked the 600 career home runbarrier early in 2008, making him just the sixthplayer to reach that elevated level (courtesy JamesR. Madden, Jr.).

7/25/2019 McNeil - All-Stars for All Time
http://slidepdf.com/reader/full/mcneil-all-stars-for-all-time 222/247
are a thing of the past. His offensive statistics through 2007 include a .290career batting average, with 96 runs scored, 37 home runs, and 106 RBIs per550 at-bats.
Offensive Ratings
Normalized Adjusted On-BasePercentage (NOBPA)
Ty Cobb (.431), Tris Speaker (.428), and Mickey Mantle (.421) were theonly center fielders with published OBPs over .400. When the necessary era adjustments were made, the top three retained their positions, except thatMantle slipped past Speaker into second place. None of the other center field-ers was able to challenge the top three. On the other hand, all the candidateshad respectable numbers, with Jimmy Wynn, who was last in the group, stillpresenting a strong .371 OBPA.
Normalized AdjustedSlugging Average (NXSLGA)
Six of the center-field candidates had slugging averages over .500, with Joe DiMaggio (.579), Willie Mays (.557), Mickey Mantle (.557), and Hank Aaron (.555), not surprisingly, leading the way, with Duke Snider (.540) closebehind. Snider, Puckett, and Gwynn were penalized by unfavorable era adjust-ments, while the other candidates benefited from favorable era adjustments,particularly Tris Speaker and Ty Cobb, who enjoyed 30-point and 21-pointfavorable adjustments, respectively. Joe DiMaggio, who had a 0.69 HomeRun Factor, received the biggest boost from the park factor adjustment, and
his .414 XSLGA was a full 38 points higher than the next man, Mickey Man-tle. Ty Cobb had a 0.29 HRF, but his adjusted home run average of sevenhome runs for every 550 at-bats was too low to have a significant effect onhis XSLGA. Duke Snider, hitting in friendly Ebbetts Field, had a 1.22 HRF,but the other big sluggers, Willie Mays (1.03 HRF), Hank Aaron (1.04 HRF),and Mickey Mantle (0.99 HRF), showed no advantage, either at home or onthe road. That is somewhat surprising in Mantle’s case. It might be assumedhe would have had a significant home advantage from hitting left-handed in
Yankee Stadium, especially when he hit 373 of his 536 home runs batting left-handed, but Mantle was more of a straightaway hitter than a pull hitter,and that neutralized his apparent home field advantage. DiMaggio, Mantle,
Aaron, Mays, and Snider, in that order, easily outdistanced the other five can-didates in the slugging average category.
11 . Baseball’s Greatest Center Fielders 211

7/25/2019 McNeil - All-Stars for All Time
http://slidepdf.com/reader/full/mcneil-all-stars-for-all-time 223/247
Normalized Stolen Bases (NSB)
Ty Cobb, with his flaming afterburners, made a shambles of the stolen-
base category, averaging 43 stolen bases a year compared to 24 stolen bases a year for Tris Speaker and 20 for Tony Gwynn. Joe DiMaggio, with only twostolen bases a year, finished in last place. Actually, Joe D. was an excellentbase runner with good speed, but in a lineup that included such sluggers asLou Gehrig , Bill Dickey, Charlie Keller, and Tommy Henrich, there was very little incentive for a Yankee base runner to try to steal a base. Duke Snider,
who averaged eight steals a year, was in a similar situation with Roy Campa-nella, Gil Hodges, Jackie Robinson, and Carl Furillo waiting to drive him in.
Normalized Sacrifice Hits (NSH)
Sacrifice hits, like the corncob pipe, went out of style as the twentiethcentury progressed. Tri Speaker with 17 sacrifice hits and Ty Cobb with 14topped the sacrifice-hit category, while Mays, Mantle, and DiMaggio, withone sacrifice hit each, tied for the bottom spot.
Normalized Grounded Into
Double Plays (NGIDP)
Most of the candidates for the center-field position had above averagespeed, a necessary requirement for a position that was responsible for patrolling a vast expanse of territory beyond the infield grass, especially in those instances
when the corner gardeners had lead feet, as often occurred. Mickey Mantle, who grounded into only eight double plays a year, set the pace in that cate-gory, with Jimmy Wynn close behind with nine GIDPs. Aaron and Gwynn
with 16 GIDPs and Puckett with 15 brought up the rear.
Final Offensive Ratings
As might be expected, the final offensive center-field ratings were biasedin favor of the big sluggers, especially ones with favorable era and park fac-tor adjustments. Mickey Mantle, whose 116 bases on balls a year, comparedto 74 bases on balls and 64 bases on balls for fellow sluggers Willie Mays and
Joe DiMaggio, respectively, gave him a big lead in NOBPA, and his second-place finish, behind Joe D., in NXSLGA allowed him to maintain his leadthroughout the remainder of the competition. DiMaggio finished second and
Aaron came in third. Cobb and Speaker, who ran one and three in NOBPA,faltered in the slugging competition, finishing fifth and sixth overall. WillieMays finished fourth in NOBPA, fourth in NXSLGA, and fourth overall.
212 A LL-STARS FOR A LL TIME

7/25/2019 McNeil - All-Stars for All Time
http://slidepdf.com/reader/full/mcneil-all-stars-for-all-time 224/247
Final NOBPA NXSLGA .05NSB .05NSH .05GIDP Total Offensive × 20 × 20 × 20 × 20 × 20 Points Ratings
Willie Mays 16.168 13.060 0.250 0.050 0.538 30.066 4Mickey Mantle 17.979 14.030 0.139 0.050 0.875 33.073 1
Joe DiMaggio 16.126 15.448 0.028 0.050 0.700 32.352 2
Duke Snider 15.832 12.873 0.111 0.250 0.538 29.604 7
Tris Speaker 17.895 9.925 0.333 0.850 0.700 29.703 6
Jimmy Wynn 15.621 9.813 0.236 0.150 0.778 26.598 8
Hank Aaron 15.747 13.806 0.167 0.100 0.438 30.258 3
Kirby Puckett 15.158 7.015 0.125 0.100 0.467 22.865 10
Ty Cobb 18.274 9.664 0.597 0.700 0.700 29.935 5Tony Gwynn 16.211 6.418 0.278 0.100 0.438 23.445 9
Defensive Ratings
Normalized Fielding AverageDifferential (NFAD)
All the center-field candidates were outstanding defensive players, andall of them had career fielding averages higher than the league average. TrisSpeaker, who was noted for his shallow play, his quick reflexes, and his blaz-ing speed, finished his career with a .970 fielding average, a full ten pointshigher than the league average. Kirby Puckett enjoyed a nine-point advan-tage, and Duke Snider had a seven-point advantage.
Normalized Range Factor Differential (NRFD)
Speaker’s great speed gave him an excellent 2.68 range factor, 60 pointsabove the league average, but that only gained him second place in the cate-gory. Willie Mays, who posted a 2.73 range factor, finished in first place asa result of his 63-point advantage over the league average. Kirby Puckett,
with a plus 59-point advantage, pressed Speaker. Once again, all the candi-dates had positive range factors, justifying their place in the competition.
Final Defensive Ratings
The battle for number one in the defensive center-field category was a close race, particularly between Tris Speaker, Kirby Puckett, and Willie Mays.Speaker claimed the overall prize as a result of his first-place finish in theNFAD category and his second-place finish in the NRFD category. Kirby
11 . Baseball’s Greatest Center Fielders 213

7/25/2019 McNeil - All-Stars for All Time
http://slidepdf.com/reader/full/mcneil-all-stars-for-all-time 225/247
Puckett nosed out Willie Mays for second place, with Joe DiMaggio and Jimmy Wynn finishing fourth and fifth, respectively.
Final NFAD NRFD Total Defensive × 20 × 20 Points Ratings
Willie Mays 13.103 20.000 33.103 3
Mickey Mantle 11.724 12.449 24.173 9
Joe DiMaggio 13.103 15.510 28.613 4
Duke Snider 15.172 10.000 25.172 6
Tris Speaker 17.241 19.388 36.629 1
Jimmy Wynn 13.793 14.694 28.487 5Hank Aaron 13.103 11.224 24.327 8
Kirby Puckett 16.552 19.184 35.736 2
Ty Cobb 11.034 12.245 23.279 10
Tony Gwynn 14.483 10.204 24.687 7
Final All-Around Ratings
The final all-around ratings for center fielders favored the offense overthe defense by a three-to-one ratio. Once again, the Gray Eagle, Tris Speaker,confounded the experts who predicted that either Joe DiMaggio or WillieMays would grab the brass ring. Speaker parlayed his sixth-place finish inoffensive ratings with a dominating first-place finish in the defensive ratingsto narrowly defeat the Yankee Clipper for the overall title. DiMaggio enjoyeda big advantage over Speaker in the offensive ratings, but was severely out-distanced by Speaker in the defensive ratings. Mickey Mantle, who slugged
his way to a convincing first-place rating in the offensive category, fell vic-tim to his nagging leg injuries that greatly reduced his ability to cover largeexpanses of territory in the outfield, relegating him to a ninth-place finish inthe defensive category and fourth place overall.
Offense Defense Final Divided by Divided Total All-Around
43 × 3 by 40 Points Ratings HOF
Willie Mays 2.098 0.828 2.926 3 *
Mickey Mantle 2.307 0.604 2.911 4 *
Joe DiMaggio 2.257 0.715 2.972 2 *
Duke Snider 2.065 0.629 2.694 6 *
Tris Speaker 2.072 0.916 2.988 1 *
214 A LL-STARS FOR A LL TIME

7/25/2019 McNeil - All-Stars for All Time
http://slidepdf.com/reader/full/mcneil-all-stars-for-all-time 226/247
Jimmy Wynn 1.856 0.712 2.568 8
Hank Aaron 2.111 0.608 2.719 5 *
Kirby Puckett 1.595 0.893 2.488 9 *
Ty Cobb 2.088 0.582 2.670 7 *
Tony Gwynn 1.636 0.617 2.253 10 *
Ken Griffey Jr., one of the top sluggers of his era, could finish in the topten offensively, but probably not in the top five because of his negative era
and park factor adjustments. His 29-point negative era adjustment, in par-ticular, cost him valuable points in the slugging average category. And ondefense, he suffered from a negative fielding average differential. No centerfielder in this study had a negative fielding average differential. He shows a decent range factor differential, but not great enough to overcome his low fielding average point total. The projected finish for Griffey at the present timeis approximately an eighth-place finish in the offensive ratings, a tenth-placefinish in the defensive ratings, and a tenth-place finish overall.
11 . Baseball’s Greatest Center Fielders 215
Offense Defense Final Divided by Divided Total All-Around
43 × 3 by 40 Points Ratings HOF

7/25/2019 McNeil - All-Stars for All Time
http://slidepdf.com/reader/full/mcneil-all-stars-for-all-time 227/247
C HAPTER 12
Baseball’sLegendary All-Stars
Baseball’s Legendary All-Star Team, based on both the offensive anddefensive skills of the candidates, is given below. The outfielders were ratedon a 4-to-1 offense-to-defense ratio for this team. The team would have beenslightly different if the center-field candidates were separated from the otheroutfield positions, and were rated with a 3-to-1 ratio, as they are in the fourall-star teams that follow.
216
C Roy Campanella Gabby Hartnett
P Walter Johnson
Grover Cleveland Alexander
Cy Young
Lefty Grove
Tom Seaver
Christy MathewsonSandy Koufax
Whitey Ford
P Dizzy DeanEd Walsh
1B Lou Gehrig
Jimmie Foxx
2B Nap Lajoie
Bobby Grich
SS Honus Wagner
Lou Boudreau
3B Mike SchmidtBrooks Robinson
OF Babe Ruth
OF Ted Williams Joe DiMaggio
Mickey Mantle
Tris Speaker
Willie Mays
Al Simmons
Hank Aaron
Duke Snider
Joe Jackson
Baseball’s Legendary All-Star Teams
Top Four Teams
The following table identifies the top four all-time all-star teams as deter-mined by this study. There are not many surprises on the teams. Even the younger fans will be happy to see such modern legends as Ozzie Smith, Mike
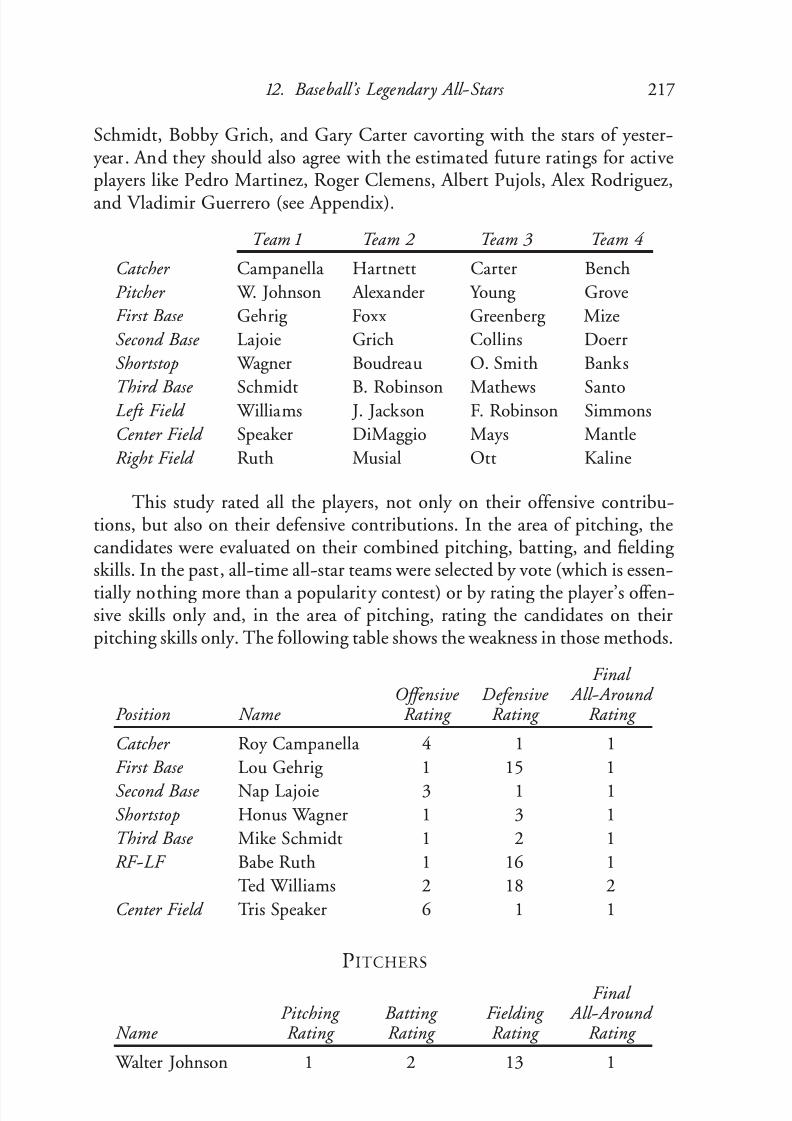
7/25/2019 McNeil - All-Stars for All Time
http://slidepdf.com/reader/full/mcneil-all-stars-for-all-time 228/247
Schmidt, Bobby Grich, and Gary Carter cavorting with the stars of yester- year. And they should also agree with the estimated future ratings for activeplayers like Pedro Martinez, Roger Clemens, Albert Pujols, Alex Rodriguez,
and Vladimir Guerrero (see Appendix).
Team 1 Team 2 Team 3 Team 4
Catcher Campanella Hartnett Carter Bench
Pitcher W. Johnson Alexander Young Grove
First Base Gehrig Foxx Greenberg Mize
Second Base Lajoie Grich Collins Doerr
Shortstop Wagner Boudreau O. Smith Banks
Third Base Schmidt B. Robinson Mathews SantoLeft Field Williams J. Jackson F. Robinson Simmons
Center Field Speaker DiMaggio Mays Mantle
Right Field Ruth Musial Ott Kaline
This study rated all the players, not only on their offensive contribu-tions, but also on their defensive contributions. In the area of pitching, thecandidates were evaluated on their combined pitching, batting, and fielding skills. In the past, all-time all-star teams were selected by vote (which is essen-
tially nothing more than a popularity contest) or by rating the player’s offen-sive skills only and, in the area of pitching, rating the candidates on theirpitching skills only. The following table shows the weakness in those methods.
Final Offensive Defensive All-Around
Position Name Rating Rating Rating
Catcher Roy Campanella 4 1 1
First Base Lou Gehrig 1 15 1
Second Base Nap Lajoie 3 1 1Shortstop Honus Wagner 1 3 1
Third Base Mike Schmidt 1 2 1
RF-LF Babe Ruth 1 16 1
Ted Williams 2 18 2
Center Field Tris Speaker 6 1 1
PITCHERS
Final Pitching Batting Fielding All-Around
Name Rating Rating Rating Rating
Walter Johnson 1 2 13 1
1 2. Baseball’s Legendary All-Stars 217

7/25/2019 McNeil - All-Stars for All Time
http://slidepdf.com/reader/full/mcneil-all-stars-for-all-time 229/247
218 A LL-STARS FOR A LL TIME
Roger Clemens, still active in 2007 at the age of 45, reached the 354 career victory total, moving him into eighth place on the all-time list (courtesy Boston Red Sox).

7/25/2019 McNeil - All-Stars for All Time
http://slidepdf.com/reader/full/mcneil-all-stars-for-all-time 230/247
If the All-Time All-Star team had been selected on offense only, GeneTenace would have been the catcher, with Mickey Cochrane a close second.Rogers Hornsby would have been the second baseman, and Mickey Mantle
would have been the center fielder.
SECOND T EAM
Final Offensive Defensive All-Around
Position Name Rating Rating Rating
Catcher Gabby Hartnett 5 2 2
First Base Jimmie Foxx 2 6 2
Second Base Bobby Grich 8 4 2Shortstop Lou Boudreau 5 2 2
Third Base Brooks Robinson 13 1 2
RF-LF Joe Jackson 3 12 3
Stan Musial 5 9 4
Center Field Joe DiMaggio 2 4 2
PITCHERS
Final Pitching Batting Fielding All-Around
Name Rating Rating Rating Rating
Grover Cleveland Alexander 3 10 5 2
Based on offense only, or pitching only in the case of the pitcher, thesecond team would have consisted of Cochrane, Foxx, Morgan, Banks, Math-ews, Jackson, Musial, DiMaggio and Grove.
B ASEBALL ’S GREATEST OFFENSIVE T EAM— AS DETERMINED BY THIS STUDY
1 2. Baseball’s Legendary All-Stars 219
C Gene Tenace
Mickey Cochrane
P Wes Ferrell
Walter Johnson
1B Lou Gehrig
Jimmie Foxx
2B Rogers Hornsby
Joe Morgan
SS Honus Wagner
Ernie Banks
3B Mike Schmidt
Eddie Mathews
RF-LF Babe Ruth
Ted Williams
Joe Jackson
Mel Ott
Stan Musial
CF Mickey Mantle
Joe DiMaggio
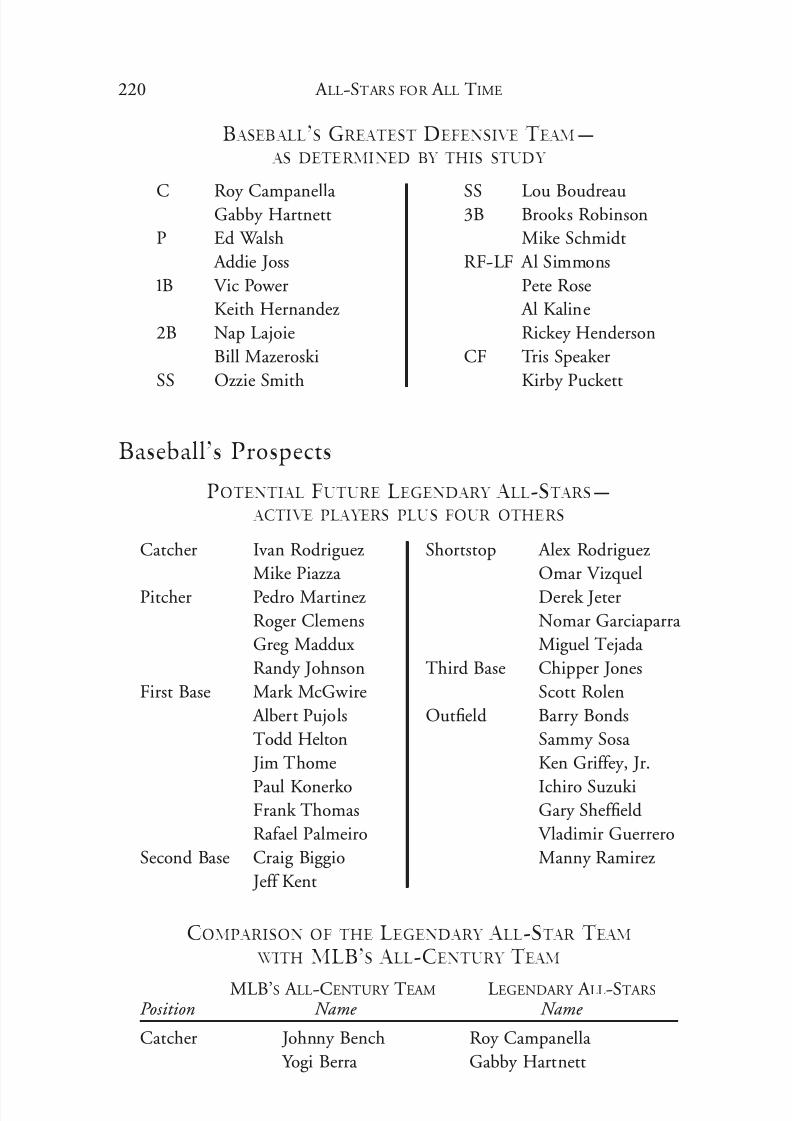
7/25/2019 McNeil - All-Stars for All Time
http://slidepdf.com/reader/full/mcneil-all-stars-for-all-time 231/247

7/25/2019 McNeil - All-Stars for All Time
http://slidepdf.com/reader/full/mcneil-all-stars-for-all-time 232/247
Pitcher Nolan Ryan Walter Johnson
Sandy Koufax Grover Cleveland Alexander
Cy Young Cy Young
Roger Clemens Lefty Grove
Bob Gibson Tom Seaver
Walter Johnson Christy Mathewson
First Base Lou Gehrig Lou Gehrig
Mark McGwire Jimmie Foxx
Second Base Jackie Robinson Nap Lajoie
Rogers Hornsby Bobby GrichShortstop Cal Ripken Honus Wagner
Ernie Banks Lou Boudreau
Third Base Mike Schmidt Mike Schmidt
Brooks Robinson Brooks Robinson
Outfield Babe Ruth Babe Ruth
Hank Aaron Ted Williams
Ted Williams Joe DiMaggio
Willie Mays Mickey Mantle Joe DiMaggio Tris Speaker
Mickey Mantle Willie Mays
Baseball’s thirty greatest offensive players, as determined by the sum of their runs scored per total at-bats including bases on balls, and their runs bat-ted in per official at-bats with walks excluded, were compared to the ratingsof the OBP/SLG composite and the ratings from this study.
Runs/ RBIs/ Total OBP/SLG This Study Tot. AB Off. AB Points Rating Rating Rating
Babe Ruth .208 .263 .471 1 1 1
Lou Gehrig .199 .249 .448 2 3 3
Ted Williams .185 .239 .424 3 2 2
Hank Greenberg .174 .246 .420 4 5 7
Jimmie Foxx .183 .236 .419 5 4 5
Joe DiMaggio .183 .225 .408 6 8 6
Roy Campanella .132 .244 .376 7 19
Rogers Hornsby .171 .194 .365 8 6 8
Mel Ott .167 .197 .364 9 11 9
Johnny Mize .153 .208 .361 10 10 12
Mickey Mantle .171 .186 .357 11 7 4
1 2. Baseball’s Legendary All-Stars 221
MLB’S A LL-CENTURY TEAM LEGENDARY A LL-STARS
Position Name Name

7/25/2019 McNeil - All-Stars for All Time
http://slidepdf.com/reader/full/mcneil-all-stars-for-all-time 233/247
Harry Heilmann .149 .198 .347 12 19 24
Ty Cobb .177 .169 .346 13 13 11
Hank Aaron .158 .186 .344 14 20
Mike Schmidt .153 .191 .344 14 14
Willie Mays .167 .175 .342 16 15 16
Frank Robinson .160 .181 .341 17 24
Mickey Cochrane .173 .161 .334 18 37 15
Stan Musial .155 .178 .333 19 9 10
Yogi Berra .142 .189 .331 20
Eddie Mathews .151 .170 .321 21 43 23Duke Snider .135 .186 .321 21 27
Honus Wagner .153 .166 .319 23 20
Willie McCovey .129 .190 .319 24 39 22
Joe Jackson .159 .158 .317 25 16
Nap Lajoie .149 .167 .316 26 27
Tris Speaker .163 .150 .313 27 23
Reggie Jackson .138 .173 .311 28
Johnny Bench .128 .180 .308 29 17Ernie Banks .128 .174 .302 30 29
Note: Mark McGwire would be number seven in the Runs/RBI ratings, number eight in OBP/SLG, and number eight in this study. Barry Bonds would be number eight,number four, and number four, respectively. The Barry Bonds prior to 1 999 would be number eleven in this study.
This study was not intended to be the end-all, greatest all-star team. Itis simply the first all-time all-star team based on a complete evaluation of a
player’s skills, both offensively and defensively. My hope is that, in the nearfuture, Pete Palmer will present his ultimate all-star team composed of thegreatest players at each position. As the most talented and respected baseballstatistician in the field today, Palmer has developed the most sophisticatedformulas for evaluating the offensive and defensive contributions of majorleague baseball players, and he is well positioned to achieve the final result.From his existing Total Baseball Ranking (TBR) formulas, and from his cor-respondence, I believe he needs only to make a few minor modifications tohis present formulas, such as including a caught-stealing percentage in his for-mula for catchers, and then replacing the generalized park factors with indi-vidual park factors and converting his formulas from a value system to a skillsystem. He can also eliminate the positional adjustment since each player willbe evaluated against only players playing the same position.
222 A LL-STARS FOR A LL TIME
Runs/ RBIs/ Total OBP/SLG This Study Tot. AB Off. AB Points Rating Rating Rating

7/25/2019 McNeil - All-Stars for All Time
http://slidepdf.com/reader/full/mcneil-all-stars-for-all-time 234/247

7/25/2019 McNeil - All-Stars for All Time
http://slidepdf.com/reader/full/mcneil-all-stars-for-all-time 235/247
league baseball, on March 17, 2005. McGwire, who had previously admittedtaking androstenedione, a muscle-building supplement that has since beenadded to the illegal steroid list, refused to answer questions about whether or
not he took steroids, saying repeatedly that he did not want to discuss thepast. Palmeiro emphatically denied taking steroids but, shockingly, was sus-pended by major league baseball less than five months later for testing posi-tive for steroids. And this occurred just one month after he had joined WillieMays, Hank Aaron, and Eddie Murray as the only major league players with3,000 base hits and 500 home runs. He subsequently retired.
The evidence against the four players, most of which is circumstantial,ranges from flimsy to fairly strong. As far as I know, there is no credible
evidence against Sammy Sosa except his Samsonian physique and his CHR curve that will be discussed shortly. The evidence against McGwire con-sists of his admission to taking andro, his CHR curve, his bulging physique,and the testimony of Jose Canseco that he had administered steroids to McG- wire. The evidence against Palmeiro consists of his CHR curve, testimony of Jose Canseco, and a positive steroid test taken by MLB in 2005.
The strongest case seems to be the case against Barry Bonds. His enor-mous physique and puffy face have been interpreted as a sign that he was tak-ing steroids. Reportedly, Bonds testified to the grand jury that he took “the
Clear” and “the Cream,” two steroids given to him by his trainer, Greg Ander-son, but he denied that he knew the two substances were steroids that wereundetectable by existing steroid testing procedures. He said he thought he was taking flaxseed oil and arthritis balm. Anderson, who spent three monthsin jail in 2003 for distributing steroids, went back to jail in August 2006 forrefusing to testify against Barry Bonds in Bonds’ perjury investigation priorto being released in late 2007. Many people feel that Anderson’s refusal totestify is proof of Bonds’ guilt. Bonds’ alleged mistress, Kimberly Bell, whosaid she was Bonds’ girlfriend for nine years, from 1994 to 2003, told Ger-
aldo Rivera that Bonds said he was taking steroids as early as 1999.In addition to testimony from former players and associates of Bonds,
Sosa, McGwire and Palmeiro, statistical evidence is becoming more and moreincriminating. Gabriel Costa, Michael Huber, and John Saccoman wrote anilluminating and informative treatise titled “Cumulative Home Run Fre-quency and the Recent Home Run Explosion,” for SABR’s Baseball Research
Journal in 2005. In it, they graphed the cumulative home run ratios (CHR)for all players with more than 500 career home runs. Their findings were notunexpected. Most of the elite sluggers prior to the 1990s, including BabeRuth, Hank Aaron, and Mike Schmidt, reached the peak of their CHRs by their mid-to-late twenties, with very little variability thereafter. A subsequentstudy by the author confirmed the findings of the first group. Today’s active500-career home runs sluggers—Jim Thome, Ken Griffey, Jr., Manny
224 A PPENDIX : THE STEROID PROBLEM
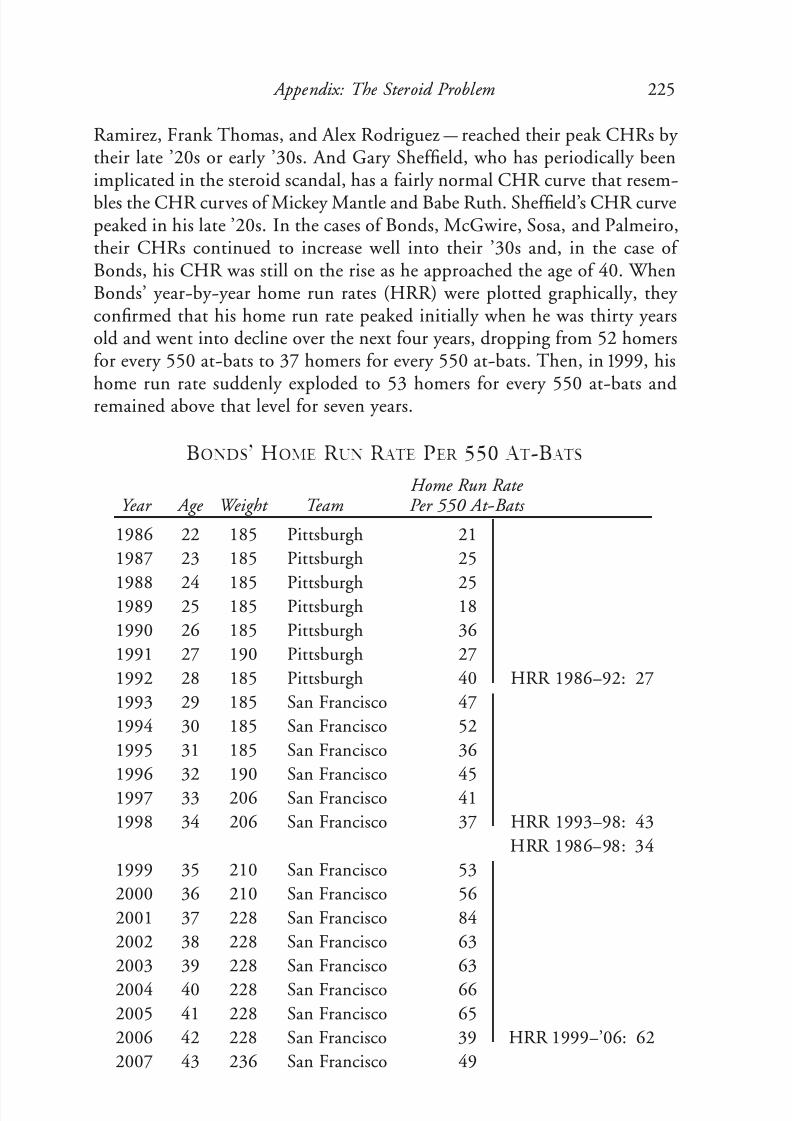
7/25/2019 McNeil - All-Stars for All Time
http://slidepdf.com/reader/full/mcneil-all-stars-for-all-time 236/247
Ramirez, Frank Thomas, and Alex Rodriguez—reached their peak CHRs by their late ’20s or early ’30s. And Gary Sheffield, who has periodically beenimplicated in the steroid scandal, has a fairly normal CHR curve that resem-
bles the CHR curves of Mickey Mantle and Babe Ruth. Sheffield’s CHR curvepeaked in his late ’20s. In the cases of Bonds, McGwire, Sosa, and Palmeiro,their CHRs continued to increase well into their ’30s and, in the case of Bonds, his CHR was still on the rise as he approached the age of 40. WhenBonds’ year-by-year home run rates (HRR) were plotted graphically, they confirmed that his home run rate peaked initially when he was thirty yearsold and went into decline over the next four years, dropping from 52 homersfor every 550 at-bats to 37 homers for every 550 at-bats. Then, in 1999, his
home run rate suddenly exploded to 53 homers for every 550 at-bats andremained above that level for seven years.
BONDS’ HOME R UN R ATE PER 550 A T -B ATS
Home Run RateYear Age Weight Team Per 550 At-Bats
1986 22 185 Pittsburgh 21
1987 23 185 Pittsburgh 25
1988 24 185 Pittsburgh 251989 25 185 Pittsburgh 18
1990 26 185 Pittsburgh 36
1991 27 190 Pittsburgh 27
1992 28 185 Pittsburgh 40 HRR 1986–92: 27
1993 29 185 San Francisco 47
1994 30 185 San Francisco 52
1995 31 185 San Francisco 36
1996 32 190 San Francisco 45
1997 33 206 San Francisco 41
1998 34 206 San Francisco 37 HRR 1993–98: 43
HRR 1986–98: 34
1999 35 210 San Francisco 53
2000 36 210 San Francisco 56
2001 37 228 San Francisco 84
2002 38 228 San Francisco 63
2003 39 228 San Francisco 63
2004 40 228 San Francisco 66
2005 41 228 San Francisco 65
2006 42 228 San Francisco 39 HRR 1999–’06: 62
2007 43 236 San Francisco 49
Appendix: The Steroid Problem 225
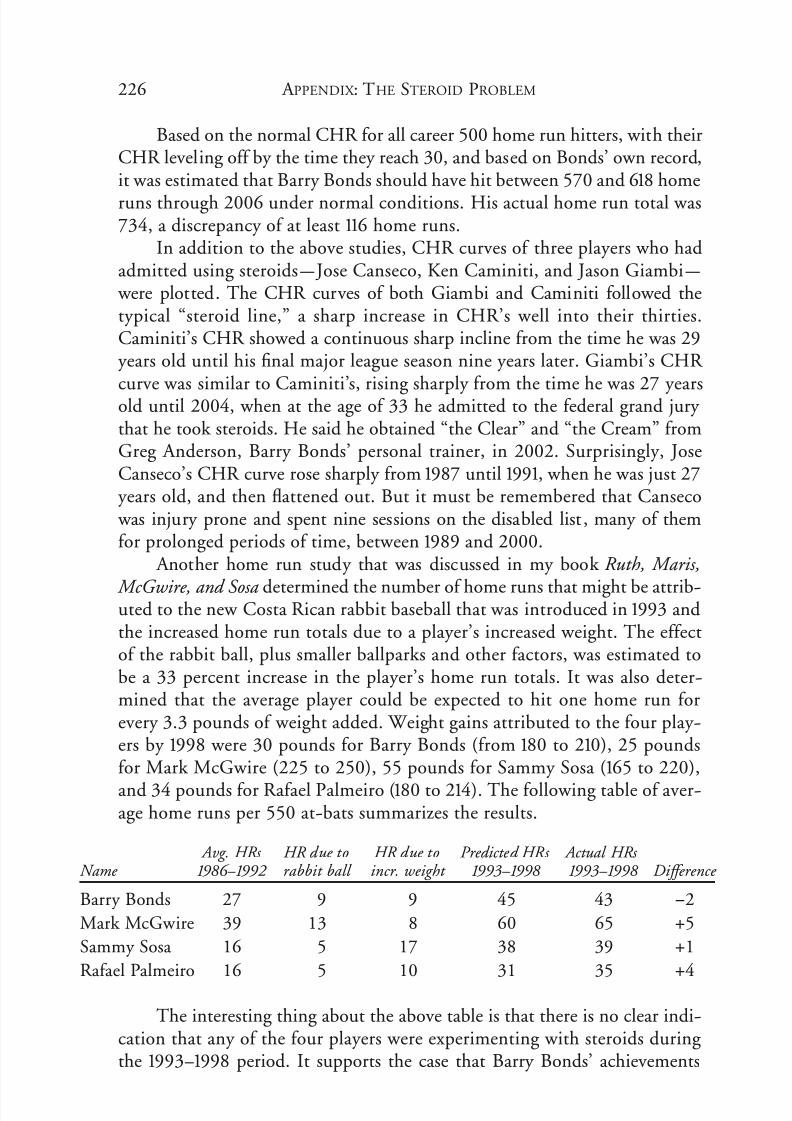
7/25/2019 McNeil - All-Stars for All Time
http://slidepdf.com/reader/full/mcneil-all-stars-for-all-time 237/247
Based on the normal CHR for all career 500 home run hitters, with theirCHR leveling off by the time they reach 30, and based on Bonds’ own record,it was estimated that Barry Bonds should have hit between 570 and 618 home
runs through 2006 under normal conditions. His actual home run total was734, a discrepancy of at least 116 home runs.
In addition to the above studies, CHR curves of three players who hadadmitted using steroids—Jose Canseco, Ken Caminiti, and Jason Giambi— were plotted. The CHR curves of both Giambi and Caminiti followed thetypical “steroid line,” a sharp increase in CHR’s well into their thirties.Caminiti’s CHR showed a continuous sharp incline from the time he was 29years old until his final major league season nine years later. Giambi’s CHR
curve was similar to Caminiti’s, rising sharply from the time he was 27 yearsold until 2004, when at the age of 33 he admitted to the federal grand jury that he took steroids. He said he obtained “the Clear” and “the Cream” fromGreg Anderson, Barry Bonds’ personal trainer, in 2002. Surprisingly, JoseCanseco’s CHR curve rose sharply from 1987 until 1991, when he was just 27years old, and then flattened out. But it must be remembered that Canseco was injury prone and spent nine sessions on the disabled list , many of themfor prolonged periods of time, between 1989 and 2000.
Another home run study that was discussed in my book Ruth, Maris,
McGwire, and Sosa determined the number of home runs that might be attrib-uted to the new Costa Rican rabbit baseball that was introduced in 1993 andthe increased home run totals due to a player’s increased weight. The effectof the rabbit ball, plus smaller ballparks and other factors, was estimated tobe a 33 percent increase in the player’s home run totals. It was also deter-mined that the average player could be expected to hit one home run forevery 3.3 pounds of weight added. Weight gains attributed to the four play-ers by 1998 were 30 pounds for Barry Bonds (from 180 to 210), 25 poundsfor Mark McGwire (225 to 250), 55 pounds for Sammy Sosa (165 to 220),
and 34 pounds for Rafael Palmeiro (180 to 214). The following table of aver-age home runs per 550 at-bats summarizes the results.
226 A PPENDIX : THE STEROID PROBLEM
Avg. HRs HR due to HR due to Predicted HRs Actual HRs Name 1 986–1 992 rabbit ball incr. weight 1 993–1 998 1 993–1 998 Difference
Barry Bonds 27 9 9 45 43 !2
Mark McGwire 39 13 8 60 65 +5
Sammy Sosa 16 5 17 38 39 +1
Rafael Palmeiro 16 5 10 31 35 +4
The interesting thing about the above table is that there is no clear indi-cation that any of the four players were experimenting with steroids during the 1993–1998 period. It supports the case that Barry Bonds’ achievements

7/25/2019 McNeil - All-Stars for All Time
http://slidepdf.com/reader/full/mcneil-all-stars-for-all-time 238/247
through 1998 were strictly the result of his natural conditioning programs.The story, however, seems to be different after 1998. According to the year-by-year computation of Bonds’ home run rates per 550 at-bats (HRR), he
averaged 43 home runs for every 550 at-bats from 1993 through 1998, andthen suddenly his rate skyrocketed to 55 homers for every 550 at-bats in1999–2000, and to 84 homers for every 550 at-bats in 2001.
Barry Bonds’ career statistics, presented here, tend to support the the-ory that a mystery supplement in addition to his normal conditioning pro-gram may have contributed to his success. One study has indicated that asmany as 116 of Bonds’ home runs and perhaps more can be attributed to thatunknown supplement. Jose Canseco, in his book Juiced said that when Barry
Bonds first saw him at the All-Star Game in 2000, he was amazed at Canseco’sspectacular physique, and asked Canseco what his secret was. Over the nextyear, with Jose’s secret in hand, Bonds added twenty pounds of muscle andproceeded to celebrate his new-found strength by crushing Mark McGwire’ssingle-season home run record.
Appendix: The Steroid Problem 227
Per 550 AB Years Years Age AB H HR HR RBI BA
1986–1992 7 22–28 3584 984 176 27 85 .275
1993–1998 6 29–34 3037 933 235 43 120 .3071999–2005 7 35–41 2519 825 297 65 139 .328
Another table, showing the home run averages of the four playersbetween 2001 and 2004, highlights the problems that people have with Barry Bonds’ achievements. The idea that a major league player could average 70home runs a year between the ages of 37 and 40 is nothing short of miracu-lous. McGwire’s numbers are inconclusive for the one year he played beforehe retired, and Palmeiro’s numbers are also inconclusive. Sosa’s numbers look
suspicious.
Predicted HRs Actual HRs Name 2001–2004 2001–2004 Difference
Barry Bonds 51 70 +19
Mark McGwire 60 53 (one year) !7
Sammy Sosa 38 49 +11
Rafael Palmeiro 31 37 +6
As I noted in a previous book, wine gets better with age. Baseball play-ers, with the possible exception of Barry Bonds, do not. Remember the Teamof the Century that was selected by a panel of writers and editors and the staff of Stats, Inc. in 1999? That survey, which chose the fifty greatest players of

7/25/2019 McNeil - All-Stars for All Time
http://slidepdf.com/reader/full/mcneil-all-stars-for-all-time 239/247

7/25/2019 McNeil - All-Stars for All Time
http://slidepdf.com/reader/full/mcneil-all-stars-for-all-time 240/247
Bibliography
Carter, Craig, ed. Daguerreotypes , 8th edition. St. Louis: Sporting News,1990.Costa, Gabriel, Michael Huber, and John Saccoman. “Cumulative Home Run Fre-
quency and the Recent Home Run Explosion.” Baseball Research Journal 34 (2005):37–41.
Couzens, Gerald Secor. A Baseball Album (“...History & Trivia Never Before Pub-lished”). New York: Lippincott & Crowell, 1980.
ESPN.com. MLB—All-Century Team Final Voting, 1–3. http://espn.go.com/mlb/news/1999/1023/129008.html.
Honig, Donald. A Donald Honig Reader . New York: Simon and Schuster, 1988.Ivor-Campbell, Frederick, ed. Baseball’s First Stars . Cleveland: Society for American
Baseball Research, 1996. James, Bill, and Rob Neyer. The Neyer/James Guide to Pitchers . New York: Simon and
Schuster, 2004.Kallay, Mike, ed. “Team of the Century,” Street & Smith’s Baseball (1999): 24–27.Kavanagh, Gerard. “50 Years,” Street & Smith’s Baseball (1990): 54–59.McConnell, Bob, and David Vincent, eds. SABR Presents The Home Run Encyclope-
dia . New York: Macmillan, 1996.McNeil, William F. Backstop. Jefferson, N.C.: McFarland, 2005.
_____. Baseball’s Other All-Stars . Jefferson, N.C.: McFarland, 2000. _____. Cool Papas and Double Duties . Jefferson, N.C.: McFarland, 2001.
_____. The Single Season Home Run Kings . Jefferson, N.C.: McFarland, 2002.Nemec, David. The Beer and Whiskey League . New York: Lyons & Burford, 1994.Palmer, Pete, and Gary Gillette, eds. The Baseball Encyclopedia . New York: Barnes &
Noble, 2004.Reidenbaugh, Lowell. Baseball’s Hall of Fame: Cooperstown: Where Legends Live For-
ever. New York: Arlington House, 1988.Rickey, Branch, with Robert Riger. The American Diamond . New York: Simon and
Schuster, 1965.Santa Maria, Michael, and James Costello. In the Shadows of the Diamond: Hard Times
in the National Pastime. Dubuque, Iowa: Elysian Fields Press, 1992.
Shatzkin, Mike, ed. The Ballplayers . New York: Arbor House, 1990.Thorn, John, ed. The National Pastime. New York: Bell Publishing, 1987.
229

7/25/2019 McNeil - All-Stars for All Time
http://slidepdf.com/reader/full/mcneil-all-stars-for-all-time 241/247
_____, Pete Palmer, Michael Gershman, and David Pietrusza, eds. Total Baseball .New York: Viking Penguin Books, 1997.
Tiemann, Robert L., and Mark Rucker. Nineteenth Century Stars . Kansas City: Soci-
ety for American Baseball Research, 1989.
230 BIBLIOGRAPHY

7/25/2019 McNeil - All-Stars for All Time
http://slidepdf.com/reader/full/mcneil-all-stars-for-all-time 242/247
Aaron, Henry “Hammerin’ Hank” 8,10,
11,185, 200, 207, 211–216, 221, 222, 224
Adcock, Joe 132 Alexander, Grover Cleveland 6, 7, 10, 32, 85,
101–106, 108–111, 216, 217, 219, 221
Allen, Ethan 6 Allen & Ginter 5 Allison, Doug 4 Alomar, Roberto 136, 137, 142, 143, 145, 146 Anderson, Greg 224, 226 Anderson, Sparky 165 Anson, Cap 6, 45–47
Aparicio, Luis 8, 147, 148, 152, 153, 156–160 Appling , Luke 151, 152, 155, 157–160 Arroyo, Luis 95 Averill, Earl 90 Avery, Steve 208
Bagby, Jim 203Bagwell, Jeff 121, 126–128, 130, 131, 138Baker, Dusty 188Baker, Frank “Home Run” 164, 169–171, 173,
174Bando, Sal 168–171, 173, 174
Banks, Ernie 8, 10, 11, 147, 150, 151, 155–157,159, 160, 217, 219, 221, 222
Barry, Jack 164Battey, Earl 71, 75, 77, 81, 82Beckley, Jake 45–47Bell, Kimberly 224Bench, Johnny 8, 10, 11, 63, 66, 75, 77, 79,
80–82, 217, 220, 222Bennett, Charlie 6Berra, Yogi 8, 10, 11, 13, 66, 67, 70, 75, 77,
79, 80–82, 220, 222Biggio, Craig 121, 138, 143, 145, 146, 220
Blomberg, Ron 28Blyleven, Bert 14Boggs, Wade 163, 169–171, 173, 174
Bonds, Barry 9,10, 35,
132,
185,
197, 220,223–228
Bonds, Bobby 179Boudreau, Lou 148, 152, 153, 156–160, 216,
217, 219–221
Brainard, Asa 4Brett, George 11, 163, 169–174Brock, Lou 8, 179Brodie, Steve 60, 61
Brouthers, Dan 45–47Brown, Mordecai “Three Finger” 96, 97,
100, 101, 104, 107, 109–111
Browning, Pete 57–59Buckner, Bill 132Burkett, Jesse “The Crab” 57–59Burns, Thomas “Oyster” 57, 59
Caminiti, Ken 226Campanella, Roy 7, 16, 18–28, 64, 73, 75,
77–82, 121, 156, 212, 216, 217, 220, 221
Canseco, Jose 154, 224, 226, 227Carew, Rod 136, 140–146Carlton, Steve 10, 11, 93, 94, 102–104, 106,
109–111
Carter, Craig 229Carter, Gary 66–68, 77–82, 217Caruthers, Bob 6, 41–44Casey, Hugh 101, 102Cash, Norm 71, 118, 119, 124–127, 129–131
Cepeda, Orlando 120, 123, 126–128, 130Cepeda, Perucho 120Cey, Ron 188Chance, Frank 96Chapman, John 4Charlston, Oscar 9Chesbro, Jack 95
Clark, Jack 121, 127, 130Clark, Will “The Thrill” 119, 127–130Clarkson, John 6, 41–44
Index
231

7/25/2019 McNeil - All-Stars for All Time
http://slidepdf.com/reader/full/mcneil-all-stars-for-all-time 243/247
Clemens, Roger 9–11, 84, 97, 99, 100, 105,106, 108, 112, 217, 218, 220, 221, 228
Clemente, Roberto 8, 10, 11, 186, 187, 192–195, 197
Clements, Jack 38–40Cobb, Ty 6–8, 10, 11, 84, 96, 162, 179, 180,
182, 185, 208, 209, 211–215, 222Cochrane, Mickey 6, 7, 15, 62, 66, 74–76,
79, 80–83, 113, 115, 219, 222Cody, Wild Bill 5Collins, Eddie 6–8, 17, 135, 140–146, 164,
217Combs, Earl 6Comiskey, Charles 6Connor, Roger 45, 47, 185
Cordeiro, Julie 1
07Costa, Gabriel 224Costello, James 229Couzens, Gerald Secor 7, 229Crandall, Otis “Doc” 100Creighton, Jimmy 3Cronin, Joe 6, 8, 99, 151, 155–157, 159, 160Cross, Lave 54–56
Dahlen, William “Bad Bill” 50–53Daly, Thomas “Tido” 48–50Danning, Harry 69, 70, 77, 78, 81, 82
Davis, George 51–53Dean, Dizzy 7, 90, 104, 106, 108–111, 216
Delahanty, Ed 56, 58, 59Dickey, Bill 6, 13, 63, 64, 66, 67, 75, 77,
80–82, 212Dihigo, Martin 9DiMaggio, Joe 7, 8, 10, 11, 13, 63, 199, 203,
204, 211–214, 216, 217, 219, 221
Doerr, Bobby 8, 139, 141–146, 217Downing, Al 207Duffy, Hugh 56, 58, 59Dugan, Joe 6
Dunlap, Fred “Sure Shot” 48–50
Eckersley, Dennis 10Elliott, Bob 164, 165, 170, 171, 173, 174Erskine, Carl 162Evans, Dwight “Dewey” 187, 188, 193, 195,
197Evers, Johnny 96Ewing, Buck 37–40
Feller, Bob 7, 8, 10, 88, 98, 104, 106, 109–111
Ferguson, Bob 4, 5Ferrell, Rick 99Ferrell, Wes 29, 30, 32, 99, 103–110, 112,
219Fingers, Rollie 8Fisk, Carlton 11, 15, 66, 71, 75, 77, 79, 81, 82
Ford, Whitey 8, 10, 41, 93–95, 102–106,109–111, 216
Foutz, Dave 41, 94Fox, Nellie 139, 140, 142–146Foxx, Jimmie 10, 11, 34, 99, 113, 115, 123,
127–131, 177, 185, 216, 217, 219, 221
Freehan, Bill 15, 66, 70, 71, 77, 81, 82Frisch, Frankie 7, 137, 138, 142–146Furillo, Carl 212
Gant, Ron 208Garciaparra, Nomar 154, 155, 160, 220Garvey, Steve 132, 188Gehrig, Lou 6–11, 33, 34, 63, 99, 113–115,
123, 127–132, 147, 177, 185, 212, 216, 217,
21
9, 221
Gehringer, Charlie 8, 135, 136, 141–146Gershman, Michael 230Giambi, Jason 226Gibson, Bob 8, 10, 11, 84, 90, 91, 104–106,
109–111, 119, 221
Gibson, Josh 9, 10Gibson, Kirk 71
Gillette, Gary 42, 229Glasscock, Jack 6, 51, 52Glavine, Tom 99, 100, 112Gordon, Joe “Flash” 139, 142–146
Gore, George 59–61
Goslin, Goose 177, 191–194, 197Gould, Charley 4, 5Greenberg, Hank 114, 115, 123, 127–131,
217, 221
Grich, Bobby 139, 142, 144–146, 216, 217,219, 221
Griffey, Ken, Jr. 9–11, 210, 211, 215, 220,224, 228
Griffin, Mike 59–61
Griffith, Clark 41–44Grove, Lefty 8, 10, 11, 32, 87, 103, 106,
109–111, 216, 217, 219, 221Guerrero, Vladimir 189, 190, 197, 198, 217,
220Gwynn, Tony 9, 10, 209–215
Hack, Stan 166–171, 173, 174Hall, George 4, 5Hamilton, Billy 57–59Harris, Bucky 153Hartnett, Gabby 15, 16, 27, 28, 63–65, 67,
75, 76, 78, 80–82, 90, 216, 217, 219, 220Hauser, Joe 115
Heilmann, Harry 182, 190–193, 195, 197,222
Helton, Todd 20, 122, 127, 128, 132, 220Henderson, Rickey 8, 178, 179, 190–195,
197, 220Henrich, Tommy 212
232 INDEX

7/25/2019 McNeil - All-Stars for All Time
http://slidepdf.com/reader/full/mcneil-all-stars-for-all-time 244/247
Hernandez, Keith 34, 117, 118, 127–131, 220Herzog, Whitey 69, 208Hines, Paul 59–61
Hodges, Gil 121, 122, 127–132, 156, 212Hoiles, Chris 15, 70, 77–79, 81, 82Honig, Donald 229Hooper, Harry 188Hornsby, Rogers “Rajah” 6–8, 10, 11, 134,
140–146, 180, 184, 219, 221
Horton, Willie 71
Howard, Elston 13Hubbell, Carl 7, 8, 99, 104, 106, 107, 109,
110, 112Huber, Michael 224Huggins, Miller 85
Ivor-Campbell, Frederick 229
Jackson, Reggie 222 Jackson, “Shoeless Joe” 7, 163, 179, 180,
190–194, 197, 216, 217, 219, 222 James, Bill 13, 14, 229 James, Bill (pitcher) 94 Jennings, Hughie “Ee-Yah” 50–52 Jeter, Derek 154, 155, 160, 220 Johnson, Bob 188, 191, 193, 195, 197 Johnson, Randy 98–100, 105, 106, 112, 220
Johnson, Walter 6, 7, 9–11
, 29–32, 84,101–106, 109–112, 216, 217, 219, 221
Jones, Chipper 169, 174, 220 Joss, Addie 7, 95, 103, 104, 106, 108–111,
220
Kaline, Al 186, 190, 193–195, 197, 203, 217,220
Kallay, Mike 8, 229Kavanagh, Gerard 229Keefe, Tim 6, 40, 42–44Keeler, “Wee Willie” 57–59
Keller, Charlie “King Kong” 212Kelly, Michael J. “King” 6, 37–40Kelly, Tom 208Keltner, Ken 204Kent, Jeff 140, 146, 220Killebrew, Harmon 8, 115, 116, 127, 129, 130Kluszewski, Ted 132Konerko, Paul 122, 127, 132, 220Koufax, Sandy 8–11, 14, 87, 88, 90, 91, 93,
98, 103–106, 108–111, 216, 221
Lajoie, Nap 11, 134, 135, 140, 141, 216, 217,
220–222Landis, Kenesaw Mountain 179Larkin, Barry 154, 156, 157, 159, 160Larkin, Gene 208Latham, Arlie 54–56Lazzeri, Tony 85, 113
Lemon, Bob 95Leonard, Andy 4Lloyd, John Henry 148Lolich, Mickey 119, 186Lombardi, Ernie 66, 78–80Long, Herman “Germany” 51–53Lopes, Davey 17Lyons, Denny 54, 55
Mack, Connie 62, 86, 94, 113, 164Mackey, Biz 64Madden, James R. Jr. 9, 98, 196, 210Maddux, Greg 9–11, 99, 100, 105, 106, 108,
112, 220Mantle, Mickey 8, 10, 11, 151, 201–203, 205,
211
–21
4, 21
6, 21
7, 21
9, 221
, 225Marberry, Firpo 101
Marichal, Juan 10, 93, 104–106, 109–111
Maris, Roger 132, 185, 226Marquard, Rube 164Martinez, Pedro 99, 100, 105–107, 112, 217,
220Mathews, Eddie 10, 161, 162, 169–171, 173,
174, 217, 219, 222Mathewson, Christie 6, 7, 10, 11, 29, 30,
32, 85–87, 94, 96, 104–106, 108–111, 164,216, 221
Mattingly, Don 8, 34,12
1,
127,
128,
130Mays, Willie 7, 8, 10, 11, 34, 151, 185, 199–
201, 205, 211–214, 216, 217, 221, 222,224
Mazeroski, Bill 140, 142–146, 187, 220McConnell, Bob 229McCovey, Willie 8, 11, 117, 118, 127, 129, 130,
222McDonald, Dan 4McGraw, John 53–55, 100McGriff, Fred 122, 127, 128, 130, 131
McGuire, James “Deacon” 37–40
McGwire, Mark 9–11, 35, 132, 154, 185, 220,221, 223–228McInnis, Stuffy 164McNeil, William F. 229McPhee, John “Bid” 47–50McVey, Cal 4, 5Medwick, Joe 181, 182, 191, 193, 195, 197Merkle, Fred 96Mize, Johnny 116, 117, 126–131, 217, 221
Molitor, Paul 166, 170, 171, 173, 174Moore, Wilcy 101
Morgan, Joe 8, 10, 11, 17, 134, 142, 143, 145,
146, 219Morris, Jack 208Mueller, Ray 15, 70, 75–78, 82Mulvey, Joe 6Murphy, Johnny 101
Murray, Eddie 117, 118, 127, 129–131, 224
Index 233

7/25/2019 McNeil - All-Stars for All Time
http://slidepdf.com/reader/full/mcneil-all-stars-for-all-time 245/247
Musial, Stan 7, 8, 10, 11, 177, 182–185, 190–193, 195, 197, 217, 219, 222
Nash, Billy 53, 55, 56Nemec, David 229Nettles, Graig 168, 170–174Newcombe, Don 29Neyer, Rob 229Nichols, Charles “Kid” 7, 40–44Niedenfuer, Tom 148
Oakley, Annie 5O’Rourke, James “Orator Jim” 57–59Orr, Dave 45–47Ott, Mel 185, 186, 190–193, 195, 197, 219,
221
Page, Joe 101, 102Paige, Satchel 9–11, 90Palmeiro, Rafael 35, 132, 220, 223–227Palmer, Jim 10, 91–93, 103, 104, 106, 108,
109–111
Palmer, Pete 13, 14, 32, 33, 42, 111, 129, 222,229, 230
Parrish, Lance 69, 75, 77–80, 82Pearce, Dickey 4, 5Pena, Tony 69, 75–77, 80, 82
Perez, Tony 1
32Perranoski, Ron 101
Pfeffer, Fred 48–50Phelps, Babe 66Piazza, Mike 9, 10, 15, 72, 74, 76, 82, 83,
220, 228Pietrusza, David 230Pike, Lipman 4, 5Plank, Eddie 94, 104, 106, 108, 109–111
Porter, Darrell 64–66, 74–78, 80, 82Powell, Boog 120, 127, 130Power, Vic 34, 119, 120, 123, 127–130, 220
Puckett, Kirby 34, 207, 208, 211–215, 220Pujols, Albert 122, 123, 127, 128, 132, 217,220
Radburne, Charles “Old Hoss” 41–44Ramirez, Manny 189, 198, 220, 224, 225Reese, Pee Wee 67, 121, 148, 149, 157, 159Reidenbaugh, Lowell 229Reitz, Ken 64Rhodes, Dusty 199Richardson, Bobby 117Richardson, Hardy 48–50
Rickey, Branch 7, 229Riger, Robert 229Ripken, Cal, Jr. 9–11, 113, 147, 153, 156–159,
221
Rivera, Geraldo 224Rizzuto, Phil “Scooter” 149, 156, 157, 159, 160
R oberts, Robin 95Robinson, Brooks 8, 10, 11, 163–166,
168–174, 216, 217, 219–221
Robinson, Frank 8, 175, 191–194, 197, 217,222
Robinson, Jackie 7, 8, 10, 11, 17, 67, 121, 133,141–146, 212, 221
Rodriguez, Alex “A-Rod” 154, 155, 160, 217,220, 225
Rodriguez, Ivan “Pudge” 15, 72–74, 76, 78,83, 220
Rolen, Scott 169, 174, 220Rose, Pete 8, 10, 11, 34, 181, 193–195, 197,
220Rosen, Al 162, 163, 169–171, 173, 174
Rucker, Mark 230Rusie, Amos 41–44Ruth, Babe 6–11, 63, 99, 105, 113, 115, 132,
177, 182, 184, 185, 189, 190, 192, 193, 195,197, 207, 216, 217, 219, 221, 224–226
Ryan, Nolan 10, 11, 84, 97–99, 102–105,107–110, 112, 119, 221
Saccoman, John 224Sandberg, Ryne 136, 142–146Sanford, Jay 153, 162, 164, 167Santa Maria, Michael 229
Santo, Ron 1
66,167,
170–
174, 2
17Sax, Steve 17
Schmidt, Mike 8–11, 161–163, 166, 169, 170–174, 216, 217, 219–222, 224
Seaver, Tom 10, 91, 92, 104, 106, 108–111, 216,221
Seitz, Peter 101
Sewell, Joe 154–160Shatzkin, Mike 229Sheffield, Gary 189, 197, 220, 225Shindle, Billy 54–56Simmons, Al 6, 34, 99, 177, 178, 182, 191–194,
197, 216, 217, 220Simmons, Ted 64Sisler, George 6–8, 117, 123, 124, 126–130Smith, Charles 4Smith, George “Germany” 51–53Smith, Ozzie 8, 10, 11, 147–149, 153, 154,
156–159, 216, 217, 220Smith, Reggie 188, 191–195, 197Smoltz, John 208Snider, Duke 121, 156, 205, 206, 211, 213,
214, 216, 222Sosa, Sammy 35, 197, 220, 223–227
Spahn, Warren 7, 10, 11, 88–90, 93, 95, 102,104, 106, 109–111
Speaker, Tris 6–8, 10, 34, 182, 200, 206,211–214, 216, 217, 220–222
Stargell, Willie “Pops” 180, 181, 191–194,197
234 INDEX

7/25/2019 McNeil - All-Stars for All Time
http://slidepdf.com/reader/full/mcneil-all-stars-for-all-time 246/247
Start, Joe 4, 5Stengel, Casey 66, 67, 94, 116, 207Stivetts, Jack 41, 43, 44, 104Stovey, Harry 56, 59Sullivan, John L. 5Sundberg, Jim 15, 66–68, 70, 75–78,
80–82Sutter, Bruce 8Sutton, Don 99Suzuki, Ichiro 117, 189, 196, 198, 220Sweasy, Charlie 4
Tejeda, Miguel 154, 155, 160, 220Tenace, Gene 62, 64, 74–76, 80–83, 169,
219
Terry, Bill 99,11
9,1
26–1
30Terry, Ralph 117, 187Thomas, Frank “The Big Hurt” 122, 127,
128, 132, 220, 225Thome, Jim 122, 127, 127, 132, 220, 224Thompson, Samuel “Big Sam” 56, 58, 59Thorn, John 229Tiant, Luis 29Tiemann, Robert L. 230Tiernan, Mike 57, 59Tinker, Joe 96Torre, Joe 64, 66, 75, 77, 80–82
Trammell, Alan 1
38,153,
154,
156–
160Traynor, Pie 6–8, 165, 166, 169–171, 173,
174
Van Haltren George 60, 61
Vaughan, Arky 149, 151, 155–157, 159, 160Vincent, David 229Vizquel, Omar 154, 155, 160, 220
Waddell , Rube 7 Wagner, Honus 6–8, 10, 11, 147, 148,
155–159, 186, 210, 216, 217, 219, 221, 222 Walsh, Ed 7, 95, 96, 101, 103, 104, 106, 108–
111, 216, 220 Waner, Lloyd 188 Waner, Paul 6, 188–190, 192, 193, 195, 197 Ward, John Montgomery 6, 50, 52, 53 Waterman, Fred 4 Weaver, Earl 92 Webb, Earl 182 Welch, Michael Francis “Smiling Mickey”
40, 42–44 Wertz, Vic 199 Westrum, Wes 15
Whitaker, Lou 1
38,1
43,1
45,1
46,1
53 Wilhelm Hoyt 10, 93, 99 Williams, “Smokey Joe” 9 Williams, Ted 7, 8, 10, 11, 175, 176, 189–192,
194, 195, 197, 198, 216, 217, 219, 221
Williamson, Ned 185 Wood, Smoky Joe 104, 105 Wright, George 3, 4 Wright, Harry 3, 4 Wynn, Jimmy 206, 211–215
Yastrzemski, Carl 8, 176, 177, 192, 194, 197,198 Yost, Eddie 168–171, 173, 174
Young, Cy 6, 7, 10, 11, 84, 91, 93, 97, 100,104, 107, 109, 110, 112, 216, 217, 221
Yount, Robin 149, 150, 157–160
Zettlein, George 4, 5Zimmer, Charles “Chief” 37–40
Index 235

7/25/2019 McNeil - All-Stars for All Time
http://slidepdf.com/reader/full/mcneil-all-stars-for-all-time 247/247