mcdonald’s summer campaign - digital training academy
TRANSCRIPT
Cross Media Case Study
McDonald’s Summer Campaign

Contents
Background To the Research
- Contributors
- Objectives
- Methodology
- Creatives Used
Campaign Performance
- Impact on key Metrics
Campaign Optimisation
- Indentifying the individual media contributions
Conclusions
-
Background To The Research
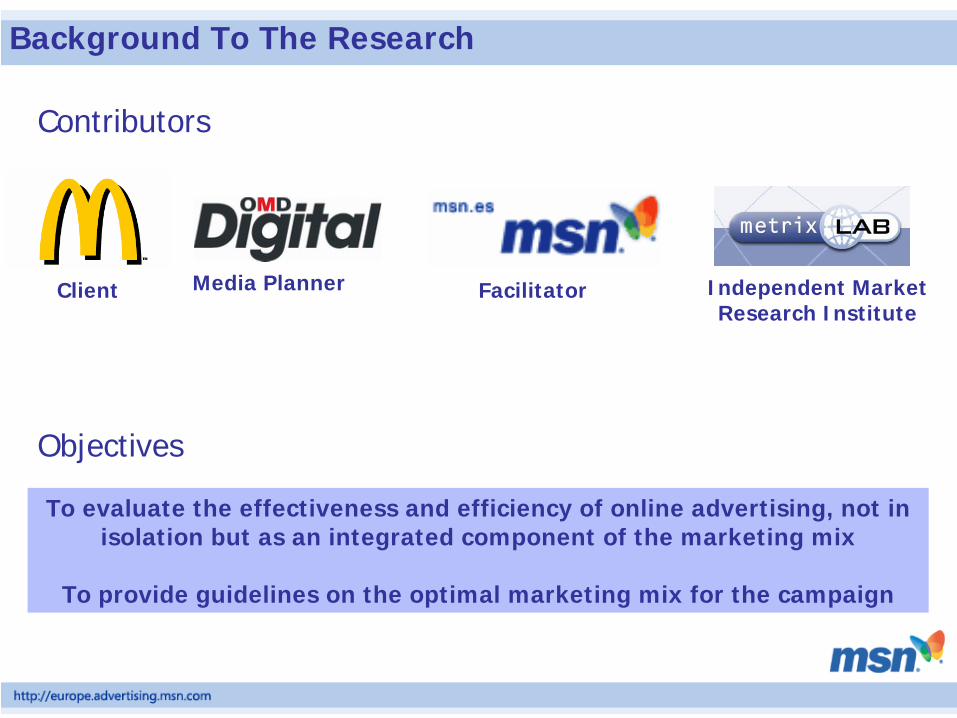
Contributors
Client FacilitatorMedia Planner Independent Market Research Institute
Objectives
To evaluate the effectiveness and efficiency of online advertising, not in isolation but as an integrated component of the marketing mix
To provide guidelines on the optimal marketing mix for the campaign

Background To The Research
MethodologyFieldwork
- 14 June05 – 17 Aug05
- All research conducted online
Sample Size
- 3,323 respondents within target group
(fashion conscious 18-34 yr olds who are budget minded when it comes to food)
Data Captured
- TV, radio, internet & outdoor exposure captured via online surveys
- The sample was drawn from both the MetrixLab Consumer Panel as well as
the MSN Website.
- 95% confidence level achieved

Background To The Research
Data Captured- Data comparisons were made between 4 distinct consumer groups:
Methodology
Media Plan
The Unexposed
(Control Group)
Online Only Offline Only On & Offline
Data Capture Media used
14 June - 19 June 0-Measurement (Not exposed)
20 June - 5 August TV
20 June - 16 July Radio
20 June - 11 August Internet
20 June - 5 August Outdoor

Campaign Creative : TV & Radio
The McDonald’s TV and radio spots were shown both nationally and regionally
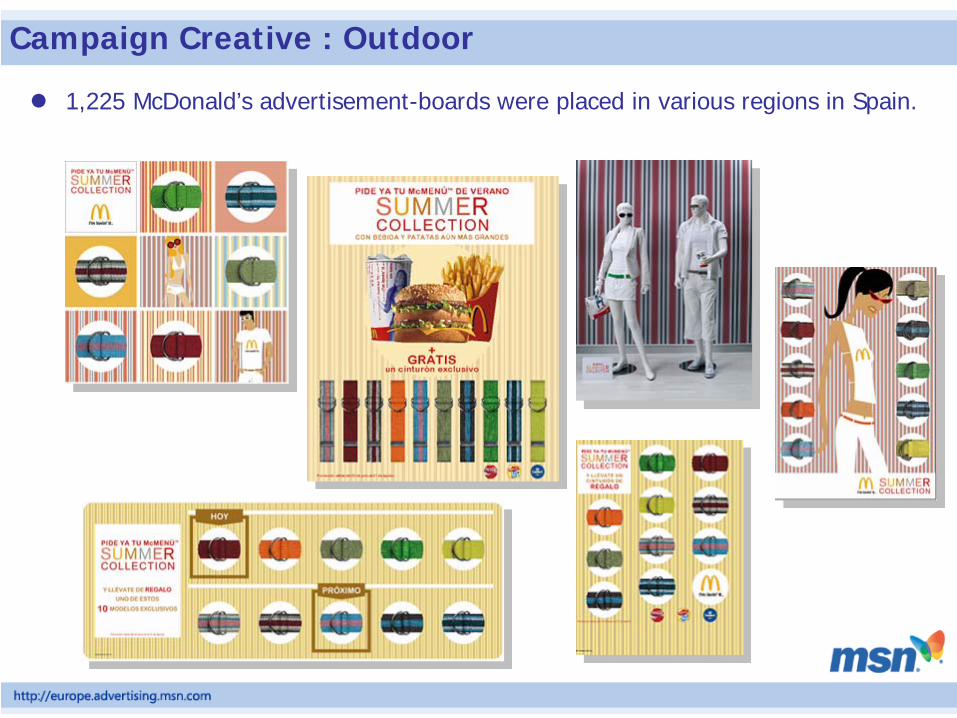
1,225 McDonald’s advertisement-boards were placed in various regions in Spain.
Campaign Creative : Outdoor

The McDonald’s Summer Campaign were shown on MSN Spain’s Homepage, Messenger, Hotmail and Entertainment Channel.
Campaign Creative : Online
Campaign Performance
Impact on Key Metrics
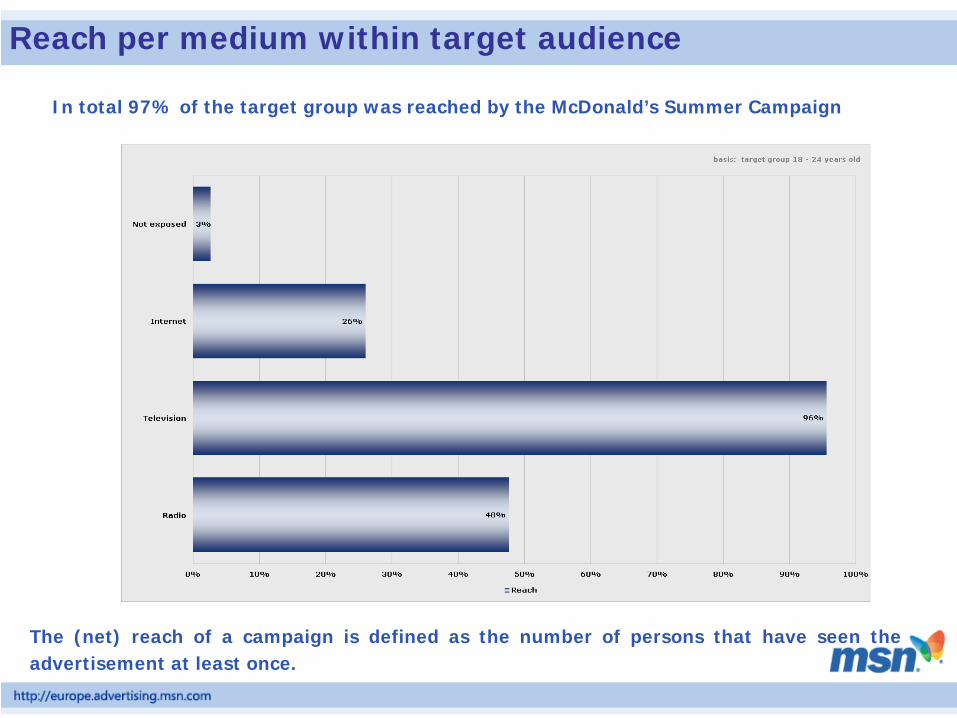
Reach per medium within target audience
The (net) reach of a campaign is defined as the number of persons that have seen the advertisement at least once.
In total 97% of the target group was reached by the McDonald’s Summer Campaign

Average frequency target audience per medium (OTS)

Overall Campaign Effects: Brand Awareness
The campaign resulted in a significant increase in top of mind and spontaneous awareness (both +8%).

5.2 Overall Campaign Effects: Brand Metrics
Remarkable is the increase in message association as a result of the campaign. The campaign had also a significant effect on the buying intention of +8% points.

5.3 Overall Campaign Effects: Brand Values
The McDonald´s Summer Campaign had a positive effect on the aimed main brand values. The brand value ´Fashionable brand´ increased 15% compared to the baseline.

5.4 Overall Campaign Effects: Image
McDonald´s´ fashionable image improved as a result of the campaign. However, the image ´For people like me´ maintained stable.
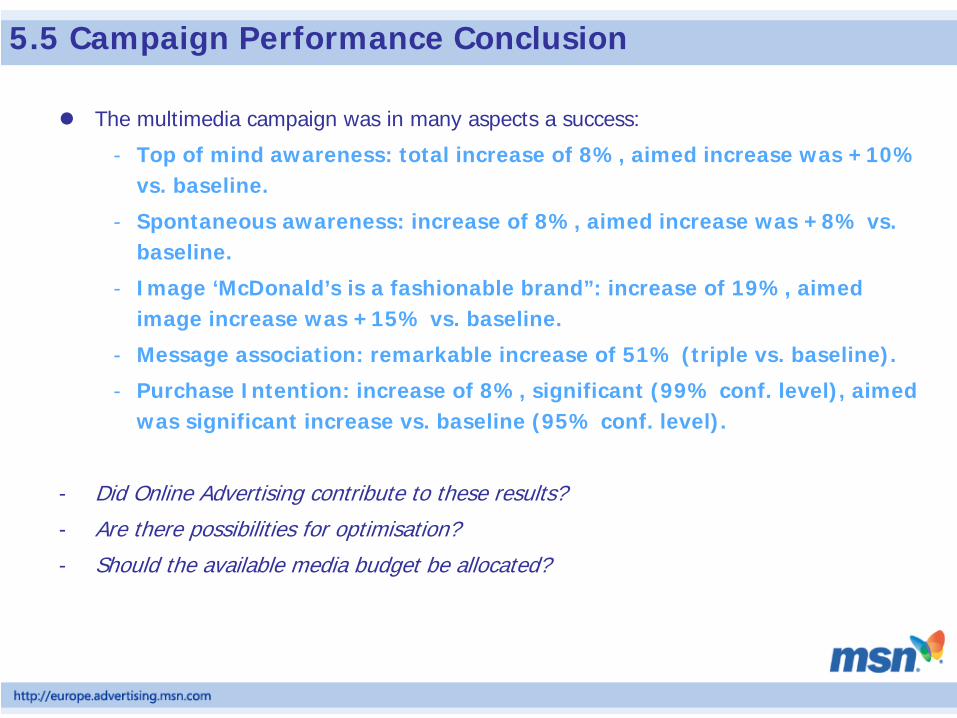
5.5 Campaign Performance Conclusion
The multimedia campaign was in many aspects a success:
- Top of mind awareness: total increase of 8%, aimed increase was +10% vs. baseline.
- Spontaneous awareness: increase of 8%, aimed increase was +8% vs. baseline.
- Image ‘McDonald’s is a fashionable brand”: increase of 19%, aimed image increase was +15% vs. baseline.
- Message association: remarkable increase of 51% (triple vs. baseline).
- Purchase Intention: increase of 8%, significant (99% conf. level), aimed was significant increase vs. baseline (95% conf. level).
- Did Online Advertising contribute to these results?
- Are there possibilities for optimisation?
- Should the available media budget be allocated?

6. Brand Effects per Segment

Background To The Research
Methodology
Media Plan
Data Captured- Data comparisons were made between 4 distinct consumer groups:
The Unexposed
(Control Group)
Online Only Offline Only On & Offline
INTERNET26% Cob.6.9 OTS
TELEVISION95,5% Cob.
22.1 OTS+1400 GRP’S
RADIO48% Cob.8.1 OTS
389 GRPS’S
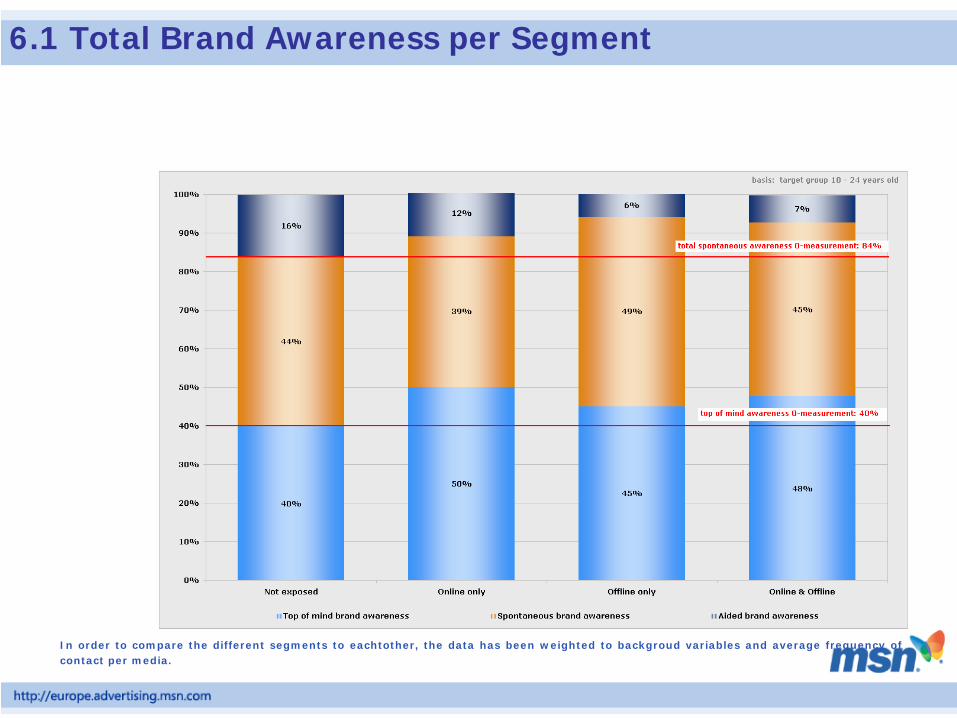
6.1 Total Brand Awareness per Segment
In order to compare the different segments to eachtother, the data has been weighted to backgroud variables and average frequency of contact per media.

6.2 Message Association per Segment
The graph above indicates the incremental contribution of the media to the message association. The online & offline increase of 7% points represents the synergetic effects of exposure to internet in addition to offline media.
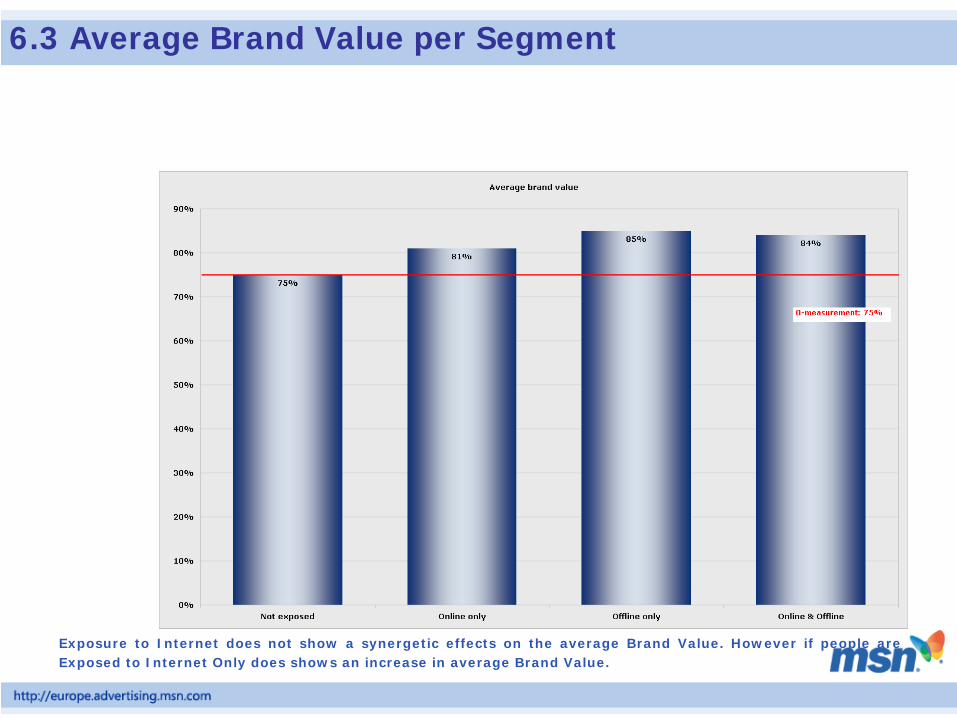
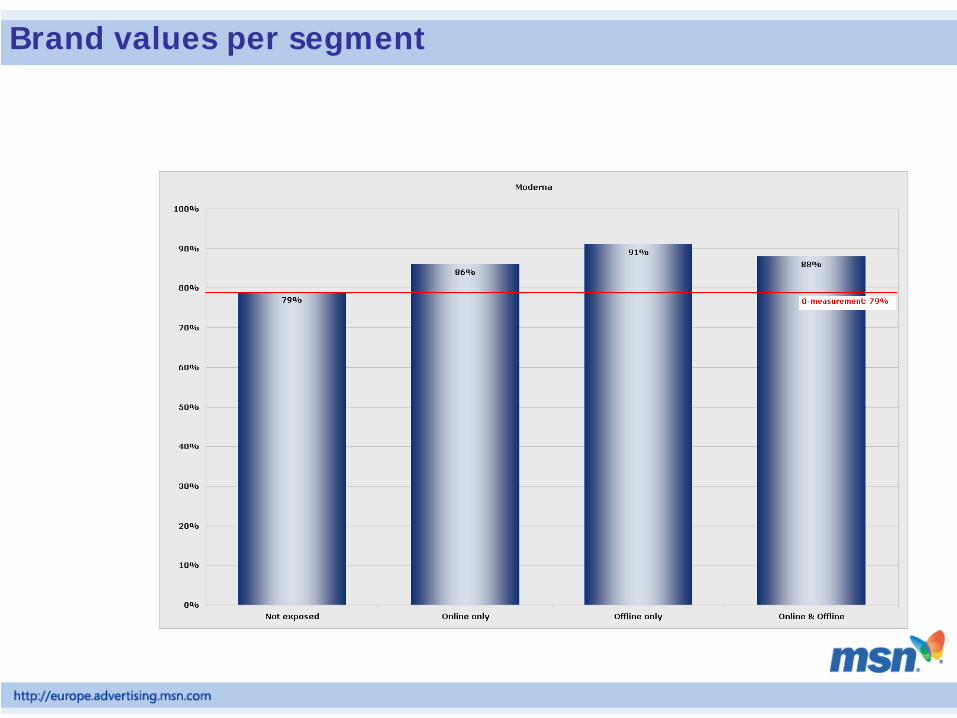
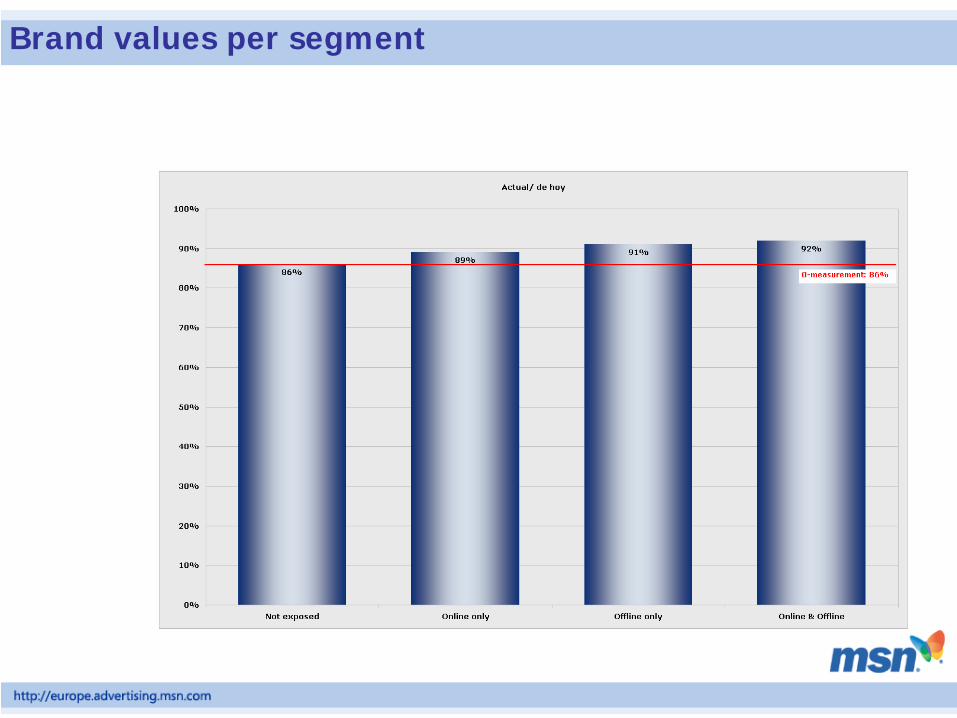
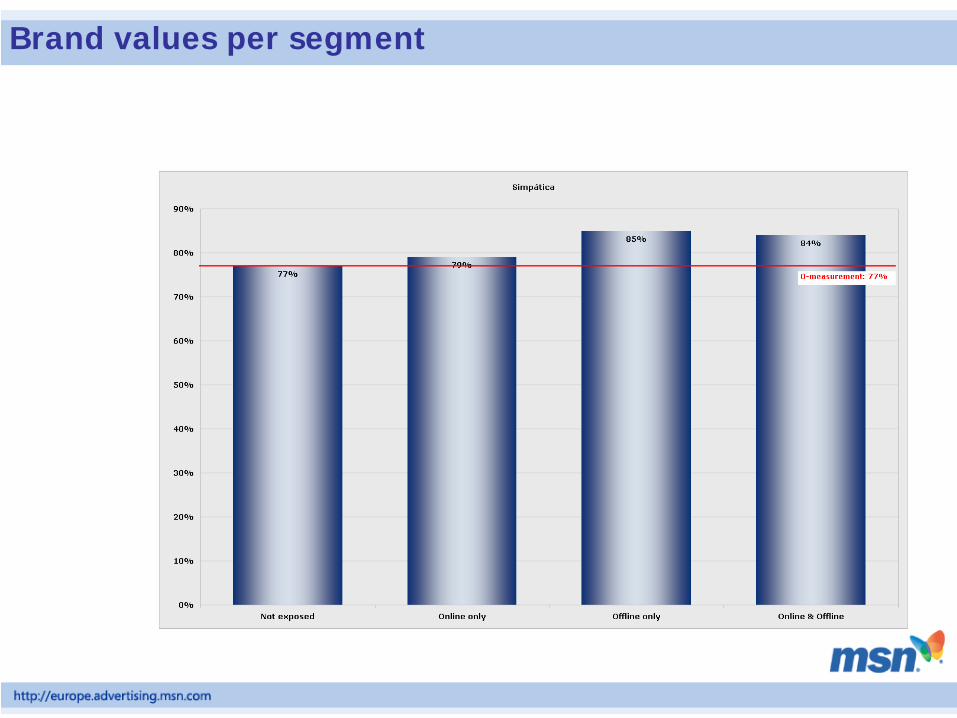
6.3 Average Brand Value per Segment
Exposure to Internet does not show a synergetic effects on the average Brand Value. However if people are Exposed to Internet Only does shows an increase in average Brand Value.

6.4 Average Image per Segment
The Online campaign did not succeed in generating a shift in the image of McDonald’s not on its own nor with synergetic impact.
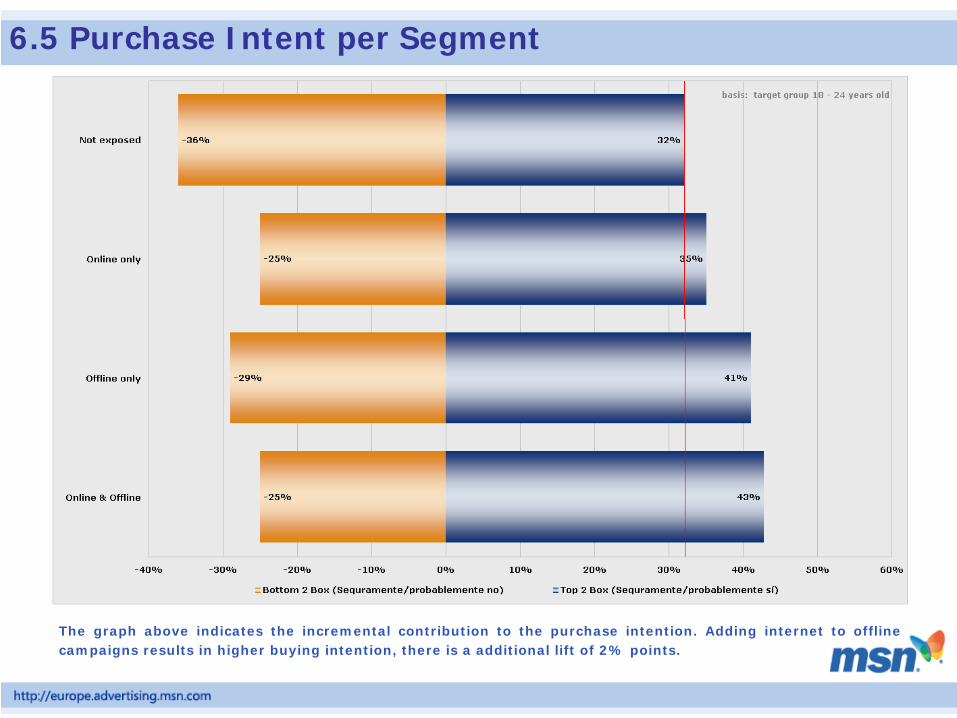
6.5 Purchase Intent per Segment
The graph above indicates the incremental contribution to the purchase intention. Adding internet to offline campaigns results in higher buying intention, there is a additional lift of 2% points.

6.6 Branding Impact: Summary Absolute Increase
OfflineOnly
Online & Online
Additional Lift
Additional Lift
Top of mind brand awareness + 5% + 8% + 3% points + 60%
Message Association + 53% + 60% + 7% points + 13%
Buying Intention + 9% + 11% + 2% points + 22%
We can find significant effects on the following brand metrics (TOM, MA and BI).
For these brand metrics that are in line with the campaign objectives the best solution is the combination of online and offline media.
However we haven’t taken the cost of adding this medium (online) in consideration yet.
Absolute increase is given in % points

PART 2: Optimalisation
Purchase Intent
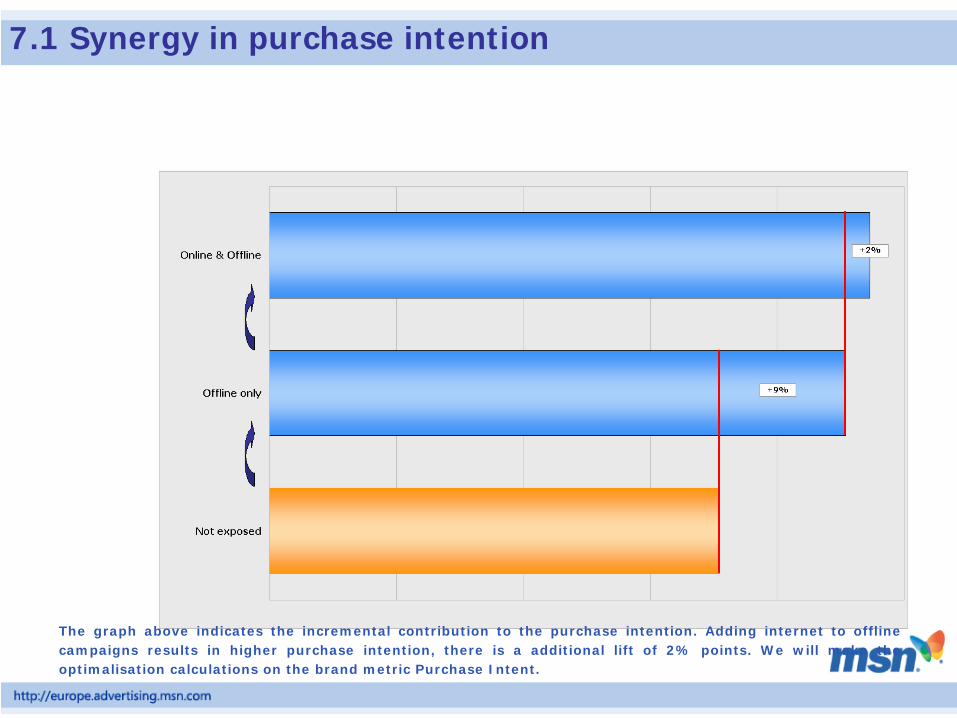
7.1 Synergy in purchase intention
The graph above indicates the incremental contribution to the purchase intention. Adding internet to offline campaigns results in higher purchase intention, there is a additional lift of 2% points. We will make the optimalisation calculations on the brand metric Purchase Intent.

7.2 Purchase Intent vs. TV OTS
The purchase intention increases till a OTS of 21,2. Higher OTS after this point does not result in higher purchase intention (over exposure). The average TV OTS during the campaign was 22.1.

There is a clear relation between the frequency with which the target audience is exposed and the brand metric Purchase Intention.
In general, and in this case, additional (offline) media weight
produces diminishing returns on campaign objectives.
The analysis showed that a lower average TV OTS can be used to realise the same effect/lift in purchase intent among the target audience.
7.3 Branding Impact: Diminishing Returns

8. Cost Efficiency

8.1 Optimising the Media Mix
The combination of offline and online results in synergetic effects on the aimed branding metrics.
Online media plus the combination of the offline media will deliver more affected persons from the target audience than just the offline media on their own.
However, how cost efficient is it to add online to the media mix?

8.2 Impact Spending on Reach TV
A withdrawal of the last 10% of the budget for television will hardly have any consequences on the reach of television alone.

8.3 The Impact of less TV Spending
If money would be withdrawn from the budget for television, the frequency with which consumers are exposed will decrease and as a consequence also the branding impact. The impact of less budget will be the highest on segments that are most likely to be exposed to television advertising.

8.4 Affected persons vs. Spending
A withdrawal of the last 10% of the budget for television will result in a decrease of less than 10% of the number of consumers who are positively affected by the offline advertising.

8.5 Relative Costs Person Affected
Adding online to the mix reduces the net cost per affected consumer. The synergy between the online and offline campaign is more cost efficient at changing purchase intent than only using Offline Advertising.

9. Optimising the Media Mix
9.1 Optimisation: Budget Consequences
There is a clear relationship between the frequency with which consumers are exposed and the branding metrics.
However, :- The overexposure to the television commercial did
not generate incremental effects (10% of budget).
- Spending more to Online Advertising would lead to additional reach and synergetic effects, but extra impressions for the online campaign also cost more money.

9.2 Optimisation: Conditions
Optimisation of the media mix is possible if one or more of the following conditions are met:
The combination of the media generates additional reach.
Additional media weight produces diminishing returns on campaign objectives.
Overexposure or underexposure to one of the media used.
The combination of media have synergistic effects on branding metrics.
The net cost per person affected by advertising varies per medium.

9.3 Optimising: ROI Analysis
- Return on investment analysis- Given the current shares in the media mix, online
advertising is more cost-effective at achieving purchase intent due to synergetic effects.
- However a greater spending on Internet adverting will also result in higher costs per affected person (due to diminishing returns on campaign objectives).
- The optimal media mix is reached when the costs per positively affected person for Internet equals the costs per positively affected person for television.

9.4 Recommended Budget Allocation
Reallocation of the budget generates better results.
Based on net cost optimisation calculations, the recommended share for Internet in the media mix is 9%.
Current Situation Optimized Situation

9.5 Optimising: Result on Purchase Intent
McDonald’s should spend 9% of their net budget to online advertising for a optimal result between Online and Offline Advertising.
The McDonald’s campaign realised before optimisation an increase the number of affected persons in the target audience of +8% points. in buying intention. The optimised media mix would have realised a increase of +10% points.

10. Conclusions

10.1 General Conclusions
- Exposure to Internet in addition to offline media results in synergetic effects on the aimed branding metrics
•Top of mind awareness: total increase of 8%.
•Spontaneous awareness: increase of 8%.
•Image ‘McDonald’s is a fashionable brand”: increase of
APPENDIX
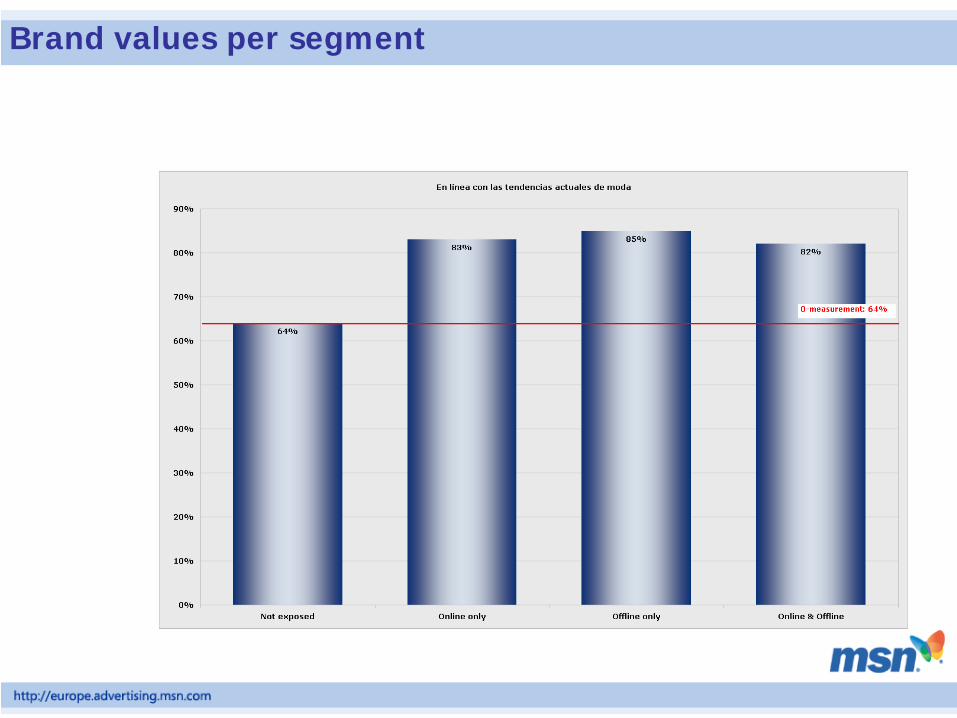
Brand values per segment
Brand values per segment
Brand values per segment

Brand values per segment

Brand values per segment
Brand values per segment

Image per segment
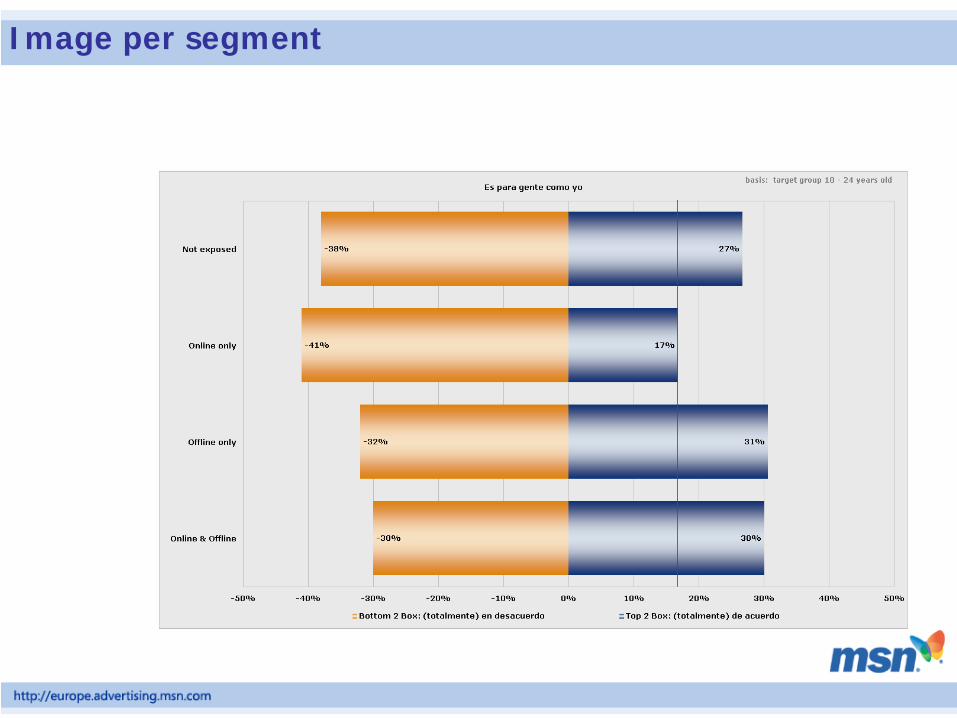
Image per segment
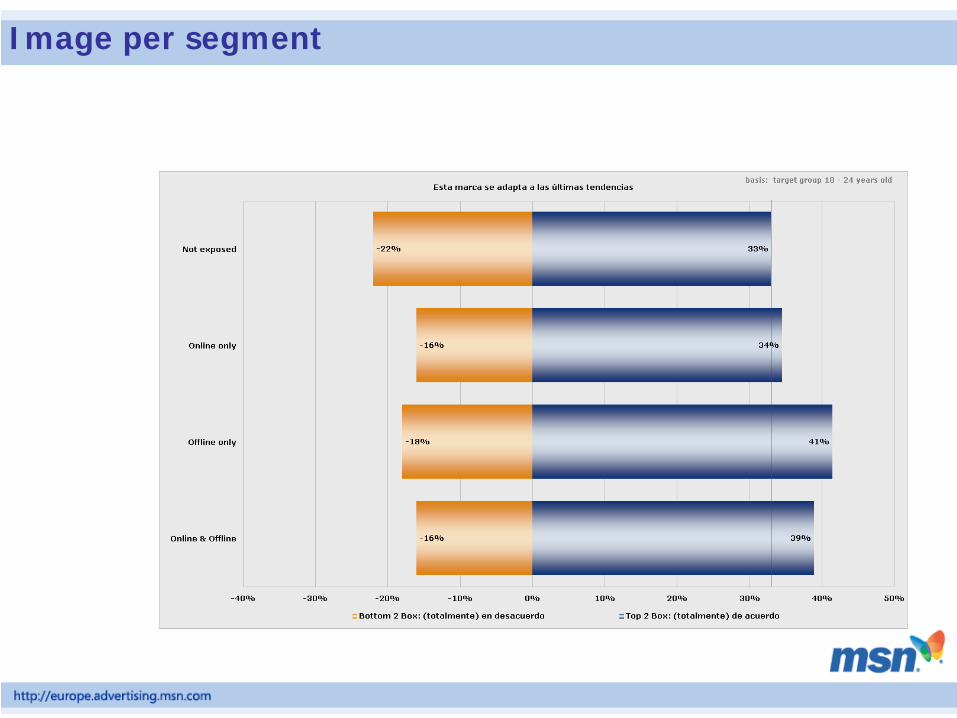
Image per segment

Image per segment

Image per segment
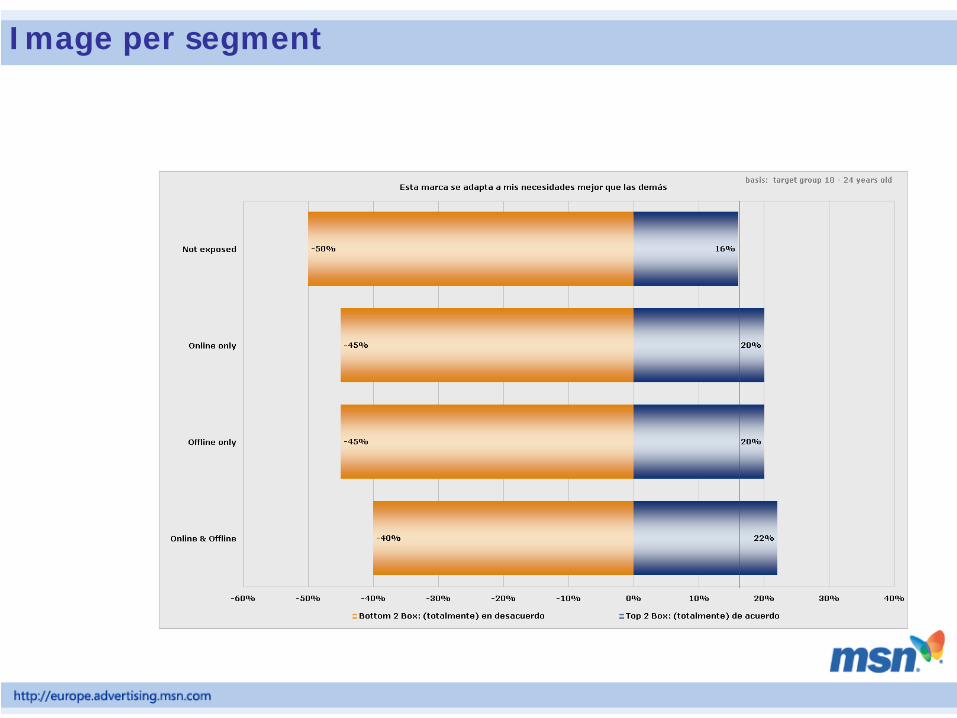
Image per segment

Purchase intention vs. Internet frequency

Purchase intention vs Internet frequency