may 2015 climate summary · regionally may 2015 precipitation was near 130% of ... flipped right...
TRANSCRIPT
May 2015 Climate Summary
Month Summary
May was a very warm month. Rainfall averaged near normal but was distributed unevenly over
time with the heaviest amounts near the end of the month. Dry soils persisted in northern Indiana
all month long and developed along the Ohio River late in May. There were 5 significant severe
weather days in May with wind damage the most common: overturning trucks on interstates and
ripping into trees, cars, power lines, homes, and barns. May 30th was an eventful day when a sharp
cold front sent temperatures tumbling in a few hours. An EF-1 tornado in Marion county that day
destroyed garages and damaged homes, cars, and trees. There were no injuries. A thunderstorm set
off a lightning strike that burned a garage to the ground in Newton county. Very heavy rainfall with
localized flash flooding occurred in northwest and central Indiana.
The state average temperature for May was 65.3°F. This is 3.3°F above normal and places this
month as the 17th warmest May on record. Some recent warmer Mays include 2004 with its 65.9°F
coming in at 14th place. Three years later a 66.3°F average pegged May 2007 at 13th warmest. May
2012 was very warm with its 67.7°F good for 5th place. The warmest May on record was in 1896
with a 68.5°F state average temperature. The day split in May 2015 was 10 days of below normal
temperature, 21 days above normal, and no days at normal. There were 7 days with the daily state
temperature 10°F or more above normal and 2 days at 10°F or more below normal. The highest
temperature of the month in the cooperative observer network was 91°F on May 8th in Brookville.
The coldest minimum was 31°F on May 1st at the Purdue University Airport in West Lafayette.
The May state precipitation average of 4.08” was 0.33” below normal. This pins May 2015 in the
middle of the historical pack of 120 years of record as the 61st wettest May on record. The wettest
May was in 1943 with a state average 8.62” of precipitation. The highest single day precipitation
among cooperative stations in May 2015 was 5.24” recorded on May 31st at Kokomo 3wsw. The
highest daily total in the CoCoRaHS network was 5.01” measured nearby by the volunteer at
Kokomo 4.3sw that same day.
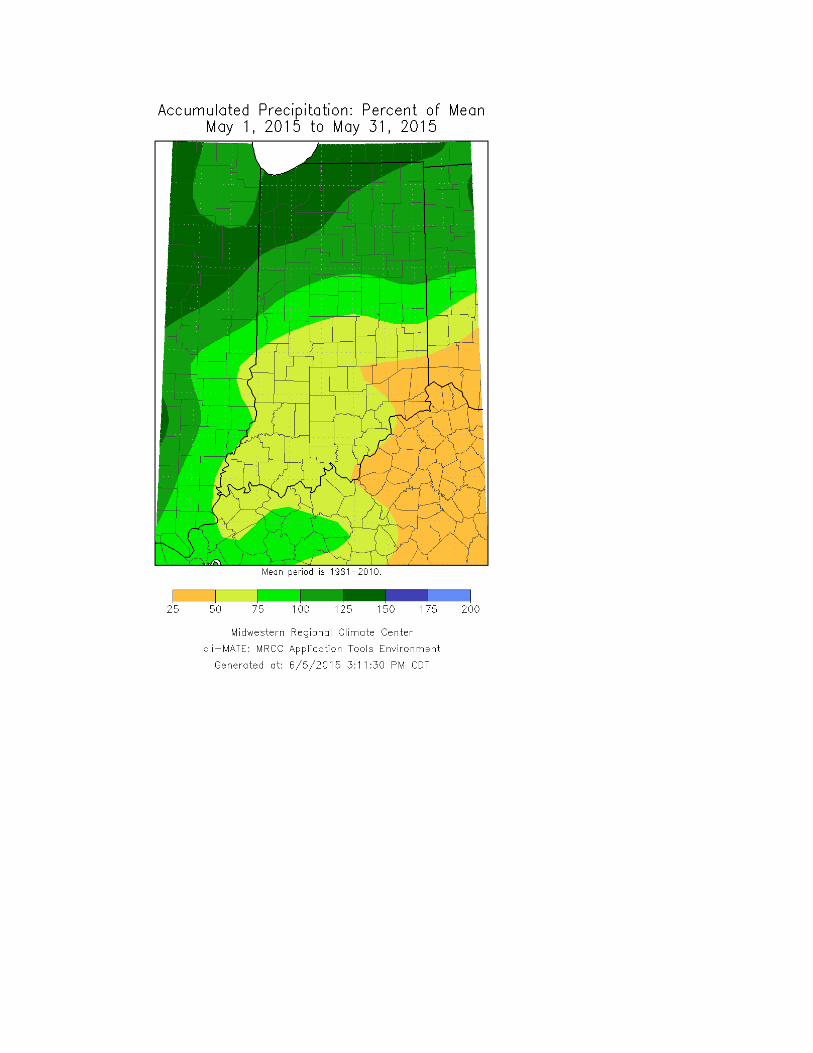
Regionally May 2015 precipitation was near 130% of normal in northern Indiana, 90% of normal in
central, and 70% of normal in the south. Normal May precipitation ranges from 3.8” in northeast
Indiana to 5.0” in south central and southwest Indiana. Widespread precipitation fell on about 19
days this month. Indiana farmers were able to catch up delayed spring planting to reach normal
field progress.
Ken Scheeringa And
Mary Rose Mangan (765) 494-8105
Jun 8, 2015
http://www.iclimate.org

May 1st – 9th
The recent cold temperature trend flipped right along with the calendar to start the new month.
Eight of the first 9 days of May featured above normal temperatures. The long term trend of less
rainfall north to many wet days in southern Indiana switched places in a flip of its own. Unsettled
weather generated locally large hail in central Indiana on May 4th and wind damage in northern
counties on May 9th.
High pressure settled overhead Indiana on May 1st. The initial state average temperature of 1°F
below normal marked the coldest of the 9 days and the start of a significant warm up. The fair
weather system sprawled nationwide the next day, lifting Indiana temperatures a few degrees to 3°F
above normal. The core of the ridge wandered from Kentucky into Georgia on May 3rd, setting up a
return flow of warm southerly winds which nudged the Indiana temperature upward to 9°F above
normal. The ridge moved off the Carolina shore the next day. The back flow continued and the
daily Indiana temperature increased to 11°F above normal. A cold front closed in on the state from
the northwest. Thunderstorms developed well ahead of the front, pelting local spots in central
Indiana with large hail.
The offshore ridge retreated inland to Georgia on May 5th. This movement slowed the cold front
sliding its way through northern Indiana that day and halted its progress over central Indiana.
Weather systems held steady on May 6th as did the daily state temperature at 11°F above normal.
By the next day the air masses on each side of the stationary front had mixed completely. The
stationary front washed away. Warm moist air from southeast states freely surged north across
Indiana and into Canada, claiming the eastern half of the country. The daily Indiana state average
temperature reached 12°F above normal.
On May 8th another slowing cold front approached Indiana from the west. The next day this front
stalled in northwest Indiana. Canadian high pressure behind the front had pushed eastward across
Canada rather than to the south. The stalled front triggered another round of severe weather, this
time creating local wind gust damage in a few northern Indiana counties. At the end of the 9 day
interval Indiana remained in the unstable warm air mass. The state temperature which had peaked
at 13°F above normal on May 8th closed out the interval at 11°F above normal.
Two attempts to push a cold front through Indiana during the 9 days had failed. The resulting
stationary fronts had generated thunderstorms with local severe weather. The lone benefit was the
production of needed rainfall in an area which had been drier than normal since mid-February.
The state temperature over the 9 days averaged near 9°F above normal. Typically at the start of
May daily maximum temperatures should range between 67°F and 74°F north to south across the
state. Daily minimums normally vary between 45°F in far northern Indiana to 51°F in far southwest
counties. The warmest local temperature over the 9 days in the cooperative station network was
91°F at Brookville on May 8th. The coolest temperature in the same network was 31°F at the
Purdue University Airport on May 1st.
Very light rain fell generally south of a Terre Haute to Muncie line according to CoCoRaHS
network reports of May 1st. The next rain event was recorded on May 4th mostly northwest of a
Fowler to South Bend line. Rain spread south into central Indiana the next day but the heaviest
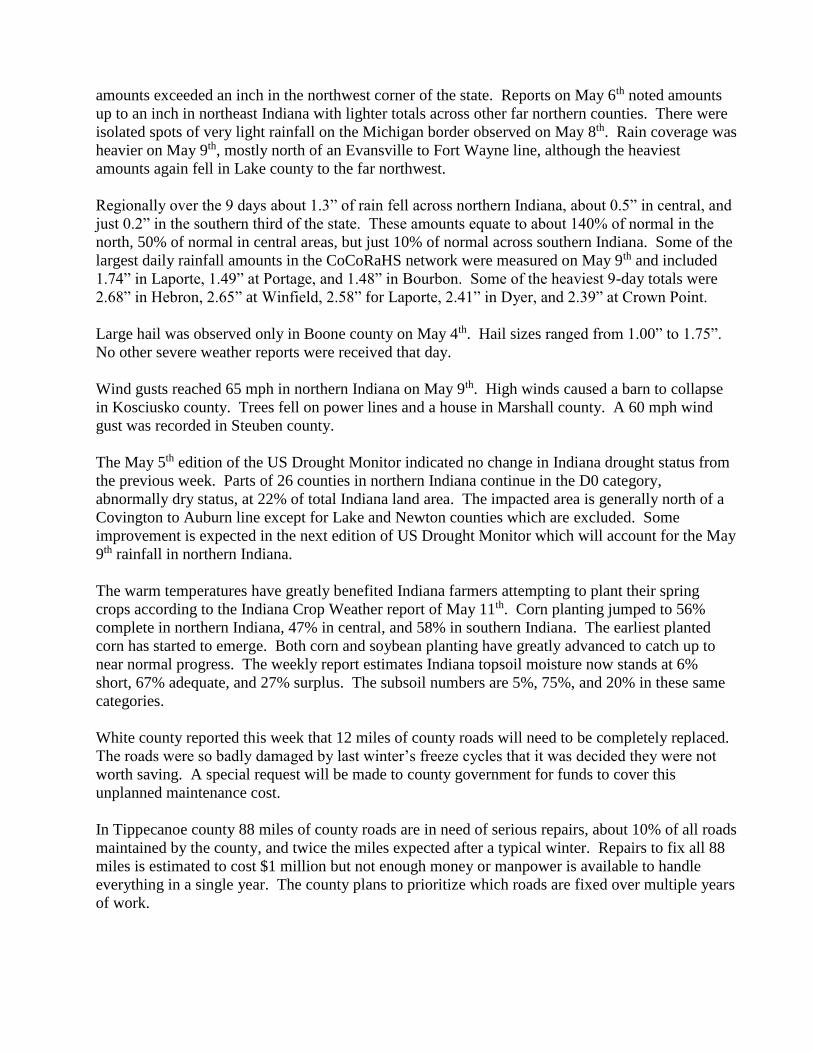
amounts exceeded an inch in the northwest corner of the state. Reports on May 6th noted amounts
up to an inch in northeast Indiana with lighter totals across other far northern counties. There were
isolated spots of very light rainfall on the Michigan border observed on May 8th. Rain coverage was
heavier on May 9th, mostly north of an Evansville to Fort Wayne line, although the heaviest
amounts again fell in Lake county to the far northwest.
Regionally over the 9 days about 1.3” of rain fell across northern Indiana, about 0.5” in central, and
just 0.2” in the southern third of the state. These amounts equate to about 140% of normal in the
north, 50% of normal in central areas, but just 10% of normal across southern Indiana. Some of the
largest daily rainfall amounts in the CoCoRaHS network were measured on May 9th and included
1.74” in Laporte, 1.49” at Portage, and 1.48” in Bourbon. Some of the heaviest 9-day totals were
2.68” in Hebron, 2.65” at Winfield, 2.58” for Laporte, 2.41” in Dyer, and 2.39” at Crown Point.
Large hail was observed only in Boone county on May 4th. Hail sizes ranged from 1.00” to 1.75”.
No other severe weather reports were received that day.
Wind gusts reached 65 mph in northern Indiana on May 9th. High winds caused a barn to collapse
in Kosciusko county. Trees fell on power lines and a house in Marshall county. A 60 mph wind
gust was recorded in Steuben county.
The May 5th edition of the US Drought Monitor indicated no change in Indiana drought status from
the previous week. Parts of 26 counties in northern Indiana continue in the D0 category,
abnormally dry status, at 22% of total Indiana land area. The impacted area is generally north of a
Covington to Auburn line except for Lake and Newton counties which are excluded. Some
improvement is expected in the next edition of US Drought Monitor which will account for the May
9th rainfall in northern Indiana.
The warm temperatures have greatly benefited Indiana farmers attempting to plant their spring
crops according to the Indiana Crop Weather report of May 11th. Corn planting jumped to 56%
complete in northern Indiana, 47% in central, and 58% in southern Indiana. The earliest planted
corn has started to emerge. Both corn and soybean planting have greatly advanced to catch up to
near normal progress. The weekly report estimates Indiana topsoil moisture now stands at 6%
short, 67% adequate, and 27% surplus. The subsoil numbers are 5%, 75%, and 20% in these same
categories.
White county reported this week that 12 miles of county roads will need to be completely replaced.
The roads were so badly damaged by last winter’s freeze cycles that it was decided they were not
worth saving. A special request will be made to county government for funds to cover this
unplanned maintenance cost.
In Tippecanoe county 88 miles of county roads are in need of serious repairs, about 10% of all roads
maintained by the county, and twice the miles expected after a typical winter. Repairs to fix all 88
miles is estimated to cost $1 million but not enough money or manpower is available to handle
everything in a single year. The county plans to prioritize which roads are fixed over multiple years
of work.
May 10th – 16th
The warmth of early May continued into mid-month except for a brief 3-day cool down this week.
Rain fell statewide on 4 days. Total precipitation for the week was heaviest in west central and
southwestern Indiana but light in the far southeast. Two storm systems moved through the state
with wind damage noted on 3 days. Despite the rain delays field planting has nearly caught up to
normal seasonal progress.
On May 10th a stationary front lie across Indiana. The state average temperature opened the week at
11°F above normal. The stationary front morphed into a warm front the next day and lifted north of
the state, placing Indiana fully within a warm air mass sector. The cold front of the storm complex
followed through Indiana on May 12th. High pressure traveled behind the front toward the state,
tapping into much colder Canadian air. The state temperature dropped to 4°F below normal. On
May 13th the cold ridge settled overhead Indiana, lowering the state temperature to 6°F below
normal, the coldest day of the week.
The next day the ridge moved east to New York, starting a warm southerly return wind flow into
Indiana. The state temperature began its rebound to 4°F below normal. A new storm system
approached the state from the west, pushing its warm front through Indiana and boosting
temperatures to 5°F above normal. Indiana was positioned inside its second warm sector of the
week.
The warm front stalled on the Michigan border as a stationary front on May 16th. The warm air
mass over Indiana could not counter the momentum of more cold air moving south from Canada.
As the week ended neither the warm nor cold air could advance. The state temperature held at 6°F
above normal to end the week.
Overall for the week the state temperature averaged to 2°F above normal. Typically for mid-May
the daily maximum temperature should vary between 69°F in far northern Indiana to 76°F in the far
southwest corner of the state. Normal daily minimums range between 48°F and 54°F north to south
across the state. The warmest local temperature among stations in the cooperative network this

week was 89°F at Boonville 1s on May 10th and at Brookville on May 12th. The coldest
temperature in this same network was 36°F at Francesville and at West Lafayette 6nw on May 13th.
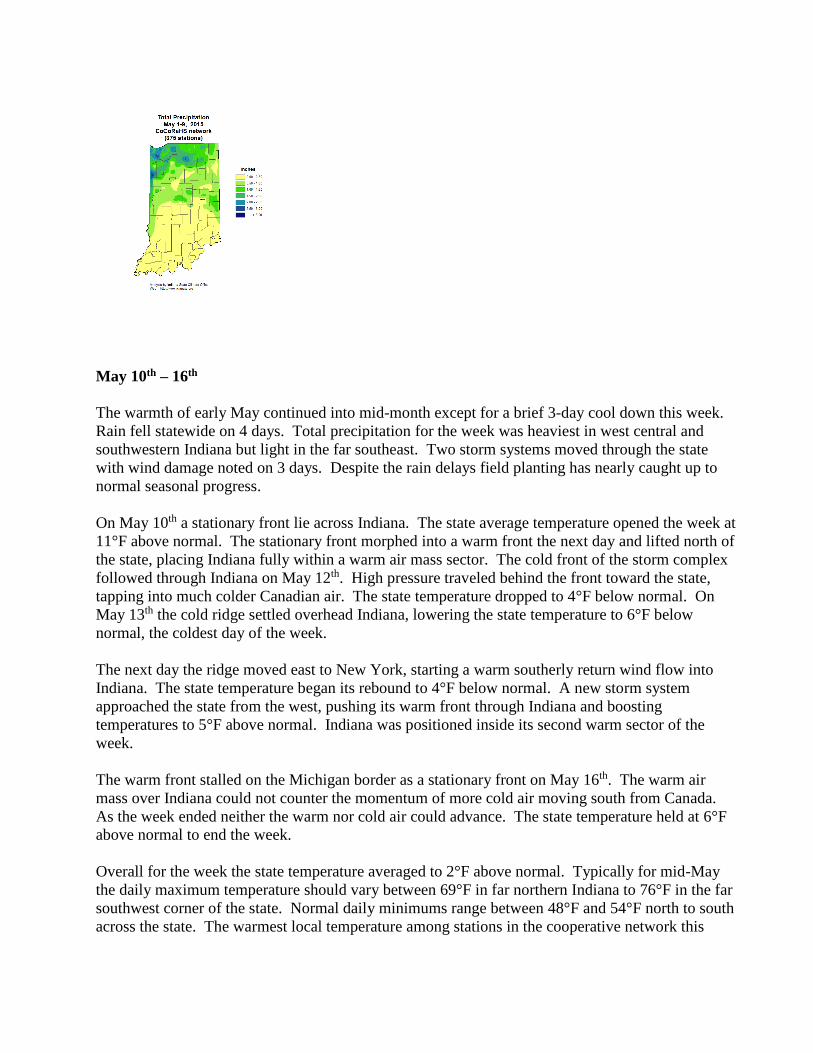
Rain fell statewide on 4 days as noted in reports on the mornings of May 10th, 11th, 12th, and 16th
while statewide dry days were May 13th and 14th. The heaviest daily amounts according to the
CoCoRaHS network were measured the morning of May10th when two Muncie volunteers had
2.40” and 2.08”. A Kentland observer caught 2.01” in the gage that day while Albany had 1.75”
and Fort Branch collected 1.74”. For the week the largest totals were Muncie with 2.86”, Bedford
at 2.84”, while Shoals, Kentland, and Melody Hill all had 2.69”. Regionally on average about 1.2”
was tallied in northern Indiana while central and southern Indiana had a bit more at 1.3”. These
totals equate to about 150% of normal in northern Indiana, 130% in central counties, and 110% of
normal in the south.
Severe weather struck areas of Indiana on days when warm unstable air occupied the state. On May
10th wind gust damage was limited to the north half of Orange county in south central Indiana.
Winds to 75 mph snapped or uprooted several trees, caused heavy damage to a few garages and a
barn, and flipped a horse trailer.
Areas of wind gust damage expanded to several counties and moved to east central Indiana on May
11th. High winds overturned a semi on I-65 near Columbus in Bartholomew county while trees fell
on 2 cars there. In Randolph county trees fell on power lines, a house, cars, and blocked roads. A
state road was closed by debris. In Wayne county 2 semis on I-70 were blown into the median,
trees were uprooted, and wind gusts heavily damaged the roof and walls of a porch. High winds
severely damaged a storage building and barn in Union county. In Fayette county trees tore into
power lines. More tree limbs fell in Franklin and Rush counties. An isolated 1.0” diameter large
hail report was taken from Allen county this same day.
Severe weather left the state for a few days of cooler weather. But when the warmth returned later
in the week so did severe storms. On May 15th wind gusts to 65 mph in Sullivan and Vigo counties
ripped down more tree limbs. Power lines were reported down due to high winds in Hamilton
county.
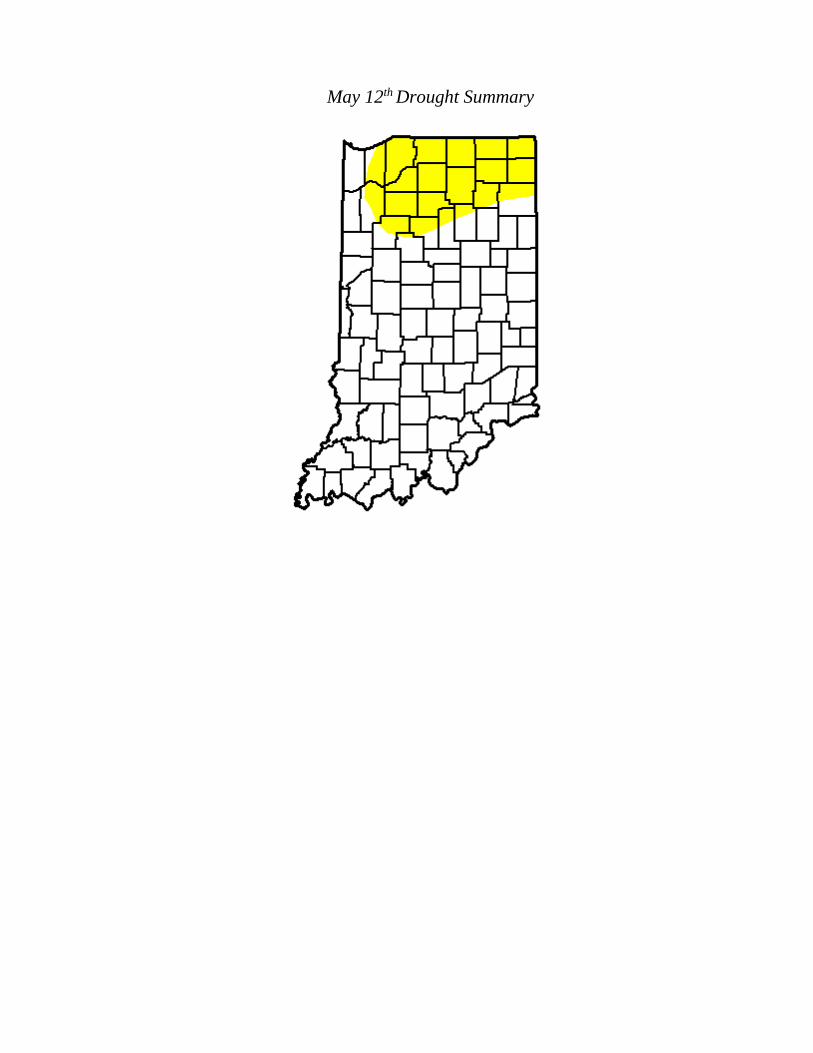
According to the May 12th edition of the US Drought Monitor, abnormally dry conditions abated in
west central Indiana but spread in northeast Indiana. The D0 category was removed from Fountain,
Warren, Tippecanoe, and the south half of White county. But northern Wabash, northern Allen, and
all of Whitley county were newly designated as abnormally dry. The net effect was a 2% reduction
in total Indiana land area assigned to the D0 category, recalculated to 20% of total area. Thus 80%
of all Indiana land was rated to be in normal soil moisture status.
According to the May 18th edition of the Indiana Crop Report rainfall has slowed regional planting
but warmer temperatures have improved overall Indiana crop status. Statewide planting progress
has essentially caught up to normal status for the date. Nearly half of the planted corn crop has
emerged.
May 17th – 23rd
The first half of May had been generally warmer than normal. The first significant cold spell of the
month arrived on May 19th and continued through the rest of this week. Rainfall returned to a
familiar pattern, spilling heavier amounts along the Ohio River and trending drier northward across
the state. Severe weather was at a minimum this week with reported wind damage limited to just
one county on a single day. Corn planting is wrapping up but cool temperatures are slowing crop
germination and farmer tillage.
The week began mild with the state average temperature at 9°F above normal. A warm front
pushed through Indiana on May 17th as higher temperatures expanded to cover the east half of the
country. Not much changed the next day in Indiana although a cold front drew much closer to the
state. This cold front moved across Indiana on May 19th. The state temperature plummeted to 9°F
below normal that day. High pressure in the cold air mass settled overhead Indiana on May 20th and
the state average temperature bottomed to 15°F below normal, the coldest day this week.
High pressure was still overhead Indiana on May 21st but air temperatures began to moderate day by
day. The state temperature had rebounded to 11°F below normal then to 6°F below normal by May
22nd. The ridge was sinking southward and warming but a new cold front was located on the
Michigan border. This was a weak front, however, and was washed off the weather map the last
day of the week. The original high pressure ridge had still hung around and as the week ended slid
east of Indiana. The return wind flow behind this system allowed the state temperature to creep
upward a few more degrees, closing the week at 2°F below normal.
Over the full week the state temperature had averaged near 4°F below normal. Usually at this point
in May daily maximum temperatures should range between 71°F and 78°F north to south across the
state. Daily minimums normally vary from 50°F in far northern Indiana to 56°F in its far southwest
corner. The warmest local daily maximum temperature among cooperative network stations was
90°F at the Evansville Museum on May 23rd. The coolest minimum in this same network this week
was 35°F on May 20th at the NWS Northern Indiana office and at Garrett.
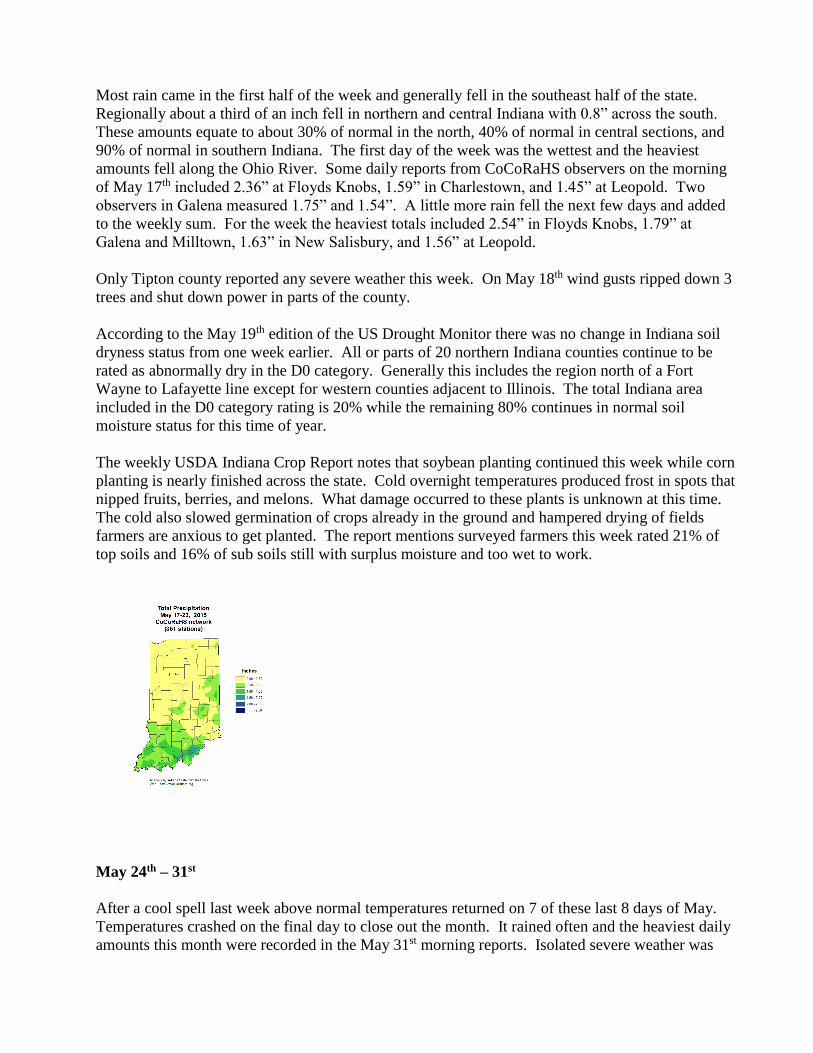
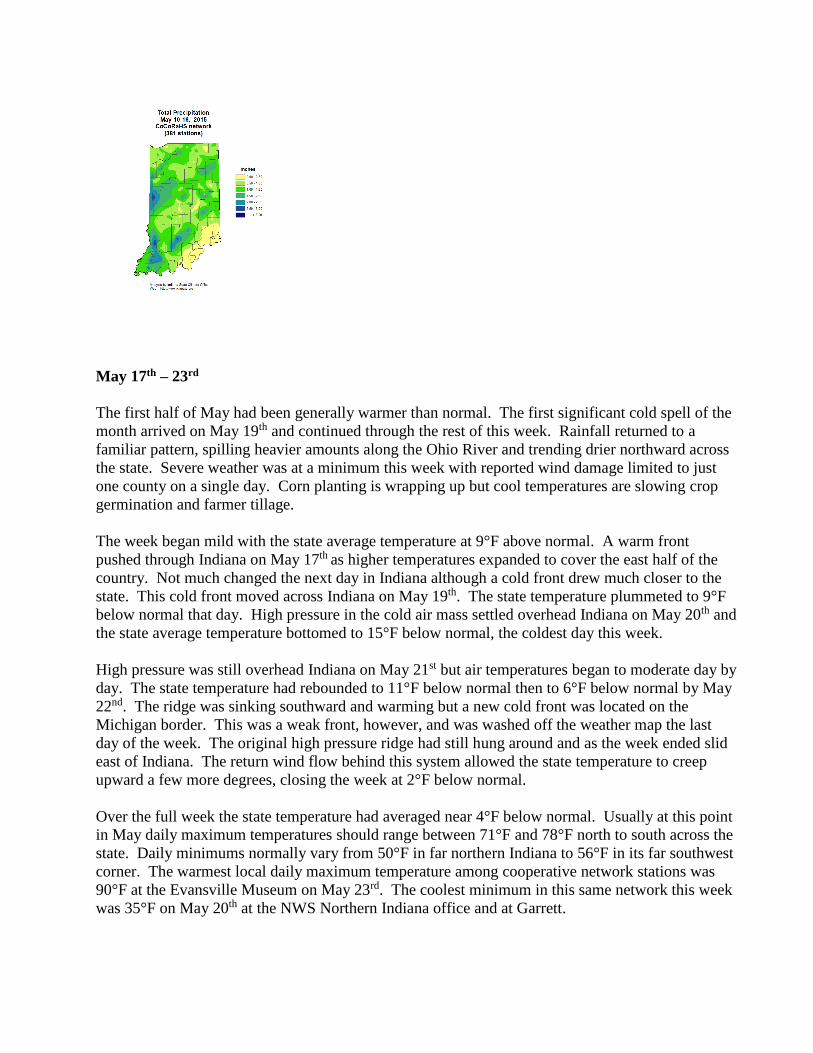
Most rain came in the first half of the week and generally fell in the southeast half of the state.
Regionally about a third of an inch fell in northern and central Indiana with 0.8” across the south.
These amounts equate to about 30% of normal in the north, 40% of normal in central sections, and
90% of normal in southern Indiana. The first day of the week was the wettest and the heaviest
amounts fell along the Ohio River. Some daily reports from CoCoRaHS observers on the morning
of May 17th included 2.36” at Floyds Knobs, 1.59” in Charlestown, and 1.45” at Leopold. Two
observers in Galena measured 1.75” and 1.54”. A little more rain fell the next few days and added
to the weekly sum. For the week the heaviest totals included 2.54” in Floyds Knobs, 1.79” at
Galena and Milltown, 1.63” in New Salisbury, and 1.56” at Leopold.
Only Tipton county reported any severe weather this week. On May 18th wind gusts ripped down 3
trees and shut down power in parts of the county.
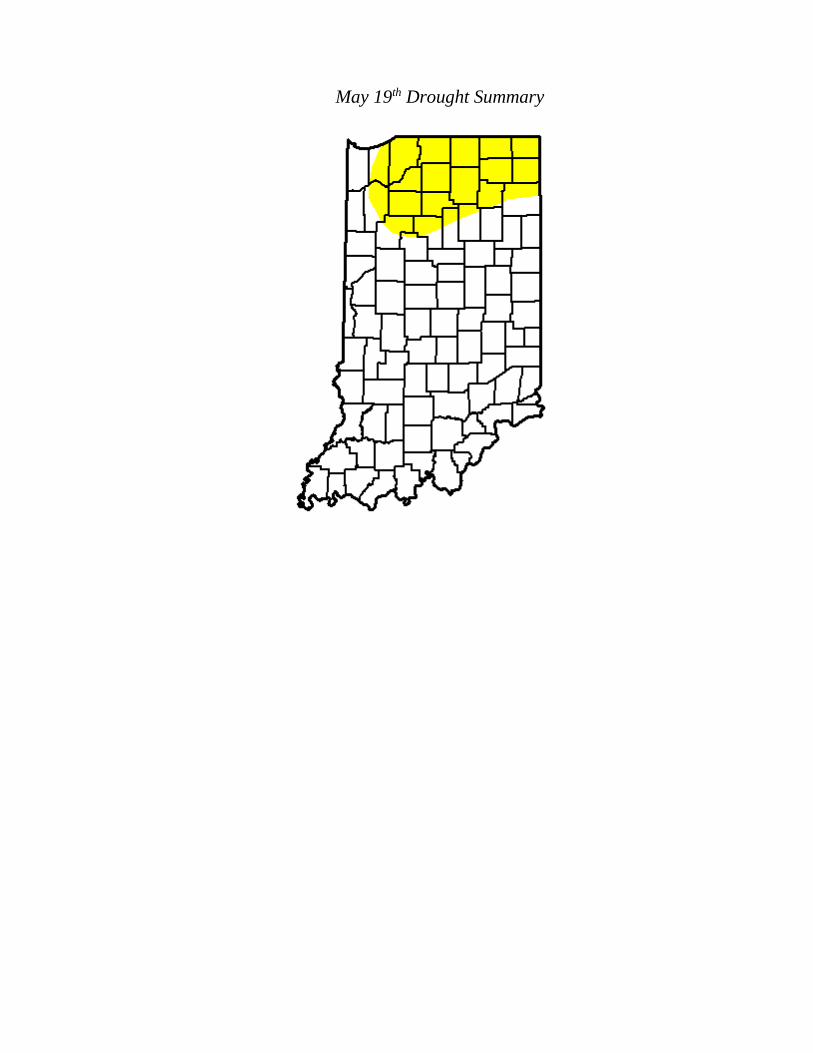
According to the May 19th edition of the US Drought Monitor there was no change in Indiana soil
dryness status from one week earlier. All or parts of 20 northern Indiana counties continue to be
rated as abnormally dry in the D0 category. Generally this includes the region north of a Fort
Wayne to Lafayette line except for western counties adjacent to Illinois. The total Indiana area
included in the D0 category rating is 20% while the remaining 80% continues in normal soil
moisture status for this time of year.
The weekly USDA Indiana Crop Report notes that soybean planting continued this week while corn
planting is nearly finished across the state. Cold overnight temperatures produced frost in spots that
nipped fruits, berries, and melons. What damage occurred to these plants is unknown at this time.
The cold also slowed germination of crops already in the ground and hampered drying of fields
farmers are anxious to get planted. The report mentions surveyed farmers this week rated 21% of
top soils and 16% of sub soils still with surplus moisture and too wet to work.
May 24th – 31st
After a cool spell last week above normal temperatures returned on 7 of these last 8 days of May.
Temperatures crashed on the final day to close out the month. It rained often and the heaviest daily
amounts this month were recorded in the May 31st morning reports. Isolated severe weather was

noted on May 26th and 27th. Widespread severe weather broke out across Indiana on the evening of
May 30th. An EF-1 tornado was confirmed in Marion county and a lightning strike started a garage
fire in Newton county. There was significant damage in these events but no injuries.
High pressure that had transported cool air into Indiana last week departed to eastern states on May
24th. Southerly winds on the back side of this system returned much warmer air to the state. The
daily state average temperature opened at 3°F above normal. As the high center moved into the
Atlantic the next storm system pushed its warm front through Indiana the next day, lifting the state
temperature to 7°F above normal. On May 26th the Atlantic high center reversed direction and
moved back onshore. This stalled all Midwest fronts which formed into one long stationary front
stretching from Ontario through the Great Plains into Texas. Indiana remained east of this front in
the warm air sector with the daily temperature rising to 9°F above normal, the warmest of the 8 day
interval.
Temperatures changed little the next day. Part of the stationary front converted into a weak cold
front and inched closer to Indiana. This cold front passed through the state on May 28th. The
temperature dipped only slightly to 5°F above normal as the air mass behind the cold front
originated in the Pacific. Meanwhile a slowing cold front in upper Michigan was headed to Indiana.
The fronts merged and stalled into a single stationary front over Indiana on May 29th. The
temperature held nearly steady at 6°F above normal. By early May 30th the air had mixed so well
that the stationary front disappeared on the weather map with no change in state temperature.
A polar cold front crossed Indiana late on May 30th and into May 31st. Much colder air streamed
into Indiana from Canada. Temperatures dived sharply in just an hour or two to 9°F below normal.
Chilly air dominated the state in the final hours of May. Yet overall it was a warm 8 days with the
state temperature averaging to 5°F above normal. Typically near the end of May daily maximum
temperatures are expected to range from 74°F in far northern Indiana to 80°F in the far southwest.
Daily minimums normally vary between 52°F and 58°F north to south. The warmest daily
maximum temperature in the cooperative station network was 91°F at Brookville on May 8th. The
coolest minimum in this network was 31°F at Purdue University Airport on May 1st.
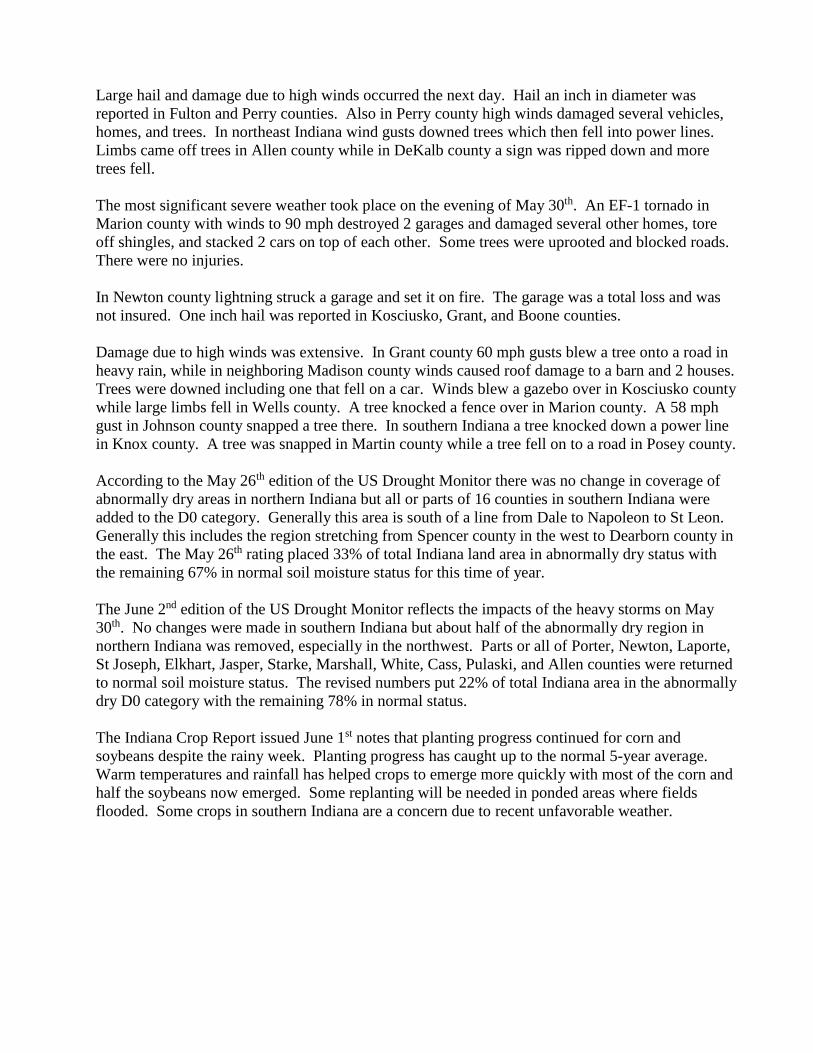
With several fronts in the vicinity of Indiana rain fell nearly every day. The bulk of the
precipitation was found in the morning reports of May 31st with the passage of the strong cold front.
Regional 8-day totals were about 2.3” in northern Indiana, 1.8” in central sections, and 0.9” across
the south. These amounts equate to nearly twice normal in the north, 140% of normal in central,
and 70% of normal in southern Indiana. The heaviest precipitation fell on May 31st in northwest
and central Indiana. Some of the heavier amounts measured by CoCoRaHS volunteers that morning
included 5.01” just southwest of Kokomo, 4.75” at Indian Heights, 4.02” west of Kokomo, and
3.96” near Russiaville and Wheatfield. These downpours caused localized flash flooding. Over the
8 days CoCoRaHS totals include 5.41” southwest of Kokomo, 5.22” in Indian Heights, 4.68” at
Wheatfield, 4.61” in Hanna, and 4.41” at Demotte.
Severe weather occurred on 3 days. High wind damage was limited to 3 counties on May 26th.
Wind gusts damaged a barn roof in Jay county. In Henry county the side of a pole barn was pushed
in and tree limbs in the area were ripped down. Tree limbs were also reported down in Ripley
county.
Large hail and damage due to high winds occurred the next day. Hail an inch in diameter was
reported in Fulton and Perry counties. Also in Perry county high winds damaged several vehicles,
homes, and trees. In northeast Indiana wind gusts downed trees which then fell into power lines.
Limbs came off trees in Allen county while in DeKalb county a sign was ripped down and more
trees fell.
The most significant severe weather took place on the evening of May 30th. An EF-1 tornado in
Marion county with winds to 90 mph destroyed 2 garages and damaged several other homes, tore
off shingles, and stacked 2 cars on top of each other. Some trees were uprooted and blocked roads.
There were no injuries.
In Newton county lightning struck a garage and set it on fire. The garage was a total loss and was
not insured. One inch hail was reported in Kosciusko, Grant, and Boone counties.
Damage due to high winds was extensive. In Grant county 60 mph gusts blew a tree onto a road in
heavy rain, while in neighboring Madison county winds caused roof damage to a barn and 2 houses.
Trees were downed including one that fell on a car. Winds blew a gazebo over in Kosciusko county
while large limbs fell in Wells county. A tree knocked a fence over in Marion county. A 58 mph
gust in Johnson county snapped a tree there. In southern Indiana a tree knocked down a power line
in Knox county. A tree was snapped in Martin county while a tree fell on to a road in Posey county.
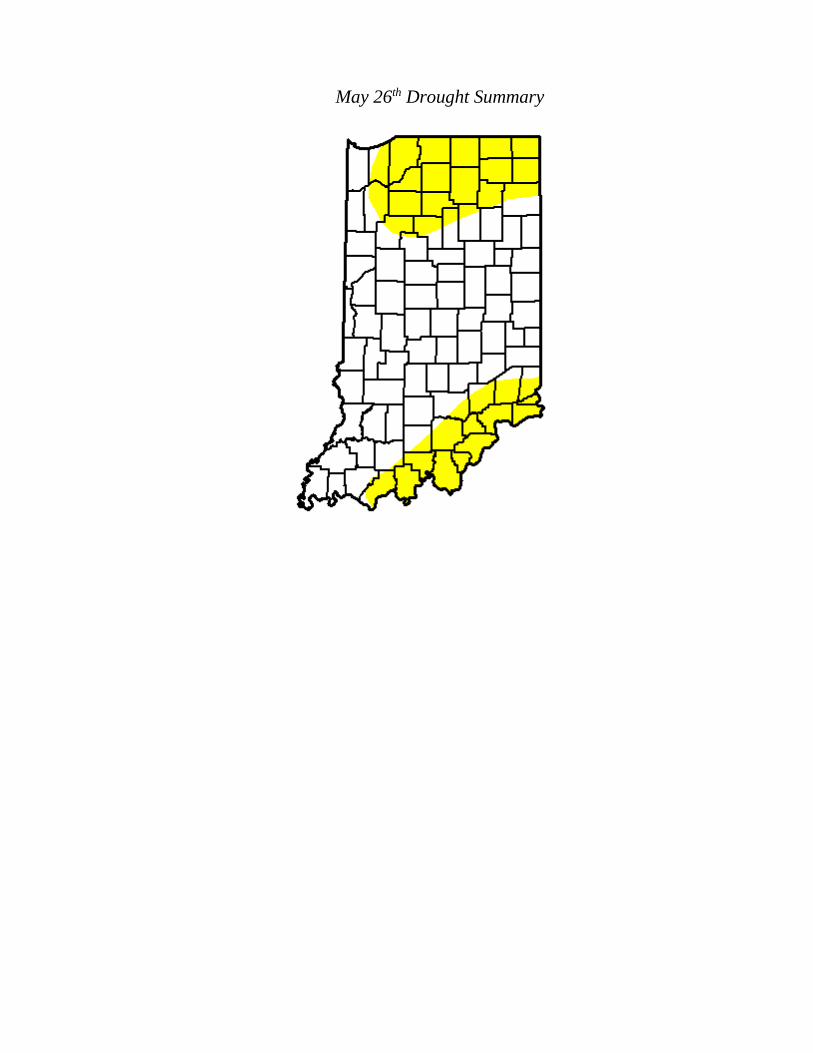
According to the May 26th edition of the US Drought Monitor there was no change in coverage of
abnormally dry areas in northern Indiana but all or parts of 16 counties in southern Indiana were
added to the D0 category. Generally this area is south of a line from Dale to Napoleon to St Leon.
Generally this includes the region stretching from Spencer county in the west to Dearborn county in
the east. The May 26th rating placed 33% of total Indiana land area in abnormally dry status with
the remaining 67% in normal soil moisture status for this time of year.
The June 2nd edition of the US Drought Monitor reflects the impacts of the heavy storms on May
30th. No changes were made in southern Indiana but about half of the abnormally dry region in
northern Indiana was removed, especially in the northwest. Parts or all of Porter, Newton, Laporte,
St Joseph, Elkhart, Jasper, Starke, Marshall, White, Cass, Pulaski, and Allen counties were returned
to normal soil moisture status. The revised numbers put 22% of total Indiana area in the abnormally
dry D0 category with the remaining 78% in normal status.
The Indiana Crop Report issued June 1st notes that planting progress continued for corn and
soybeans despite the rainy week. Planting progress has caught up to the normal 5-year average.
Warm temperatures and rainfall has helped crops to emerge more quickly with most of the corn and
half the soybeans now emerged. Some replanting will be needed in ponded areas where fields
flooded. Some crops in southern Indiana are a concern due to recent unfavorable weather.

May 2015
Temperature
Region Temperature Normal Deviation
Northwest 63.6 60.8 2.8
North Central 63.6 60.3 3.3
Northeast 63.3 59.8 3.4
West Central 65.5 62.3 3.3
Central 65.5 61.7 3.8
East Central 65.6 60.8 4.8
Southwest 66.9 64.6 2.3
South Central 66.6 63.9 2.8
Southeast 66.8 63.0 3.8
State 65.3 62.0 3.3
Precipitation
Region Precipitation Normal Deviation Percent of Normal
Northwest 5.49 3.98 1.52 138
North Central 5.08 3.85 1.22 132
Northeast 4.74 3.78 0.96 125
West Central 4.09 4.38 -0.29 93
Central 3.38 4.40 -1.02 77
East Central 3.92 4.31 -0.39 91
Southwest 3.94 4.99 -1.05 79
South Central 3.43 5.00 -1.57 69
Southeast 2.54 4.85 -2.31 52
State 4.08 4.40 -0.33 93
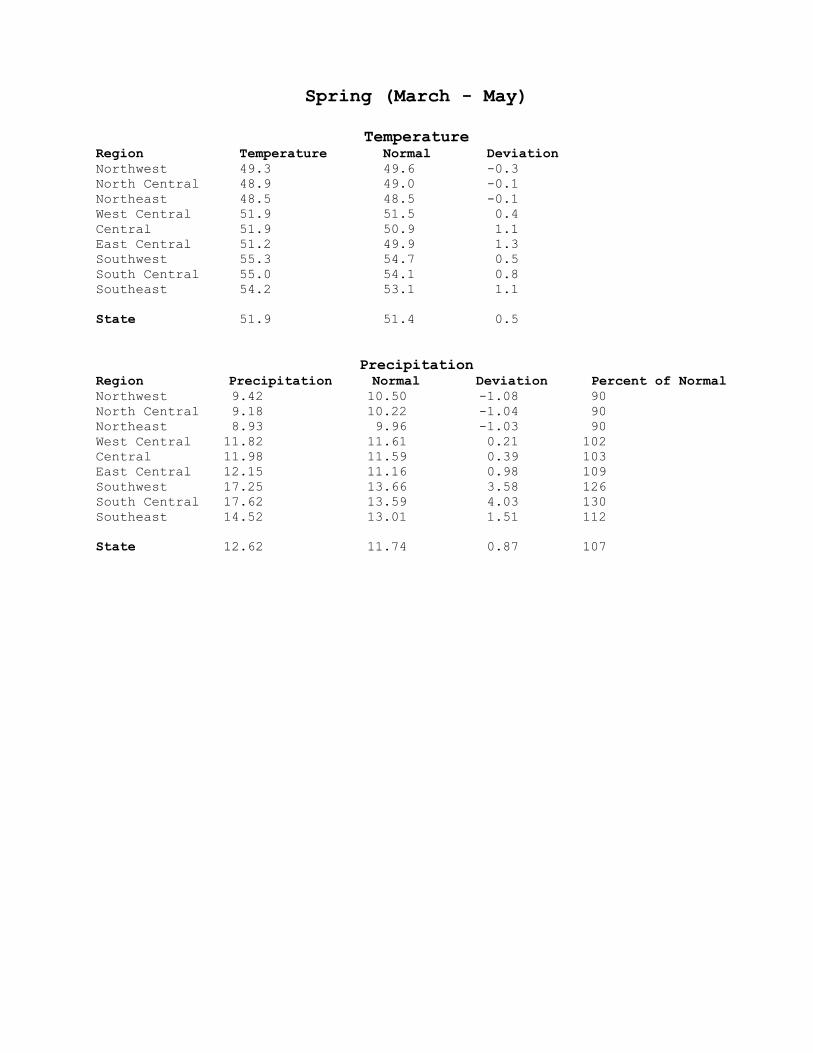
Spring (March - May)
Temperature
Region Temperature Normal Deviation
Northwest 49.3 49.6 -0.3
North Central 48.9 49.0 -0.1
Northeast 48.5 48.5 -0.1
West Central 51.9 51.5 0.4
Central 51.9 50.9 1.1
East Central 51.2 49.9 1.3
Southwest 55.3 54.7 0.5
South Central 55.0 54.1 0.8
Southeast 54.2 53.1 1.1
State 51.9 51.4 0.5
Precipitation
Region Precipitation Normal Deviation Percent of Normal
Northwest 9.42 10.50 -1.08 90
North Central 9.18 10.22 -1.04 90
Northeast 8.93 9.96 -1.03 90
West Central 11.82 11.61 0.21 102
Central 11.98 11.59 0.39 103
East Central 12.15 11.16 0.98 109
Southwest 17.25 13.66 3.58 126
South Central 17.62 13.59 4.03 130
Southeast 14.52 13.01 1.51 112
State 12.62 11.74 0.87 107
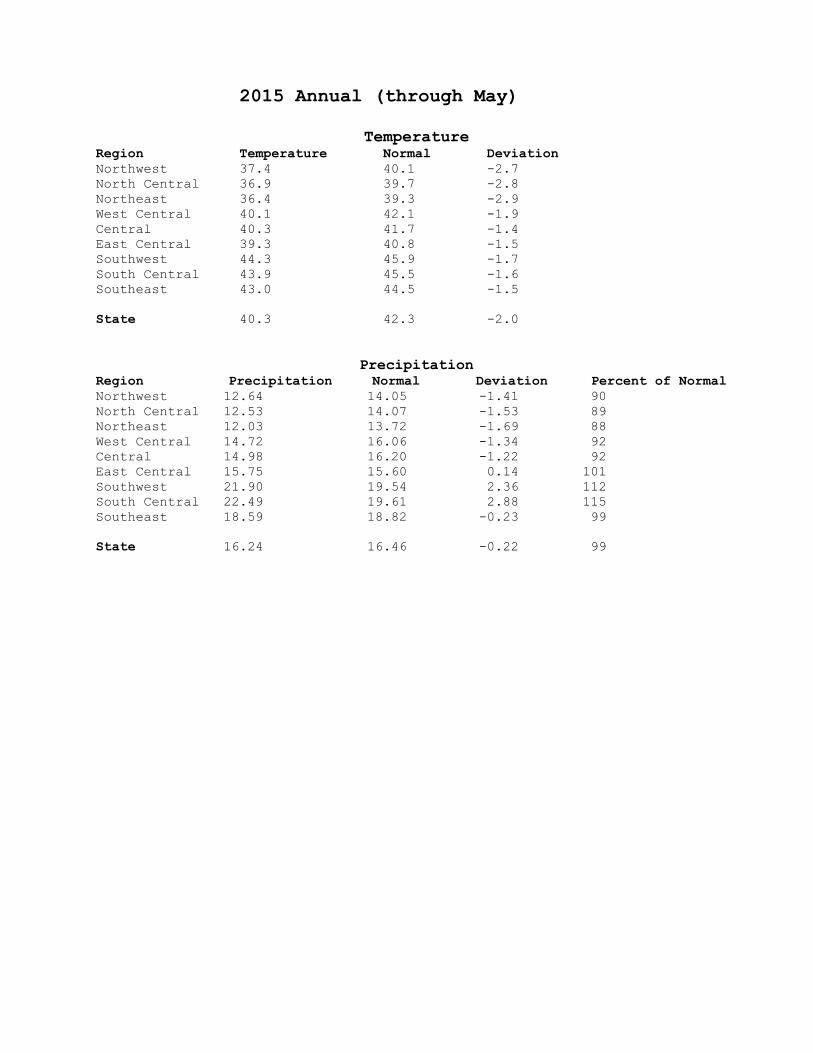
2015 Annual (through May)
Temperature
Region Temperature Normal Deviation
Northwest 37.4 40.1 -2.7
North Central 36.9 39.7 -2.8
Northeast 36.4 39.3 -2.9
West Central 40.1 42.1 -1.9
Central 40.3 41.7 -1.4
East Central 39.3 40.8 -1.5
Southwest 44.3 45.9 -1.7
South Central 43.9 45.5 -1.6
Southeast 43.0 44.5 -1.5
State 40.3 42.3 -2.0
Precipitation
Region Precipitation Normal Deviation Percent of Normal
Northwest 12.64 14.05 -1.41 90
North Central 12.53 14.07 -1.53 89
Northeast 12.03 13.72 -1.69 88
West Central 14.72 16.06 -1.34 92
Central 14.98 16.20 -1.22 92
East Central 15.75 15.60 0.14 101
Southwest 21.90 19.54 2.36 112
South Central 22.49 19.61 2.88 115
Southeast 18.59 18.82 -0.23 99
State 16.24 16.46 -0.22 99


Drought Summary from the U.S. Drought Monitor Below is a drought summary for the state of Indiana from the U.S. Drought Monitor.
Areas in white are not experiencing any drought. Yellow areas are abnormally dry, but not
considered a drought. Drought begins when the moisture levels become more severe,
with beige, orange, red, and brown indicating increasing levels of drought (moderate, severe,
extreme, and exceptional, respectively). The table below indicates what percentage of the state is
drought free, and how much of the state is in drought by degree of severity (D1 - D4 category).

May 5th Drought Summary
May 12th Drought Summary
May 19th Drought Summary
May 26th Drought Summary