maximizing value presentation
DESCRIPTION
Maximizing Value Presentation - Delta L&L St. John's (9!29!09)TRANSCRIPT

Sand Management Services
Maximizing Asset Value through Detailed Sandface Completion Selection
September 29, 2009St. John’s, Newfoundland & Labrador
Bryan Stamm

Introduction
� Every sand prone field (or well) has its optimum sandface completion from a commercial standpoint.
� As a completion engineer, you have many options:
– Managed sand production• Separation and Disposal
2September 29, 2009Sand Management Services
– Sanding prevention• Selective and orient perforating, managed drawdown, etc.
– Sand Control• Cased hole gravel pack, fracpack, SAS, ESS, OHGP + intelligent completion,
etc…
� Your job is to investigate the technical and financial aspects of each, and determine which one provides the best value for your company

Agenda
� Geomechanics and Sanding Prediction
� Sandface completion options and screening – Technical Qualification (FEED)
� Capex, Production, Opex, Recovery…speaking a common language and quantifying $
3September 29, 2009Sand Management Services
and quantifying $
� Conclusions / Example
� Technology advancements
� Questions

Geomechanics and Sanding Prediction
� Onset of sanding can be modeled
– Some wells will sand immediately
– Some may never produce sand
– Some may sand later in the well / field life
4September 29, 2009Sand Management Services
� The degree of certainty in sanding prediction is dictated by the quality of the “inputs”…rock strength, drawdown, completion type, wellbore inclination, etc. – Dipole Sonic, Sonic Scanners, Cores, Tectonics, etc
� Previous “similar” field experiences or rock mechanics studies should not be used in isolation.
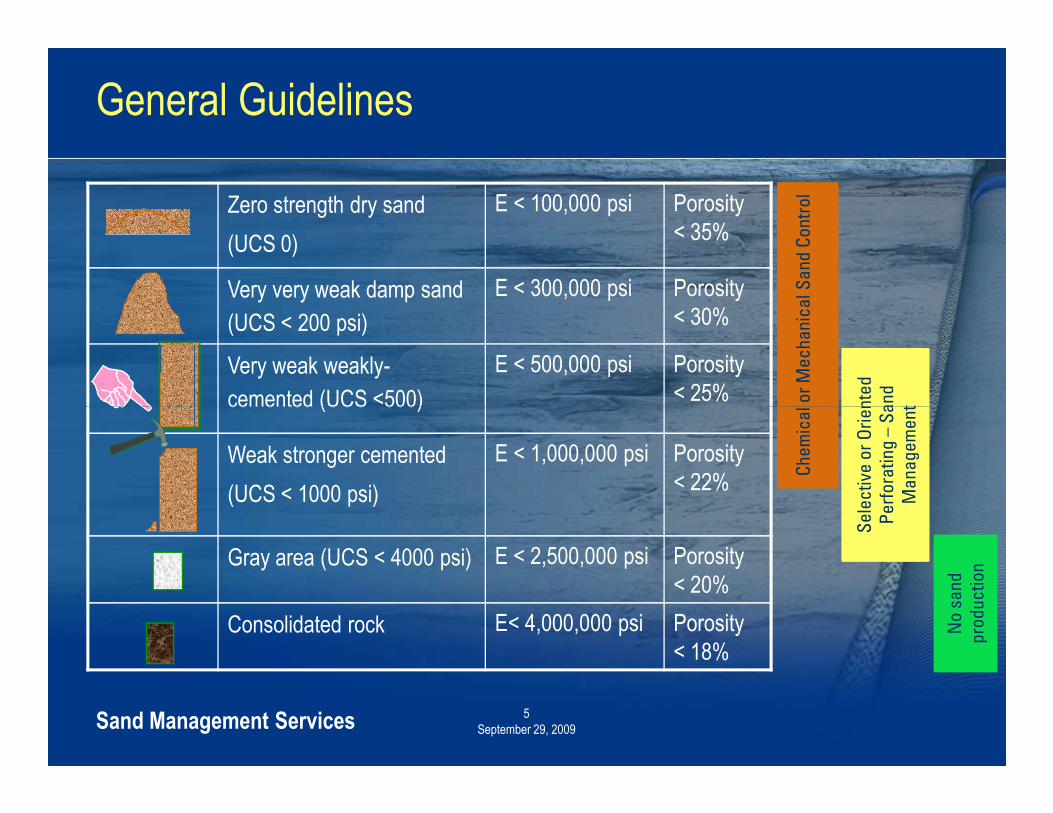
General Guidelines
Zero strength dry sand
(UCS 0)
E < 100,000 psi Porosity < 35%
Very very weak damp sand
(UCS < 200 psi)
E < 300,000 psi Porosity < 30%
Very weak weakly-
cemented (UCS <500)
E < 500,000 psi Porosity < 25%
Ch
em
ica
l or
Me
ch
an
ica
l S
an
d C
on
tro
l
Se
lec
tive
or
Ori
en
ted
Sa
nd
Ma
na
ge
me
nt
Se
lec
tive
or
Ori
en
ted
Sa
nd
Ma
na
ge
me
nt
Se
lec
tive
or
Ori
en
ted
Sa
nd
Ma
na
ge
me
nt
5September 29, 2009Sand Management Services
cemented (UCS <500)
Weak stronger cemented
(UCS < 1000 psi)
E < 1,000,000 psi Porosity < 22%
Gray area (UCS < 4000 psi) E < 2,500,000 psi Porosity < 20%
Consolidated rock E< 4,000,000 psi Porosity < 18%
Ch
em
ica
l or
Me
ch
an
ica
l S
an
d C
on
tro
l
Se
lec
tive
or
Ori
en
ted
Pe
rfo
rati
ng
–S
an
d
Ma
na
ge
me
nt
No
sa
nd
pro
du
cti
on
Se
lec
tive
or
Ori
en
ted
Pe
rfo
rati
ng
–S
an
d
Ma
na
ge
me
nt
Se
lec
tive
or
Ori
en
ted
Pe
rfo
rati
ng
–S
an
d
Ma
na
ge
me
nt

Sanding prediction and depletion
� Many wells will not produce sand initially, but depletion or onset of water may lead to sanding…even for formations that are initially consolidated.
6September 29, 2009Sand Management Services
� Sand production occurs only if the rock fails and subsequently is transported into the wellbore or to surface.
� Quantification of sand rate and volume is currently inaccurate.

Sanding Analysis Results
� You can spend as little or a much time and money at this stage.
� Get it wrong, and it negatively impact the NPV of the project, one way or another.
7September 29, 2009Sand Management Services
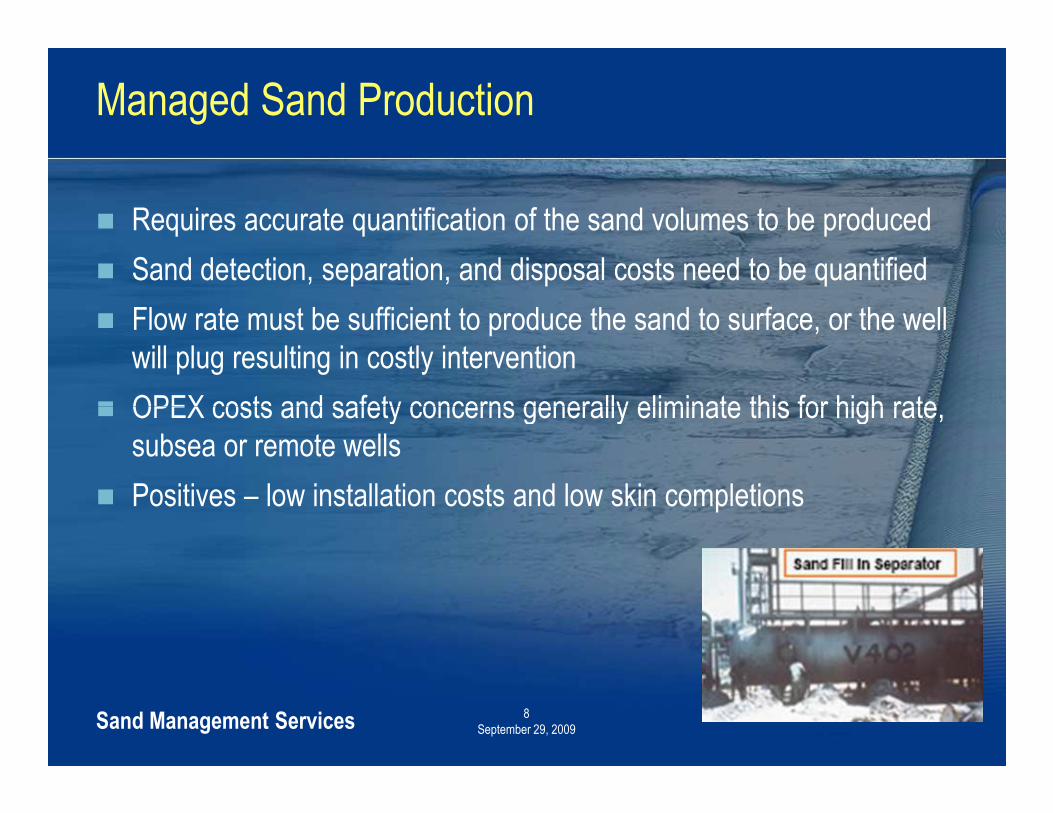
Managed Sand Production
� Requires accurate quantification of the sand volumes to be produced
� Sand detection, separation, and disposal costs need to be quantified
� Flow rate must be sufficient to produce the sand to surface, or the well will plug resulting in costly intervention
� OPEX costs and safety concerns generally eliminate this for high rate,
8September 29, 2009Sand Management Services
� OPEX costs and safety concerns generally eliminate this for high rate, subsea or remote wells
� Positives – low installation costs and low skin completions
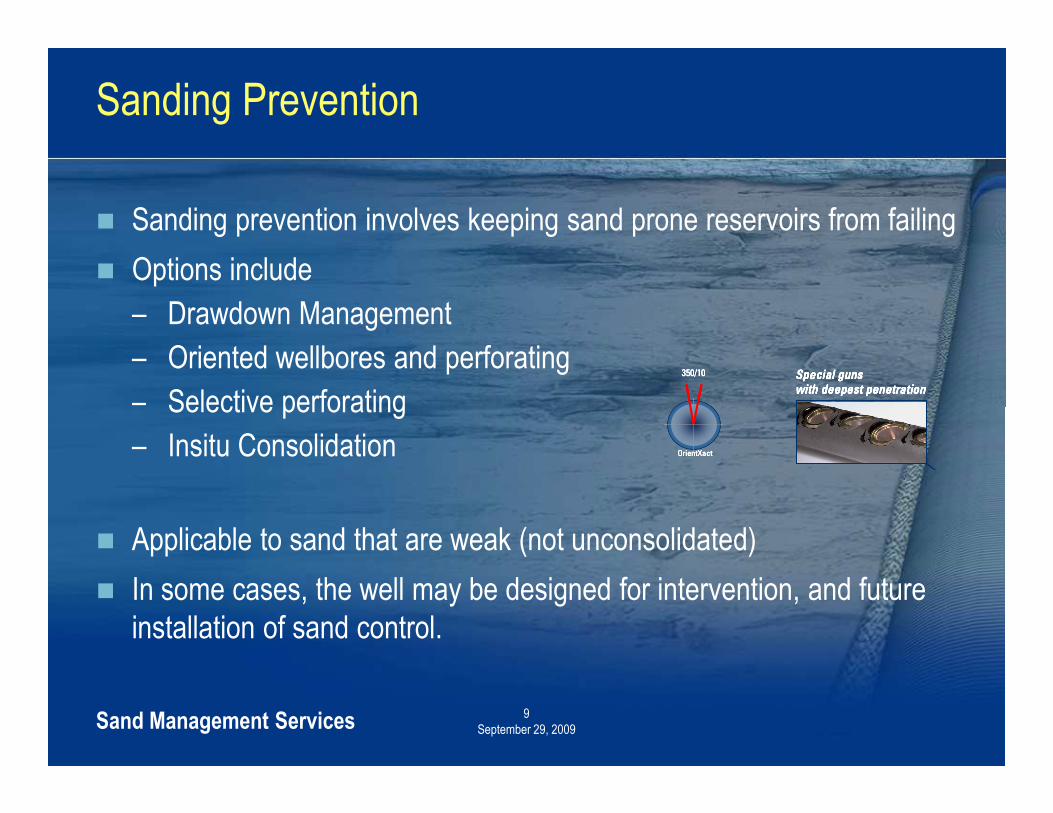
Sanding Prevention
� Sanding prevention involves keeping sand prone reservoirs from failing
� Options include
– Drawdown Management
– Oriented wellbores and perforating
– Selective perforatingSpecial gunsSpecial gunsSpecial gunsSpecial guns
with deepest penetrationwith deepest penetrationwith deepest penetrationwith deepest penetration
350/10 Special gunsSpecial gunsSpecial gunsSpecial guns
with deepest penetrationwith deepest penetrationwith deepest penetrationwith deepest penetration
350/10350/10
9September 29, 2009Sand Management Services
– Selective perforating
– Insitu Consolidation
� Applicable to sand that are weak (not unconsolidated)
� In some cases, the well may be designed for intervention, and future installation of sand control.
OrientXactOrientXactOrientXact
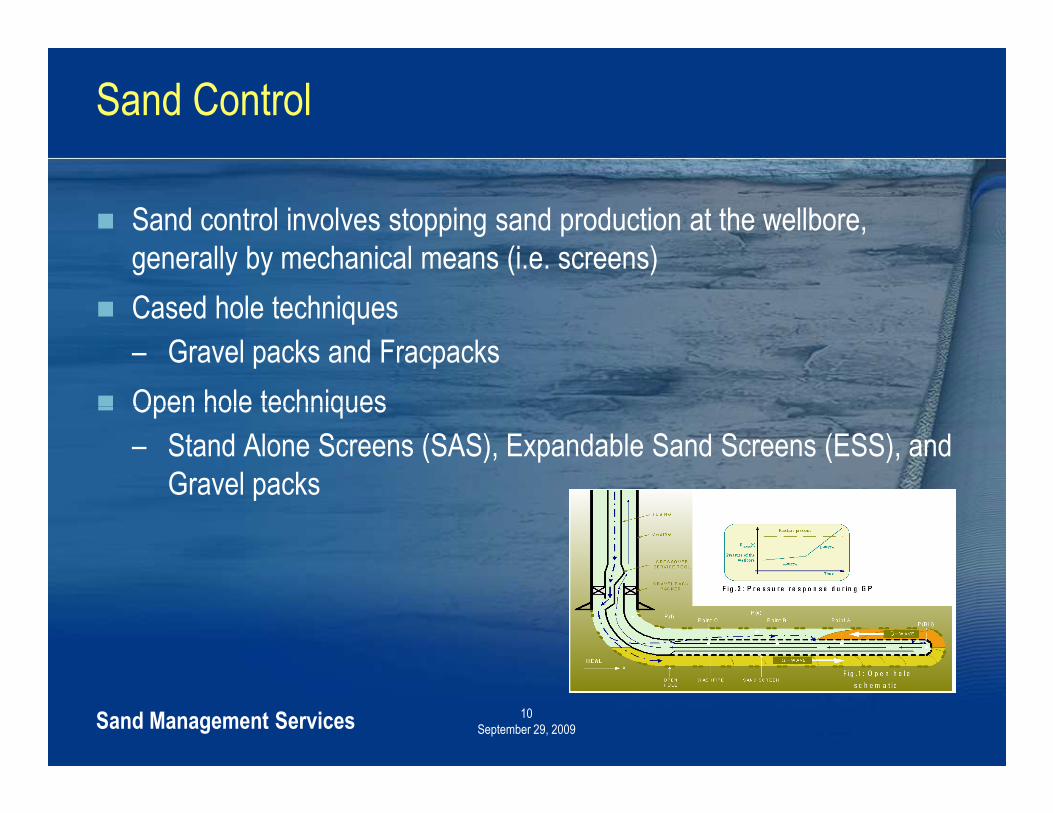
Sand Control
� Sand control involves stopping sand production at the wellbore, generally by mechanical means (i.e. screens)
� Cased hole techniques
– Gravel packs and Fracpacks
� Open hole techniques
10September 29, 2009Sand Management Services
� Open hole techniques
– Stand Alone Screens (SAS), Expandable Sand Screens (ESS), and Gravel packs

Sandface completion options and technical screening - FEED
� The purpose of the Front End Engineering Design (FEED) is to:– confirm the sandface completions types which are technically viable– flag issues with certain techniques that will later help quantify costs,
production, isolation, or potential longevity issues
� Examples: – stand alone screens in reservoirs with extremely poor sand sorting or a
11September 29, 2009Sand Management Services
– stand alone screens in reservoirs with extremely poor sand sorting or a high fines content
– circulating open hole gravel packs in extremely low frac gradient reservoirs– fracpacks in extremely high pressure reservoirs (technical limitations)– cased hole completions in extremely high permeability reservoirs– open hole gravel pack completions where complete zonal isolation is
required

FEED Results
� Based on the results of the FEED, and/or project timing, many sandface completion options will be eliminated
� Typically a detailed commercial analysis is performed on the 2-4 most relevant sandface completion options. However, care must be taken not to discard a particular option because of biases and preconceived notions
12September 29, 2009Sand Management Services
notions
CAPEX, OPEX, Production, Recovery…speaking a common language and quantifying $
� The sandface completion technique with the maximum value is determined by investigating the effect of each completion type with respect to CAPEX, OPEX, Production, and Recovery.
– In all cases CAPEX is quantified ($)
– In most cases Production is quantified (BOPDE)
– In some cases Recovery is quantified (MMBOE recovered)
13September 29, 2009Sand Management Services
– In some cases Recovery is quantified (MMBOE recovered)
– In few cases OPEX is quantified ($ per year)
– In even fewer cases is a combination of OPEX and Production truly quantified

CAPEX, OPEX, Production, Recovery…speaking a common language and quantifying $
� Unless a common metric is used… , it is impossible to properly evaluate the impact CAPEX, OPEX, Production, and Recover for each sandface completion type.
� Requires iteration between drilling, completions, reservoir and production engineering.
� One (or possibly two) sandface completion techniques will emerge as
14September 29, 2009Sand Management Services
� One (or possibly two) sandface completion techniques will emerge as providing the best Net Present Value (NPV).
Photo courtesy of BP

CAPEX
� For each sandface completion type, detailed operational steps and times should be constructed
� This should also include any “drilling” or upper completion time or cost differences
� Typically the following are used to determine the cost estimate for each completion type
15September 29, 2009Sand Management Services
each completion type– Completion time (baseline and with historical NPT)
– Rig rate + spread rate
– Lump sum intangibles (perforating, frac job, etc.)
– Lump sum tangibles (packers, screens, etc.)

CAPEX
� Uncertainty analysis should be included (learning curve, installation train wrecks requiring workover, etc.)
� At this point, no option should be discounted because unfamiliarity or unavailability of a certain sandface techniques. The costs must be properly quantified to obtain that expertise or equipment, no matter the perceived cost
16September 29, 2009Sand Management Services
perceived cost– Example:
– No current stimulation vessels available in XYZ location.
� Do not overlook the costs of engineering studies or facility changes– i.e. OHGP or SAS may require $2MM additional for cores to characterize the
shale or formation vs CH. This could be significant in projects with a limited number of wells.
– i.e. C&P may require sand monitoring devices on the flowline jumpers
OPEX
� Each sanding prevention or sand control completion type has a historical frequency of failure (FoF)
� The FEED study should help identify any high risk of failure completion types under the particular field conditions (i.e. incomplete packs, unacceptably high “Flux”, etc.)
� Historical databases* and reference material is available, but caution should be taken to examine the statistics as they apply to your
17September 29, 2009Sand Management Services
should be taken to examine the statistics as they apply to your particular field conditions.
� OPEX costs can have a very powerful influence on the overall project value, and therefore a truly unbiased analysis must be taken. Uncertainty analysis should be included (Monty Carlo).
*SPE 84262 Sand Control Completion Reliability & Failure Rate Comparison with a Multi-Thousand Well Database, G. King et al.*SPE 112456 Sand Control Completion Failures: Can we all talk the same language, B. Wagg*SPE 97282 Expandable Sand Screens Selection, Performance and Reliability; a review of the first 340 Installation, C. Jones
OPEX
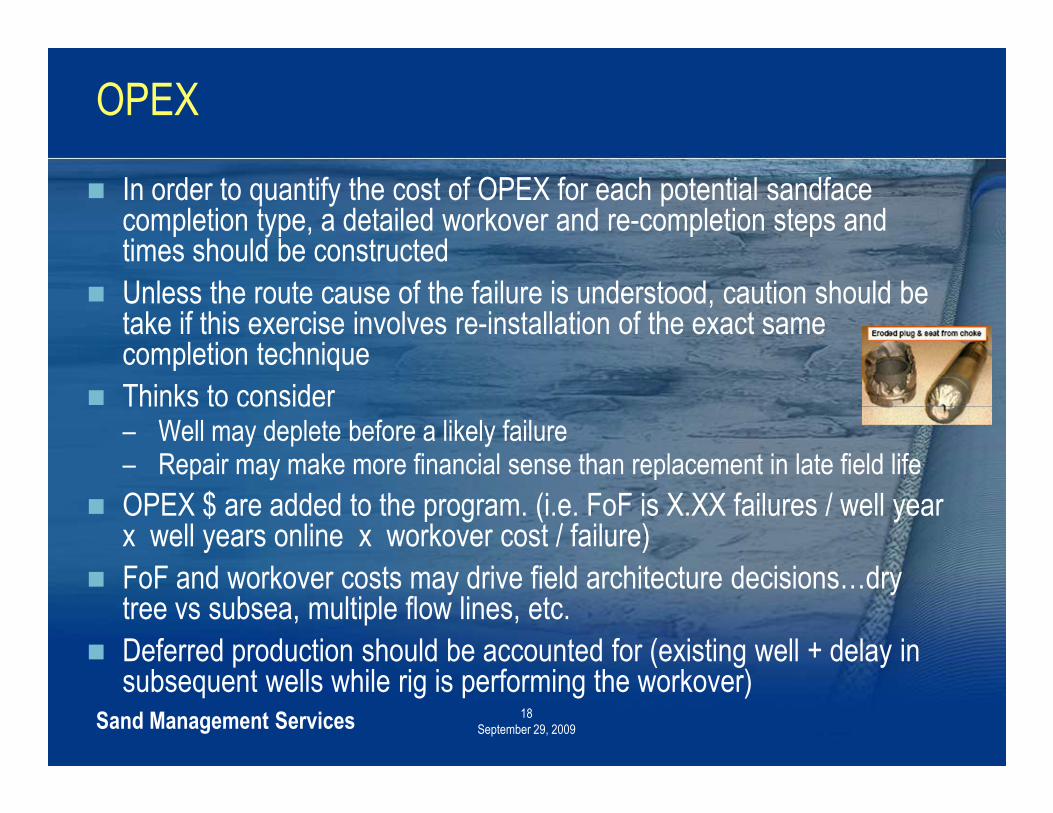
� In order to quantify the cost of OPEX for each potential sandface completion type, a detailed workover and re-completion steps and times should be constructed
� Unless the route cause of the failure is understood, caution should be take if this exercise involves re-installation of the exact same completion technique
� Thinks to consider
18September 29, 2009Sand Management Services
� Thinks to consider– Well may deplete before a likely failure– Repair may make more financial sense than replacement in late field life
� OPEX $ are added to the program. (i.e. FoF is X.XX failures / well year x well years online x workover cost / failure)
� FoF and workover costs may drive field architecture decisions…dry tree vs subsea, multiple flow lines, etc.
� Deferred production should be accounted for (existing well + delay in subsequent wells while rig is performing the workover)

Production
� Different sandface completion techniques and wellbore sizes yield different productions rates– Skin (completion efficiency)– Maximum drawdown
� A range of historical skins can be determined for the various completion techniques during the FEED– Examples Skins
19September 29, 2009Sand Management Services
– Examples Skins• OHGP (-3 to 5) depending on angle• CHGP (5 to 25+)• CHFP (-2 to 5)
� Nodal analysis can help quantify rate dependent skin
� Analysis should be conducted at initial choked, flowline pressure limited, and abandonment pressures

Production
� A production profile should be created for each sandface completion type, accounting for drilling and completion installation time, flow rate per well, most probable $/bbl or $/mscf, and production plateau.
20September 29, 2009Sand Management Services
plateau.
� NPV for the different sandface completion options with respect to production should be quantified* A alternative (simplified) analysis is to compare production “deltas” between competing sandface options by
converting to $M per skin point (i.e. every skin point = $3MM USD)
� Production differences between the various completion types may increase or decrease the well count, and will have an addition impact on Capex.

Recovery
� Different sandface completion techniques may have different effects on the ultimate recovery factor, which should be quantified
– Abandonment pressure or commercial abandonment rate (i.e. skin)
– Ability to reduce or isolate unwanted water / gas• Trajectory / Distance from water or gas
• Adaptable or applicable with Intelligent Completions or Inflow Control Devices
21September 29, 2009Sand Management Services
• Adaptable or applicable with Intelligent Completions or Inflow Control Devices
• Zonal Isolation Ability
– Ability to drain multiple geobodies• Example: Single 1000 meter OHGP vs 3 stacked fracpacks

Conclusions (Example – 8 well field)
CHGP CHFP ESS SAS OHGP (a/b)
C&P (no SC)
CAPEX (D&C)
-$130 MM -$190 MM -$110 MM -$100MM -$140 MM -$55 MM
OPEX -$50 MM -$10 MM -$120 MM -$150MM -$35 MM -$300 MM
Production +$650 MM +$980 MM +$850 MM +750MM +$950 MM +$900 MM
22September 29, 2009Sand Management Services
Production (including lost and deferred production)
+$650 MM +$980 MM +$850 MM +750MM +$950 MM +$900 MM
Recovery (Delta)
-$100 MM $0 MM $0 MM $0 MM $0 MM $-40 MM
Total NPV +$470 MM +$780 MM +$630 MM +$500MM +$775 MM +$465 MM
Uncertainty analysis should be conducted (i.e. Monty Carlo simulations) to determine the uncertainty range for each sandface type

Technology advancements
Examples
� Efficient Cased Hole Multi-Zone Fracpacks (MZ service tools or APS) –Benefits in production and reliability, with reduced APEX over conventional stacked
� Open hole zonal isolation packers (SAS, ESS, or GP)
23September 29, 2009Sand Management Services
� Open hole zonal isolation packers (SAS, ESS, or GP)
– Benefits in CAPEX and production over CH without sacrificing recovery
� Gravel pack compatible Inflow Control Devises (ICD)
– Increased recovery without reduced reliability
Thank you
24September 29, 2009Sand Management Services
Thank you