max pulse training · autonomic nervous system eccentric constriction ... plethysmography is a...
TRANSCRIPT
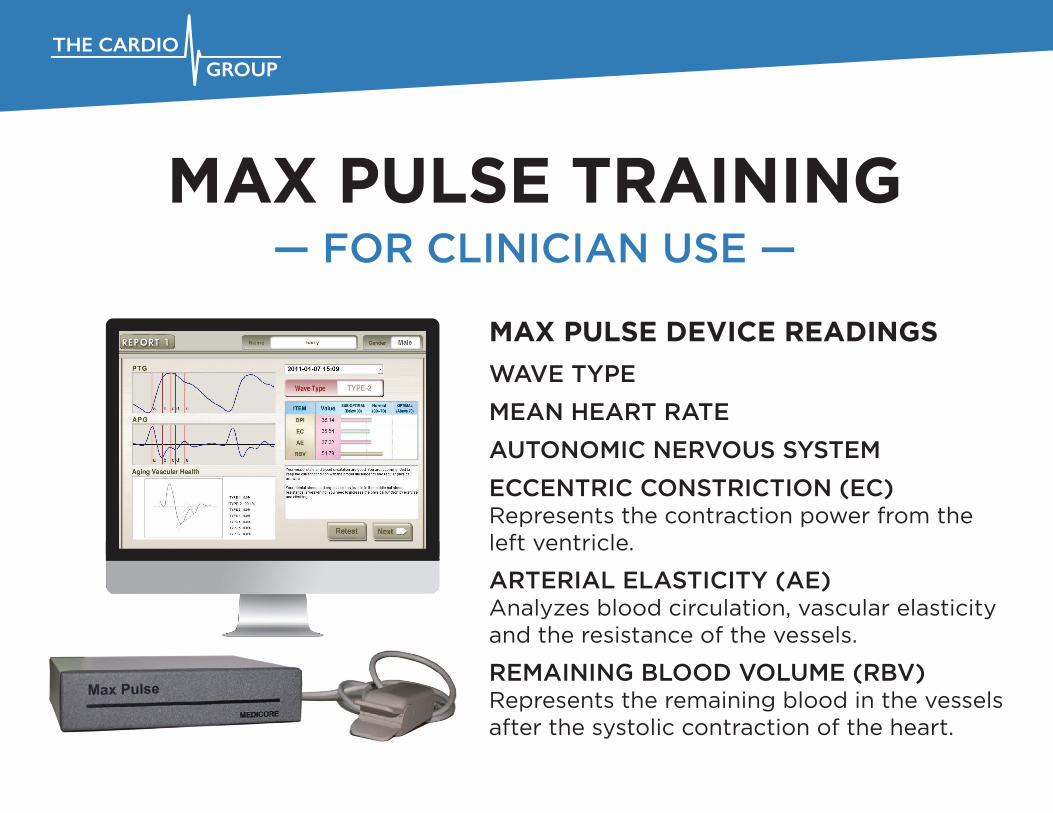
MAX PULSE TRAINING— FOR CLINICIAN USE —
MAX PULSE DEVICE READINGS
WAVE TYPE
MEAN HEART RATE
AUTONOMIC NERVOUS SYSTEM
ECCENTRIC CONSTRICTION (EC) Represents the contraction power from the left ventricle.
ARTERIAL ELASTICITY (AE)Analyzes blood circulation, vascular elasticity and the resistance of the vessels.
REMAINING BLOOD VOLUME (RBV) Represents the remaining blood in the vessels after the systolic contraction of the heart.
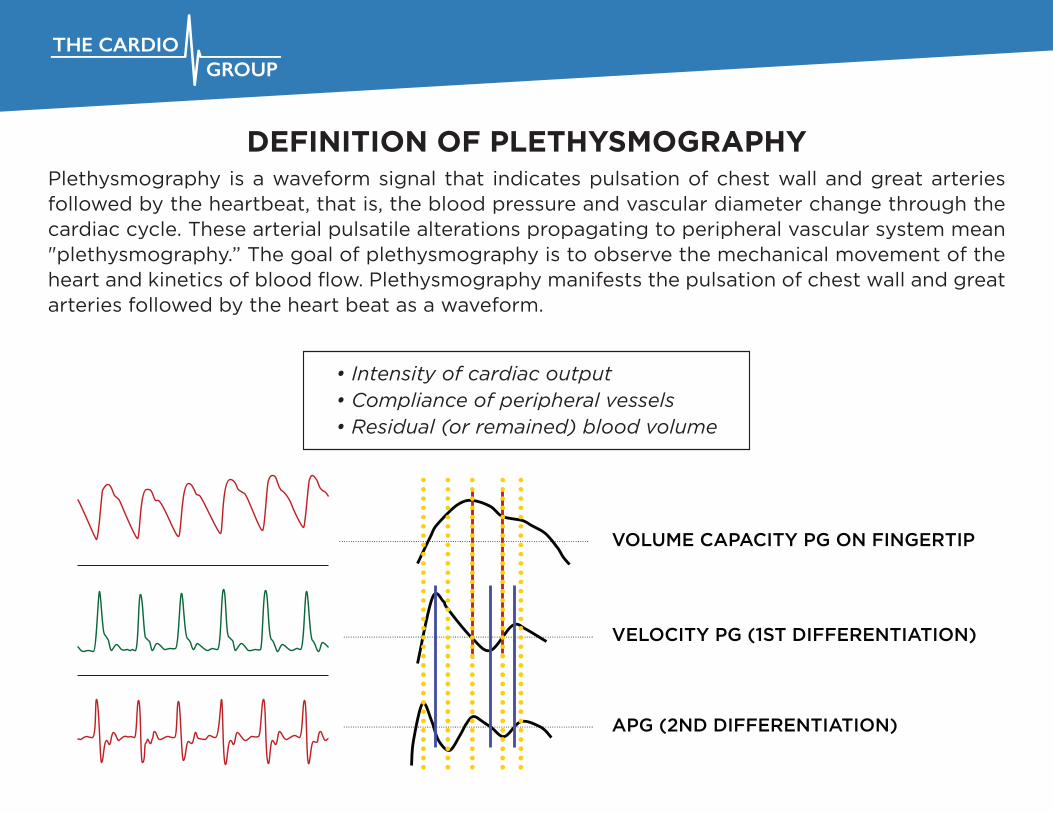
DEFINITION OF PLETHYSMOGRAPHYPlethysmography is a waveform signal that indicates pulsation of chest wall and great arteries followed by the heartbeat, that is, the blood pressure and vascular diameter change through the cardiac cycle. These arterial pulsatile alterations propagating to peripheral vascular system mean "plethysmography.” The goal of plethysmography is to observe the mechanical movement of the heart and kinetics of blood flow. Plethysmography manifests the pulsation of chest wall and great arteries followed by the heart beat as a waveform.
• Intensity of cardiac output• Compliance of peripheral vessels• Residual (or remained) blood volume

No ca�eine two hours prior to the test.No acrylic on the left index finger (nail polish or gel are okay). Patient should be sitting with the left palm flat on a surface between the heart and waist.For a more accurate scan, remove any environmental irritations such as excessive noises, vibrations, etc.The temperature of a room should be kept at a comfortable level. If room temperature is too hot, peripheral vascular dilatation may occur, and if the room temperature is too cold, muscle spasm may occur. Therefore, these alterations may cause a distortion of organic results.A patient may need a few minutes to rest before starting the test. Anxiousness, tension, and stress will a�ect the screen negatively. Everyone should be measured in resting state as the pulse-wave is a�ected by blood pressure, blood flow etc.Note: It is important to educate the patient before the assessment begins, not to intentionally control breathing. For a more accurate analysis, natural breathing without any conscious respiratory manipulation is greatly desired.Avoid conditions that may put excessive pressure on the left arm or finger-tip.Those screened should be advised not to close their eyes, fall asleep, move or talk during the screening.The patient should be advised not to intentionally control breathing – breath normally.
PATIENT SET UP PROCEDURE1.
2.
3.
4.
5.
6.
7.
8.
9.
10.

THE MAX PULSE DEVICE - MEASUREMENT SCREEN
2
3
4 5
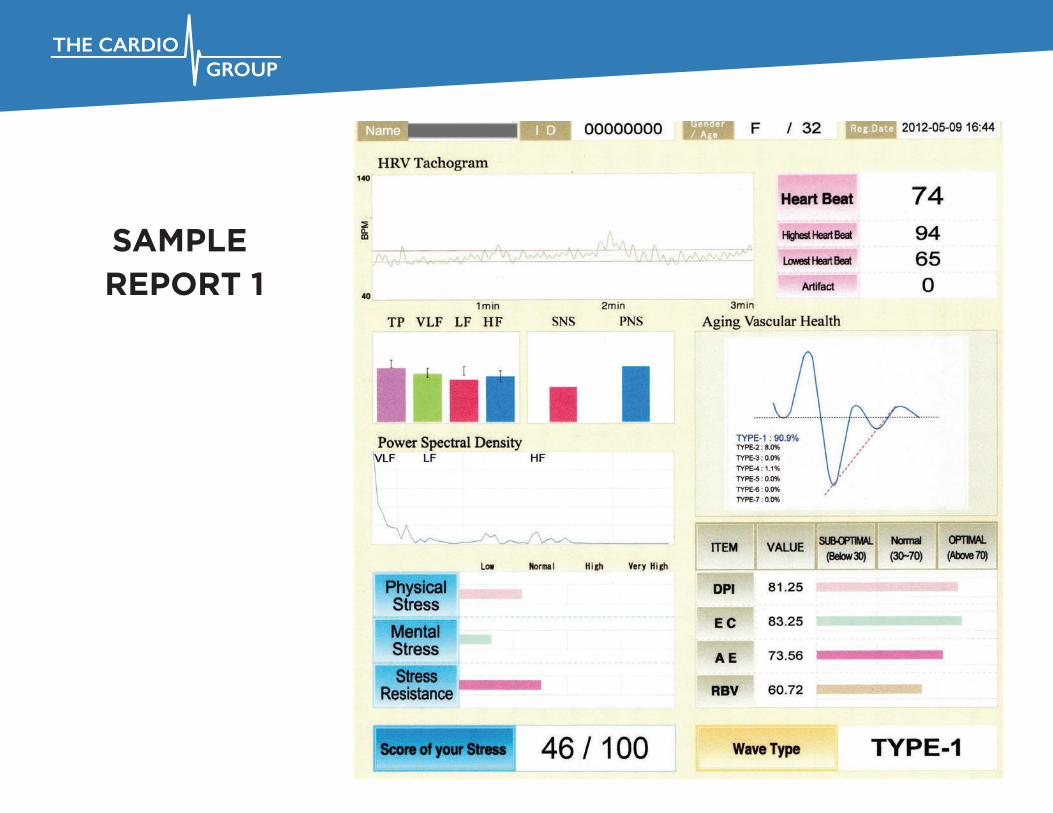
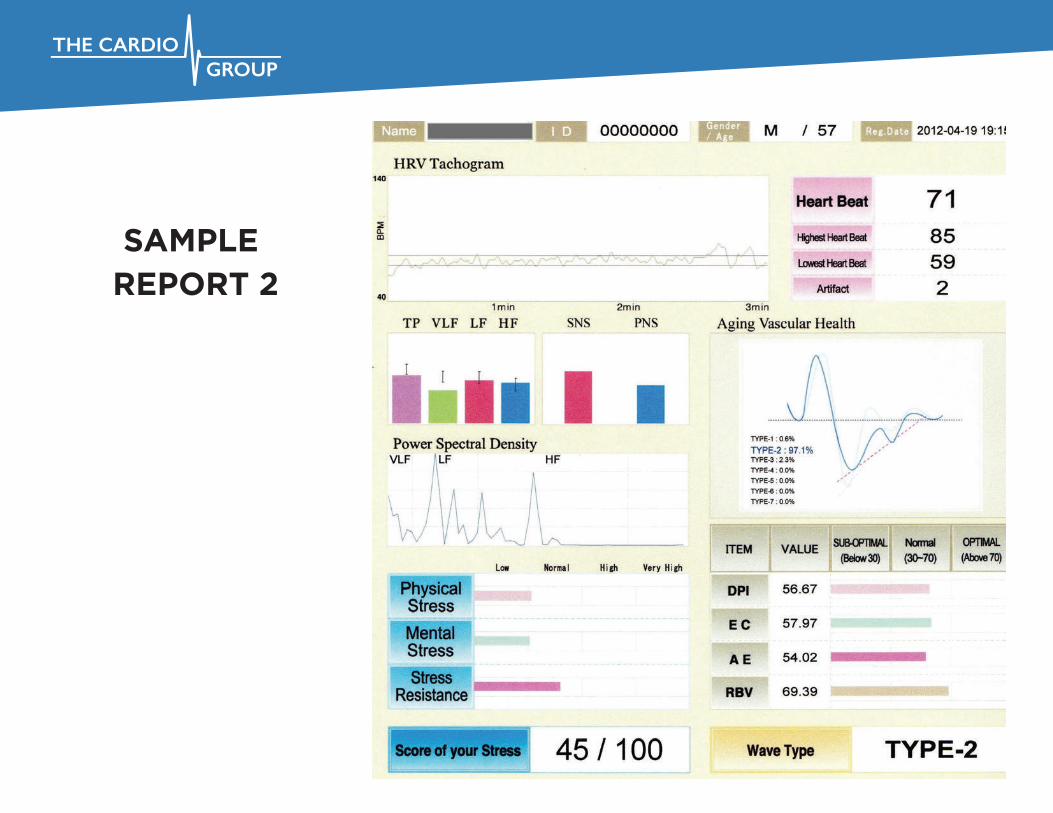
5. HR (Heart Rate) Variability: A graphical representation of time (yellow dots). The more the dots are dispersed and spread out in a group, the more adaptable the cardiovascular system. If the yellow dots are erratic, then the device has detected an artifact or irregular heart beat.
1
1. The Heart Rate or Beats per Minute is displayed using a graph and numerical value that will change during the course of the three minute test.
2. Plethysmograph (PTG): The “basic” wave form signal that indicates pulsation of chest wall and great arteries followed by the heart beat. This shows the device picking up the pulse wave from the patients heartbeat through the fingertip in real time.
3. Accelerated Plethysmograph (APG): The “final analysis” wave form. The APG measures the blood circulation state and aging level of blood vessels in regards to vascular elasticity and hardening, through the signal at the finger tip. APG uses the second derivative of the waveform of the digital photoplethysmograph to stabilize the baseline and to separate components of the waveform more clearly and distinctly.
4. HRV (Heart Rate Variability) Tachogram: A green linear record displaying the HRV information collected during a three minute period of time (indicated by the pink bar).

THE MAX PULSE DEVICE - REPORT 1 SCREEN
2
3
1. PTG (Plethysmograph) and APG (Accelerated Plethysmograph): This screen displays the three minute test “average” for the basic and finalized wave forms. Mathematical calculations are then derived from the multiple data points collected (i.e. points a, b, c, d & e) and are represented graphically.
3. Aging Vascular Health displays the average wave type, by percentage (the percentages may be spread out or 100% in a given wave type) collected by the Max Pulse during the three minute test. There are seven di�erent wave types, with Wave Type 1 considered the ideal wave type, regardless of the patients age.
The patient’s Wave Type will be displayed in dark blue. The ideal wave (Wave Type 1) will be displayed in light gray in the background. If a patient’s Wave Type is “1”, then their Wave Type (dark blue) will be on top of the gray line, so it will not be seen.
2. The current date and time of the test. The drop down menu may be used to review and compare past test results.
1
TYPE-1 : 0.0%TYPE-2 : 99.1%TYPE-3 : 0.0%TYPE-4 : 0.9%TYPE-5 : 0.0%TYPE-6 : 0.0%TYPE-7 : 0.0%
3

4
5
6
4. Displays the Wave Type that was most prevalent during the three minute test.
6. Summary of patient results.
5. This section statistically compares the patient to their peers (age and gender) and plots their data as sub-optimal, normal, or optimal. The information is graphically shown using bars and numerical values which can be compared to past or future results (see #4).
The definitions of the abbreviations, DPI, EC, AE, RBV, can also be found in the Max Pulse Patient Education Brochure and the Result Interpretation document.
THE MAX PULSE DEVICE - REPORT 1 SCREEN
DPI - Di�erential Pulse Wave Index: Represents the overall health of the cardiovascular system. DPI is the main indicator that represents aging vascular health.
EC - Eccentric Constriction: Represents the contraction power of vessels from the left ventricle.
AE - Arterial Elasticity: Analyzes the blood circulation, vascular elasticity and resistance of the vessels. It detects early cardiovascular disease like atherosclerosis and peripheral circulation dysfunction.
RBV - Remaining Blood Volume: The remaining blood volume in the vessels after systolic contraction on the heart. If the blood vessels are healthy, there is little remaining blood volume. If the vascular state improves, the remaining blood volume will decrease, but will show an increase on the point scale. Please note this inverse relationship.
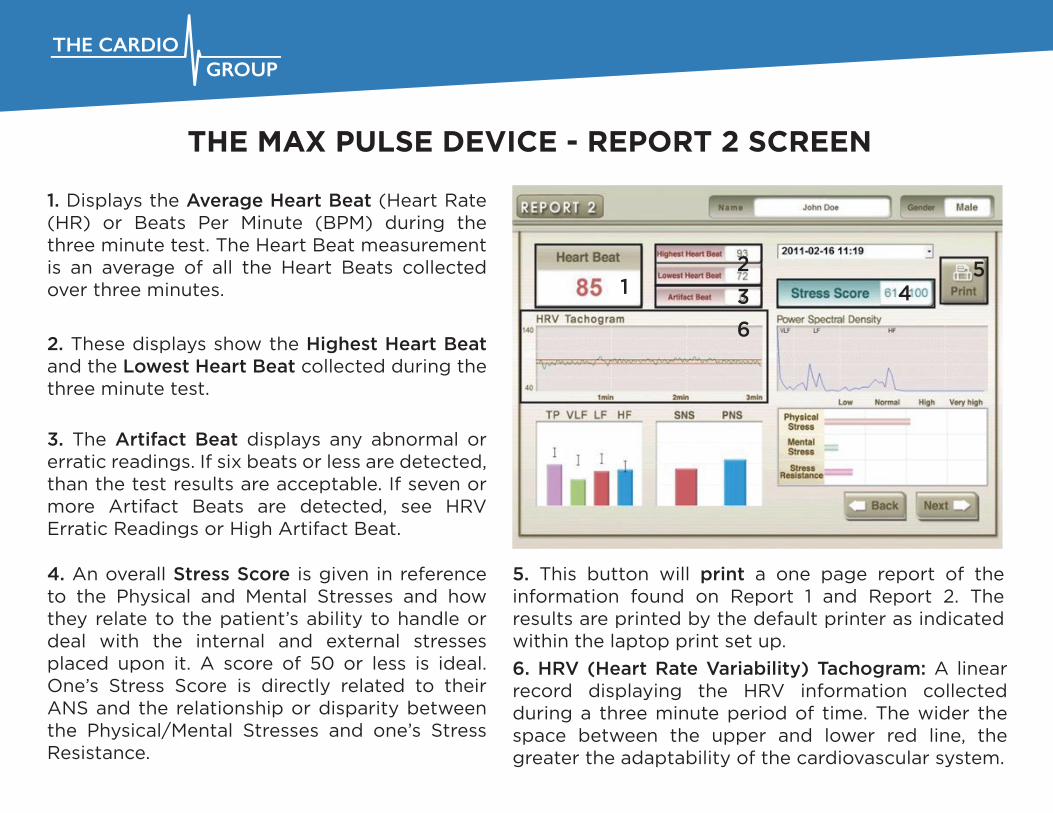
1. Displays the Average Heart Beat (Heart Rate (HR) or Beats Per Minute (BPM) during the three minute test. The Heart Beat measurement is an average of all the Heart Beats collected over three minutes.
2. These displays show the Highest Heart Beat and the Lowest Heart Beat collected during the three minute test.
3. The Artifact Beat displays any abnormal or erratic readings. If six beats or less are detected, than the test results are acceptable. If seven or more Artifact Beats are detected, see HRV Erratic Readings or High Artifact Beat.
4. An overall Stress Score is given in reference to the Physical and Mental Stresses and how they relate to the patient’s ability to handle or deal with the internal and external stresses placed upon it. A score of 50 or less is ideal. One’s Stress Score is directly related to their ANS and the relationship or disparity between the Physical/Mental Stresses and one’s Stress Resistance.
THE MAX PULSE DEVICE - REPORT 2 SCREEN
5. This button will print a one page report of the information found on Report 1 and Report 2. The results are printed by the default printer as indicated within the laptop print set up.
541
2
3
6. HRV (Heart Rate Variability) Tachogram: A linear record displaying the HRV information collected during a three minute period of time. The wider the space between the upper and lower red line, the greater the adaptability of the cardiovascular system.
6

10. A graphical representation of how the patient’s stress levels and resistance are on a statistical scale of ranges. The ideal position for the Physical and Mental Stress bars are as far to the left or “low” stress levels. The Stress Resistance considered ideal is as far to the right as possible or “High-Very High”. At a minimum, the Resistance is best at or more than the Physical or Mental Stresses. The Stress Resistance represents the patient’s ability to handle the internal and external stresses placed upon it.
THE MAX PULSE DEVICE - REPORT 2 SCREEN
7. Power Spectral Density displays a linear graph of the Autonomic Nervous System (ANS) frequencies collected: Very Low Frequency (VLF), Low Frequency (LF), and High Frequency (HF).
8. A graphical representation of the ANS frequencies and how they compare to the ideal frequency levels, which is the range between the top and bottom of the “I ” bar. Total Power (TP) is the combination of the VLF, LF, and HF.
9. A graphical representation of the ANS. The Sympathetic Nervous System (SNS) and the Parasympathetic Nervous System (PNS). The SNS is commonly referred to as “fight or flight” and the PNS is commonly referred to as “rest and repair.” The ANS is the regulatory branch of the central nervous system, that will help a patient adapt to changes in their environment. It adjusts or modifies some functions in response to stress. The ANS helps regulate blood vessel size, blood pressure and the heart’s electrical activity and ability to contract.
7
8 9 10
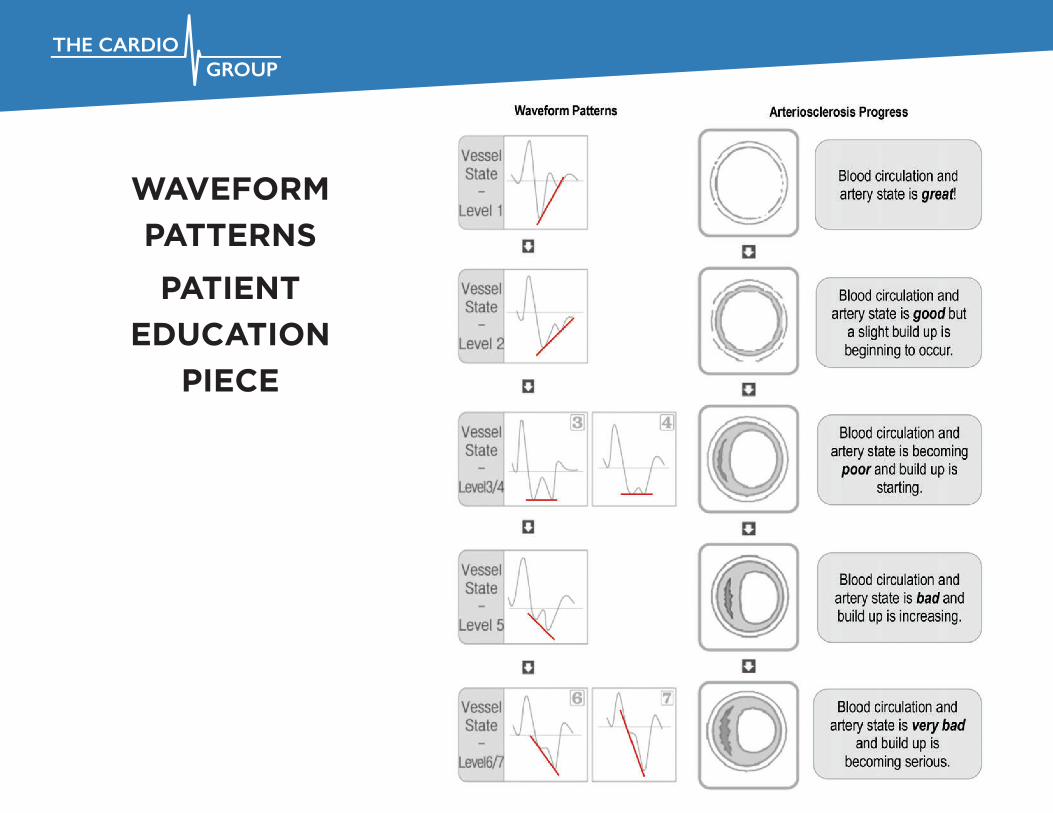
WAVEFORM
PATTERNS
PATIENT
EDUCATION
PIECE

REDUCTION OF TP REDUCTION OF VLF REDUCTION OF LF REDUCTION OF HF
- Decreased ANS function
- Lowered regulation competence
- Decreased ability to cope with the requirement of continuously changing environment
- Lessen the ability of body temperature regulation
- Hormone disorder
- Loss of energy
- Fatigue
- Insu�cient sleep
- Lethargy
- Chronic stress
- Aging
- Reduced electrical stability of heart
- Functional indigestion
TP VLF LF HF
HEALTHY UNHEALTHYTP VLF LF HF
FREQUENCY DOMAIN PATIENT EDUCATION PIECE

SAMPLE REPORT
AND
RESULTSINTERPRETATION
PATIENTEDUCATION
PIECE(NEXT PAGE)

MAX PULSE SAMPLE REPORTAUTONOMIC BALANCE & ACCELERATED PHOTOPLETHYSMOGRAPH
AGING VASCULAR HEALTH
POWER SPECTRAL DENSITY
VLF LF HF
SSN PNSTP VLF LF HF
MENTALSTRESS
STRESSRESISTANCE
LOW NORMAL HIGH VERY HIGH
PHYSICALSTRESS
Heart Beat
Highest Heart Beat
Lowest Heart Beat
Artifact
74
94
65
0
ITEM VALUESUB-OPTIMAL(BELOW 30)
NORMAL(30~70)
OPTIMAL(ABOVE 70)
DPI
EC
AE
RBV
81.25
83.25
73.56
60.72
TYPE 1 : 90.9%TYPE 2: 8.0%TYPE 3: 0.0%TYPE 4: 1.1%TYPE 5: 0.0%TYPE 6: 0.0%TYPE 7: 0.0%
HRV TACHOGRAM
140
BP
M
40
1 MIN 2 MIN 3 MIN
Gender/Age Reg. DateName IDJane Doe 12345678 F / 32 2012-05-09 16:44
YOUR STRESS SCORE 46 / 100 WAVE TYPE TYPE 1
Summary of patient results as well as doctor and clinician recommendations for improving a patients cardiovascular health.
HEART RATE VARIABILITY (HRV):
Measures the degree of fluctuation in the length of intervals between heart beats. For healthy people, HRV a fluctuation in heart rates, while unhealthy people have a simple and consistent heart rate.
HRV measures the adaptability of the cardiovascular system and autonomic nervous system, which is composed of the sympathetic nervous system (SNS) and parasympathetic nervous system (PNS). Your SNS plays the role of the accelerator, also known as flight or fight. Your PNS functions as the brake, also known as rest and repair. A healthy person has a balanced autonomic nervous system.
TP VLF LF HF
HEALTHY UNHEALTHYTP VLF LF HF
FREQUENCY DOMAIN ANALYSIS:
Reduction of TP: Decreased ANS function, decrease in regulatory competence and a decrease in the ability to cope with environmental change.
Reduction of VLF: Decrease in the bodies ability to regulate body temperature and hormone levels.
Reduction of LF: Loss of energy, fatigue, insu�cient sleep and lethargy.
Reduction of HF: Chronic stress, aging, reduced electrical stability of the heart.
TP: Total Power, combination of the 3 frequenciesVLF: Very Low FrequencyLF: Low FrequencyHF: High Frequency
DPI - Di�erential Pulse Wave Index: Represents the overall health of the cardiovascular system. DPI is the main indicator that represents the aging of arteries.
EC - Eccentric Constriction: Represents the contraction power of vessels from the left ventricle.
AE - Arterial Elasticity: Analyzes the blood circulation, the vascular elasticity and resistance of the vessels. It detects early cardiovascular disease like atherosclerosis and peripheral circulation dysfunction.
RBV - Remaining Blood Volume: The remaining blood volume in the vessels after systolic contraction on the heart. If the blood vessels are healthy, there is little remaining blood volume. If the vascular state improves, the remaining blood volume will decrease.
WAVEFORM PATTERNS & WHAT THEY MEAN FOR YOU:
ARTERIOSCLEROSISArteriosclerosis occurs when the blood vessels that carry oxygen and nutrients from your heart to the rest of your body (arteries) become thick and sti� — sometimes restricting blood flow to your organs and tissues. Healthy arteries are flexible and elastic, but over time, the walls of your arteries can harden.
LEVEL 1
Blood circulation and artery state is great!
Blood circulation and artery state is good but a slight build up is beginning to occur.
LEVEL 2
Blood circulation and artery state is becoming poor and build up is starting.
LEVEL 3 & 4
Blood circulation and artery state is bad and build up is increasing.
LEVEL 5
Blood circulation and artery state is very bad and build up is becoming serious.
LEVEL 6 & 7

Arterial Elasticity (AE): Represents the blood circulation, vascular elasticity and resistance of the vessels. It detects early cardiovascular disease like atherosclerosis and peripheral circulation dysfunction.
Remaining Blood Volume (RBV): It is the remaining blood volume in the vessels after systolic contraction on the heart. If the blood vessels are healthy, there is little remaining blood volume. If the vascular state is better, the remaining blood volume will be lower. But, if the aging degree is in progress, EC will be weakened and RBV will remain high. It is an important indication of classifying the wave type.
VASCULAR AGING PROCESS KEY DATA POINTS AND TERMS
Di�erential Pulsewave Index (DPI):Represents the overall health of the cardiovascular system. DPI is the main indicator that represents the vascular aging process. A lower value represents an increase in vascular aging and vise versa.
Eccentric Constriction (EC): Represents the contraction power of vessels from the left ventricle. If cardiac output is higher, the vascular state is good and the resultant value should be greater in value.

HRV AND AUTONOMIC NERVOUS SYSTEM (ANS)KEY DATA POINTS AND TERMS
Heart Rate Variability (HRV): HRV is the degree of fluctuation in the length of intervals between heart beats. They are named R - R intervals and are measured in millisecond (ms). R-R intervals are obtained from an ECG or plethysmogram. HRV measures the overall health status and autonomic nervous system tone and balance.
Autonomic Nervous System (ANS): The autonomic nervous system is responsible for non-voluntary control of our internal organs and systems like the heart, lungs, intestines, glands, etc. ANS has its central and peripheral components accessing all internal organs. There are two branches:
- Sympathetic: The sympathetic branch activates the glands and organs that defend the body against attack. It is commonly called the ‘fight-or-flight’ system. Its nerves direct more blood to the muscles and the brain. When activated, heart rate and blood pressure increase and blood flow to the digestive and eliminative organs decreases. For many organs increased stimulation of the sympathetic nervous system causes increase in their function, e.g. rising HR, increased heart stroke volume, adrenal secretion, etc. These specific e�ects serve our body as a very e�ective mechanism of survival by engaging in stress (“fight or flight”).
- Parasympathetic (Vagal): It is anabolic, or concerned with rebuilding the body. Its nerves stimulate digestion, as well as the immune system and eliminative organs. The feeling often associated with the parasympathetic state can be one of lethargy or fatigue. This indicates a state of repair and rebuilding in progress. Increased stimulation of the parasympathetic nervous system lowers HR, decreases stroke volume, adrenal secretions, etc. These specific e�ects serve our body as a very e�ective mechanism of survival by engaging in relaxation (“rest and repair”) response.

FREQUENCY DOMAIN ANALYSIS
Very Low Frequency (VLF): Very Low Frequency is a band of power spectrum range between 0.0033 and 0.04 Hz. Generally this frequency range indicates overall activity of various slow mechanisms of sympathetic function. Very Low Frequency band is calculated in milliseconds squared (ms2). With longer time recordings it is considered to represent sympathetic tone as well as slower hormonal and thermoregulatory e�ects. There are some findings indicating that in shorter recordings VLF has fair representation of various mental stress factors (negative emotions, worries, rumination etc.)
Low Frequency (LF): Low Frequency is a band of power spectrum range between 0.04 and 0.15 Hz. This measure reflects both sympathetic and parasympathetic activity. Generally it is a strong indicator of sympathetic activity. Parasympathetic influence is represented by LF when respiration rate is lower than 7 breaths per minute or when taking a deep breath. Thus, when subject is in the state of relaxation with a slow and even breathing, the LF values can be very high indicating increased parasympathetic activity rather than an increase in sympathetic regulation. Low Frequency band is calculated in milliseconds squared (ms2). LF shows the activity of sympathetic nerve and parasympathetic nerve at the same time, but it mostly indicates the sympathetic nerve system.
The frequency-domain graph shows how much of the signal lies within each given frequency band over a range of frequencies. The Max Pulse analyzes specific domain ranges associated with HRV and ANS function:
High Frequency (HF) at 0.15 to 0.4 Hz
Low Frequency (LF) at 0.04 to 0.15 Hz
Very Low Frequency at 0.0033 and 0.04 Hz
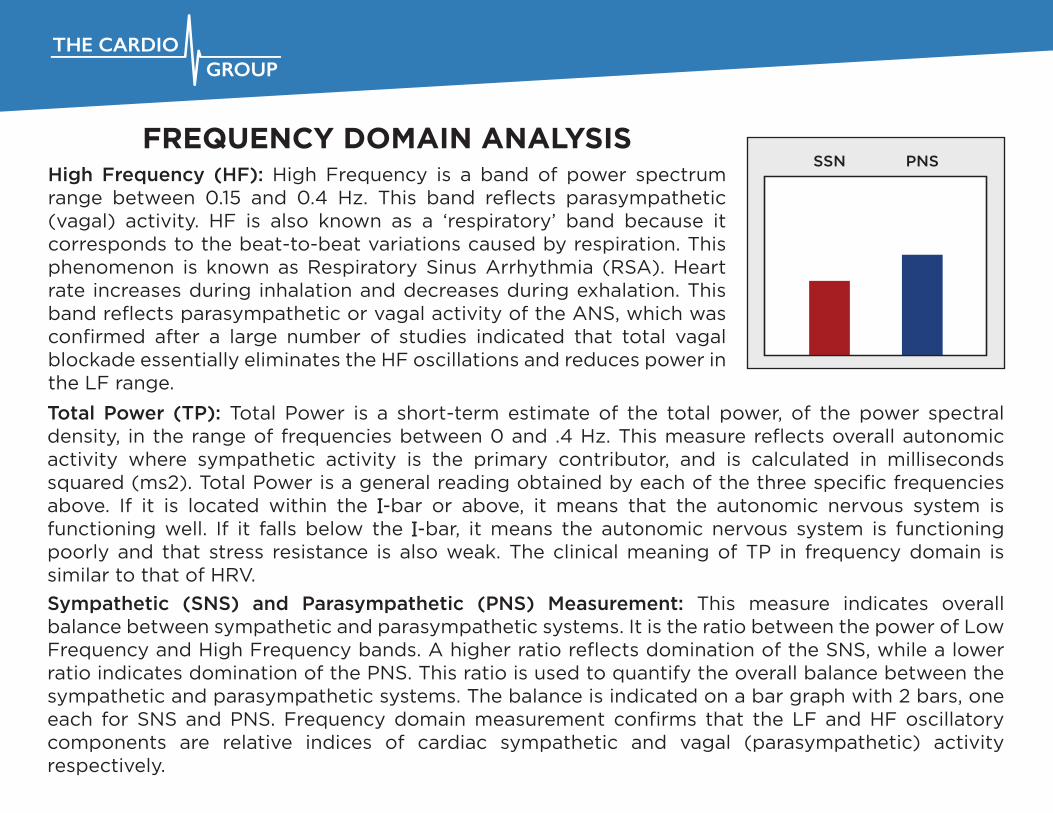
Total Power (TP): Total Power is a short-term estimate of the total power, of the power spectral density, in the range of frequencies between 0 and .4 Hz. This measure reflects overall autonomic activity where sympathetic activity is the primary contributor, and is calculated in milliseconds squared (ms2). Total Power is a general reading obtained by each of the three specific frequencies above. If it is located within the I-bar or above, it means that the autonomic nervous system is functioning well. If it falls below the I-bar, it means the autonomic nervous system is functioning poorly and that stress resistance is also weak. The clinical meaning of TP in frequency domain is similar to that of HRV.
Sympathetic (SNS) and Parasympathetic (PNS) Measurement: This measure indicates overall balance between sympathetic and parasympathetic systems. It is the ratio between the power of Low Frequency and High Frequency bands. A higher ratio reflects domination of the SNS, while a lower ratio indicates domination of the PNS. This ratio is used to quantify the overall balance between the sympathetic and parasympathetic systems. The balance is indicated on a bar graph with 2 bars, one each for SNS and PNS. Frequency domain measurement confirms that the LF and HF oscillatory components are relative indices of cardiac sympathetic and vagal (parasympathetic) activity respectively.
FREQUENCY DOMAIN ANALYSISHigh Frequency (HF): High Frequency is a band of power spectrum range between 0.15 and 0.4 Hz. This band reflects parasympathetic (vagal) activity. HF is also known as a ‘respiratory’ band because it corresponds to the beat-to-beat variations caused by respiration. This phenomenon is known as Respiratory Sinus Arrhythmia (RSA). Heart rate increases during inhalation and decreases during exhalation. This band reflects parasympathetic or vagal activity of the ANS, which was confirmed after a large number of studies indicated that total vagal blockade essentially eliminates the HF oscillations and reduces power in the LF range.
SAMPLE REPORT 1
SAMPLE REPORT 2

SAMPLE REPORT 3