maths skills - distance learning courses and adult … maths skills ebook was written by sally...
TRANSCRIPT
Maths SkillsClick on the and buttons at the bottom of each page to view the nextpage or the previous page in this ebook. Click on links within the text to go tothe page being referred to, then click on the button to retrace your steps.Click on the to view the ebook in full screen mode or to return to normalmode.
Further instructions on using the ebook and information about its purpose aregiven in the Introduction which is on the next page.
This Maths Skills ebook was written by Sally Jordan, based in part on materialsdeveloped for the Open University module Discovering Science (S103). Theproduction of this resource was supported by the Physics Innovations Centre forExcellence in Teaching and Learning.
Version 2.2March 1, 2012
1

Introduction
This ebook has been provided to remind you of some mathematical skills whichare assumed by the module that you are studying. We assume that you can add,subtract, multiply and divide whole numbers, and where advanced mathematicalskills are required, they will be taught within your module.
You are advised to skim-read the material in this ebook, so that you are aware ofthe ways in which it might help you. Then, when you come across a mathematicalconcept in your module resources that you are uncertain about, you can refer backto this ebook, using the list of contents (accessed by clicking on the buttonat the bottom of the page) or the index ( ) to help you find the relevant section.
When working though a section of this ebook, it is particularly important that youtry the questions as you go along. You may find it helpful to have some paper anda pen or pencil by your side as you as you work through the ebook, to help youin working out the answers to the questions. The answers (with working) can beaccessed by clicking on the ‘Answer’ link to the right of each question. To returnto the question, either click on the question number within the answer, or use the“back” button ( ) at the bottom of the page. However, please do have a go atthe questions yourself before looking at the answers. Practising is the best way tolearn new mathematical skills.
2
Using your scientific calculator
You will need to use a scientific calculator in your module. Unfortunately, dif-ferent calculators operate in slightly different ways, so this ebook cannot providecomprehensive instructions on how to use your calculator. However, at key pointswhere you need to be able to use your calculator for a specific purpose, we haveprovided some guidelines as to the most likely buttons to use. These guidelines,combined with the manufacturer’s operating instructions, should enable you touse your calculator effectively, and you should check that you can do this whenadvised to do so. In addition, in Section 15, we explain how four specific calcu-lators (including the Windows calculator which is likely to be installed on yourcomputer) can be used for several specific calculations. Hopefully these exam-ples will help you to see how to use your calculator effectively, for these andother questions you encounter.
If you find that you are not able to use your calculator to get the result given in thisbooklet or other module resources, you should contact your tutor or study adviseras soon as possible.
3
Contents
Introduction 2
1 Doing calculations, with or without a calculator 71.1 Doing calculations in the right order . . . . . . . . . . . . . . . . . 91.2 What about powers? . . . . . . . . . . . . . . . . . . . . . . . . . . 101.3 The role of brackets . . . . . . . . . . . . . . . . . . . . . . . . . . 121.4 BEDMAS . . . . . . . . . . . . . . . . . . . . . . . . . . . . . . . 141.5 Alternative ways of writing calculations . . . . . . . . . . . . . . . 161.6 Checking your answer . . . . . . . . . . . . . . . . . . . . . . . . . 18
2 Negative numbers 192.1 Calculating with negative numbers . . . . . . . . . . . . . . . . . . 22
3 Fractions, ratios and percentages 253.1 Fractions . . . . . . . . . . . . . . . . . . . . . . . . . . . . . . . . 253.2 Ratios . . . . . . . . . . . . . . . . . . . . . . . . . . . . . . . . . 303.3 Percentages . . . . . . . . . . . . . . . . . . . . . . . . . . . . . . 323.4 Calculating fractions and percentages of numbers . . . . . . . . . . 353.5 Doing calculations with fractions . . . . . . . . . . . . . . . . . . . 37
3.5.1 Adding and subtracting fractions . . . . . . . . . . . . . . . . . 373.5.2 Multiplying fractions . . . . . . . . . . . . . . . . . . . . . . . 393.5.3 Dividing fractions . . . . . . . . . . . . . . . . . . . . . . . . . 40
4

4 Decimal numbers and decimal places 424.1 Decimal places and rounding . . . . . . . . . . . . . . . . . . . . . 49
5 Units of measurement 515.1 Units in calculations . . . . . . . . . . . . . . . . . . . . . . . . . . 57
6 Measuring areas and volumes 596.1 Area . . . . . . . . . . . . . . . . . . . . . . . . . . . . . . . . . . 596.2 Volume . . . . . . . . . . . . . . . . . . . . . . . . . . . . . . . . 65
7 Scientific notation 707.1 Going up: powers of ten for large numbers . . . . . . . . . . . . . . 707.2 Going down: powers of ten for small numbers . . . . . . . . . . . . 757.3 Using a calculator for scientific notation . . . . . . . . . . . . . . . 80
8 More about powers and units 828.1 Using positive and negative powers with units . . . . . . . . . . . . 828.2 Prefixes used with SI units . . . . . . . . . . . . . . . . . . . . . . 85
9 Significant figures 869.1 Significant figures in calculations . . . . . . . . . . . . . . . . . . . 89
5

10 Reading data from tables 90
11 Representing data: pie charts, bar charts and histograms 9311.1 Pie charts . . . . . . . . . . . . . . . . . . . . . . . . . . . . . . . 9311.2 Bar charts . . . . . . . . . . . . . . . . . . . . . . . . . . . . . . . 9711.3 Histograms . . . . . . . . . . . . . . . . . . . . . . . . . . . . . . 98
12 Representing data: graphs 9912.1 Reading information from a graph . . . . . . . . . . . . . . . . . . 10012.2 The gradient of a graph . . . . . . . . . . . . . . . . . . . . . . . . 10712.3 Plotting a graph . . . . . . . . . . . . . . . . . . . . . . . . . . . . 111
13 Equations and Symbols 121
14 Tips for tackling mathematical questions 12814.1 Getting started . . . . . . . . . . . . . . . . . . . . . . . . . . . . . 12814.2 Doing the calculation . . . . . . . . . . . . . . . . . . . . . . . . . 13014.3 Taking care with units . . . . . . . . . . . . . . . . . . . . . . . . . 13014.4 Does your answer make sense? . . . . . . . . . . . . . . . . . . . . 13114.5 Writing maths . . . . . . . . . . . . . . . . . . . . . . . . . . . . . 131
15 Using your scientific calculator 133
Index 303
6

Doing calculations, with or withouta calculator 1Most science modules assume that you can add, subtract, multiply and dividewhole numbers.
QuestionCheck that you can do this by carrying out the following four calculationswithout using a calculator: 9 + 3; 9 − 3; 9 × 3; 9 ÷ 3.
AnswerYou should have obtained the following answers:9 + 3 = 12; 9 − 3 = 6; 9 × 3 = 27; 9 ÷ 3 = 3.
Now check that you can use your calculator to obtain the same answers as before.You are likely to need to enter the numbers and symbols in a simple sequencefrom left to right (e.g. ‘9’ then ‘+’ then ‘3’) and then to press the ‘=’ key. How-ever, some calculators use the symbol ‘∗’ instead of ‘×’ for multiplication and ‘/’instead of ‘÷’ for division, and at least one model requires users to press ‘Enter’instead of ‘=’ in order to obtain the answer. Check your calculator now!
7

Most scientific calculations are rather more complicated than those discussedabove, in that they involve several steps. In some of these calculations, for ex-ample:
9 + 3 + 5 + 2,3 + 4 − 2,5 × 2 × 7,6 × 2 ÷ 3,
you simply need to start at the left and work through to the right. So in the firstexample, adding 9 and 3 gives 12, adding another 5 gives 17 and adding another2 gives the final answer of 19.
QuestionCheck that you can do the following three calculations both without and witha calculator: 3 + 4 − 2; 5 × 2 × 7; 6 × 2 ÷ 3.
AnswerYou should have obtained the following answers:3 + 4 − 2 = 5; 5 × 2 × 7 = 70; 6 × 2 ÷ 3 = 4.
8

Question 1.1
Use your calculator to find the following:
(a) 283 + 729 Answer
(b) 38 + 92 − 61 Answer
(c) 761 × 13 Answer
(d) 94 ÷ 47 Answer
(e) 24 × 32 × 8 Answer
(f) 24 × 32 ÷ 8 Answer
1.1 Doing calculations in the right order
Consider now the calculation 3 + 2 × 4. If you simply work from left to right inthis case, adding 3 and 2 gives 5, then multiplying by 4 gives 20, but this is theincorrect answer.
There is a rule, applied by mathematicians and scientists everywhere, which statesthat:
multiplication and division should be carried out before addition and subtrac-tion.
9

Applying this rule to the calculation 3 + 2 × 4, the multiplication of 2 and 4should be done first, giving 8, then the 3 is added to give the correct final answerof 11. Most modern calculators ‘know’ this rule (which is known as a rule ofprecedence, where precedence means ‘priority’), so entering 3 + 2 × 4 into yourcalculator in exactly the order in which it is written should give the correct answerof 11. Check this on your calculator now.
Question 1.2
Do the following calculations without using your calculator. Use your calcu-lator to check the answers.
(a) 3 × 4 + 2 Answer
(b) 2 + 4 × 3 Answer
(c) 35 ÷ 5 + 2 Answer
(d) 4 × 2 − 21 ÷ 7 Answer
1.2 What about powers?
Most people are familiar with the fact that 5 × 5 can also be written as 52 (said as‘five squared’) and 4 × 4 × 4 as 43 (said as ‘four cubed’). This shorthand notationcan be extended indefinitely, so 2 × 2 × 2 × 2 × 2 × 2 becomes 26 (said as ‘two tothe power of six’, or more usually just as ‘two to the six’). In this example, the2 is called the base number and the superscript 6 (indicating the number of twos
10

that have been multiplied together) is variously called the power, the exponent, orthe index (plural indices).
QuestionUse your calculator’s instruction booklet to find out how to enter a base num-ber raised to a power, such as 26.
AnswerYou may have a button labelled ‘xy’, in which case you should press ‘2’ then‘xy’ then ‘6’. Alternatively you may have a button labelled ‘^’ in which caseyou should press ‘2’ then ‘^’ then ‘6’.
(Note that 26 = 64; your calculator may calculate this value straight away.)
If you are asked to calculate, say, 5×32, another rule of precedence tells you that:
powers should be calculated before multiplication, division, addition or sub-traction.
So, in the example of 5 × 32, the 32 should be evaluated (worked out) first.
32 = 3 × 3 = 9, so 5 × 32 = 5 × 9 = 45.
11
Question 1.3
Do the following calculations without using your calculator. Use your calcu-lator to check the answers.
(a) 33 Answer
(b) 3 × 52 Answer
(c) 23 × 32 Answer
(d) 32 + 42 Answer
1.3 The role of brackets
Sometimes, you need to do the addition or subtraction in a calculation beforethe multiplication, or to add two numbers together before raising to a power. Theway to over-ride the standard rules of ‘multiplication before addition’ and ‘powersbefore multiplication’, etc., is to use brackets:
brackets in a calculation mean ‘do this first’.
So, in the calculation (3 + 2) × 4, you should add the 3 and the 2 first (to give 5),then multiply by 4, i.e. (3 + 2) × 4 = 5 × 4 = 20. Similarly, in the calculation(3+4)2, you should add the 3 and the 4 first before squaring. So (3+4)2 = 72 = 49.
12
You can do calculations including brackets on a scientific calculator by makinguse of its brackets keys, usually labelled as ‘(‘and ‘)’. Try the calculation (3+2)×4on your calculator now.
If you have a calculation which involves nested brackets, work out the innermostsets first. For example:
20 ÷ { (3 − 1) × (3 + 2) } = 20 ÷ {2 × 5} = 20 ÷ 10 = 2
Note that using different symbols for the brackets, for example ( ), { } and [ ],makes the calculation clearer than using the same symbol throughout the calcula-tion.
Strictly speaking, brackets are only needed to override the other rules of prece-dence, and they are not needed in calculations such as 3+(2×4). In the absence ofthe brackets, you or your calculator would follow the rule and do the multiplica-tion first in any case. However, brackets are often used in calculations for clarity,even when they are not strictly necessary. For example, the calculation 6×4+12×5is more understandable and ‘readable’ if it is written as (6 × 4) + (12 × 5), eventhough the brackets are not essential here. You are encouraged to write brackets inyour calculations whenever they help you to express your working more clearly.
13

1.4 BEDMAS
Fortunately, there is an easy way to remember the correct order in which arith-metic operations should be carried out. The rules are neatly summed up in themnemonic BEDMAS. The letters in BEDMAS stand for Brackets, Exponents,Division, Multiplication, Addition and Subtraction, and the order of the lettersgives the order in which the operations should be carried out. In other words, youshould work out the brackets first, then the exponents (otherwise known as in-dices or powers), then any divisions and multiplications, and finally the additionsand subtractions. You may see BIDMAS (where the ‘I’ stands for ‘Indices’) orBODMAS written instead of BEDMAS; the three expressions are equivalent.
There is one final point to make about the order in which arithmetic should bedone. When faced with a calculation that includes a series of multiplications anddivisions (or a series of additions and subtractions), then you should work throughthe calculation from left to right in the order in which it is written.
14
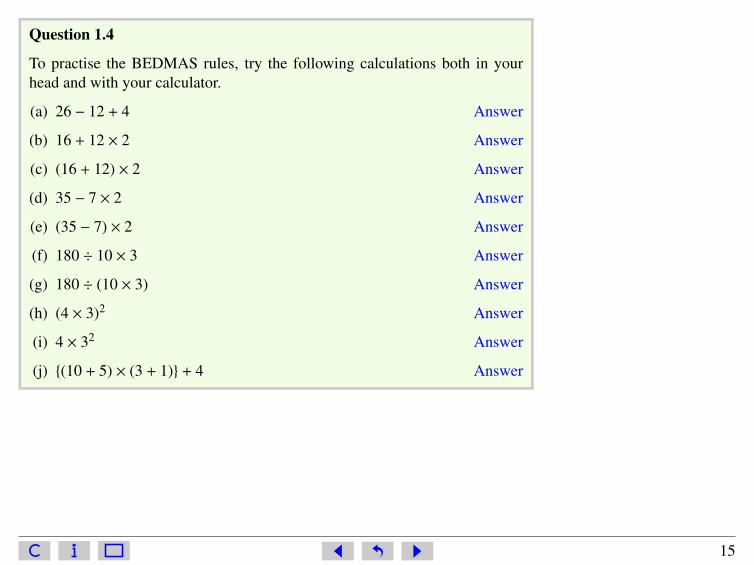
Question 1.4
To practise the BEDMAS rules, try the following calculations both in yourhead and with your calculator.
(a) 26 − 12 + 4 Answer
(b) 16 + 12 × 2 Answer
(c) (16 + 12) × 2 Answer
(d) 35 − 7 × 2 Answer
(e) (35 − 7) × 2 Answer
(f) 180 ÷ 10 × 3 Answer
(g) 180 ÷ (10 × 3) Answer
(h) (4 × 3)2 Answer
(i) 4 × 32 Answer
(j) {(10 + 5) × (3 + 1)} + 4 Answer
15
1.5 Alternative ways of writing calculations
So far in this booklet, the four arithmetic operations have been written as +, −, ×and ÷. However, in scientific calculations, division is more usually written as afraction (see Section 3.1 for more about fractions). Twelve divided by three could
equally accurately be written as 12 ÷ 3, 12/3 or123
.
Or, to give a slightly more complicated example, (8 + 4) ÷ 3 could equally accu-
rately be written as (8 + 4)/3 or as8 + 4
3.
Note that the bracket, used to indicate that the addition should be done before thedivision in this case, has been omitted from the final statement of this expression.This is because the horizontal line used to indicate division acts as an ‘invisiblebracket’, i.e.
8 + 43
=(8 + 4)
3=
123
= 4.
Other mathematical symbols can act as ‘invisible brackets’. The most commonlyused one is the square root sign
√. Finding the square root of a number is the
opposite of finding the square. So, since 32 (said as ‘three squared’) is 9,√
9(said as ‘the square root of 9’) is 3 (strictly, the square root of 9 could also be thenegative number -3, but this booklet will only consider positive square roots). Ifyou are asked to calculate
√9 + 7, the fact that the upper line of the square root
sign extends to include the whole of the addition means that the addition shouldbe done first, i.e.
√9 + 7 =
√(9 + 7) =
√16 = 4. Note that this is rather different
16

from√
9 + 7, in which the square root sign only extends over the 9, so√
9 + 7 = 3 + 7 = 10
Provided the meaning is clear without it, the multiplication sign × is also some-times omitted from calculations. So 2 × (3 + 4) could be written as 2(3 + 4) and(10 + 5) × (3 + 1) could be written as (10 + 5)(3 + 1).
Question 1.5
Evaluate the following, with or without your calculator:
(a)18 + 6
3Answer
(b)183
+ 6 Answer
(c) 20/4 + 6 Answer
(d) 20/(4 + 6) Answer
(e)√
16 + 9 Answer
(f)√
16 +√
9 Answer
(g) 3(8 − 3) Answer
(h) (8 − 4)(3 + 5) Answer
Note that the instruction to ‘evaluate’ simply means ‘calculate the value of’.
17
1.6 Checking your answer
Unfortunately, it is possible to get the wrong answer when using a calculator. Thisis not an indication of the unreliability of modern electronic technology; it’s anindication that a calculator is only as good as the fingers that press the keys! It iseasy to press the wrong key, or to press keys in the wrong order, and hence to endup with a meaningless answer. It is therefore good practice to check the numbersthat appear in the display as you key them in, and to repeat a calculation if theanswer seems suspicious.
This begs the question of how you know if the answer looks suspicious. Thereare a few simple things to look out for: when adding positive numbers, the an-swer should be bigger than the largest of the numbers you are adding; and whensubtracting one positive number from another the answer should be smaller thanthe larger of the two numbers. When you multiply two positive numbers, eachlarger than 1, the result should be larger than either of the numbers, and dividingone positive number by another that is larger than 1 should produce a result thatis less than the first number.
In addition, it is good practice to estimate the answer to a question using simplernumbers. For example, you could estimate the answer to 96 ÷ 47 by working out(in your head) 100 ÷ 50, which is 2. You would expect the answer to 96 ÷ 47 tobe fairly close to the estimated answer.
18
Negative numbers 2Negative numbers arise in any situation in which we need to talk about numbersthat are less than some agreed reference point (labelled zero). For example, onthe Celsius temperature scale, the reference point 0 ◦C (said as ‘zero degrees Cel-sius’) is the temperature at which pure water freezes under normal atmosphericconditions. When the temperature falls five degrees below 0 ◦C, then we say thatit is minus five degrees Celsius, or −5 ◦C, and if it falls even further to ten de-grees below zero then it is −10 ◦C. So the minus sign in front of a temperaturetells you that it is ‘less than zero’ and the number tells you how many degrees lessthan zero. In other words, the larger the number that follows the minus sign, thefurther the temperature is below zero degrees.
Mathematically, five degrees below zero means 0 ◦C − 5 ◦C, and if you do thissubtraction the answer is −5 ◦C.
If you are not used to thinking about negative numbers, then it may help to thinkin terms of money. If your account is overdrawn by £50, then it has ‘£50 less thannothing’ in it, and your balance is −£50. You would have to add £50 to bring thebalance up to zero. In a similar way, if the temperature is −50 ◦C (i.e. 50 ◦C ‘lessthan nothing’), then you would have to increase the temperature by 50 ◦C to bringit up to zero.
19
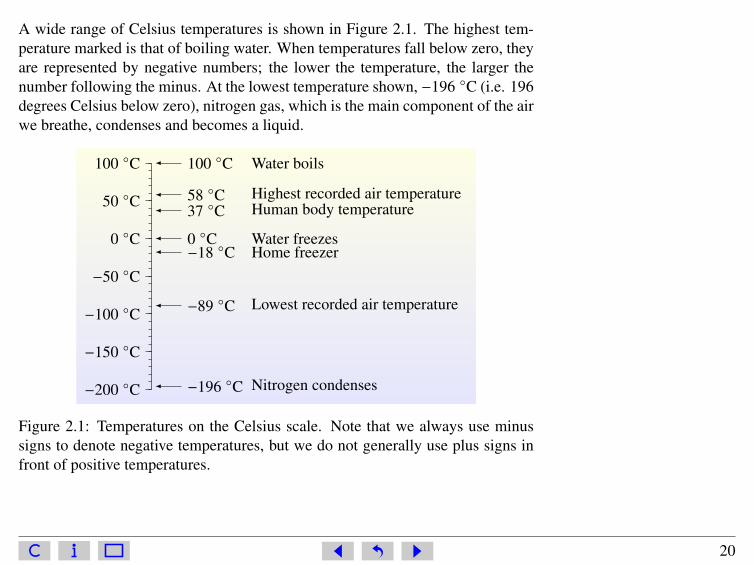
A wide range of Celsius temperatures is shown in Figure 2.1. The highest tem-perature marked is that of boiling water. When temperatures fall below zero, theyare represented by negative numbers; the lower the temperature, the larger thenumber following the minus. At the lowest temperature shown, −196 ◦C (i.e. 196degrees Celsius below zero), nitrogen gas, which is the main component of the airwe breathe, condenses and becomes a liquid.
−200 ◦C
−150 ◦C
−100 ◦C
−50 ◦C
0 ◦C
50 ◦C
100 ◦C 100 ◦C Water boils
58 ◦C Highest recorded air temperature37 ◦C Human body temperature
0 ◦C Water freezes−18 ◦C Home freezer
−89 ◦C Lowest recorded air temperature
−196 ◦C Nitrogen condenses
Figure 2.1: Temperatures on the Celsius scale. Note that we always use minussigns to denote negative temperatures, but we do not generally use plus signs infront of positive temperatures.
20

Question 2.1
In each of the following pairs of temperatures, which value would correspondto the warmer object?
(a) 57 ◦C and 65 ◦C Answer
(b) 57 ◦C and −65 ◦C Answer
(c) −57 ◦C and −65 ◦C Answer
(d) −57 ◦C and 65 ◦C Answer
Question 2.2 Answer
Arrange the following temperatures in increasing order, i.e. starting with thelowest temperature and ending with the highest temperature:
210 ◦C, 0 ◦C, −27 ◦C, 1750 ◦C, −85 ◦C, −26 ◦C, −210 ◦C, 85 ◦C.
21

2.1 Calculating with negative numbers
You may be required to perform arithmetic operations (addition, subtraction, mul-tiplication and division) involving negative numbers. There are good reasons whynegative numbers should be handled in the way that they are, but these reasonscan be quite difficult to understand. This booklet simply gives a series of rules toapply, with examples of each.
Adding a negative number is the same as subtracting the corresponding posi-tive number.
So, for example:
5 + (−3) = 5 − 3 = 2.(−5) + (−3) = (−5) − 3 = −8.
Subtracting a negative number is the same as adding the corresponding posi-tive number.
So, for example,
5 − (−3) = 5 + 3 = 8.(−5) − (−3) = (−5) + 3 = −2.
22

Note the way in which brackets have been used in the examples to make it clearhow the numbers and signs are associated. If you are struggling to see why sub-tracting 3 from -5 should give -8, whereas adding 3 to -5 gives -2, you may find ithelpful to revisit the financial analogy. If your account is £5 overdrawn and youspend a further £3, you will end up with an overdraft of £8. However, if youraccount is £5 overdrawn and you repay £3, your overdraft will be reduced to £2.
If you multiply or divide two numbers which have the same sign, the answeris positive.
So, 5 × 3 = 15, as you already know, but also (−5) × (−3) = 15.
8 ÷ 4 = 2, as you already know, but also (−8) ÷ (−4) = 2.
If you multiply or divide two numbers which have different signs, the answeris negative.
So 5 × (−3) = −15 and (−8) ÷ 4 = −2.
23

Question 2.3
Do the following calculations, without using your calculator:
(a) (−3) × 4 Answer
(b) (−10) − (−5) Answer
(c) 6 ÷ (−2) Answer
(d) (−12) ÷ (−6) Answer
Make sure that you know how to input negative numbers into your own calculator.With some makes of calculator you will be able to enter expressions like those inQuestion 2.3 more or less as they are written, with or without brackets. With othermakes you may need to use a key labelled as +/- or ± in order to change a positivenumber into a negative one.
Question 2.4
Making sure that you input all the signs, use your calculator to work out thefollowing:
(a) 117 − (−38) + (−286) Answer
(b) (−1624) ÷ (−29) Answer
(c) (−123) × (−24) Answer
24
Fractions, ratios and percentages 3Fractions, ratios and percentages are all ways of expressing proportions, that isthey show the relationship between two or more numbers.
3.1 Fractions
The term ‘fraction’ means that a quantity is part of a whole, and is the result ofdividing a whole amount into a number of equal parts. So, if you say that youcan eat one-quarter of a pie, written as 1
4 , then you are dividing the pie into fourequal parts and saying that you can eat one of those parts. After you take your14 of the pie, three of the four quarters will remain, so the fraction remaining isthree-quarters or 3
4 . The numbers 14 and 3
4 are examples of fractions.
Fractions can be written in two different ways: three-quarters can be written as 34
or 3/4. Both forms will be used in this booklet. The first is used when writing outa calculation, but the second way is sometimes more convenient in a line of text.
Any fraction can be expressed in a variety of equivalent forms. Thus, two-quartersof a fruit pie, 2/4, means two of the four equal parts, and you know that this is thesame amount as one half, 1/2. So 2/4 and 1/2 are said to be equivalent fractionsbecause they are of equal value. Figure 3.1 shows four rectangular blocks of
25

chocolate, of identical sizes, but divided into different numbers of equal-sizedpieces. The darker areas can be expressed as different fractions, but all of thedarker areas are the same size, so the four fractions are all equivalent. This meansthat:
38
=6
16=
924
=1540
In words, we would say ‘three-eighths equals six-sixteenths equals nine-twenty-fourths equals fifteen-fortieths’. Or an alternative way of saying this would be‘three over eight equals six over sixteen equals nine over twenty-four equals fif-teen over forty’.
3
8
6
16
9
24
15
40
Figure 3.1: Equivalent fractions of chocolate bars. The darker areas are all thesame size.
Note that you can change 3/8 to the equivalent fraction 6/16 by multiplying boththe number on the top and the number on the bottom by 2. Similarly, you canconvert 3/8 to 9/24 by multiplying both the top and the bottom by 3.
26

QuestionBy what number do you have to multiply both the top and the bottom of thefraction 3/8 to end up with 15/40?
Answer5, because 5 × 3 = 15, and 5 × 8 = 40.
If you take any fraction, and multiply both the number on the top of the fractionand the number on the bottom by the same number – any one you care to choose– you will produce an equivalent fraction. Thus:
13
=26
=4
12=
2060
=200600
Here we have multiplied the top and the bottom of the fraction 13 in turn by 2 (to
get 26 ), then by another 2, then by 5, and finally by 10.
Fractions are usually expressed with the smallest possible whole numbers on thetop and the bottom. Working out the equivalent fraction with these smallest num-bers is really a matter of finding numbers that can be divided into both the numberon the top of the fraction and the number on the bottom. For example,
60300
=6
30=
315
=15
so these are all equivalent fractions.
Here we first divided the numbers on the top and the bottom of the first fractionby 10 to get 6
30 , then we divided both numbers by 2 to get 315 , and finally by 3 to
end up with 15 .
27
Note that all four of these fractions are equivalent, but we would normally use thefraction with the lowest numbers, 1
5 .
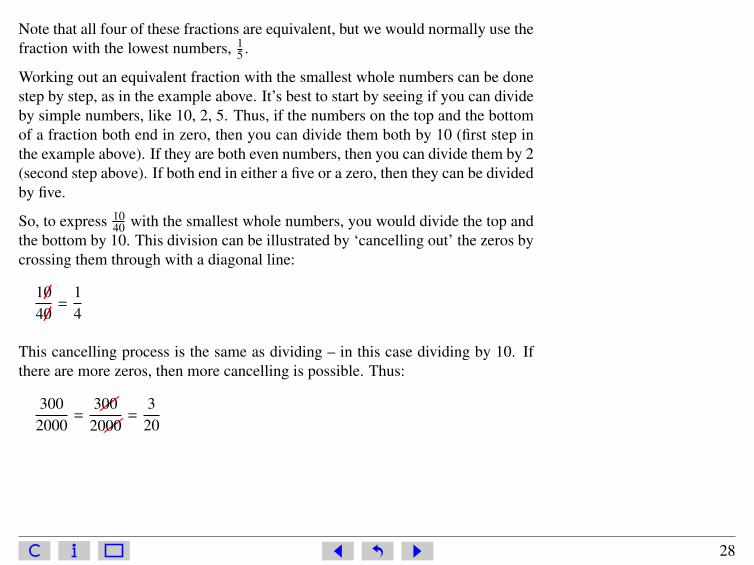
Working out an equivalent fraction with the smallest whole numbers can be donestep by step, as in the example above. It’s best to start by seeing if you can divideby simple numbers, like 10, 2, 5. Thus, if the numbers on the top and the bottomof a fraction both end in zero, then you can divide them both by 10 (first step inthe example above). If they are both even numbers, then you can divide them by 2(second step above). If both end in either a five or a zero, then they can be dividedby five.
So, to express 1040 with the smallest whole numbers, you would divide the top and
the bottom by 10. This division can be illustrated by ‘cancelling out’ the zeros bycrossing them through with a diagonal line:
1��04��0
=14
This cancelling process is the same as dividing – in this case dividing by 10. Ifthere are more zeros, then more cancelling is possible. Thus:
3002000
=3��00
20��00=
320
28

Question
How would the fractions450
1050and
420660
normally be expressed?
Answer450
1050=
45105
=9
21=
37
and420660
=4266
=2133
=7
11.
In the first case, we have divided in turn by 10, by 5 and by 3; in the secondcase, we have divided by 10, then 2 and then 3.
Until now, we have only considered fractions for which the number on the topis smaller than the number on the bottom, so these fractions are part of a whole.However, it is possible to have a fraction in which the number on the top is largerthan the number on the bottom, such as 5
4 or 138 , and these are sometimes called
‘improper fractions’. The fraction 54 simply means five-quarters (of a pie, or what-
ever); only four-quarters can come from a whole pie, so the fifth quarter mustcome from another pie.
Question 3.1 Answer
Which of the following are equivalent fractions?
34
;6080
;75
100;
64
;300400
;38
.
29
3.2 Ratios
Looking again at the chocolate bars in Figure 3.1, you can see that 3 out of 8pieces are darkened in the first, 6 out of 16 in the second, 9 out of 24 in the thirdand 15 out of 40 in the fourth. These pairs of numbers, which form equivalentfractions, are said to be in the same ratio. So any pairs of numbers that formequivalent fractions are in the same ratio.
QuestionWhich of the following pairs of numbers are in the same ratio as (6, 20)?
(3, 10); (12, 40); (12, 30); (30, 100); (24, 100).
Answer6/20 = 3/10 = 12/40 = 30/100, so these are all equivalent fractions, and there-fore the pairs of numbers from which they are formed are in the same ratio.Using the lowest whole numbers, we say that these pairs of numbers are allin the ratio 3 to 10. The fractions 12/30 (= 6/15) and 24/100 (= 6/25) are notequivalent to 6/20, so (12, 30) and (24, 100) are not in the same ratio as (6,20).
Ratios are often written as two numbers separated by a colon (:). So, a fractionsuch as 3/10 is equivalent to a ratio of 3 to 10 and this is often written as 3 : 10.
You need to take care when asked to give the ratio of two numbers, as the follow-ing example shows.
30

QuestionSuppose 2 out of 10 people in the UK drink bottled water. What is the ratio ofpeople who drink bottled water to those who don’t?
AnswerThe ratio is 2 : 8.
Did you fall into the trap and answer 2 : 10? This is the ratio of people who drinkbottled water to the total number of people. Of course if we’d asked what is theratio of people who don’t drink bottled water to those who do, the answer wouldhave been 8 : 2. So, always read the question carefully!
Ratios are particularly useful where the relative proportions of two or more partsof a whole are being considered. For example, the ratio of males to females in thegeneral population of the UK is about 1 : 1.
Question 3.2
In a random group of students, 15 were men and 8 were women.
(a) What was the ratio of women to men in the group? Answer
(b) What fraction of the total group were women? Answer
31
3.3 Percentages
You have probably met percentages in various contexts, such as a 3% pay rise,10% interest on a loan, or 20% off goods in a sale. A percentage is a fractionexpressed in hundredths. So 1/2 , i.e. one-half, is 50/100, or fifty-hundredths, andwe say that this is 50 per cent, which is usually written as 50%. This literallymeans 50 in every 100. The advantage of using percentages is that we are al-ways talking about hundredths, so percentages are easy to compare, whereas withfractions we can divide the whole thing into arbitrary numbers of parts, eighths,sixteenths, fiftieths, or whatever we choose. It is not immediately obvious that19/25 is larger than 15/20, but if these fractions are expressed as percentages, i.e.76% and 75%, respectively, then it is easy to see that the former number is thelarger of the two. But how do we convert fractions to percentages, or percentagesto fractions?
The way that you convert a fraction into a percentage is by multiplying the fractionby 100%. So to convert 1/2 to a percentage:
12× 100% = 1 ÷ 2 × 100% = 50%
Three-quarters, 3/4, converts to:
34× 100% = 3 ÷ 4 × 100% = 75%
On occasions, you will need to convert a percentage to a fraction, and to do thisyou need to remember that a percentage is a fraction expressed in hundredths andthen cancel as appropriate.
32
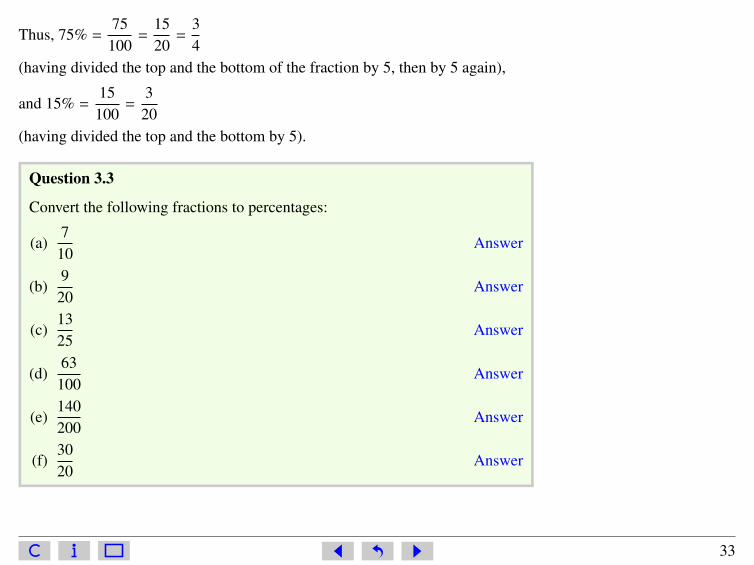
Thus, 75% =75
100=
1520
=34
(having divided the top and the bottom of the fraction by 5, then by 5 again),
and 15% =15
100=
320
(having divided the top and the bottom by 5).
Question 3.3
Convert the following fractions to percentages:
(a)7
10Answer
(b)9
20Answer
(c)1325
Answer
(d)63
100Answer
(e)140200
Answer
(f)3020
Answer
33

Question 3.4
Convert the following percentages to fractions with the smallest possiblewhole numbers on the top and the bottom:
(a) 60% Answer
(b) 64% Answer
(c) 65% Answer
(d) 67% Answer
34
3.4 Calculating fractions and percentages of numbers
Finally, let’s consider how you would work out what 34 , or 75%, of 36 is. First
think about what 34 of 36 means. It means divide 36 into 4 equal parts or quarters
(36 ÷ 4 = 9). Then, since we want three-quarters, which is three times as big, wemultiply one of these parts by three (9 × 3 = 27). So 3
4 of 36 is 27. We can write
this calculation as 34 × 36, which means the same thing as 3 ×
364
, or3 × 36
4.
So ‘34 of’ a number means multiply that number by 3
4 .
Question
What is23
of 18?
Answer23× 18 = 12
Working out 75% of a number can be done in a similar way if you remember that
75% =75
100. So 75% of 40 is:
75100× 40 = 30
Some modern calculators will convert directly between fractions and percentagesand find the percentage of a number at the press of a button. However, it is worth
35

making sure that you understand the meaning of fractions and percentages beforeletting your calculator do the work for you. This will enable you to check that theanswer you obtain is reasonable, for example, 48% of a quantity should be justless than half of it.
In summary, you can see that fractions, ratios and percentages are all ways ofexpressing a proportion. So, for example, if you eat 1
4 of a pie, the ratio of theamount you eat to the total pie is 1 : 4, and the percentage that you eat is 25%.
Question 3.5
Work out:
(a)25
of 20 Answer
(b)78
of 24 Answer
(c) 15% of 60 Answer
(d) 60% of 5 Answer
36

3.5 Doing calculations with fractions
3.5.1 Adding and subtracting fractions
Suppose we want to add the two fractions shown below:
34
+25
We cannot just add the 3 and the 2. The 3 represents 3 quarters and the 2 represents2 fifths, so adding the 3 to the 2 would be like trying to add 3 apples and 2penguins – you just can’t do it!
In order to add or subtract two fractions, it is necessary for them both to havethe same denominator (bottom line).
Fractions with the same denominator are said to have a ‘common denominator’.One way to find a common denominator when adding or subtracting two fractionsis to multiply the top and bottom of the first fraction by the denominator of thesecond fraction, and the top and bottom of the second fraction by the denominatorof the first fraction. A return to our example may make this clearer
37

34
+25
=3 × 54 × 5
+2 × 45 × 4
=1520
+820
=2320
multiply top and bottom by5 (the denominator of thesecond fraction)
multiply top and bottom by 4(the denominator of the firstfraction)
Note that the 34 and 15
20 are equivalent fractions (Section 3.1) as are 25 and 8
20 ,and that 15
20 and 820 can be added without difficulty because they have a common
denominator of 20.
Question 3.6
Work out the following, leaving each answer as the simplest possible fraction:
(a)23
+16
Answer
(b)34−
16
Answer
38

3.5.2 Multiplying fractions
The expression ‘three times two’ just means there are three lots of two (i.e. 2 + 2+ 2). So multiplying by a whole number is just a form of repeated addition. Forexample,
3 × 2 = 2 + 2 + 2
This is equally true if you are multiplying a fraction by a whole number:
3 ×45
=45
+45
+45
=125
We could write the 3 in the form of its equivalent fraction 31 and it is then clear
that the same answer is obtained by multiplying the two numerators together andthe two denominators together:
31×
45
=3 × 41 × 5
=125
In fact, this procedure holds good for any two fractions.
To multiply two or more fractions, multiply numerators (top lines) togetherand also multiply the denominators (bottom lines) together.
39
So
25×
37
=2 × 35 × 7
=6
35
Sometimes cancelling is possible
14×
25
=1 × ��2 1
��4 2 × 5=
1 × 12 × 5
=110
3.5.3 Dividing fractions
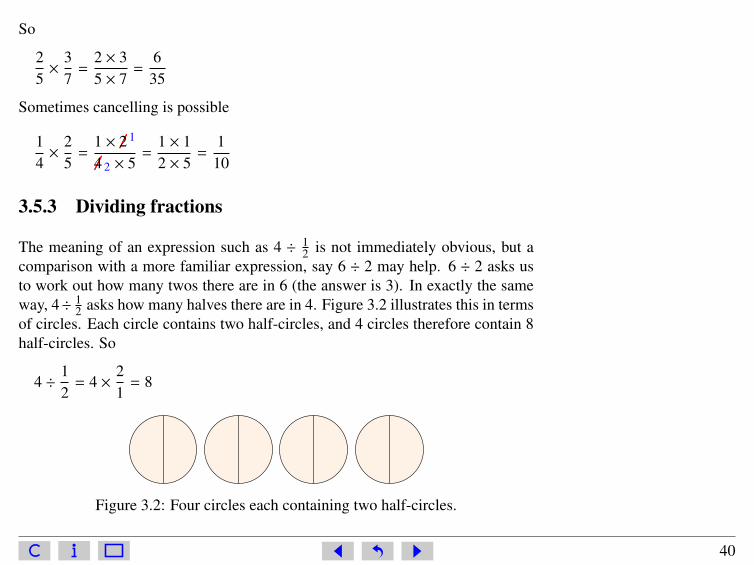
The meaning of an expression such as 4 ÷ 12 is not immediately obvious, but a
comparison with a more familiar expression, say 6 ÷ 2 may help. 6 ÷ 2 asks usto work out how many twos there are in 6 (the answer is 3). In exactly the sameway, 4÷ 1
2 asks how many halves there are in 4. Figure 3.2 illustrates this in termsof circles. Each circle contains two half-circles, and 4 circles therefore contain 8half-circles. So
4 ÷12
= 4 ×21
= 8
Figure 3.2: Four circles each containing two half-circles.
40

This can be extended into a general rule:
To divide by a fraction, turn it upside down and multiply.
So
5 ÷83
= 5 ×38
=5 × 3
8=
158
And
23÷
45
=23×
54
=��2 1 × 53 × ��4 2
=1 × 53 × 2
=56
Finally remembering that 3 can be written as 31
12÷ 3 =
12÷
31
=12×
13
=1 × 12 × 3
=16
Question 3.7
Work out the following, leaving each answer as the simplest possible fraction:
(a)27÷
14
Answer
(b)23÷
34
Answer
(c)34÷ 5 Answer
41

Decimal numbers and decimalplaces 4We introduced fractions in the previous section, and a fraction like 1
2 can also bewritten as 0.5. So 1
2 , 50% and 0.5 all mean the same thing and the number 0.5 isan example of a decimal number. Decimal numbers are important as calculatorsuse them in any calculation involving not just whole numbers. They are usedthroughout science, and you need to become proficient at adding, subtracting,multiplying and dividing decimal numbers. Fortunately, your calculator will takethe pain out of the calculations, so you can concentrate on understanding what thenumbers mean.
Decimal numbers consist of two parts separated by what is called a decimal point.When printed, a ‘full stop’ is used for the decimal point. Here are four examples,with words in brackets indicating how you say the numbers: 0.5 (‘nought pointfive’), 2.34 (‘two point three four’), 45.875 (‘forty-five point eight seven five’),and 234.76 (‘two hundred and thirty-four point seven six’). Note that the part ofthe number before the decimal point is spoken as a whole number, and the partafter the point is spoken as a series of individual digits. It’s also worth notingthat in parts of Europe outside the UK, a comma is used instead of a full stop indecimal numbers.
42

What do these numbers mean? Well, the part of the number before the decimalpoint represents a whole number, and the part after the decimal point representsthe fraction, something between nought and one, that has to be added on to thewhole number. Thus if you divide 13 by 2 you get 61
2 if you use fractions, but 6.5if you use a calculator; the 0.5 is equivalent to the half. Note that when there is nowhole number, i.e. the number is less than one, it is usual to print or write a zeroin front of the decimal point, otherwise the decimal point might be overlooked.(Your calculator, however, may not always show the zero.) If you divide 13 by 4,then with fractions you get 31
4 and with a calculator you get 3.25, so a quarter isthe same as 0.25.
Conversion of any fraction to a decimal number is straightforward with a calcu-lator. All you have to do is divide the number on the top of the fraction by the
number on the bottom. Try this for yourself: with the fraction1540
, you shouldobtain the decimal number 0.375.
43

Thousands Hundreds Tens Units Point Tenths Hundredths Thousandths
7 6 5 4 . 3 2 1
7 × 1 000 6 × 100 5 × 10 4 × 1 3 × 110 2 × 1
100 1 × 11000
= 7 000 = 600 = 50 = 4 = 0.3 = 0.02 = 0.001
total = 7 654 total = 0.321
Table 4.1: The meaning of each digit in the number 7 654.321.
Now just as each digit thatcomes to the left of thedecimal point has a precisemeaning that depends onwhere it comes in the or-der, so also does each digitthat comes after the dec-imal point. These mean-ings are summarised in Ta-ble 4.1 for the number7 654.321.
The 4 immediately before the decimal point means 4 units (or 4 ones), which issimply 4; the 5 signifies 5 tens, or 50; the 6 signifies 6 hundreds, or 600; and the7 signifies 7 thousands, or 7 000. So 7 654 means 7 000 + 600 + 50 + 4.
In a similar way, the 3 after the decimal point means 3 tenths, or 310 , the 2 means
2 hundredths, or 2100 , and the 1 means 1 thousandth, or 1
1000 . And, just as 7 654means 7 thousands plus 6 hundreds plus 5 tens plus 4 units, so 0.321 means 3tenths plus 2 hundredths plus 1 thousandth. So
0.321 =3
10+
2100
+1
1000
Now, to add fractions, we first have to convert them to equivalent fractions with thesame number on the bottom. In this case, we shall convert the first two fractionsto equivalent fractions with 1 000 on the bottom.
44
Since3
10is an equivalent fraction to
3001000
, and2
100is equivalent to
201000
, then
0.321 =300
1000+
201000
+1
1000=
(300 + 20 + 1)1000
=321
1000
Here, we have added the numbers on the tops of the fractions together to get thetotal number of ‘thousandths’, but we don’t add the numbers on the bottoms ofthe fractions since these just tell us that we are adding ‘thousandths’ in each case.
This shows that converting a decimal number to a fraction is really quite straight-forward; you just take the numbers after the decimal point (321 in the exampleabove) and divide by 1 followed by the same number of zeros as there were digitsafter the decimal point (three in this case), so
0.321 =321
1000
45

Question 4.1
Convert the following fractions to decimal numbers:
(a)18
Answer
(b)14
Answer
(c)34
Answer
(d)1
10Answer
(e)2
10Answer
(f)3
10Answer
(g)1
100Answer
(h)3
100Answer
(i)5
100Answer
(j)3
1000Answer
46
Question 4.2
Convert the following decimal numbers to fractions, and convert each fractionto the smallest whole number on the top and the bottom:
(a) 0.7 Answer
(b) 0.8 Answer
(c) 0.2 Answer
(d) 0.22 Answer
(e) 0.222 Answer
Question 4.3
Convert the following percentages to decimal numbers:
(a) 79% Answer
(b) 35% Answer
(c) 3% Answer
(Hint: you may find it helpful to start by converting the percentages to frac-tions, as discussed in Section 3.)
47

A calculator does arithmetic with decimal numbers in the same way as it doeswith whole numbers, including carrying out operations in the right order. Theonly difference is that you have to key in the decimal point, using the decimalpoint key on the calculator, at the appropriate place in decimal numbers.
As an example, try multiplying 2.36 and 43.7. The result, 103.132, should appearin the display.
Question 4.4
Work out the following decimal calculations:
(a) 1.35 + 12.76 Answer
(b) 24.31 − 13.94 Answer
(c) 3.05 × 2.2 Answer
(d) 499.56 ÷ 27.6 Answer
48

4.1 Decimal places and rounding
So far in this section, you have met decimal numbers with one, two or three digitsafter the decimal point. The number of digits after the decimal point is termedthe number of places of decimals. For example, we say that the number 1.735 isexpressed to three decimal places. 7 is in the first decimal place, 3 in the seconddecimal place and so on.
Now often when you do a calculation your calculator will display an answer withperhaps 7 decimal places – for example, it will indicate that 1
3 is 0.333 333 3.(Note the convention of leaving a gap after every third digit after the decimalpoint in the same way that a gap is left every third digit before the decimal point,counting from the decimal point in each direction.) In most cases, it is not neces-sary to give all of these digits. We might be happy to know that 1
3 is about 0.33,and to forget about the thousandths and the ten-thousandths and so on. Or some-times it is enough to know that 1
3 is about 0.3. If we approximate in this way, wesay that we are rounding the number. But rounding is a bit more complicated thanjust chopping off the unwanted digits.
If we wanted to round 1.2645 to two decimal places, we would need to look at thefirst digit to be removed – 4 in this case. If the first digit removed is a 0, 1, 2, 3 or4, then the last remaining digit – 6 in this case – is left unchanged. So the answerwould be 1.26.
However, if the first of the digits that are removed is a 5, 6, 7, 8 or 9, then the lastremaining digit is increased by one. So, for example, if 1.264 5 is rounded to onedecimal place, the answer is 1.3 – the 2 is rounded up to 3 because the first digitremoved was 6.
49

The reason for rounding up when the first digit removed is 5 or greater is clear ifyou bear in mind that the number that is midway between 1.2 and 1.3 is 1.25. Soall numbers between 1.25 and 1.3 are closer to 1.3 than they are to 1.2. It thereforemakes sense to round up the last remaining digit whenever it has been followedby a digit between 5 and 9. Note that by convention, the digit 5 is rounded up.
Sometimes, rounding a decimal number will produce a zero as the final digit;for example, both 1.803 and 1.798 become 1.80 when rounded to two decimalplaces. Don’t be tempted to ignore the final zero in these cases though, becauseit contains important information about the decimal number. Quoting a length as1.80 metres tells you that the measurement is between 1.795 0 metres and 1.804 9metres because numbers within this range are equal to 1.80 metres when roundedto two decimal places. Quoting the length as 1.8 metres, on the other hand, meansthat it is between 1.750 metres and 1.849 metres, which is a much larger range.
Question 4.5
Round each of the following numbers to one decimal place, to two decimalplaces, and to three decimal places:
(a) 0.264 8 Answer
(b) 0.825 51 Answer
(c) 21.118 4 Answer
50

Units of measurement 5If you were told that the length of a piece of string was 37, you would berather baffled. 37 what? Is it 37 metres, 37 centimetres, 37 feet, or even37 miles? Similarly, if somebody says that a friend weighs 100, whatdoes this mean? These examples highlight the importance of havingdefined units with which to make measurements and the importanceof quoting the units when you want to communicate what you havemeasured.
In science, the units used are known as SI units, which is an abbre-viation for ‘Système Internationale d’Unités’ (International System ofUnits). In 1960, an international conference formally approved this setof metric units as standard, so replacing the many different national sys-tems of measurement that had been used in science up to that time. Theadvantage of having a standard set of units is that everyone uses them,and there is no need to convert laboriously from one system to anotherto compare results in different countries. So although in everyday lifein the UK people may still buy milk and beer in pints, and measure dis-tances between towns in miles, in the scientific community SI units areused almost exclusively.
51

So what are these units? At this stage, we shall just introduce the SI units oflength, time and mass.
• The basic SI unit of length is the metre, which is abbreviated to m.
• The basic SI unit of time is the second, which is abbreviated to s.
• The basic SI unit of mass is the kilogram, which is abbreviated to kg.
Although a metre is a conveniently sized unit for measuring the height of a personor the width of a room, it is the wrong sort of size to use for quoting the distancebetween London and Edinburgh, or the breadth of a pinhead. It is therefore con-ventional and convenient to use larger and smaller multiples of the metre whenappropriate; note that these are also SI units. So, for example, large distances canbe measured in kilometres (km), and small distances or lengths can be measuredin millimetres (mm). The prefix kilo means ‘one thousand’, so a kilometre is onethousand metres. The prefix milli means ‘one-thousandth’, so a millimetre is one-thousandth of a metre. Put another way, one metre is one thousand millimetres.Therefore, 1 km = 1 000 m, 1 mm = 1
1000 m and 1 m = 1 000 mm.
QuestionHow many millimetres are there in 1 kilometre?
Answer1 km = 1 000 m and 1 m = 1 000 mm,so 1 km = 1 000 × 1 000 mm = 1 000 000 mm.
52

Another common prefix that you may have met is centi (as in centimetre, abbre-viated to cm), which means ‘one-hundredth’. So 1 cm = 1
100 m, and this meansthat:
100 cm = 100 × 1100 m = 100
100 m = 1 m, i.e. 1 m = 100 cm.
QuestionHow many centimetres are there in 25 metres?
AnswerSince 1 m = 100 cm, 25 m = 25 × 100 cm = 2 500 cm.
If you didn’t know how many millimetres there were in a centimetre, you coulduse the definitions to work this out. From the definitions,
1 m = 100 cm = 1 000 mm
So if we divide each of these equal lengths by 100, then
1100
m =100100
cm =1 000100
mm
which gives1
100m = 1 cm = 10 mm
This means that there are 10 millimetres in 1 centimetre. Alternatively, if youwant to know how many centimetres are equivalent to 1 millimetre, you canstart from the equation 1 cm = 10 mm and divide these equal lengths by ten,so 1
10 cm = 1 mm, or 1 millimetre = 110 centimetre.
53

QuestionHow many centimetres are there in 350 millimetres?
AnswerEach millimetre is equal to 1
10 cm, so we need to multiply the number of mil-limetres (350) by 1
10 cm. So 350 mm = 350 × 110 cm = 350
10 cm = 35 cm.
In general, we use the abbreviations for units in all calculations, like the onesabove. Within the main text, we sometimes use the full word and sometimesthe abbreviation, though as the module progresses we shall use the abbreviationsmore frequently. Most importantly, you can also see from these examples that theabbreviations for units are both singular and plural, so ‘m’ means metre or metres.
The relationships between the four units of length that have been introduced aresummarised in Table 5.1.
1 km = 1 000 m = 100 000 cm = 1 000 000 mm1
1 000 km = 1 m = 100 cm = 1 000 mm1
100 000 km = 1100 m = 1 cm = 10 mm
11 000 000 km = 1
1 000 m = 110 cm = 1 mm
Table 5.1: Summary of relationships between four units of length.
The basic SI unit of time, the second (s), will be familiar from everyday life.Longer time intervals may be measured in minutes, hours, days, or years, butthese are not SI units. Shorter times are measured in smaller multiples (or sub-
54

multiples) of the second. Thus, a millisecond (ms) is one-thousandth of a second,just as a millimetre is one-thousandth of a metre.
You may have been surprised that we said that the kilogram is the SI unit formass, rather than the unit for weight. After all, in everyday usage we talk aboutsomebody’s weight being so many kilograms. However, in scientific use the termweight means the downward pull on an object due to gravity, e.g. the downwardpull that makes an apple fall to the ground. This means that your weight woulddecrease if you went to the Moon, where gravity is only about 1/6 as strong ason Earth. Your mass, however, is determined by the amount of matter in yourbody, and, since this doesn’t depend on gravity, your mass is the same whereveryou are in the Universe. Weighing scales are always marked in units of mass, e.g.kilograms, so to be scientifically correct you should say that somebody has a massof 55 kilograms, rather than saying that their weight is 55 kilograms.
55

Now just as the kilometre is equal to one thousand metres, so the kilogram isequal to one thousand grams, 1 kilogram = 1 000 grams. You will have seen thenumber of grams quoted on all kinds of packaged food. Very small quantitiesare measured in milligrams, where one milligram (mg) is one-thousandth of agram, 1 milligram = 1
1000 gram. So, using abbreviations, 1 kg = 1 000 g, and1 mg = 1
1 000 g.
Question 5.1
Complete the blanks in the following relationships between units:
(a) 5 km = . . . m = . . . cm = . . . mm Answer
(b) . . . kg = 3 000 g = . . . mg Answer
(c) 25 s = . . . ms Answer
Before we leave the discussion of units, there is one other important point to re-member about the relationship between units. Suppose you had to add together100 cm and 2 m, what would be the first step you would need to take? You wouldconvert 100 cm to 1 m, so the calculation becomes 1 m + 2 m = 3 m. Alterna-tively, you would convert 2 m to 200 cm, so 100 cm + 200 cm = 300 cm. Thesame is true for all units, not just the units of length.
56
Question 5.2
Try the following calculations, which all involve changes to units:
(a) 7 kg + 4 000 g Answer
(b) 55 cm − 40 mm Answer
(c) 20 s − 1 000 ms Answer
5.1 Units in calculations
Suppose you walk a distance of 100 metres in a time of 50 seconds. Your averagespeed is given by dividing the distance by the time taken; in this case, 100 dividedby 50 gives 2. But 2 what? Again, the answer needs to be quoted with units inorder to be meaningful. Fortunately, the units of the answer can be found veryeasily; we divided the distance by the time taken and we can treat the units in asimilar fashion. The units of the answer are metres divided by seconds, frequentlywritten as m/s and said as ‘metres per second’. Rather than treating the numbersand units separately, it is better to include units as part of the calculation itself.So, in the example we have just been considering:
average speed =100 m50 s
= 2ms
, more usually written as 2 m/s.
In the same way, if we multiply two lengths (measured in metres) together to givean area (see Chapter 6), it is obvious from the calculation that the units of the
57
answer are m × m, more usually written as m2 and said as ‘metres squared’ or‘square metres’. For example:
4 m × 3 m = 12 m ×m = 12 m2
Finally, suppose that we want to find out what fraction of a particular gardenfertiliser is nitrogen, and that we know a 3 000 gram bag of the fertiliser contains210 grams of nitrogen. To find the fraction of the total mass that is nitrogen, weneed to divide 210 grams by 3 000 grams:
210 ��g3 000 ��g
=21��0
300��0=
21300
=7
100
Notice that in the first step above we cancelled the unit of grams, since this wasthe same on the top and the bottom of the fraction. Units can be cancelled in thesame way as numbers, and in this case the correct final answer is a fraction withno units. 7
100 (i.e. 7%) of the mass of the fertiliser is nitrogen.
Question 5.3
Complete the following calculations, giving your answers with appropriateunits:
(a) 3 mm × 2 mm Answer
(b) 45 km ÷ 3 hour Answer
(c) 12 000 kg ÷ 2 m3 Answer
(d) 10 km ÷ 2 km Answer
58

Measuring areas and volumes 66.1 Area
For squares and rectangles, the area is found by multiplying the length by thewidth. So a simple square with 1 m long sides (Figure 6.1), has an area of 1 m ×1 m = 1 m2. In SI units, area is measured in square metres.
1m
1m
1m2
Figure 6.1: One square metre (1 m2)
59

The rectangular garden pond shown in Figure 6.2 has an area of 3 m × 4 m =
12 m2, and you can see that it is made up of 12 squares, each with sides 1 m long.
4m
3m
12 m2
Figure 6.2: Plan of a rectangular garden pond of area 12 m2.
QuestionWhat is the area of a rectangular garden pond that measures 5 m × 4 m?
AnswerThe area is 20 m2.
60

The rectangular garden pond shown in Figure 6.3 has an area of 3.5 m × 4.2 m =
14.7 m2, which you can check with your calculator. The area is still the lengthmultiplied by the width, and if you count up 12 whole squares and eight partsquares you should be able to see that the pond covers the equivalent of about 15whole squares, each of which has 1 m side length.
4.2m
3.5m
14.7 m2
Figure 6.3: Plan of a rectangular garden pond of area 14.7 m2.
61

QuestionThere are two ways of calculating the area of the L-shapedgarden pond in Figure 6.4; can you see what these are?
AnswerYou could think of the pond as being a large rectangle, with asmaller rectangle taken out of it, as shown in Figure 6.5a. Oryou could think of it as being made up of two rectangles, sothat its total area is the sum of the areas of the two parts, asshown in Figure 6.5b. 1m
2m
2m
3m
3m
1m
Figure 6.4: Plan of an L-shapedgarden pond.
2m
2m
1m
3m
3m
(a)
3m
2m
1m
1m(b)
Figure 6.5: Two ways of calculating the area of an L-shaped garden pond.
62
We can check that these two ways of calculating the area give the same answer.
Following the first method, in Figure 6.5a, the area is: 3 m × 3 m minus 2 m ×1 m. Adding brackets to a problem of this type makes it look clearer and also em-phasises the mathematical rule of carrying out the multiplying before subtracting:
area = (3 m × 3 m) − (2 m × 1 m) = 9 m2 − 2 m2 = 7 m2
If you work this out on your calculator, brackets are not essential because yourcalculator follows the mathematical rules and will do the multiplying before thesubtracting.
Following the second method, in Figure 6.5b, the area is: 2 m × 3 m plus 1 m ×1 m, and again if we add brackets it makes the problem look clearer:
area = (2 m × 3 m) + (1 m × 1 m) = 6 m2 + 1 m2 = 7 m2
63
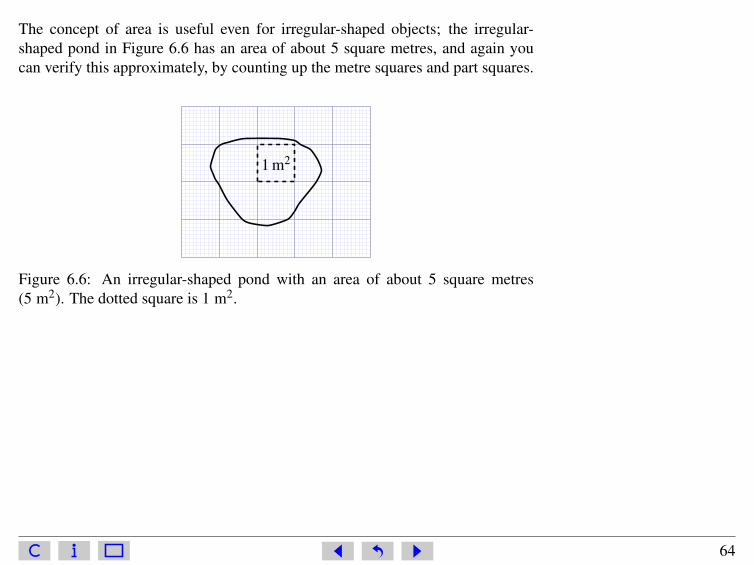
The concept of area is useful even for irregular-shaped objects; the irregular-shaped pond in Figure 6.6 has an area of about 5 square metres, and again youcan verify this approximately, by counting up the metre squares and part squares.
1 m2
Figure 6.6: An irregular-shaped pond with an area of about 5 square metres(5 m2). The dotted square is 1 m2.
64

6.2 Volume
Volume is a measure of the space that a three-dimensional object occupies. Thevolume of a rectangular block is found by multiplying its length by its widthby its height. A simple cube with 1 m long sides (Figure 6.7) has a volume of1 m × 1 m × 1 m = 1 m3 (said as ‘metre cubed’ or ‘cubic metre’). In SI units,volume is measured in cubic metres.
1 m
1 m
1 m
Figure 6.7: A cube with 1 m long sides and a volume of 1 cubic metre (1 m3).
65

The fish tank shown in Figure 6.8 has a volume of:
3 m × 2 m × 1 m = 6 m3
and 6 cubes with 1 m sides could, in principle, be neatly stacked in the tank, asthe dashed lines on the diagram indicate. For any rectangular block-like structure,such as a brick or a plank of wood, you can use the same method for measuringthe volume: just multiply together the length, the width and the height, as we didfor the tank in Figure 6.8.
1 m
2 m3 m
Figure 6.8: A fish tank and its dimensions.
QuestionSuppose you had measured the dimensions of a tank in centimetres, whatwould be the unit of its volume?
AnswerThe unit would be cm × cm × cm, or cubic centimetres, which is abbreviatedto cm3.
66

However, if you had measured one dimension in mm and the other two dimen-sions in cm, then before calculating the volume you would have to ensure all thedimensions were in the same unit.
QuestionWhat is the volume of a carton of fruit juice that has length 8 cm, width45 mm, and height 12 cm?
AnswerSince 45 mm = 4.5 cm, volume of carton = 8 cm × 4.5 cm × 12 cm =
432 cm3.
67

Unless you’re in the building trade, you are probably not used to measuring vol-umes in cubic metres. A unit that is much more commonly used for measuringvolumes of liquids is the litre (abbreviated to l). Fruit juices and emulsion paint,for example, are sold in litre volumes. A litre is the volume of a cube that has10 cm sides.
If you think about stacking cubes with 10 cm long sides in a 1 m cube (Figure6.9), then you can see that we would need 10×10×10 = 1000 of the 10 cm cubesto fill a cubic metre (1 m3), so
1 000 litres = 1 cubic metre(1 m3)
1 m
1 m
1 m
cube with 10 cm sides
Figure 6.9: How many of the small 10 cm cubes could be stacked in 1 m3?
68

QuestionHow many cubic centimetres (cm3) are there in 1 litre?
AnswerA cube with 10 cm sides has a volume of 1 litre. If you think about stacking1 cm cubes in a 10 cm cube, then you can see that there are 10×10×10 = 1 000of the 1 cm cubes in 1 litre, so 1 000 cm3 = 1 litre.
Question 6.1 Answer
A rectangular swimming pool has the following dimensions: 6 m long by 7 mwide and 2 m deep. What is the area of the bottom of the pool and what is thevolume of the pool?
Question 6.2 Answer
A reservoir is known to have the capacity to store 2.5 million litres of water.How many cubic metres is this?
69

Scientific notation 77.1 Going up: powers of ten for large numbers
It is estimated that the total volume of water stored on the Earth is 1 460 000 000 km3.
When dealing with large numbers like one thousand four hundred and sixty mil-lion (1 460 000 000), it becomes tedious to write out the number in words or tokeep writing out all of the zeros. Worse still, it is very easy to lose some of thezeros or add extra ones by mistake. Fortunately, we can refer to large numberswithout having to write out all of the zeros. The powers of ten notation is lessprone to errors and tedium because it removes the zeros. We will introduce thepowers of ten notation with some numbers more manageable than 1 460 000 000,though.
One thousand is ten times ten times ten:
10 × 10 × 10 = 1 000
We can use powers notation (introduced in Section 1.2) to write 1000 = 103.
70

QuestionHow do you think you would write 100 in powers of ten?
AnswerTwo tens are multiplied together to give one hundred (10 × 10 = 100) so thesuperscript after the 10 must be 2. That’s 102.
When expressing 100 and 1 000 in powers of ten, there are no great savings onwriting zeros, but what about one million (1 000 000)? One million is the productof multiplying together six tens:
10 × 10 × 10 × 10 × 10 × 10 = 1 000 000
so it is written as 106. Now you begin to see the benefit of the powers of tennotation.
One thousand is often written not just as 103 but as 1 × 10³. Spoken aloud, thiswould be expressed, ‘one times ten to the power three’ or just ‘one times ten to thethree’. Likewise one million is either 1×10⁶ or simply 106. Now we can give twoalternative explanations that may help you to get to grips with powers of ten. Thepower of ten shows how many times 1 has been multiplied by 10. Taking 1 × 10³
as an example, 1 000 is seen to be 1×10×10×10. In a second view, the power often shows how many places the decimal point has to move to the right to give theactual number. If we write 1 as 1.0 to remind ourselves where the decimal pointis, then one move to the right would turn 1.0 into 10.0, a second move would give100.0 and a third move would give 1 000.0, that is, one thousand.
1 . 0 0 0
71

You do not have to recall both of these ways of understanding powers of ten; justuse the one that suits you best, or develop your own way of fixing the idea in yourarmoury of mathematical techniques.
Let’s go back to the total amount of water on the Earth. Using the powers of tennotation, 1 460 000 000 could be written as 1.46 × 10⁹. A significant saving onzeros! The complete number would be spoken as ‘one point four six times ten tothe power 9’ or just ‘one point four six times ten to the nine’. The power of 9tells us how many times 1.46 has been multiplied by 10 to give the final numberof 1 460 000 000. It is nine times. That is, our number is comprised of:
1.46 × 10 × 10 × 10 × 10 × 10 × 10 × 10 × 10 × 10
To see clearly that this expression is still one thousand four hundred and sixtymillion, it helps to begin with 1.46 and work our way to the number we want bymultiplying each time by ten:
1.461.46 × 10 = 14.6 = 1.46 × 101
1.46 × 10 × 10 = 146 = 1.46 × 10²
1.46 × 10 × 10 × 10 = 1460 = 1.46 × 10³
If we carry on doing this, we end up with:
1.46 × 10 × 10 × 10 × 10 × 10 × 10 × 10 × 10 × 10= 1 460 000 000
= 1.46 × 10⁹
72

Alternatively, you can think of each increase by one in the power of ten as movingthe decimal point one place to the right. That is, if you multiply 1.46 by 10 thedecimal point moves one place to the right, giving 14.6.
1 . 4 6
Likewise, to multiply 1.46 by one thousand, the decimal point moves three placesto the right, giving 1 460.0. In the powers of ten notation, this is written 1.46×10³.
1 . 4 6 0 0
There is a convention called scientific notation that is used when writing a numberwith a power of ten. Scientific notation requires the number accompanying thepower of ten to be less than 10 but equal to or greater than 1. Let’s take theexample of one million. It could be correctly expressed as 1 × 10⁶, 10 × 105,100 × 104, 1 000 × 103, and so on, or even as 0.1 × 10⁷, but only the first ofthese obeys the convention of scientific notation and this is the one that should beused. As a second example, it is quite correct mathematically to write 85 000 as85 × 103, or 0.85 × 10⁵, but correct scientific notation would demand 8.5 × 10⁴.
Scientific notation requires the number accompanying the power of ten to beless than 10 but equal to or greater than 1.
73

Question 7.1
Express the following numbers in scientific notation:
(a) 100 000 000 Answer
(b) 400 000 000 000 Answer
(c) 35 000 Answer
(d) 95 × 105 Answer
(e) 0.51 × 10³ Answer
Question 7.2
Write out in full the numbers corresponding to:
(a) 7.3 × 10⁴ Answer
(b) 3.6 × 10⁶ Answer
(c) 4.44 × 10⁵ Answer
(d) 6.05 × 10³ Answer
74

Question 7.3 Answer
The average distance of the Earth from the Sun is 150 000 000 000 metres.Express this number in a more concise form that obeys the convention of sci-entific notation.
7.2 Going down: powers of ten for small numbers
Let’s see how the powers of ten notation can be extended to cover small numbers,such as 0.000 000 000 25 m (the diameter of a water molecule).
Write down the next two numbers in each of the following two sequences.
10 000 1 000 100 . . . . . . . . . . . . . . . . . .1 × 104 1 × 10³ 1 × 10² . . . . . . . . . . . . . . . . . .
In the first sequence, each successive number is divided by 10 (i.e. had one zerotaken off the end) so the number that follows 100 is 100
10 = 10. The next numberin that sequence must result from another division by 10. That is, we must divide10 by 10 and 10
10 = 1. Therefore, the second answer is 1. In the second sequenceof numbers, each successive number has 1 subtracted from its power, so the firstanswer is 1 × 101 because 2 − 1 = 1. For the second answer, we must subtract 1from the power 1. Because 1 − 1 = 0, the next answer is 1 × 100.
In fact, both sequences are the same because 10 000 is 1 × 10⁴, 1 000 is 1 × 103,100 is 1 × 10², and 10 is 1 × 101. The implication is that 1 = 1 × 100 andhence 100 = 1. This makes perfectly good sense if you recall that, in the second
75

sequence given above, the power is the number of times that 1 is multiplied byten (e.g. 102 = 1 × 10 × 10). For 1 × 100, 1 is multiplied by 10 no times at all,leaving it as 1.
Why stop at 1 or 100? Using the same rules, write down the next number in eachof these sequences.
100 10 1 . . . . . . . . .1 × 102 1 × 101 1 × 100 . . . . . . . . .
In the first sequence, dividing 1 by 10 gives 110 or 0.1 as the next number. In this
box, we’re keeping to decimals, so the answer we want is 0.1. But what aboutthe second sequence? The answer is more straightforward than it may seem.We continue to subtract 1 from the powers of ten so that the next number in thesequence has a negative power of ten (1×10⁻¹) because 0−1 = −1. Rememberingthat the two sequences are equivalent, it seems that 1×10−1 = 0.1. This is exactlyright! We could equally write 10−1 = 0.1.
Just as a positive power of ten denotes how many times a number is multiplied by10, so a negative power of ten denotes how many times a number is divided by10. For 10−1, we must divide 1 by 10 just once and we end up with 0.1.
76

QuestionWhat is the meaning of 10−2?
AnswerBecause the power is now −2, we must divide 1 by 10 twice.That is, 1 ÷ 10 ÷ 10 = 0.01.
Another way to think about powers of ten for very small numbers involves shiftingthe decimal point. A negative power of ten denotes the number of places that thedecimal point moves to the left. For example, think of 1 × 10⁻², which we willwrite as 1.0×10⁻² to remind us of the position of the decimal point. Starting withthe number 1.0, the power of −2 requires us to move the decimal point 2 placesto the left. One place to the left gives 0.1 and two places 0.01.
0 0 1 . 0
We therefore have 10−2 = 0.01.
Let’s try an example. Suppose a raindrop has a breadth of about 0.002 m. Thisdistance could be given in scientific notation as 2 × 10⁻³ m. This is clear from thefollowing series.
Start with: 2
Divide by ten: 2 ÷ 10 = 0.2 = 2.0 × 10⁻¹
Divide by ten again: 2 ÷ 10 ÷ 10 = 0.02 = 2.0 × 10⁻²
And again: 2 ÷ 10 ÷ 10 ÷ 10 = 0.002 = 2.0 × 10⁻³
77
Alternatively, in considering the meaning of ‘two times ten to the power minusthree,’ you may wish to start with the number 2.0 and move the decimal pointthree places to the left to give 0.002.
You know from Section 7.1 that when expressing large numbers in scientific no-tation, the power of ten (which is positive) denotes the number of places that thedecimal point moves to the right. Similarly, when expressing small numbers inscientific notation, a negative power of ten denotes the number of places that thedecimal point moves to the left.
You have seen that a negative power of ten tells you how many times you need todivide by ten, so that
0.001 = 10−3 = 1 ÷ 10 ÷ 10 ÷ 10 =1
1 000But, of course, 1 000 = 103, and so
0.001 = 10−3 =1
1 000=
1103 and so 10−3 =
1103
This relationship between positive and negative powers of ten is quite general, so
10−6 =1
106 , 10−8 =1
108 , 10−13 =1
1013 , and so on.
Convention requires that, when writing large numbers in scientific notation, thepower of ten should be accompanied by a number that is equal to or greater than1 but less than 10. The same convention is used when dealing with small num-bers and hence negative powers of ten. This is why 0.002 m, the breadth of theraindrop, is given in scientific notation as 2 × 10⁻³ m, and not as 0.2 × 10⁻² m or20 × 10−4 m.
78
Question 7.4
Express the following measurements in scientific notation:
(a) a water molecule, about 0.000 000 000 25 m across; Answer
(b) an average-sized sand grain on a gently sloping beach, about0.000 25 m across;
Answer
(c) the size of one particle of clay, the main constituent of mud,about 1/1 000 000 m across;
Answer
(d) the average size of a hailstone, 0.003 5 m across. Answer
Question 7.5
Write out in full the decimal numbers corresponding to:
(a) 7.3 × 10⁻⁴ Answer
(b) 2.9 × 10⁻⁷ Answer
Question 7.6
Use powers of ten notation to answer the following questions:
(a) How many millimetres are there in one kilometre? Answer
(b) How many kilometres is one millimetre equal to? Answer
79

7.3 Using a calculator for scientific notation
In your future studies, you are likely to be doing many calculations with numbersin scientific notation, so it is important that you know how to input them into yourcalculator efficiently and how to interpret the results.
First of all, make sure that you can input numbers in scientific notation into yourcalculator. You could do this using the button you used to input powers in Section1.2, but it is more straightforward to use the special button provided for enter-ing scientific notation. This might be labelled as EXP, EE, E or EX, but thereis considerable variation between calculators. Make sure that you can find theappropriate button on your calculator. Using a button of this sort is equivalent totyping the whole of ‘× 10 to the power’. So, on a particular calculator, keying 2.5EXP 12 enters the whole of 2.5 × 10¹².
To enter a number such as 5 × 10⁻¹⁶ into your calculator, you may need to usethe button labelled something like ± (as used in Section 2.1) in order to enter thenegative power.
To enter a number such as 109 into your calculator using the scientific notationbutton, it is helpful to remember that 109 is written as 1×10⁹ in scientific notation,so you will need to key in something like 1 EXP 9.
80

(a)
(b)
(c)
(d)
(e)
e2.5 12
Figure 7.1: Examples ofhow calculators might dis-play the number 2.5×10¹².
In addition to being able to enter numbers in scientific notation into your calcula-tor, it is important that you can understand your calculator display when it givesan answer in scientific notation. Enter the number 2.5×10¹² into your calculatorand look at the display. Again there is considerable variation from calculator tocalculator, but it is likely that the display will be similar to one of those shown inFigure 7.1. The 12 at the right of the display is the power of ten, but notice thatthe ten itself is frequently not displayed. If your calculator is one of those whichdisplays 2.5× 10¹² as shown in Figure 7.1e, then you will need to take particularcare; this does not mean 2.512 on this occasion. You should be careful not tocopy down a number displayed in this way on your calculator as an answer toa question; this could cause confusion at a later stage. No matter how scientificnotation is entered and displayed on your calculator or computer, when writingit on paper you should always use the form exemplified by 2.5 × 10¹².
Question 7.7
To check that you can use your calculator for scientific notation, do the fol-lowing calculations:
(a) (4.5 × 104) × (4.0 × 1011) Answer
(b) (6.5 × 10−27) × (2.0 × 10−14) Answer
(c) 108 ÷ (2 × 10⁻¹⁷) Answer
81
More about powers and units 88.1 Using positive and negative powers with units
Some important general results were introduced in Section 7.2, namely that
100 = 1 and that 10−1 =1
101 , 10−2 =1
102 , 10−3 =1
103 etc.
Note that 101, 100 and 10−1 are rarely used in scientific writing; it is usual to writesimply 10, 1 or 0.1 instead. However, the use of positive and negative powersprovides a useful notation that can also be used with symbols and units.
1m3 can be expressed as m−3 and
1s
(which could also be written as1s1 ) can also
be expressed as s−1.
This way of converting between positive and negative powers is often used whenexpressing units concisely. Let’s take an example that you have already met, theunit of speed, which is metres per second, abbreviated in Section 5.1 to
ms
or m/s.
82

Question
Can you think of a way to rewritems
using a negative power?
Answer
Since1s
= s−1,ms
can be written as m s−1.
The conventional scientific way of expressing the unit of speed is m s−1, and avariety of units of measurement can be expressed in a similar way using positiveand negative powers.
Notice that we have left a space between m and s−1 in the unit of speed, and wedo this whenever we write a unit that is a combination of two or more other units.This is different from the way that prefixes for multiples of units are written; theyare always written without a space between the prefix and the basic unit. Thus,‘ms’ means ‘millisecond’, but ‘m s’ means ‘metre second’. This separation of thedifferent components of a unit, but not for multiples of units, avoids confusion.
83

Question 8.1
Write each of the following using both positive and negative power notation.
For example,1
5 × 5=
152 = 5−2
(a)1
2 × 2 × 2 × 2Answer
(b)1
m ×mAnswer
Question 8.2
Express the following units using negative powers:
(a) kilometres per hour (written as km/hour in the answer toQuestion 5.3b)
Answer
(b) milligrams per litre (note that the abbreviation for milligramsis mg and the abbreviation for litres is l)
Answer
(c) kilograms per cubic metre (written as kg/m3 in the answer toQuestion 5.3c)
Answer
84

8.2 Prefixes used with SI units
prefix symbol multiplying factor
tera T 1012 = 1000 000 000 000giga G 109 = 1000 000 000mega M 106 = 1000 000kilo k 103 = 1000– – 100 = 1deci d 10−1 = 0.1centi c 10−2 = 0.01milli m 10−3 = 0.001micro µ 10−6 = 0.000 001nano n 10−9 = 0.000 000 001pico p 10−12 = 0.000 000 000 001femto f 10−15 = 0.000 000 000 000 001atto a 10−18 = 0.000 000 000 000 000 001
Table 8.1: Prefixes used with SI units.
Now that you have met powers of ten, wecan introduce the complete range of prefixesused with SI units. These are given in Table8.1.
So, for example, 1 Ms = 1 × 10⁶ s. This isabout 11.5 days.
Question 8.3
Express each of the following in metres,giving your answers in scientificnotation. Example: 2 km = 2 × 10³ m.
(a) 6.1 Tm Answer
(b) 3.5 nm Answer
(c) 1.7 µm Answer
85

Significant figures 9You were introduced, in Section 4.1, to the idea of expressing answers to a spec-ified number of decimal places. The more precisely you know a number, themore digits it seems reasonable to include; remember that writing down all thedigits given on a calculator display cannot usually be justified. Quoting answersto a specified number of decimal places can be helpful, but it can be difficult tospecify precisely how many digits are required. For example, suppose you havebeen asked to specify a distance of 34 178.921 metres to two decimal places. Inmetres, the correct answer would be 34 178.92 m, but in kilometres the correctanswer would be 34.18 km, and if you were to choose to use scientific notation,the correct answer would be 3.42 × 10⁴ m.
It is frequently more reliable to quote answers to a specified number of significantfigures where, in straightforward cases, the number of significant figures is foundsimply from counting the number of digits. So a temperature of 16.472 3 ◦C couldbe quoted to five significant figures as 16.472 ◦C, to four significant figures as16.47 ◦C, to three significant figures as 16.5 ◦C and to two significant figures as16 ◦C. The number of significant figures displayed reflects the certainty withwhich the value is known; in general the last digit will be somewhat uncertain,but you can be confident of the other digits.
86

Question 9.1
To how many significant figures are each of the following measurementsgiven:
(a) 5.63 m Answer
(b) 3 567.1 kg Answer
(c) 17 µs Answer
Question 9.2
Express the number 5.683 12 to
(a) four significant figures; Answer
(b) two significant figures. Answer
Specifying the number of significant figures when zeros are involved can be a bitmore tricky, as the following examples indicate:
• 0.082 m: here there are only two significant figures because initial zeros donot count. These initial zeros tell you only about the size of the number,and not about the precision to which it is known. The first significant digitin this value is the 8.
• 50.6 m: there are three significant figures here, since the zero in the middleof a number counts as a significant figure in the same way as the other digits.
87
• 79.0 m: there are three significant figures here too; a zero that is at the endof a number and after the decimal point has the same significance as anyother digit; if this value was only known to two significant figures then itwould have been quoted as 79 m.
• 900 m: this is the really tricky one! It could be that the value is knownto three significant figures, that is, only the final zero is uncertain. But itmight be that the distance has been measured only to the nearest 100 m(i.e. it lies between 850 m and 950 m). One way round this ambiguityis to state clearly the number of figures that are significant; for exampleto quote ‘900 m to one significant figure’. Alternatively, we can use sci-entific notation to resolve the ambiguity. Thus 9.00 × 10² m, 9.0 × 10² mand 9 × 10² m are all 900 m, but expressed to three significant figures, twosignificant figures and one significant figure respectively.
Question 9.3
To how many significant figures are each of the following measurementsgiven:
(a) 1.240 mm; Answer
(b) 0.019 mm; Answer
(c) 10.009 5 mm; Answer
(d) 8.90 × 104 mm. Answer
88

9.1 Significant figures in calculations
The results of measurements are often used in calculations, and we then need toknow how many figures to quote in the final answer. As a rule of thumb, whenmultiplying and dividing numbers, the number of significant figures in the resultshould be the same as in the measurement with the fewest significant figures. Forexample, if the length of a flower bed is 4.5 m and its width is 1.09 m, then thecalculated area is 4.5 m×1.09 m = 4.905 m2. However, since the length of 4.5 mis measured only to two significant figures, we are only justified in quoting thearea to two significant figures, so we would round the calculated value to 4.9 m2.
Question 9.4
Do the following calculations and express your answers to the appropriatenumber of significant figures:
(a) 0.43 m ÷ 1.2 s Answer
(b) 2.373 m × 3.6 m Answer
(c) 6 342 kg ÷ 2.42 m3 Answer
89

Reading data from tables 10Use of water Volume/litres
Domestic – mains water supplyflushing lavatory 44bath and shower 23washing machine 16dishwasher 1outside use (garden, car washing) 4miscellaneous (drinking, cooking, cleaning) 48
Non-domestic – mains water supplycommercial and industrial use 189
Non-domestic – rivers and underground suppliesagriculture 7electricity generation 220industry 52
Table 10.1: Estimates of daily uses of water per person inthe UK.
Tables provide a neat and concise way of dis-playing information. Table 10.1 illustrates vari-ous important features, common to all tables ofthis type:
• a title;
• a heading at the top of each column;
• the ‘volume’ heading includes the units(litres in this case), so the unit does nothave to be repeated after each number.
Note the way in which the volume heading andits units have been quoted as ‘volume/litres’.
It is conventional always to use ‘quantitydivided by units’ (usually in the form‘quantity/units’) in labelling the headings oftables and the axes of graphs.
90

When reading a value from the table, for example the estimated amount of waterused in washing machines, the units from the heading must be re-attached to theappropriate number. In the case of the example, the units of litres must be givenalongside the number 16; 16 litres of water are used in washing machines perperson per day in the UK.
The way in which the table heading is given as ‘volume/litres’ is a reminder ofthe fact that the value (16 litres) has been divided by litres. The litres then cancelto give a pure number in the table:
volume/litres =16 ���litres���litres
= 16
Question 10.1
To practise reading the information presented in Table 10.1, answer the fol-lowing questions:
(a) How much water does the average person in the UK use eachday in the home for flushing the lavatory?
Answer
(b) What does the number 7 in the third row from the bottom ofthe table mean?
Answer
91

Major planet Mass/1020 kg
Mercury 3 302Venus 48 690Earth 59 740Mars 6 419Jupiter 18 990 000Saturn 5 685 000Uranus 866 200Neptune 1 028 000
Table 10.2: Masses of the majorplanets in the Solar System.
Now look at Table 10.2. The ‘mass’ heading includes not just a unit buta power of ten too. This has been done to avoid giving a power of tenalongside each value and thus to make the table less cluttered; it alsomakes it easier to compare the different masses. Not only has the massof each planet been divided by kg, it has also been divided by 1020, andboth the units and the power of ten need to be re-attached when data areextracted from the table. Thus the mass of Mercury is 3 302 × 1020 kg,which is 3.302 × 10²³ kg in scientific notation (since the decimal pointhas to be moved a further three places).
Question 10.2 Answer
Use Table 10.2 to find the mass of the planet Uranus.
92

Representing data: pie charts, barcharts and histograms 11The well-known saying that a picture is worth a thousand words reflects the factthat we can derive a lot of information from pictorial representations of a situation.Sections 11 and 12 look at various methods used by scientists to represent data ina pictorial way.
11.1 Pie charts
Figure 11.1a shows a circular pie. If we divide the pie into four equal portions, asshown in Figure 11.1b, then each portion is 1
4 or 25% of the whole pie.
(a) (c)(b)
Figure 11.1: In a pie chart, the whole pie is divided into segments, where the sizeof the segment reflects the proportion of the component it represents.
93

QuestionIf we divide the pie into five equal portions, what percentage of the whole piewould each portion represent?
AnswerEach portion would represent 1
5 × 100%, that is 20% of the whole pie.
Pie charts give a quick visual impression of the proportions that something isdivided into; remember that the whole pie represents 100%.
94

We can present the data in Table 11.1 bya pie chart, as shown in Figure 11.2.Here, the sizes of the portions reflect thepercentage composition of the Earth’satmosphere at sea-level, based on thenumbers of particles of each gas. Thusthe whole pie (100%) represents theatmosphere, the largest segment (77.6%)represents the proportion of nitrogen, thenext largest segment (20.9%) representsthe proportion of oxygen, and so on.
Component Number of particles/% of total
nitrogen 77.6oxygen 20.9argon 0.93water (average value) 0.5carbon dioxide 3.6 × 10⁻²
Table 11.1: The gaseous composition of the Earth’s atmosphereat sea-level.
nitrogen 77.6%
oxygen 20.9%argon 0.93%
water 0.5%carbon dioxide 0.036%
Figure 11.2: A pie chart showing the composition of the Earth’satmosphere. The sizes of the portions of pie are in proportion tothe numbers of particles of the different components of the atmo-sphere.
95

Note that pie charts can be drawn in a three-dimensional style, as shown in Figure 11.3. Thetwo-dimensional representation in Figure 11.2shows the proportions more accurately, thoughthe three-dimensional representation is frequentlyused. In an accurate pie chart, the angle at the cen-tre of the pie chart should correspond to the pro-portion of the component in question. Angles aremeasured in degrees (represented by the symbol ◦)and there are 360◦ in a circle (see Figure 11.4). So,in Figure 11.1c, where each of the segments repre-sents 1
4 of the whole, the angle at the centre of eachsegment is
14× 360◦ = 90◦
Question 11.1 AnswerWhat angle would you need to use for a seg-ment of a pie chart representing 10% of thewhole?
nitrogen 77.6%
oxygen 20.9%argon 0.93%water 0.5%
carbon dioxide 0.036%
Figure 11.3: Pie charts are sometimes drawn in athree-dimensional style
startingposition
direction ofrotation
45◦90◦135◦
180◦
225◦
360◦
Figure 11.4: The angles encountered in turningthrough a circle
96
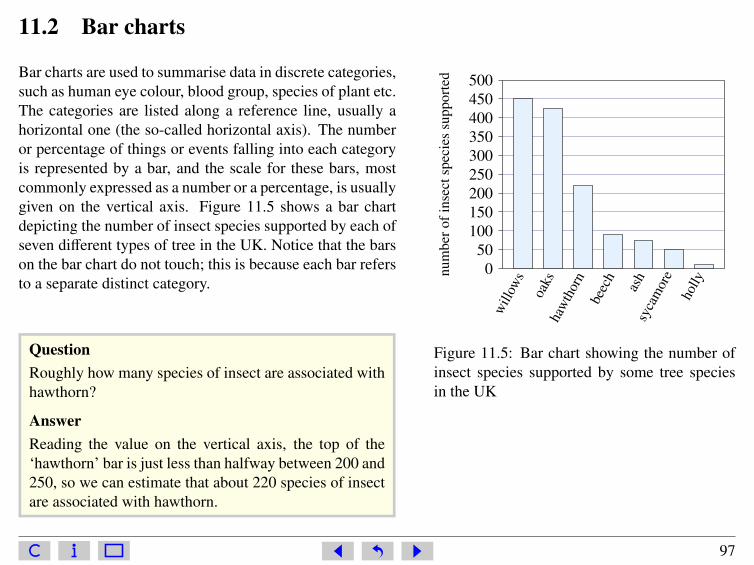
11.2 Bar charts
050
100150200250300350400450500
num
bero
fins
ects
peci
essu
ppor
ted
will
ows
oaks
haw
thor
nbe
ech
ash
syca
mor
eho
lly
Figure 11.5: Bar chart showing the number ofinsect species supported by some tree speciesin the UK
Bar charts are used to summarise data in discrete categories,such as human eye colour, blood group, species of plant etc.The categories are listed along a reference line, usually ahorizontal one (the so-called horizontal axis). The numberor percentage of things or events falling into each categoryis represented by a bar, and the scale for these bars, mostcommonly expressed as a number or a percentage, is usuallygiven on the vertical axis. Figure 11.5 shows a bar chartdepicting the number of insect species supported by each ofseven different types of tree in the UK. Notice that the barson the bar chart do not touch; this is because each bar refersto a separate distinct category.
QuestionRoughly how many species of insect are associated withhawthorn?
AnswerReading the value on the vertical axis, the top of the‘hawthorn’ bar is just less than halfway between 200 and250, so we can estimate that about 220 species of insectare associated with hawthorn.
97

11.3 Histograms
0
10
20
30
num
bero
fpla
nts
75 80 85 90 95 100 105 110 115 120height/cm
Figure 11.6: Histogram representing the resultof measuring the heights of 100 of the same va-riety of iris as part of horticultural field trials.The horizontal axis is divided into intervals torepresent different height groups.
A histogram is similar to a bar chart in that numbers or per-centages are again commonly plotted vertically, but on ahistogram the horizontal axis is used to represent a con-tinuously variable quantity such as height, mass or time.The purpose of a histogram is to show how the data aredistributed into groups across a continuous range. Figure11.6 shows a histogram which presents the results of mea-surements taken of the height of 100 irises. In principle, aplant selected at random could be of any height. Of thosemeasured, a few specimens are particularly tall and a feware particularly short, but the majority are of intermediateheight; this is typical of natural variation in populations.Note that on a histogram (as compared with a bar chart) thecolumns touch, because the entire range of values is repre-sented. For the same reason, the height interval of 110 cmto 115 cm is included, even though there are no irises ofthis height. Finally, note that the height intervals are of equal size. This is com-mon practice, although there are ways of constructing histograms using unequalintervals.
Question 11.2 Answer
Approximately how many of the irises in the field trials were less than 85 cmtall?
98

Representing data: graphs 12
0 2 4 6 8 10 12 14 16 18
20
40
60
80
100
120
140
160
180
age/years
heig
ht/c
m
title tells you at a glance what the graph is about
origin is the pointwhere both scales arezero
plotted point indicatesheight at a particular age(110 cm at 10 years)
label tells youheight is beingplotted alongvertical axis
“/” means heights aredivided by the unit cm togive numbers on scale
Figure 12.1: Height of Marie, from birth to 18 years old.
Graphs are used to illustratethe relationship between twoquantities; for example Fig-ure 12.1 shows the way inwhich the height of a girlchanges as her age increases.
99

12.1 Reading information from a graph
There are 10 ofthese divisionsbetween 20 and40
18202224262830323436384042
A
B
Figure 12.2: Enlarged part ofthe vertical scale of Figure12.1.
Figure 12.1 illustrates some very important points to be borne in mind whenreading data from any graph of this sort.
Notice that the vertical axis has been labelled ‘height/cm’. The label includesthe unit, in the same way as in the headings of tables. On some graphs thelabel includes a power of ten too – take care to look out for this.
Returning to Figure 12.1, the combination of the label and the scale on thevertical axis tells us that the numbers correspond to height in centimetres, thatis, 0 cm, 20 cm, 40 cm, etc. So as we move vertically upwards on the graph,the girl’s height increases by 20 cm for each 1 cm on the graph paper. Lookat Figure 12.2, which shows an enlarged version of the small section of thevertical scale between 20 and 40 cm on Figure 12.1. Because the horizontallines on the graph in Figure 12.2 are equally spaced, we can work out whatvalues of height correspond to each of the lines. The 20 cm difference be-tween 20 cm and 40 cm has been divided into 10 small equal divisions, soeach small division represents 20 cm
10 = 2 cm. So the horizontal lines on theenlarged graph have been marked 22, 24, 26, and so on. The point on the axisindicated by arrow ‘A’ corresponds to 28 cm, and the point indicated by arrow‘B’ corresponds to 36 cm. A point that is halfway between the lines marked34 and 36 corresponds to 35 cm.
100

The horizontal axis in Figure 12.1 has a scalenumbered 0, 2, 4, 6, . . . 18; these numberscorrespond to the age in years. The succes-sive numbers are separated by 1 cm, so thisis also a uniform scale. For every 1 cm thatwe move from left to right on the graph, theage of the girl increases by 2 years.
0 2 4 6 8 10 12 14 16 18
20
40
60
80
100
120
140
160
180
age/years
heig
ht/c
m
Height of Marie, from birth to 18 years old
QuestionHow much does the age of the girl increase for each small division?
AnswerSince 10 small divisions represent 2 years, one small division (1 mm)
represents2 years
10= 0.2 years. This is about 10 weeks.
101
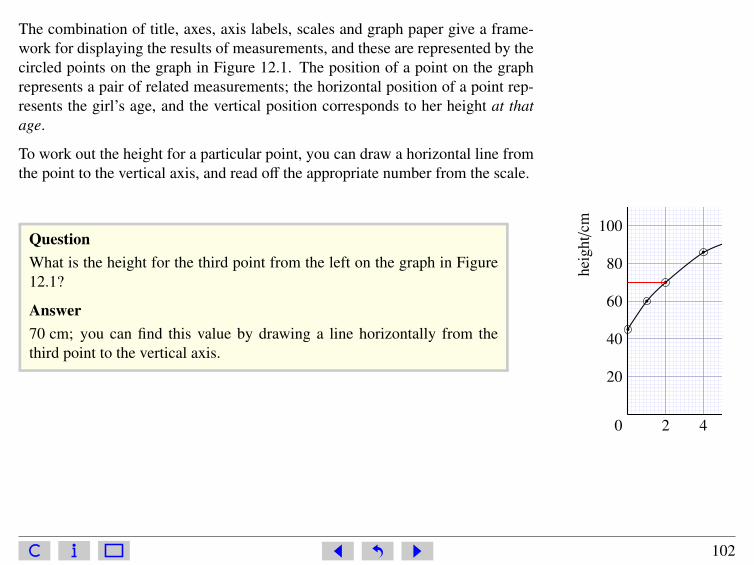
The combination of title, axes, axis labels, scales and graph paper give a frame-work for displaying the results of measurements, and these are represented by thecircled points on the graph in Figure 12.1. The position of a point on the graphrepresents a pair of related measurements; the horizontal position of a point rep-resents the girl’s age, and the vertical position corresponds to her height at thatage.
To work out the height for a particular point, you can draw a horizontal line fromthe point to the vertical axis, and read off the appropriate number from the scale.
QuestionWhat is the height for the third point from the left on the graph in Figure12.1?
Answer70 cm; you can find this value by drawing a line horizontally from thethird point to the vertical axis.
0 2 4 6 8 10 12 14 16 18
20
40
60
80
100
120
140
160
180
age/years
heig
ht/c
m
102
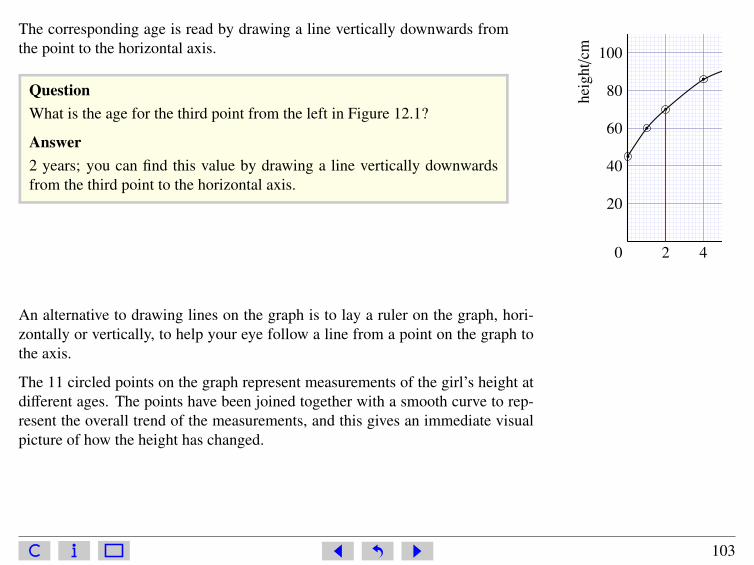
The corresponding age is read by drawing a line vertically downwards fromthe point to the horizontal axis.
QuestionWhat is the age for the third point from the left in Figure 12.1?
Answer2 years; you can find this value by drawing a line vertically downwardsfrom the third point to the horizontal axis.
0 2 4 6 8 10 12 14 16 18
20
40
60
80
100
120
140
160
180
age/years
heig
ht/c
m
An alternative to drawing lines on the graph is to lay a ruler on the graph, hori-zontally or vertically, to help your eye follow a line from a point on the graph tothe axis.
The 11 circled points on the graph represent measurements of the girl’s height atdifferent ages. The points have been joined together with a smooth curve to rep-resent the overall trend of the measurements, and this gives an immediate visualpicture of how the height has changed.
103

QuestionWhat is the trend of the girl’s heightwith increasing age?AnswerThe girl’s height increased rapidly inthe first couple of years, and hergrowth then slowed down – the curvebecomes flatter. There was anothergrowth spurt corresponding to theonset of puberty, between 10 and 14years, and her height then remainedalmost constant at about 165 cm.(This last height is 21
2 divisions above160 cm, and since each division is2 cm, the height must be21
2 × 2 cm = 5 cm above 160 cm.)
0 2 4 6 8 10 12 14 16 18
20
40
60
80
100
120
140
160
180
age/years
heig
ht/c
m
Height of Marie, from birth to 18 years old
104

The smooth curve allows us to estimatethe height of the girl at ages betweenthose at which the actual measurementswere made. So to estimate her heightat 7 years, we find 7 years on the ageaxis, follow a vertical line upwards fromhere to the curve, and then follow a linefrom this point on the curve to the ver-tical axis, and read the appropriate valuefor the height from the scale on the axis;it’s about 97 cm. This process of deter-mining intermediate values between theplotted points is known as interpolation.
Question 12.1 Answer
Use the graph to estimate the girl’sheight at 11 years.
0 2 4 6 8 10 12 14 16 18
20
40
60
80
100
120
140
160
180
age/years
heig
ht/c
m
Height of Marie, from birth to 18 years old
105

Question 12.2
To practise reading graphs, study Figure 12.3 and an-swer the following questions.
(a) What is the subject of this graph? Answer
(b) What quantity is plotted on thevertical axis, and in what unit is itmeasured?
Answer
(c) What is plotted on the horizontalaxis, and in what unit is itmeasured?
Answer
(d) What was the water flow of thestream at 12.00 hours?
Answer
(e) What was the maximum flow ofthe stream and at what time did itoccur?
Answer
(f) Describe in words the way that thewater flow changed over the periodplotted on the graph.
Answer
0
50
100
150
200
00 04 08 12 16 20 24
time/hours
wat
erflo
w/li
tres
pers
econ
d
Figure 12.3: The volume of water in a streamflowing past a fixed point per second, dur-ing a flood after heavy rainfall. This is thetype of graph produced by a continuouslyrecording instrument so there are no individ-ual plotted points.
106

12.2 The gradient of a graph
x
y
0
1
2
3
Figure 12.4: A graph of three lineswith different gradients.
We often want to know how one quantity varies with respect to another.We may be interested in the actual value of one quantity for a particularvalue of the other quantity (as in Section 12.1), but it is more often therate at which one quantity varies with respect to another that is of moreimportance. The slope or gradient of a graph gives us a method of find-ing rate of change. We have already discussed the fact that Figure 12.1shows us that the girl’s height increased rapidly in the first couple ofyears and then her growth slowed down. We know this because the gra-dient (slope) of the graph is initially steep but then becomes shallower.
In this booklet, there is only space to discuss how to find the gradientof a simple straight-line graph, such as the ones shown in Figure 12.4.A straight-line graph is one in which quantity plotted on the verticalaxis varies at a steady rate with respect to the quantity plotted on thehorizontal axis. In other words, the gradient of the line is constant.
QuestionWhich of the lines in Figure 12.4 has the largest gradient and which has thesmallest gradient?
AnswerLine 3 has the largest gradient – this is the steepest slope. Line 1 has thesmallest gradient – it has the smallest change in the vertical direction for anyparticular change in the horizontal direction.
107

0
100
200
0 10 20 30 40
travel time after earthquake occurred/s
dist
ance
from
epic
entr
e/km
Figure 12.5: Graph showing how long it takes for seismicwaves from an earthquake to reach three detectors at differ-ent distances from the epicentre. (Note that the epicentre isthe point on the Earth’s surface vertically above the centre, orfocus, of an earthquake.)
The gradient of a straight line is defined as:
gradient =change in vertical value
change in horizontal value
This is sometimes stated as:
gradient =riserun
To work out the gradient of a straight lineon a graph, we simply need to take any twopoints on the line (to increase the precisionof the calculation, the points should be quitewell separated) and find the change in ver-tical value (the rise) corresponding to a par-ticular change in horizontal value (the run).As an example, let’s find the gradient of thegraph shown in Figure 12.5.
108
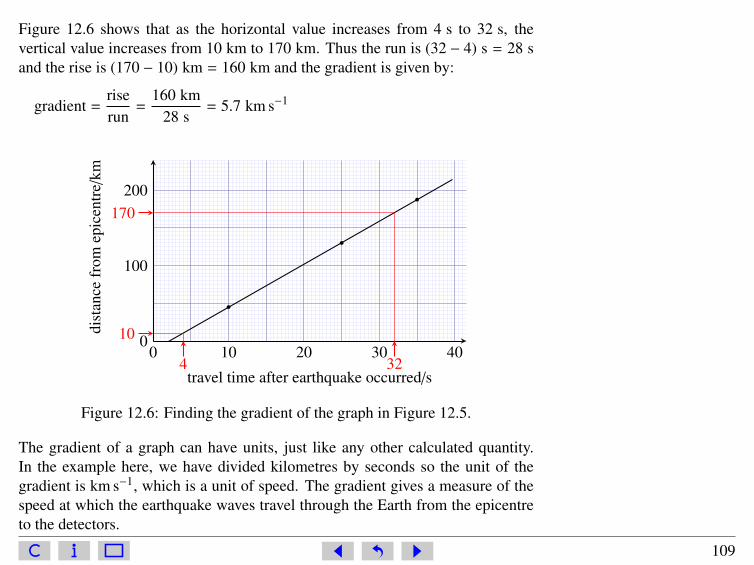
Figure 12.6 shows that as the horizontal value increases from 4 s to 32 s, thevertical value increases from 10 km to 170 km. Thus the run is (32 − 4) s = 28 sand the rise is (170 − 10) km = 160 km and the gradient is given by:
gradient =riserun
=160 km
28 s= 5.7 km s−1
0
100
200
0 10 20 30 40
travel time after earthquake occurred/s
dist
ance
from
epic
entr
e/km
10
170
4 32
Figure 12.6: Finding the gradient of the graph in Figure 12.5.
The gradient of a graph can have units, just like any other calculated quantity.In the example here, we have divided kilometres by seconds so the unit of thegradient is km s−1, which is a unit of speed. The gradient gives a measure of thespeed at which the earthquake waves travel through the Earth from the epicentreto the detectors.
109

Note also that the rules for significant figures in calculations, introduced in Sec-tion 9.1, apply here too. In the example above, the run is given to two significantfigures, so the answer is correctly given to two significant figures too.
Question 12.3 Answer
A large ornamental pool with straight sidesand a flat bottom is filled with water. Ameter registers the volume of water pumpedinto the pool. As the pool fills, the depthof water is measured. Figure 12.7 shows agraph in which the depth of water is plottedagainst the volume of water added. Calcu-late the gradient of this graph.
0 100 200 300 400 5000.0
0.2
0.4
0.6
0.8
1.0
volume/m3
dept
hof
wat
er/mFigure 12.7: Graph for use with Question 12.3.
110

12.3 Plotting a graph
Elapsed time/min Volume/ml
0 1503 1506 1559 170
12 20015 21518 24521 27524 305
Table 12.1: Volume of yeast mix-ture after various times with waterat 25 ◦C.
This discussion of how to plot a graph is based on the data shown inTable 12.1, which comes from an experiment in which the volume ofa mixture of yeast, sugar and water at 25 ◦C was observed to increasewith time. When plotting a graph of these results, or any similar data,you should work through the following stages.
Stage 1 Choose your axes
The first thing to decide is which of the two sets of readings (elapsedtime and volume in this case) should go on which axis. In this exper-iment, the time intervals at which readings were to be taken had beendecided in advance, before the investigation began, i.e. they were fixed.Such fixed information – termed the independent variable – is conven-tionally plotted on the horizontal axis, frequently referred to as the ‘x-axis’. The volume readings depend on the time at which the reading wastaken and, consequently, these are termed the dependent variable. Such quanti-ties, which depend on other variables, are plotted on the vertical axis, frequentlyreferred to as the ‘y-axis’.
Stage 2 Choose your scale
Having decided that elapsed time should go on the horizontal axis and volumeshould go on the vertical axis, next you need to decide what scale to use on each
111

axis. You should aim to use as much of the graph paper as possible (so thatthe graph is as large as possible, which makes it easier to read the values) whileavoiding scales that are awkward to read and thus potentially confusing.
QuestionLook at the data in Table 12.1. What ranges of values need to be representedhorizontally and vertically?
AnswerThe horizontal axis needs to include times from 0 to 24 minutes. The verticalaxis needs to include volumes from 0 to 305 ml (it would also be acceptableto plot a graph just showing volumes from 150 to 305 ml).
Assume your graph paper covers 13 cm in the direction you have chosen for thehorizontal axis. You could use each 1 cm to represent 2 minutes, as shown inFigure 12.8.
0 2 4 6 8 10 12 14 16 18 20 22 24
elapsed time/min
Figure 12.8: Choosing the scale for the horizontal (time) axis.
112
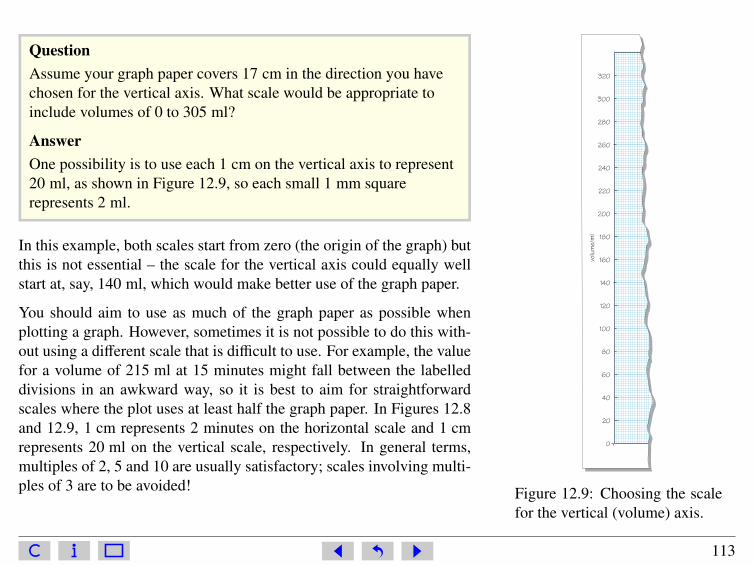
QuestionAssume your graph paper covers 17 cm in the direction you havechosen for the vertical axis. What scale would be appropriate toinclude volumes of 0 to 305 ml?
AnswerOne possibility is to use each 1 cm on the vertical axis to represent20 ml, as shown in Figure 12.9, so each small 1 mm squarerepresents 2 ml.
In this example, both scales start from zero (the origin of the graph) butthis is not essential – the scale for the vertical axis could equally wellstart at, say, 140 ml, which would make better use of the graph paper.
You should aim to use as much of the graph paper as possible whenplotting a graph. However, sometimes it is not possible to do this with-out using a different scale that is difficult to use. For example, the valuefor a volume of 215 ml at 15 minutes might fall between the labelleddivisions in an awkward way, so it is best to aim for straightforwardscales where the plot uses at least half the graph paper. In Figures 12.8and 12.9, 1 cm represents 2 minutes on the horizontal scale and 1 cmrepresents 20 ml on the vertical scale, respectively. In general terms,multiples of 2, 5 and 10 are usually satisfactory; scales involving multi-ples of 3 are to be avoided!
0
20
40
60
80
100
120
140
160
180
200
220
240
260
280
300
320
volume/m
l
Figure 12.9: Choosing the scalefor the vertical (volume) axis.
113
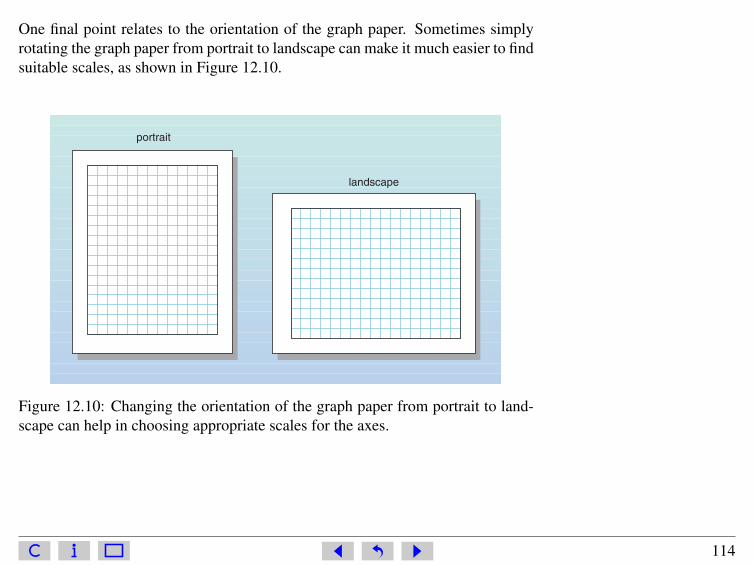
One final point relates to the orientation of the graph paper. Sometimes simplyrotating the graph paper from portrait to landscape can make it much easier to findsuitable scales, as shown in Figure 12.10.
portrait
landscape
Figure 12.10: Changing the orientation of the graph paper from portrait to land-scape can help in choosing appropriate scales for the axes.
114

Stage 3 Label your graph
For a graph to convey meaning to other people, it must be completely labelled.Each axis should be labelled with the quantity it represents (elapsed time or vol-ume in this case), followed by a forward slash (/), followed by the units (minor ml). So the vertical axis of the graph should be labelled ‘volume/ml’ and thehorizontal axis should be labelled ‘elapsed time/min’.
In addition to having labelled axes, the graph itself should have a title. Thisshould include information about the content of the graph: for example, it needsto be clear that the graph illustrates the variation of the volume of the yeast mix-ture with elapsed time. The title should also include some information about thetemperature.
QuestionWhat would be a suitable title for the graph being plotted on this occasion?
AnswerHere is one suggestion: ‘Graph showing the variation of the volume of yeastmixture with elapsed time, at 25 ◦C’.
115

Stage 4 Plot the points
0
20
40
60
80
100
120
140
160
180
0 2 4 6 8 10
elapsed time/min
volu
me/
ml
Figure 12.11: Plotting a point on a graph.
You are now ready to plot the points. Follow a procedure similarto the one you used to read the value from a graph in Section 12.1.So, to plot the point for which the elapsed time is 6 minutes, youshould draw a real or imaginary line up from the horizontal axisfor an elapsed time of 6 minutes (Figure 12.11). Similarly, sincethe volume of mixture was measured as 155 ml at this time, youshould draw a real or imaginary line across from the vertical axisfor a volume of 155 ml. Your point should be at exactly the placewhere the two lines meet.
116

Several different conventions are used to indicate points on a graph, ×, + and �being the best (Figure 12.12), but it does not matter which one you use. Thesemarks make it clear exactly where the centre of the point is: for × and + it is wherethe two lines cross, and for � it is at the dot in the centre of the circle. The circledrawn around the dot simply makes the point clearer – it can be very difficult tosee just a dot when you come to draw the curve. It also makes it difficult for otherpeople to see where you have positioned the point.
It is very easy to make a mistake when plotting points and drawing a curve throughthe points, so you are advised to use a pencil rather than a pen for these tasks – andto have an eraser ready. There are computer programs which will plot points foryou and draw the curve but, unless there is a reason why you cannot plot graphsby hand, you should make sure that you know how to do this.
Figure 12.12: Different marks for indicating the points on a graph.
117

Stage 5 Draw a curve through the points
When you have plotted all of the points on the graph, all that remains to be done is to draw acurve that best represents the data. Before doing this, hold the graph paper at arm’s length andlook at the points. Most of the graphs that you draw will represent a general trend, for examplethe way in which a child’s height increases with age, or a yeast mixture increases in volume astime passes. These are both continuous processes: you would not expect the child’s height toincrease one month and then decrease the following month. However, with real experimentaldata, uncertainties in measurements sometimes lead to readings which vary in a rather erraticway (Figure 12.13). Provided you are sure that your graph represents a general trend (whichis usually the case), you need to draw the smooth curve which best represents the data, not aseries of short lines joining the individual points.
If the points appear to represent a uniform variation, the ‘curve’ which best represents themwill be a straight line, as in Figure 12.13c. This is known as the best-fit line.
(a) (b) (c)
Figure 12.13: Graphs usually represent a general trend: (a) a series of points on agraph; (b) the points should not be joined by a series of short lines; (c) instead, abest-fit line should be drawn to represent all the data.
118
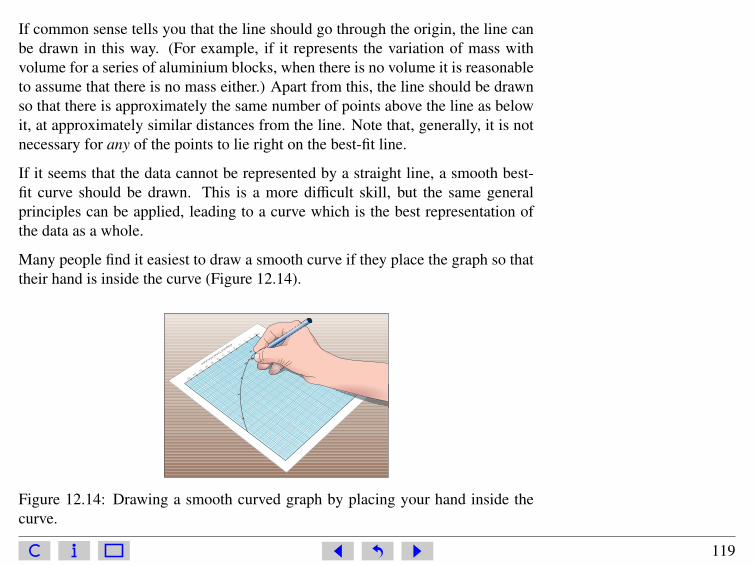
If common sense tells you that the line should go through the origin, the line canbe drawn in this way. (For example, if it represents the variation of mass withvolume for a series of aluminium blocks, when there is no volume it is reasonableto assume that there is no mass either.) Apart from this, the line should be drawnso that there is approximately the same number of points above the line as belowit, at approximately similar distances from the line. Note that, generally, it is notnecessary for any of the points to lie right on the best-fit line.
If it seems that the data cannot be represented by a straight line, a smooth best-fit curve should be drawn. This is a more difficult skill, but the same generalprinciples can be applied, leading to a curve which is the best representation ofthe data as a whole.
Many people find it easiest to draw a smooth curve if they place the graph so thattheir hand is inside the curve (Figure 12.14).
Figure 12.14: Drawing a smooth curved graph by placing your hand inside thecurve.
119

0 2 4 6 8 10 12 14 16 18 20 22 240
20
40
60
80
100
120
140
160
180
200
220
240
260
280
300
320
volu
me/
ml
elapsed time/min
A graph to show the variation of the volume ofyeast mixture with elapsed time, at 25 ûC.
Figure 12.15: The completed graph.
The completed graph for the data in Table 12.1 isshown in Figure 12.15, with a smooth curve drawnto represent the points. Note the point with anelapsed time of 12 minutes and a volume of 200 ml.This point does not seem to follow the general trend;it is probably the result of a measurement error dur-ing the experiment. It is best to ignore such pointswhen drawing best-fit curves.
120
Equations and Symbols 13The word ‘equation’ is used for an expression containing an equals sign. Thequantities under consideration may be described in words, for example
average speed =distance travelled
time taken
in which case the equation is known as a ‘word equation’, or represented by sym-bols, for example
v =dt
but the important thing to remember is that what is written on the left-hand sideof the ‘=’ sign must always be equal to what is written on the right-hand side.Thus, as explained in Section 14.5, you should never use ‘=’ as a shorthand foranything other than ‘equals’.
121

You know (from Section 6.1) that, for squares and rectangles, the area is found bymultiplying the length by the width and that, for rectangular block-like structures,the volume is found by multiplying its length by its width by its height.
QuestionWrite word equations (i.e. expressions involving an equals sign like that givenabove for average speed) for the area of a rectangle and the volume of a rect-angular block.
AnswerArea = length times width,i.e. area = length × width (or equivalently, area = width × length).
Volume = length times width times height,i.e. volume = length × width × height
Writing out all of these words is rather tiresome. However, equations can beexpressed far more compactly if each word is replaced with a single letter, so theequation for the volume of a rectangular block might become:
V = l × w × h
where V represents volume, l represents length, w represents width and h repre-sents height.
122
Question
Rewrite the word equation density =mass
volume, using letters instead of words.
AnswerThe choice of letters was left up to you, so there is no single right answer. Ifyou chose the symbol d to represent density, m to represent mass and v to rep-resent volume, your equation will be d =
mv
. (Note that the letter representinga quantity such as mass is usually written in italics (m in this case). This isparticularly important where a symbol is also used as an abbreviation for aunit, for example, m for metre.)
It is reasonable to use the first letter of each quantity (e.g. m for mass). It makesthe choice of letter more memorable and this is a perfectly acceptable answer.However, d for density might be confused with d for distance and v for volumemight be confused with v for velocity. So, scientists try to reserve one letter foreach commonly used quantity. Unfortunately, there aren’t enough letters in thealphabet, so it is conventional to use the Greek letter ρ (pronounced ‘rho’) torepresent density and a capital V to represent volume, so the equation for densitybecomes:
ρ =mV
(13.1)
123

Similarly, speed is conventionally represented by v (for ‘velocity’), so using d fordistance travelled and t for time taken, the equation for speed becomes:
v =dt
(13.2)
There is one more convention that you need to know about:
When using symbols instead of words or numbers, it is conventional to omitthe multiplication sign, ‘×’.
So, the equation for the volume of a rectangular block becomes:
V = lwh (13.3)
where V represents volume, l represents length, w represents width and h repre-sents height.
Equations 13.1, 13.2 and 13.3 will enable you to calculate density, average speedand the volume of a rectangular block.
124
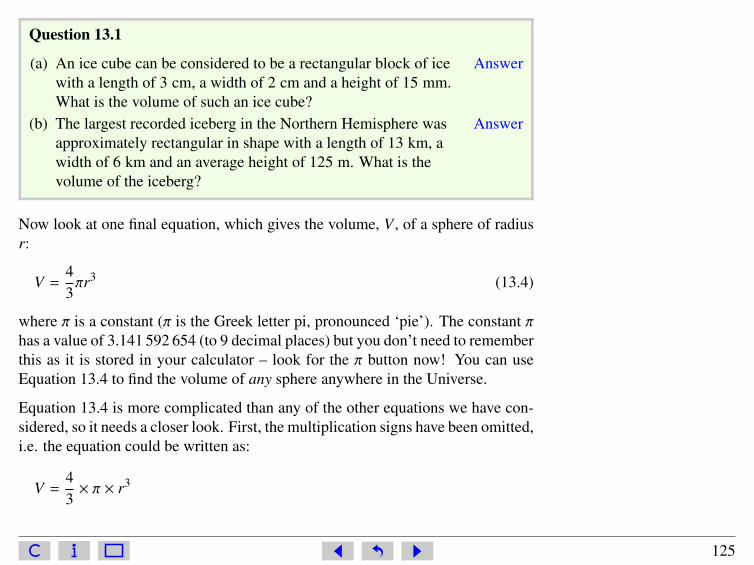
Question 13.1
(a) An ice cube can be considered to be a rectangular block of icewith a length of 3 cm, a width of 2 cm and a height of 15 mm.What is the volume of such an ice cube?
Answer
(b) The largest recorded iceberg in the Northern Hemisphere wasapproximately rectangular in shape with a length of 13 km, awidth of 6 km and an average height of 125 m. What is thevolume of the iceberg?
Answer
Now look at one final equation, which gives the volume, V , of a sphere of radiusr:
V =43πr3 (13.4)
where π is a constant (π is the Greek letter pi, pronounced ‘pie’). The constant πhas a value of 3.141 592 654 (to 9 decimal places) but you don’t need to rememberthis as it is stored in your calculator – look for the π button now! You can useEquation 13.4 to find the volume of any sphere anywhere in the Universe.
Equation 13.4 is more complicated than any of the other equations we have con-sidered, so it needs a closer look. First, the multiplication signs have been omitted,i.e. the equation could be written as:
V =43× π × r3
125

Also, note that the radius term, r, is cubed: the powers notation, already intro-duced for numbers and units, can be used for symbols too.
r3 = r × r × r
However, note that only the r is cubed, not the 43 or the π, so when you substitute
values into Equation 13.4, you need to take care to calculate:
V =43× π × r × r × r
Raindrops are approximately spherical and they have a diameter of about 2 mm,i.e. a radius of about 1 mm. Using Equation 13.4, find the volume, in metre3, ofa typical raindrop:
r = 1 mm = 1 × 10⁻³ m
so
V =43πr3
=43× π × (1 × 10⁻³ m)3
= 4.188 790 205 × 10−9 m3
This is about 4 × 10⁻⁹ m3. Check that you can obtain this value for yourself,taking special care to cube both 1 × 10⁻³ and its units (m).
126

QuestionThe Earth can be thought of as a sphere with a radius of 6.4 × 10⁶ m. UseEquation 13.4 to find a value for the volume of the Earth.
AnswerUsing Equation 13.4:
V =43πr3
=43× π × (6.4 × 10⁶ m)3
= 1.098 066 219 × 1021 m3
So, the Earth has a volume of about 1.1 × 10²¹ m3.
Question 13.2 Answer
Using Equation 13.4, what is the volume of a hailstone with a diameter of1 cm? Write out your calculation in the style recommended in Section 14.5showing each step of the calculation, and give your answer to one significantfigure.
127
Tips for tackling mathematicalquestions 14Many students struggle to answer mathematical questions in science modules. The follow-ing tips may help:
14.1 Getting started
1. Read the question carefully and make sure that you understand what you are beingasked to do. There are a number of keywords (‘process words’) you should lookout for, since they give clues as to what is expected. Some commonly encounteredprocess words are explained in Table 14.1.
2. Write down the values and equations that have been given in the question, and alsowrite down what it is that you are trying to find.
3. It can be helpful to draw a diagram of the situation.
4. Think carefully about how you are going to get from what you have been told in thequestion to what you are trying to find. What other equations etc. might be useful?(Write them down too). Try to devise a strategy for answering the question.
128
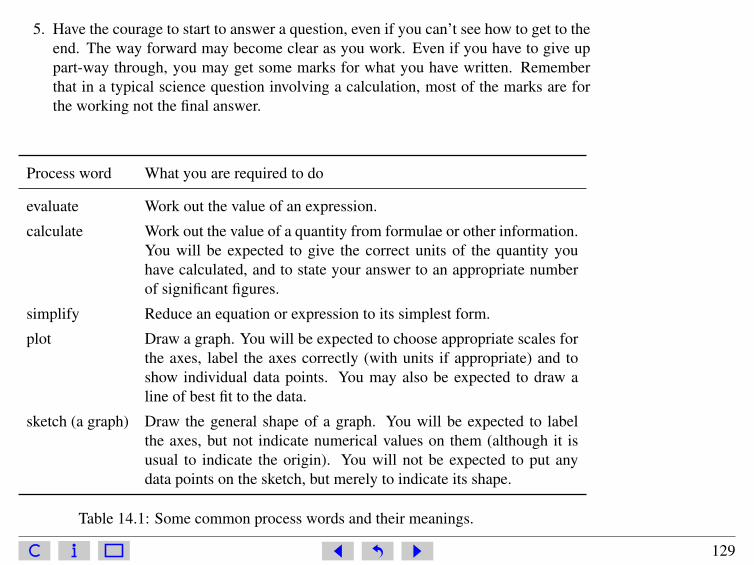
5. Have the courage to start to answer a question, even if you can’t see how to get to theend. The way forward may become clear as you work. Even if you have to give uppart-way through, you may get some marks for what you have written. Rememberthat in a typical science question involving a calculation, most of the marks are forthe working not the final answer.
Process word What you are required to do
evaluate Work out the value of an expression.
calculate Work out the value of a quantity from formulae or other information.You will be expected to give the correct units of the quantity youhave calculated, and to state your answer to an appropriate numberof significant figures.
simplify Reduce an equation or expression to its simplest form.
plot Draw a graph. You will be expected to choose appropriate scales forthe axes, label the axes correctly (with units if appropriate) and toshow individual data points. You may also be expected to draw aline of best fit to the data.
sketch (a graph) Draw the general shape of a graph. You will be expected to labelthe axes, but not indicate numerical values on them (although it isusual to indicate the origin). You will not be expected to put anydata points on the sketch, but merely to indicate its shape.
Table 14.1: Some common process words and their meanings.
129

14.2 Doing the calculation
1. Write down your working carefully even if you intend to write it out again. Use full-sized pieces of paper, not scraps; this makes your working much easier to follow andyou are less likely to make mistakes.
2. When you substitute numerical values, take care with units, scientific notation andsignificant figures.
14.3 Taking care with units
1. Make sure that the values you have been given are in units that are consistent witheach other. For example, it doesn’t make sense to multiply one length given in mmby another length given in cm. It is easier to convert all values to the same unit(frequently the SI base unit) before doing a calculation.
2. Each line of your calculation should include units as well as numbers.
3. The units of your answer should be consistent with the units attached to the valuesyou are using in the calculation. So, if you are multiplying three lengths, measuredin metres, the units of the answer will be m3; if you are dividing a distance in m by atime in s, the units of the answer will be m s−1
130

14.4 Does your answer make sense?
1. Is your answer about the size you expected? If you were finding the volume ofa cube with sides 1.57 m long, you would expect the answer to be between 1 m3
(1 m × 1 m × 1 m) and 8 m3 (2 m × 2 m × 2 m). If your answer was 3870 m3, youwould know that you had made a mistake.
2. If you followed the advice in point 3 of Section 14.3 ‘Taking care with units’, theunits of your answer should be consistent with any equation that you have used. Ifyou were trying to find a speed (correct SI units m s−1) and your answer had units ofm3, you would know that something had gone wrong.
3. These checks won’t guarantee that your answer is correct, but they will frequentlyhighlight when mistakes have been made.
14.5 Writing maths
1. Always write down your working as well as your final answer. If you need to sendyour answer to your tutor, it will help them to see what you did right and (if youmade a mistake) where you went wrong. Even if no one else looks at your working,writing it down will make it clearer to you if you need to refer back to the questionlater. Also, if your answer is written down in a methodical way you are less likely tomake a mistake and more likely to get the correct answer.
2. It is perfectly acceptable to write words of explanation in your answer – it doesn’t allhave to be symbols and numbers!
131
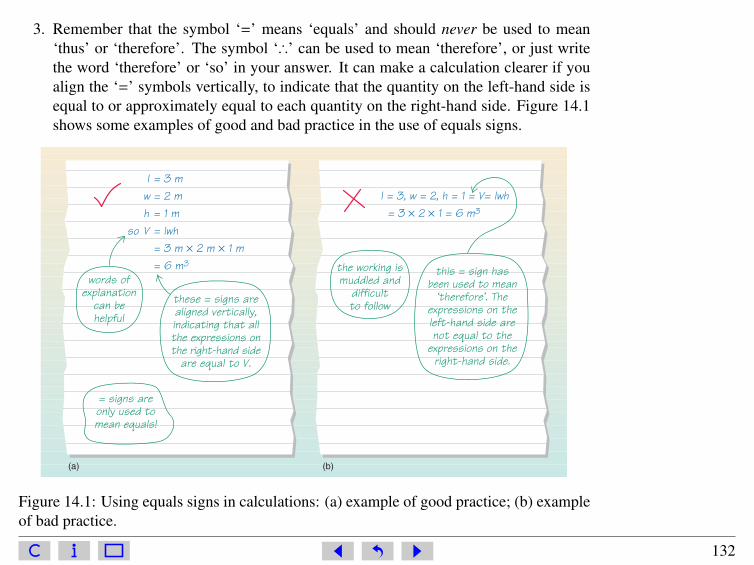
3. Remember that the symbol ‘=’ means ‘equals’ and should never be used to mean‘thus’ or ‘therefore’. The symbol ‘∴’ can be used to mean ‘therefore’, or just writethe word ‘therefore’ or ‘so’ in your answer. It can make a calculation clearer if youalign the ‘=’ symbols vertically, to indicate that the quantity on the left-hand side isequal to or approximately equal to each quantity on the right-hand side. Figure 14.1shows some examples of good and bad practice in the use of equals signs.
words ofexplanation
can behelpful
the working ismuddled and
difficultto follow
l = 3 m
w = 2 m
h = 1 m
so V = lwh
= 3 m × 2 m × 1 m
= 6 m3
l = 3, w = 2, h = 1 = V= lwh
= 3 × 2 × 1 = 6 m3
these = signs arealigned vertically,indicating that allthe expressions onthe right-hand side
are equal to V.
this = sign hasbeen used to mean
ÔthereforeÕ. Theexpressions on theleft-hand side arenot equal to the
expressions on theright-hand side.
= signs areonly used tomean equals!
(a) (b)
Figure 14.1: Using equals signs in calculations: (a) example of good practice; (b) exampleof bad practice.
132
Using your scientific calculator 15To give you a further indication of the different ways in which different calculatorsoperate, the following list (which is not intended to be exhaustive) explains howfour specific calculators can be used for several specific calculations.
• Calculator 1 The Casio fx-991 (an inexpensive modern scientific calcula-tor);
• Calculator 2 The Texas Instruments TI-30XA (a simple scientific calcula-tor);
• Calculator 3 The Texas Instruments TI-83 (a graphics calculator).
• Calculator 4 The Windows Calculator (likely to be installed on your com-puter already, and available under ‘All programs’ then ‘Accessories’). Notethat you should set the calculator to operate in scientific mode by selecting‘View’ then ‘Scientific’.
133

Simple calculations (Section 1)
To find 3 + 2 × 4:
On Calculator 1 you should press‘3’ then ‘+’ then ‘2’ then ‘×’ then ‘4’ then ‘=’;
On Calculator 2 you should press‘3’ then ‘+’ then ‘2’ then ‘×’ then ‘4’ then ‘=’;
On Calculator 3 you should press‘3’ then ‘+’ then ‘2’ then ‘×’ then ‘4’ then ‘ENTER’;
On Calculator 4 you should press‘3’ then ‘+’ then ‘2’ then ‘∗’ then ‘4’ then ‘=’.
The answer, on each occasion, should be given as 11. Calculators 1–3 ‘know’the rule that multiplications should be done before additions, as does Calculator4 provided it is set to operate in scientific mode.
134

Calculations with brackets (Section 1.3)
To find (3 + 2) × 4:
On Calculator 1 you should press‘(’ then ‘3’ then ‘+’ then ‘2’ then ‘)’ then ‘×’ then ‘4’ then ‘=’;
On Calculator 2 you should press‘(’ then ‘3’ then ‘+’ then ‘2’ then ‘)’then ‘×’ then ‘4’ then ‘=’;
On Calculator 3 you should press‘(’ then ‘3’ then ‘+’ then ‘2’ then ‘)’ then ‘×’ then ‘4’ then ‘ENTER’;
On Calculator 4 you should press‘(’ then ‘3’ then ‘+’ then ‘2’ then ‘)’ then ‘∗’ then ‘4’ then ‘=’.
The answer, on each occasion, is given as 20.
135
Raising a number to a power (Section 1.2)
To find 26:
On Calculator 1 you should press‘2’ then ‘x�’ then ‘6’ then ‘=’;
On Calculator 2 you should press‘2’ then ‘yx’ then ‘6’ then ‘=’;
On Calculator 3 you should press‘2’ then ‘ˆ’ then ‘6’ then ‘ENTER’;
On Calculator 4 you should press‘2’ then ‘xˆy’ then ‘6’ then ‘=’.
The answer, on each occasion, is given as 64.
136

Inputting negative numbers (Section 2)
To find 117 − (−38) + (−286):
On Calculator 1 you should press‘117’ then ‘−’ then ‘(−)’ ‘38’ then ‘+’ then ‘(−)’ then ‘286’ then ‘=’;
On Calculator 2 you should press‘117’ then ‘−’ then ‘38’ then ‘ + −’ then ‘+’ then ‘286’ then ‘ + −’ then ‘=’;
On Calculator 3 you should press‘117’ then ‘−’ then ‘(−)’ ‘38’ then ‘+’ then ‘(−)’ then ‘286’ then ‘ENTER’;
On Calculator 4 you should press‘117’ then ‘−’ then ‘38’ then ‘+/-’ then ‘+’ then ‘286’ then ‘+/-’ then ‘=’;
The answer, on each occasion, is given as −131.
137
Expressing answers in scientific notation (Section 7.3)
The answer to 2500 × 8000 is 20 000 000. To express this number in scientificnotation (2 × 10⁷) you should do the following:
On Calculator 1 you should press ‘Set up’ then ‘7’ (for scientific notation) then anumber between 0 and 9 for the number of digits you would like displayed. If youpress ’3’ the answer then appears as 2.00 × 10⁷. To return to non-scientific nota-tion press ‘Set up’ then ‘8’ (for normal) then ‘1’ (to select the range of numbersyou would like to be expressed in scientific notation even when everyday sizednumbers are given in decimal notation).
On Calculator 2 you should press ‘SCI’. The answer then appears as 2.07 (meaning2 × 107). To return to non-scientific notation press ‘FLO’.
On Calculator 3 you should press ‘MODE’ then ‘I’ to select ‘Sci’ then ‘ENTER’then ‘QUIT’. The answer then appears as 2E7 (meaning 2 × 10⁷). To return tonon-scientific notation press ‘MODE’ then ‘J’ to select ‘Normal’ then ‘ENTER’then ‘QUIT’.
On Calculator 4 you should press ‘F-E’. The answer then appears as 2.e+7 (mean-ing 2 × 10⁷). To return to non-scientific notation press ‘F-E’ again.
138

Calculating in scientific notation (Section 7.3)
To find1 × 108
2 × 10⁻¹⁷
On Calculator 1 you should press‘1’ then ‘×10x’ then ‘8’ then ‘÷’ then ‘2’ then ‘×10x’ then ‘(−)’ then ‘17’ then ‘=’.
The answer is given as 5 × 1024.
On Calculator 2 you should press‘1’ then ‘EE’ then ‘8’ then ‘÷’ then ‘2’ then ‘EE’ then ‘17’ then ‘ + −’ then ‘=’.
The answer is given as 524 (meaning 5 × 1024).
On Calculator 3 you should press‘1’ then ‘EE’ then ‘8’ then ‘÷’ then ‘2’ then ‘EE’ then ‘(−)’ then ‘17’ then ‘ENTER’.
The answer is given as 5E24 (meaning 5 × 1024).
On Calculator 4 you should press‘1’ then ‘Exp’ then ‘8’ then ‘/’ then ‘2’ then ‘Exp’ then ‘17’ then ‘+/-’ then ‘=’;
The answer is given as 5.e+24 (meaning 5 × 1024).
139

Answers
The following pages contain the answers to questions in the main text, which willnormally be accessed using links from the main text.
140
Question 1.1 (a)
283 + 729 = 1012
{Click on the question number to return to the main text.}
141

Question 1.1 (b)
38 + 92 − 61 = 69
{Note that you do not have to press ‘=’ after the first addition (38 + 92), thoughif you do the final answer should be the same; check this for yourself.}
142

Question 1.1 (c)
761 × 13 = 9 893
143

Question 1.1 (d)
94 ÷ 47 = 2
144

Question 1.1 (e)
24 × 32 × 8 = 6 144
145

Question 1.1 (f)
24 × 32 ÷ 8 = 96
146

Question 1.2 (a)
The multiplication should be done before the addition, so
3 × 4 + 2 = 12 + 2 = 14
147
Question 1.2 (b)
The multiplication should be done before the addition, so
2 + 4 × 3 = 2 + 12 = 14
{Note that the answers to (a) and (b) are the same. This is because addition andmultiplication are individually commutative, i.e. 3 × 4 is the same as 4 × 3 and12 + 2 is the same as 2 + 12. Remember though that the multiplication must bedone before the addition.}
148

Question 1.2 (c)
The division should be done before the addition, so
35 ÷ 5 + 2 = 7 + 2 = 9
149
Question 1.2 (d)
The division and multiplication should be done before the subtraction, so
4 × 2 − 21 ÷ 7 = 8 − 3 = 5
150

Question 1.3 (a)
33 = 3 × 3 × 3 = 27
151

Question 1.3 (b)
The 52 should be evaluated first, and 52 = 5 × 5 = 25.
Then 3 × 52 = 3 × 25 = 75
152
Question 1.3 (c)
The 23 and 32 should be evaluated first.
23 = 2 × 2 × 2 = 8 and 32 = 3 × 3 = 9.
Then 23 × 32 = 8 × 9 = 72
153

Question 1.3 (d)
The 32 and 42 should be evaluated first.
32 = 3 × 3 = 9 and 42 = 4 × 4 = 16.
Then 32 + 42 = 9 + 16 = 25
154

Question 1.4 (a)
Working from left to right gives
26 − 12 + 4 = 14 + 4 = 18
155

Question 1.4 (b)
The multiplication should be done before the addition, so
16 + 12 × 2 = 16 + 24 = 40
156
Question 1.4 (c)
The bracket should be evaluated first, so
(16 + 12) × 2 = 28 × 2 = 56
157
Question 1.4 (d)
The multiplication should be done before the subtraction, so
35 − 7 × 2 = 35 − 14 = 21
158

Question 1.4 (e)
The bracket should be evaluated first, so
(35 − 7) × 2 = 28 × 2 = 56
159

Question 1.4 (f)
Working from left to right gives
180 ÷ 10 × 3 = 18 × 3 = 54
160

Question 1.4 (g)
The bracket should be evaluated first, so
180 ÷ (10 × 3) = 180 ÷ 30 = 6
161

Question 1.4 (h)
The bracket should be evaluated first, so
(4 × 3)2 = 122 = 144
162

Question 1.4 (i)
The term including an exponent, 32, should be evaluated first, so
4 × 32 = 4 × 9 = 36
163

Question 1.4 (j)
The innermost brackets should be evaluated first, so
{(10 + 5) × (3 + 1)} + 4 = {15 × 4} + 4 = 60 + 4 = 64
164
Question 1.5 (a)18 + 6
3=
243
= 8
165

Question 1.5 (b)183
+ 6 = 6 + 6 = 12
166

Question 1.5 (c)
20/4 + 6 = 5 + 6 = 11
167

Question 1.5 (d)
20/(4 + 6) = 20/10 = 2
168

Question 1.5 (e)√
16 + 9 =√
25 = 5
169

Question 1.5 (f)√
16 +√
9 = 4 + 3 = 7
170

Question 1.5 (g)
3(8 − 3) means 3 × (8 − 3), so 3(8 − 3) = 3 × 5 = 15
171

Question 1.5 (h)
(8 − 4)(3 + 5) means (8 − 4) × (3 + 5), so (8 − 4)(3 + 5) = 4 × 8 = 32
172

Question 2.1 (a)
65 ◦C
173

Question 2.1 (b)
57 ◦C
174
Question 2.1 (c)
−57 ◦C
175

Question 2.1 (d)
65 ◦C
176

Question 2.2
−210 ◦C, −85 ◦C, −27 ◦C, −26 ◦C, 0 ◦C, 85 ◦C, 210 ◦C, 1750 ◦C.
177

Question 2.3 (a)
(−3) × 4 = −12
178

Question 2.3 (b)
(−10) − (−5) = −5
179
Question 2.3 (c)
6 ÷ (−2) = −3
180

Question 2.3 (d)
(−12) ÷ (−6) = 2
181

Question 2.4 (a)
117 − (−38) + (−286) = −131
182

Question 2.4 (b)
(−1624) ÷ (−29) = 56
183
Question 2.4 (c)
(−123) × (−24) = 2952
184

Question 3.134
,6080
,75
100, and
300400
are all equivalent fractions; they can all be reduced to34
.
64
and38
are not equivalent to the other fractions or to each other; they havedifferent values.
185

Question 3.2 (a)
The ratio of women to men in the group is 8 : 15.
186

Question 3.2 (b)
The total number of students is 15 + 8 = 23, so8
23of the group are women.
187

Question 3.3 (a)
70%
{Remember, to convert a fraction to a percentage you multiply it by 100%; so7
10is equivalent to
710× 100% = 70%. }
188

Question 3.3 (b)
45%
189

Question 3.3 (c)
52%
190
Question 3.3 (d)
63%
191
Question 3.3 (e)
70%
192

Question 3.3 (f)
150%
{Note that this last answer is greater than 100%, because the fraction3020
(or32
)is greater than 1.}
193

Question 3.4 (a)
60% =60
100=
610
=35
{Here, we have first divided the top and bottom of the sixty-hundredths by 10,and then by 2. Remember that dividing (or multiplying) both the top and bottomof a fraction by any number will produce an equivalent fraction. It isconventional to express fractions with the smallest possible numbers on the topand bottom.}
194
Question 3.4 (b)
64% =64
100=
3250
=1625
{Here we have divided the top and the bottom of64
100by 2 and then 2 again,
which is the same as dividing by 4.}
195

Question 3.4 (c)
65% =65
100=
1320
196

Question 3.4 (d)
67% =67
100
{This time, there are no whole numbers by which we can divide both 67 and 100to produce smaller whole numbers on the top and bottom.}
197

Question 3.5 (a)25× 20 = 8
198

Question 3.5 (b)78× 24 = 21
199
Question 3.5 (c)
15% of 60 is15
100× 60 = 9
200

Question 3.5 (d)
60% of 5 is60100× 5 = 3
201

Question 3.6 (a)
23
+16
=2 × 63 × 6
+1 × 36 × 3
=1218
+318
=��15 5
��18 6=
56
202
Question 3.6 (b)
34−
16
=3 × 64 × 6
−1 × 46 × 4
=1824−
424
=��14 7
��24 12=
712
203

Question 3.7 (a)27÷
14
=27×
41
=2 × 47 × 1
=87
204

Question 3.7 (b)23÷
34
=23×
43
=2 × 43 × 3
=89
205

Question 3.7 (c)34÷ 5 =
34÷
51
=34×
15
=3 × 14 × 5
=3
20
206
Question 4.1 (a)
You can convert the fraction to the equivalent decimal number by dividing thenumber on the top of the fraction by the number on the bottom.
18
= 0.125
207

Question 4.1 (b)
You can convert the fraction to the equivalent decimal number by dividing thenumber on the top of the fraction by the number on the bottom.
14
= 0.25
208

Question 4.1 (c)
You can convert the fraction to the equivalent decimal number by dividing thenumber on the top of the fraction by the number on the bottom.
34
= 0.75
209
Question 4.1 (d)
You can convert the fraction to the equivalent decimal number by dividing thenumber on the top of the fraction by the number on the bottom.
110
= 0.1
This highlights the fact that the first number after the decimal point tells us the‘number of tenths’.
210

Question 4.1 (e)
You can convert the fraction to the equivalent decimal number by dividing thenumber on the top of the fraction by the number on the bottom.
210
= 0.2
This highlights the fact that the first number after the decimal point tells us the‘number of tenths’.
211

Question 4.1 (f)
You can convert the fraction to the equivalent decimal number by dividing thenumber on the top of the fraction by the number on the bottom.
310
= 0.3
This highlights the fact that the first number after the decimal point tells us the‘number of tenths’.
212
Question 4.1 (g)
You can convert the fraction to the equivalent decimal number by dividing thenumber on the top of the fraction by the number on the bottom.
1100
= 0.01
This highlights the fact that the second number after the decimal point tells usthe ‘number of hundredths’.
213

Question 4.1 (h)
You can convert the fraction to the equivalent decimal number by dividing thenumber on the top of the fraction by the number on the bottom.
3100
= 0.03
This highlights the fact that the second number after the decimal point tells usthe ‘number of hundredths’.
214

Question 4.1 (i)
You can convert the fraction to the equivalent decimal number by dividing thenumber on the top of the fraction by the number on the bottom.
5100
= 0.05
This highlights the fact that the second number after the decimal point tells usthe ‘number of hundredths’.
215
Question 4.1 (j)
You can convert the fraction to the equivalent decimal number by dividing thenumber on the top of the fraction by the number on the bottom.
31000
= 0.003
216

Question 4.2 (a)
To convert a decimal number between 0 and 1 to a fraction, you write the digitsthat follow the decimal point on the top of the fraction, and on the bottom of thefraction you write a 1 followed by the same number of zeros as there are digitsfollowing the decimal point. So for 0.7, you write 7 on the top of the fraction,and 10 on the bottom – one zero on the bottom because there is one digit on thetop of the fraction.
0.7 =710
217
Question 4.2 (b)
To convert a decimal number between 0 and 1 to a fraction, you write the digitsthat follow the decimal point on the top of the fraction, and on the bottom of thefraction you write a 1 followed by the same number of zeros as there are digitsfollowing the decimal point. So for 0.8, you write 8 on the top of the fraction,and 10 on the bottom – one zero on the bottom because there is one digit on thetop of the fraction. Both these numbers are divisible by two, so the fraction canbe simplified.
0.8 =810
=45
218
Question 4.2 (c)
To convert a decimal number between 0 and 1 to a fraction, you write the digitsthat follow the decimal point on the top of the fraction, and on the bottom of thefraction you write a 1 followed by the same number of zeros as there are digitsfollowing the decimal point. So for 0.2, you write 2 on the top of the fraction,and 10 on the bottom – one zero on the bottom because there is one digit on thetop of the fraction. Both these numbers are divisible by two, so the fraction canbe simplified.
0.2 =210
=15
219
Question 4.2 (d)
To convert a decimal number between 0 and 1 to a fraction, you write the digitsthat follow the decimal point on the top of the fraction, and on the bottom of thefraction you write a 1 followed by the same number of zeros as there are digitsfollowing the decimal point. So for 0.22, you write 22 on the top of the fraction,and 100 on the bottom – two zeros on the bottom because there are two digits onthe top of the fraction. Both these numbers are divisible by two, so the fractioncan be simplified.
0.22 =22
100=
1150
220
Question 4.2 (e)
To convert a decimal number between 0 and 1 to a fraction, you write the digitsthat follow the decimal point on the top of the fraction, and on the bottom of thefraction you write a 1 followed by the same number of zeros as there are digitsfollowing the decimal point. So for 0.222, you write 222 on the top of thefraction, and 1000 on the bottom – three zeros on the bottom because there arethree digits on the top of the fraction. Both these numbers are divisible by two,so the fraction can be simplified.
0.222 =222
1000=
111500
221

Question 4.3 (a)
79% =79
100= 0.79
222

Question 4.3 (b)
35% =35
100= 0.35
223

Question 4.3 (c)
3% =3
100= 0.03
224

Question 4.4 (a)
1.35 + 12.76 = 14.11
225

Question 4.4 (b)
24.31 − 13.94 = 10.37
226

Question 4.4 (c)
3.05 × 2.2 = 6.71
227

Question 4.4 (d)
499.56 ÷ 27.6 = 18.1
228

Question 4.5 (a)
0.3 to one decimal place; 0.26 to two decimal places; 0.265 to three decimalplaces.
229

Question 4.5 (b)
0.8 to one decimal place; 0.83 to two decimal places; 0.826 to three decimalplaces.
230

Question 4.5 (c)
21.1 to one decimal place; 21.12 to two decimal places; 21.118 to three decimalplaces.
231

Question 5.1 (a)
5 km = 5 000 m = 500 000 cm = 5 000 000 mm.
232
Question 5.1 (b)
3 kg = 3 000 g = 3 000 000 mg.
233
Question 5.1 (c)
25 s = 25 000 ms.
234

Question 5.2 (a)
4 000 g = 4 kg, since 1 000 g = 1 kg. So the calculation becomes7 kg + 4 kg = 11 kg.
Alternatively, we could calculate the answer in grams. In this case,7 kg = 7 000 g, and 7 000 g + 4 000 g = 11 000 g.
{The two answers are clearly equivalent: 11 kg = 11 000 g. Either one iscorrect.}
235

Question 5.2 (b)
55 cm − 40 mm = 55 cm − 4 cm = 51 cm.
Alternatively, 550 mm − 40 mm = 510 mm.
236
Question 5.2 (c)
20 s − 1 000 ms = 20 s − 1 s = 19 s.
Alternatively, 20 000 ms − 1 000 ms = 19 000 ms.
237

Question 5.3 (a)
3 mm × 2 mm = 6 mm2
238

Question 5.3 (b)
45 km ÷ 3 hour = 15 km/hour
239
Question 5.3 (c)
12 000 kg ÷ 2 m3 = 6 000 kg/m3
240

Question 5.3 (d)
10 km ÷ 2 km =10 ��km2 ��km
=102
= 5
241

Question 6.1
Area of the bottom of the pool is 6 m × 7 m = 42 m2.
Volume of the swimming pool is 6 m × 7 m × 2 m = 84 m3.
242

Question 6.2
Since 1 000 litres = 1 m3, then 2.5 million litres is
2 500 000 litres = 2 500 × 1 000 litres
= 2 500 × 1 m3
= 2 500 m3
243

Question 7.1 (a)
100 000 000 = 1.0 × 10⁸ when expressed in scientific notation
244

Question 7.1 (b)
400 000 000 000 = 4.0 × 10¹¹ when expressed in scientific notation
245

Question 7.1 (c)
35 000 = 3.5 × 10⁴ when expressed in scientific notation
246

Question 7.1 (d)
95 × 105 = 9.5 × 10⁶ when expressed in scientific notation
247

Question 7.1 (e)
0.51 × 103 = 5.1 × 10² when expressed in scientific notation
248
Question 7.2 (a)
7.3 × 104 = 73 000 when written out in full
249

Question 7.2 (b)
3.6 × 106 = 3 600 000 when written out in full
250

Question 7.2 (c)
4.44 × 105 = 444 000 when written out in full
251

Question 7.2 (d)
6.05 × 103 = 6 050 when written out in full
252

Question 7.3
150 000 000 000 = 1.5 × 10¹¹.
There are two ways of doing this. Starting with 1.5, the decimal point has to bemoved 11 places to the right to produce 150 000 000 000. Therefore the powermust be 11.
An alternative approach is to recognise that 1.5 has to be multiplied by 10 eleventimes to obtain 150 000 000 000. Again, this tells us that the power term must be1011.
253

Question 7.4 (a)
The starting point for quoting 0.000 000 000 25 in scientific notation is 2.5 (thenumber that lies between 1.0 and 9.9). The decimal point has to be moved tenplaces to the left to reach 0.000 000 000 25, so the power of ten must be −10 andthe answer 2.5 × 10⁻¹⁰ m.
254
Question 7.4 (b)
2.5 × 10⁻⁴ m
255

Question 7.4 (c)
First of all convert the fraction1
1 000 000into a decimal. This is 0.000 001. In
scientific notation this is 1 × 10⁻⁶ m. Alternatively,
11 000 000
m =1
106 m = 1 × 10⁻⁶ m
256

Question 7.4 (d)
3.5 × 10⁻³ m
257
Question 7.5 (a)
To find the decimal number corresponding to 7.3 × 10⁻⁴, the decimal point in 7.3has to be moved four places to the left to give 0.000 73. The alternative approachis to think of, and work out, 7.3 ÷ 10 ÷ 10 ÷ 10 ÷ 10.
258
Question 7.5 (b)
0.000 000 29.
259
Question 7.6 (a)
From the definition of the prefixes, 1 km = 1 000 m and 1 m = 1 000 mm. So
1 km = 1, 000 × 1 m= 1 000 × (1 000 mm)= 1 000 000 mm
= 106 mm
260

Question 7.6 (b)
Since 106 mm = 1 km, from the answer to Question 7.6(a), then
1 mm =1 km106 =
1106 km = 10−6 km
261
Question 7.7 (a)
(4.5 × 104) × (4.0 × 1011) = 1.8 × 10¹⁶
262
Question 7.7 (b)
(6.5 × 10−27) × (2.0 × 10−14) = 1.3 × 10−40
263

Question 7.7 (c)
108 ÷ (2 × 10⁻¹⁷) = 5 × 1024
If you obtained the incorrect answer 5 × 1025, it is likely that you entered10 × 108 instead of 108 into your calculator. Remember that 108 can be writtenas 1 × 10⁸.
264

Question 8.1 (a)1
2 × 2 × 2 × 2=
124 = 2−4
265

Question 8.1 (b)1
m ×m=
1m2 = m−2
266

Question 8.2 (a)
kilometres per hour = km/hour = km hour−1
Note that hour could be abbreviated to either h or hr, and that there is a spacebetween the units.
267

Question 8.2 (b)
milligrams per litre = mg/l = mg l−1
Note that there is a space between the units.
268
Question 8.2 (c)
kilograms per cubic metre = kg/m3 = kg m−3
Note that there is a space between the units.
269

Question 8.3 (a)
6.1 Tm = 6.1 × 10¹² m
270

Question 8.3 (b)
3.5 nm = 3.5 × 10⁻⁹ m
271

Question 8.3 (c)
1.7 µm = 1.7 × 10⁻⁶ m
272
Question 9.1 (a)
5.63 m is given to three significant figures.
273

Question 9.1 (b)
3 567.1 kg is given to five significant figures.
274

Question 9.1 (c)
17 µs is given to two significant figures.
275

Question 9.2 (a)
5.683
276

Question 9.2 (b)
5.7
Note that the digits following the ‘6’ round up, so the answer is 5.7 not 5.6.
277

Question 9.3 (a)
1.240 mm is given to four significant figures.
278

Question 9.3 (b)
0.019 mm is given to two significant figures. Initial zeros don’t count.
279

Question 9.3 (c)
10.009 5 mm is given to six significant figures.
280
Question 9.3 (d)
8.90 × 104 mm is given to three significant figures.
281

Question 9.4 (a)
0.43 m ÷ 1.2 s = 0.36 m s−1 (two significant figures)
282

Question 9.4 (b)
2.373 m × 3.6 m = 8.5 m2 (two significant figures)
283
Question 9.4 (c)
6 342 kg ÷ 2.42 m3 = 2.62 × 10³ kg m−3 (three significant figures)
284
Question 10.1 (a)
The number given in the second column of Table 10.1 on the same line as‘flushing lavatory’ is 44, and we attach the units ‘litres’ to this. So the averageperson uses 44 litres of water per day for this purpose.
285
Question 10.1 (b)
The entry in the third row from the bottom of the first column of the table is‘agriculture’, so the number 7, together with the table title and the columnheading, tells us that the use of water for agriculture in the UK is equivalent to 7litres per day for each person in the country.
286
Question 10.2
Remembering to incorporate the ‘1020 kg’ from the column heading, the mass ofUranus is 866 200 × 1020 kg. In scientific notation, this is 8.662 × 1025 kg tofour significant figures (since the decimal point needs to be moved an additionalfive places).
287
Question 11.1
10%(
110
)of 360◦ is 36◦ so the required angle is 36◦.
288

Question 11.2
We need to combine data from two of the height intervalsto obtain the answer. Reading from the vertical scale (notethat there are divisions marked for every 5 plants) there areabout 2 irises between 75 cm and 80 cm in height, andthere are about 7 irises between 80 cm and 85 cm inheight, so altogether there are approximately 9 irises ofless than 85 cm.
0
10
20
30
num
bero
fpla
nts
75 80 85 90 95 100 105 110 115 120height/cm
289
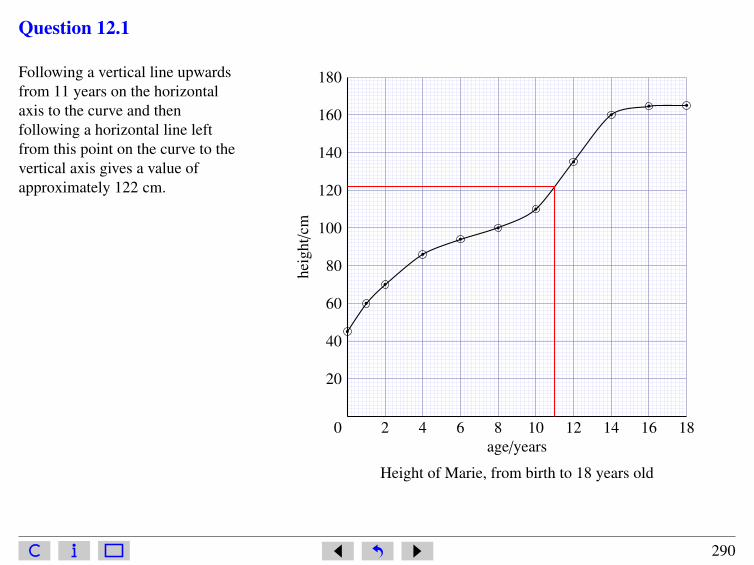
Question 12.1
Following a vertical line upwardsfrom 11 years on the horizontalaxis to the curve and thenfollowing a horizontal line leftfrom this point on the curve to thevertical axis gives a value ofapproximately 122 cm.
0 2 4 6 8 10 12 14 16 18
20
40
60
80
100
120
140
160
180
age/years
heig
ht/c
m
Height of Marie, from birth to 18 years old
290
Question 12.2 (a)
The subject of this graph is the volume of water flowing each second past a pointin a stream after heavy rain. {The title or caption is usually the best place to findout what a graph is showing.}
291

Question 12.2 (b)
Water flow, measured in litres per second, is plotted on the vertical axis.
0
50
100
150
200
00 04 08 12 16 20 24
time/hours
wat
erflo
w/li
tres
pers
econ
d
292

Question 12.2 (c)
Time is plotted on the horizontal axis, and this is measured in hours. {The24-hour clock has been used, so the period covered is 1 day.}
0
50
100
150
200
00 04 08 12 16 20 24
time/hours
wat
erflo
w/li
tres
pers
econ
d
293
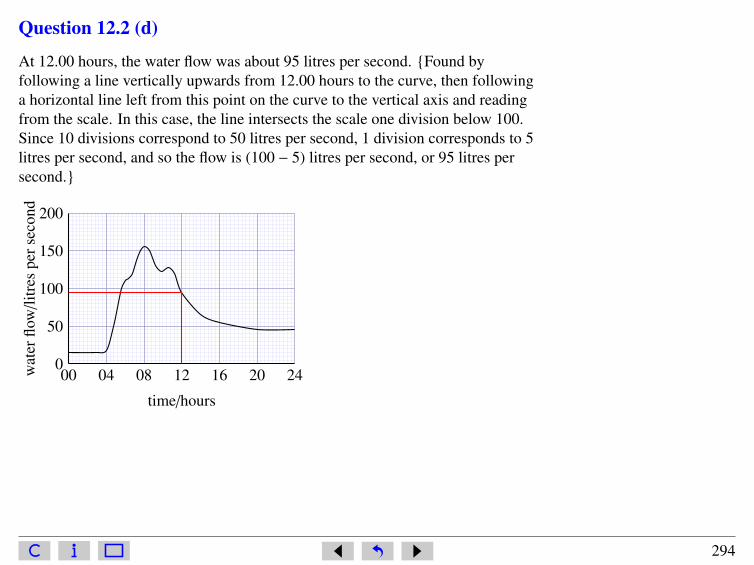
Question 12.2 (d)
At 12.00 hours, the water flow was about 95 litres per second. {Found byfollowing a line vertically upwards from 12.00 hours to the curve, then followinga horizontal line left from this point on the curve to the vertical axis and readingfrom the scale. In this case, the line intersects the scale one division below 100.Since 10 divisions correspond to 50 litres per second, 1 division corresponds to 5litres per second, and so the flow is (100 − 5) litres per second, or 95 litres persecond.}
0
50
100
150
200
00 04 08 12 16 20 24
time/hours
wat
erflo
w/li
tres
pers
econ
d
294

Question 12.2 (e)
The maximum flow was about 155 litres per second, and this occurred atapproximately 08.00 hours. {The maximum flow corresponds to the peak of thecurve; by drawing horizontal and vertical lines from the peak to the axes you canread off the flow and the time respectively.}
0
50
100
150
200
00 04 08 12 16 20 24
time/hours
wat
erflo
w/li
tres
pers
econ
d
295
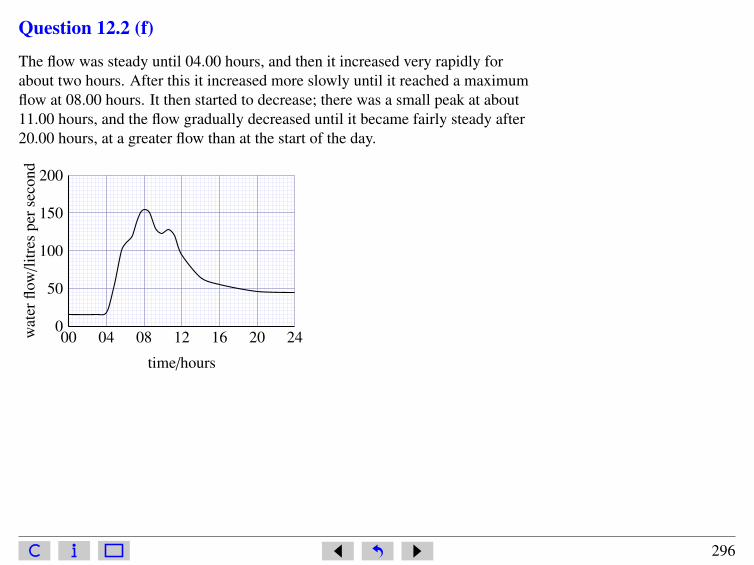
Question 12.2 (f)
The flow was steady until 04.00 hours, and then it increased very rapidly forabout two hours. After this it increased more slowly until it reached a maximumflow at 08.00 hours. It then started to decrease; there was a small peak at about11.00 hours, and the flow gradually decreased until it became fairly steady after20.00 hours, at a greater flow than at the start of the day.
0
50
100
150
200
00 04 08 12 16 20 24
time/hours
wat
erflo
w/li
tres
pers
econ
d
296
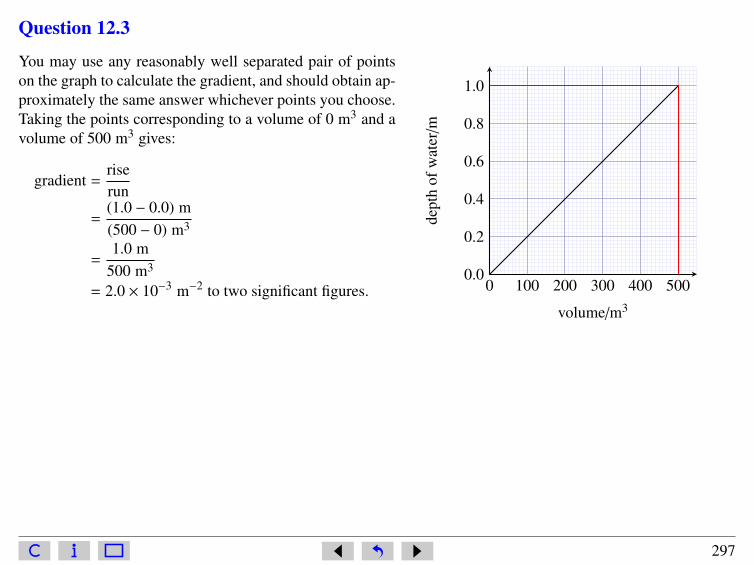
Question 12.3
You may use any reasonably well separated pair of pointson the graph to calculate the gradient, and should obtain ap-proximately the same answer whichever points you choose.Taking the points corresponding to a volume of 0 m3 and avolume of 500 m3 gives:
gradient =riserun
=(1.0 − 0.0) m(500 − 0) m3
=1.0 m
500 m3
= 2.0 × 10⁻³ m−2 to two significant figures. 0 100 200 300 400 5000.0
0.2
0.4
0.6
0.8
1.0
volume/m3
dept
hof
wat
er/m
297
Question 13.1 (a)
V = lwh
where V is volume, l is length, w is width and h is height. In this case:
l = 3 cmw = 2 cmh = 15 mm = 1.5 cm
Substituting these values into the equation gives:
V = lwh= 3 cm × 2 cm × 1.5 cm
= 9 cm3
So, the volume of the ice cube is 9 cm3.
Alternatively, you could start by converting the length, width and height tometres:
l = 3 cm = 3 × 10⁻² m
w = 2 cm = 2 × 10⁻² m
h = 15 mm = 15 × 10−3 m = 1.5 × 10⁻² m
298

Substituting these values into the equation gives:
V = lwh
= (3 × 10⁻² m) × (2 × 10⁻² m) × (1.5 × 10⁻² m)
= (3 × 10−2) × (2 × 10−2) × (1.5 × 10−2) m3
= 9 × 10⁻⁶ m3
So, the volume of the ice cube is 9 × 10⁻⁶ m3.
Since 1 cm = 1 × 10⁻² m, 1 cm3 = (1 × 10⁻² m)3 = 1 × 10⁻⁶ m3 so the answersobtained by the two methods are equivalent. An answer of 9000 mm3 is alsoacceptable.
299
Question 13.1 (b)
V = lwh
where V is volume, l is length, w is width and h is height. In this case:
l = 13 kmw = 6 kmh = 125 m = 0.125 km
Substituting these values into the equation gives:
V = lwh= 13 km × 6 km × 0.125 km
= 9.75 km3
So, the volume of the iceberg is 9.75 km3.
Alternatively, you could start by converting the length, width and height tometres:
l = 13 km = 13 × 103 m = 1.3 × 10⁴ m
w = 6 km = 6 × 10³ mh = 125 m
Substituting these values into the equation gives:
V = lwh
= (1.3 × 10⁴ m) × (6 × 10³ m) × (125 m)
= 9.75 × 10⁹ m3
300

So, the volume of the iceberg is 9.75 × 10⁹ m3.
Since 1 km = 1 × 10³ m, 1 km3 = (1 × 10³ m)3 = 1 × 10⁹ m3 so the answersobtained by the two methods are equivalent.
301
Question 13.2
The diameter of the hailstone is 1 cm, so its radius is 0.5 cm.
V =43πr3
=43× π × (0.5 cm)3
= 0.523 598 775 cm3
So, the volume of the hailstone is 0.5 cm3 to one significant figure.
Alternatively, you might have started by converting the radius to a value inmetres:
r = 0.5 cm = 0.5 × 10⁻² m = 5 × 10⁻³ m
Substituting this value into Equation 13.4 gives:
V =43πr3
=43× π × (5 × 10⁻³ m)3
= 5 × 10⁻⁷ m3 to one significant figure
The answers obtained by the two methods are equivalent. It is also reasonable togive a value for the volume of the hailstone in mm3 (500 mm3 to one significantfigure).
302

Indexangle, 96area, 59
bar charts, 97base number, 10BEDMAS, 14brackets, 12
calculator use, 3, 7, 24, 80cancelling fractions, 28centi (prefix), 53, 85checking answers, 18commutative, 148
decimal numbers, 42decimal places, 49degree, 96
equivalent fractions, 25exponent, 11
fractions, 16, 25, 35
gradient of graph, 107graphs, 99
histograms, 98
improper fractions, 29index (indices), 11interpolation, 105
kilo (prefix), 85
litre, 68
mass, 52, 55milli (prefix), 85
negative numbers, 19
order of arithmetic operations, 9
percentages, 32pie charts, 93powers, 10, 82powers of ten, 70proportion, 25
ratio, 30rounding, 49
303

scientific notation, 70, 80SI units, 51, 85significant figures, 86square root, 16straight line graph, 107
tables, 90
units, 51, 82
volume, 65
weight, 55
304
End of Maths Skills ebook.
305