maths skills practice for physics
DESCRIPTION
Maths Skills Practice for PhysicsTRANSCRIPT
PHYSICS
MATH SKILLS
BOOKLET
2012

Pag
e1
PRACTICE, PRACTICE, PRACTICE
You require certain maths skills to ensure your success in Stage 2 Physics. It is easy to forget basic skills;
this will prevent you from successfully solving physics problems. The good news is that practice assists the
retention of these skills, so practice, practice, practice!
It is likely that you may have forgotten some of these essential skills. It may be that you never learnt that
skill in the first place. When in doubt head straight to the YouTube or the Khan Academy website (do not
get distracted by facebook!) to look for a tutorial.
If you find the problems so hard you can’t do them or get them wrong - it is not a bad thing – it is only bad
if you fail to seek help. Getting problems wrong is a good thing – it helps you identify areas you need to
work on – mistakes are your friend – come and see me and make me feel useful!
It is possible that you may need refresher through the year – you can keep testing yourself by coming back
to this booklet. Questions are rated for difficulty - from easy to difficult to help you gauge your
level of understanding. You will be given an exercise book to do the answers in – keep the question booklet
with your answer booklet. At the end of each set self-evaluate.
TABLE OF CONTENTS SET A - Rearranging Equations ........................................................................................................................... 2
SET B - Significant figures ................................................................................................................................... 3
SET C - Rounding ................................................................................................................................................ 3
SET D - Scientific notation .................................................................................................................................. 4
SET E - Using Pythagoras Theorem .................................................................................................................... 5
SET F - Trignonometry ........................................................................................................................................ 6
SET G – Representing Vectors ............................................................................................................................ 7
SET H – Vector Addition and Subtraction .......................................................................................................... 7
SET I - Unit Conversions SI base units ................................................................................................................ 8
SET J - Slope of a line. ......................................................................................................................................... 9
SET K - Equation of a straight line. ................................................................................................................... 11
Set L - Interpreting graphs. (Proportional relationships) ................................................................................. 13
Self-evaluation
The problems too hard and I couldn’t do them –
I need HELP!
The problems were more hard than easy
The problems were more easy than hard
No problemo – too easy!
Self-evaluation
The problems too hard and I couldn’t do them – I need HELP!
The problems were more hard than easy
The problems were more easy than hard
No problemo – too
easy!

Pag
e2
SET A - REARRANGING EQUATIONS
RULE #1: You can add, subtract, multiply and divide by anything in an equation, as long as you do the same
thing to both sides of the equals sign. The equals sign acts like the fulcrum of a balance: if you add 5 of
something to one side of the balance, you have to add the same amount to the other side to keep the
balance steady.
RULE #2 When rearranging, make sure you follow this order:
1st + OR -
2nd x OR
3rd OR
Example
Rearrange the formula below to make t the subject.
First move u to the other side to leave the time (t) with the other letter a, we’re trying to make t the subject to do this we’ll have to make sure that t is on its own.
Now to leave t on its own we must divide both sides by a. Now we have;
Lastly we rewrite the equation with the t on the left-hand side
Rearrange the following equations to get the unknown on the left-hand side:
1) 2)
atvv if
3) 4) 5)
6) 7)
8) 9)
10)
11) 12)
13) 14)
2
2
1attvs i
15) 16)

Pag
e3
SET B - SIGNIFICANT FIGURES
Key Concepts
Zeros shown merely to locate a decimal point are NOT significant figures
eg 0.006
The last zeros in a whole number (not a decimal) are somewhat uncertain eg 6 000 000
Zeros located to the right of a number after decimal points are significant eg 0.00600
Zeros between two numbers are significant eg 200002
To find the number of significant figures in a given number: 1. count all the digits starting at the first non-zero digit on the left 2. for a number written in scientific notation count only the digits in the coefficient. Examples
0.1 (1 s.f.) 0.001 (1 s.f.) 0.100 (3 s.f.) 23 (2 s.f.) 2300 (could be 2 or 4 s.f)
How many significant figures are the following numbers written to?
1) 5 ml
2) 571kg
3) 5.71ms-1
4) 0.1V
5) 0.00023 Ω
6) 1.000 A
7) 3.7 x 105 mm
8) 1.0001s
9) 1.00010 ms
10) 5000 K
11) 1.234 mg
12) 0.00077 km
SET C - ROUNDING
When you perform a calculation you often end up with a whole register of numbers showing on your
calculator. It is not relevant to give an answer as 3.24637298 if the number does not reflect that degree of
precision or the resolution of the measurement. To truncate a number you may need to perform rounding.
If the digit to be dropped in rounding is less than 5, the preceding digit is not changed.
If the digit to be dropped in rounding is 5 or greater, the preceding digit is raised by 1.
Write 7.84625 to 1 sig fig 8
Write 7.84625 to 2 sig figs 7.8
Write 7.84625 to 3 sig figs 7.85
Write 7.84625 to 4 sig figs 7.846
Write 7.84625 to 5 sig figs 7.8463
may or may not be
significant
significant significantsignif
isignificant
not significant
significant
Pag
e4
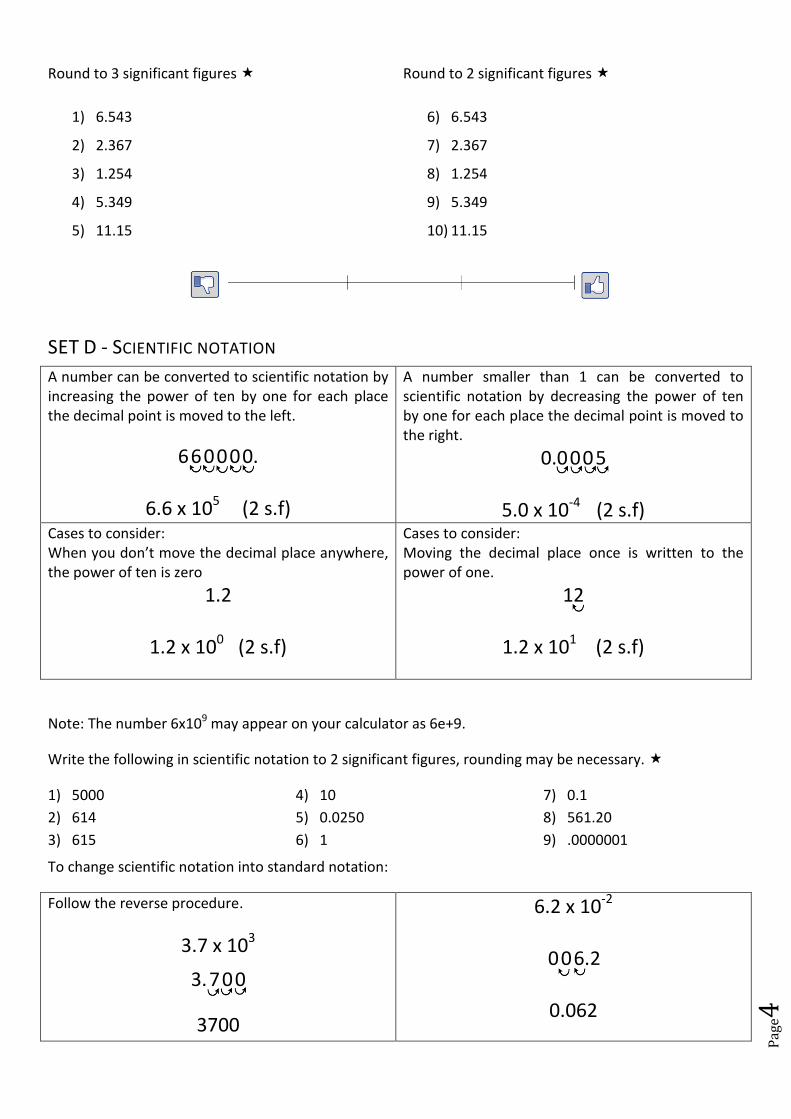
Round to 3 significant figures
Round to 2 significant figures
1) 6.543 6) 6.543
2) 2.367 7) 2.367
3) 1.254 8) 1.254
4) 5.349 9) 5.349
5) 11.15 10) 11.15
SET D - SCIENTIFIC NOTATION
A number can be converted to scientific notation by increasing the power of ten by one for each place the decimal point is moved to the left.
6 6 0 0 0 0.
6.6 x 10⁵ (2 s.f)
A number smaller than 1 can be converted to scientific notation by decreasing the power of ten by one for each place the decimal point is moved to the right.
0.0 0 0 5
5.0 x 10⁻⁴ (2 s.f)
Cases to consider: When you don’t move the decimal place anywhere, the power of ten is zero
1.2
1.2 x 100 (2 s.f)
Cases to consider: Moving the decimal place once is written to the power of one.
12
1.2 x 101 (2 s.f)
Note: The number 6x10⁹ may appear on your calculator as 6e+9.
Write the following in scientific notation to 2 significant figures, rounding may be necessary.
1) 5000
2) 614
3) 615
4) 10
5) 0.0250
6) 1
7) 0.1
8) 561.20
9) .0000001
To change scientific notation into standard notation:
Follow the reverse procedure.
3.7 x 10³
3. 7 0 0
3700
6.2 x 10⁻²
0 0 6.2 0.062

Pag
e5
Write the following in standard notation:
10) 3.0 x 10⁶
11) 3.30 x 101
12) 3.33 x 100
13) 6.6 x 10⁻¹
14) 6.6 x 10⁻³
15) 6.6 x 10⁻⁵
16) 1.2 x 10⁴
17) 3.0 x 10⁻²
18) 5.0 x 100
SET E - USING PYTHAGORAS THEOREM
In a right angle triangle, the square of the hypotenuse, c, is equal to the sum of the squares of the lengths
of the other two sides, a and b.
Find x
1)
2)
3)
4)
5)
6)
X 7cm
4cm
X
4.2cm 3.7cm
X
6.9m 5.3m
X
17m 22m
X
14cm
22cm
X 6cm
3cm
c
a
b
eg b = 8 c = 10 a = ?
= = = 6
Pag
e6
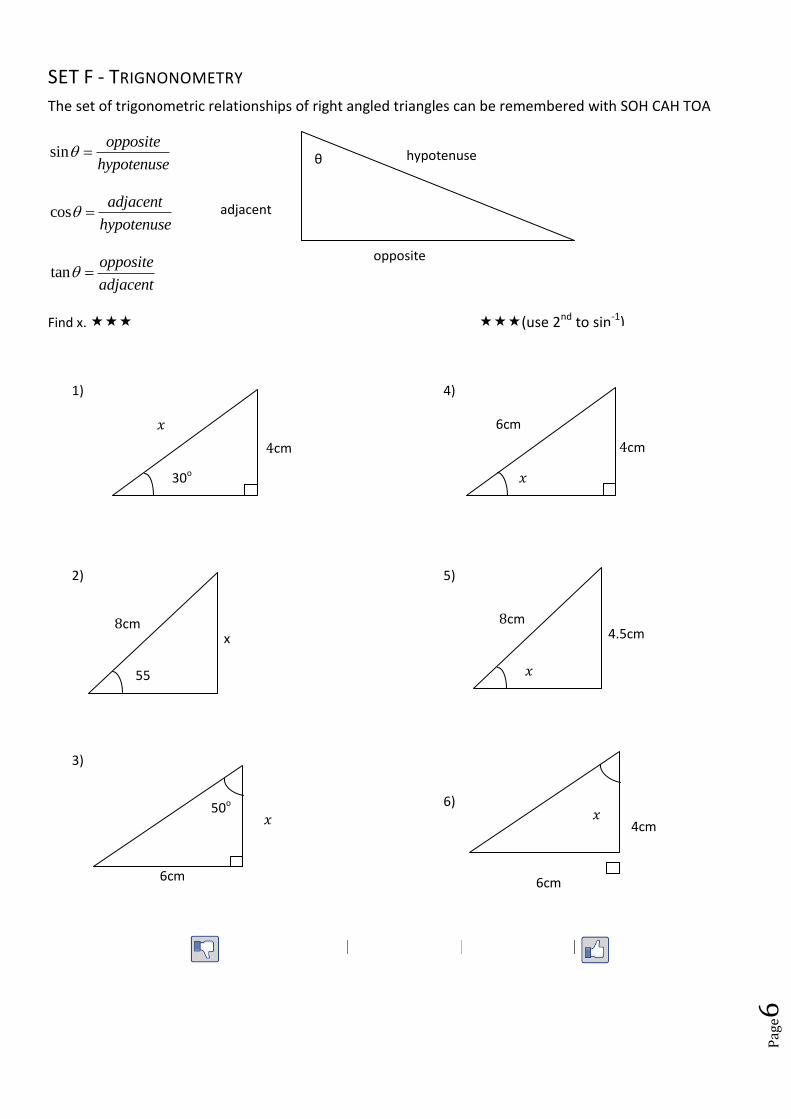
SET F - TRIGNONOMETRY
The set of trigonometric relationships of right angled triangles can be remembered with SOH CAH TOA
sinopposite
hypotenuse
cosadjacent
hypotenuse
tanopposite
adjacent
Find x. (use 2nd to sin-1)
1)
2)
3)
4)
5)
6)
hypotenuse
adjacent
opposite
θ
cm
30o
x cm
55o
6cm
50o
cm
6cm
4.5cm cm
6cm
4cm
Pag
e7
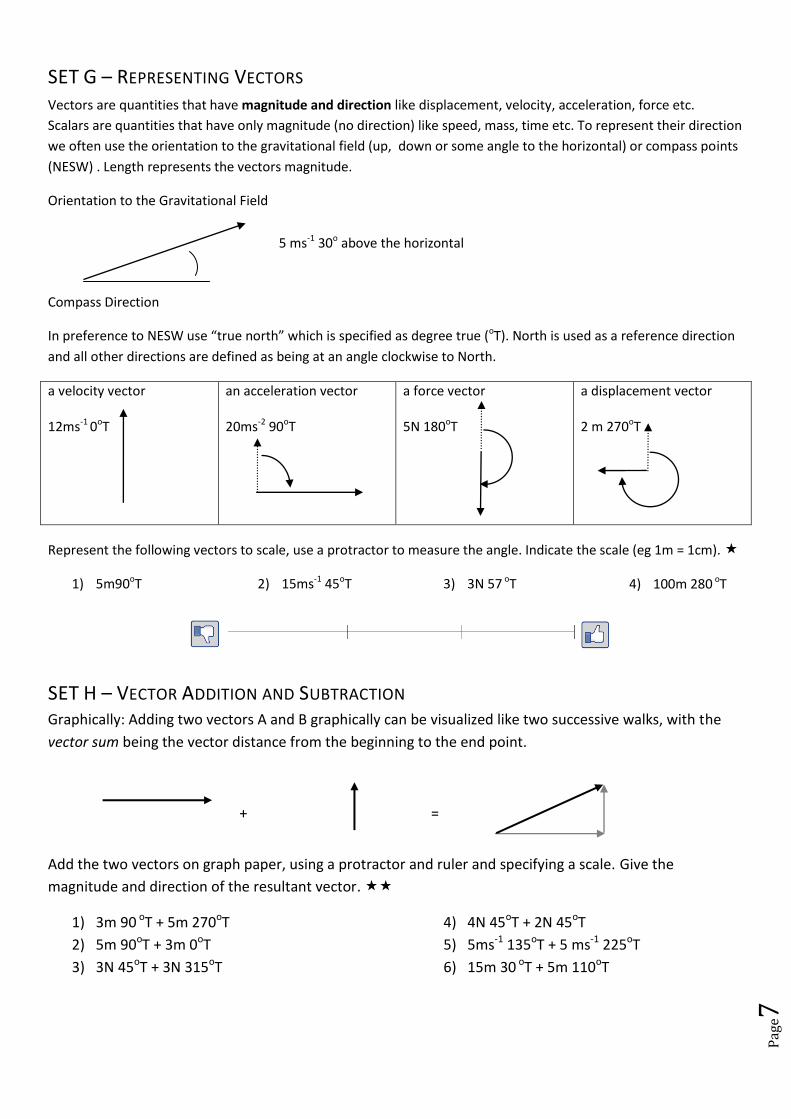
SET G – REPRESENTING VECTORS Vectors are quantities that have magnitude and direction like displacement, velocity, acceleration, force etc.
Scalars are quantities that have only magnitude (no direction) like speed, mass, time etc. To represent their direction
we often use the orientation to the gravitational field (up, down or some angle to the horizontal) or compass points
(NESW) . Length represents the vectors magnitude.
Orientation to the Gravitational Field
Compass Direction
In preference to NESW use “true north” which is specified as degree true (oT). North is used as a reference direction
and all other directions are defined as being at an angle clockwise to North.
a velocity vector 12ms-1 0oT
an acceleration vector 20ms-2 90oT
a force vector 5N 180oT
a displacement vector 2 m 270oT
Represent the following vectors to scale, use a protractor to measure the angle. Indicate the scale (eg 1m = 1cm).
1) 5m90oT 2) 15ms-1 45oT 3) 3N 57 oT 4) 100m 280 oT
SET H – VECTOR ADDITION AND SUBTRACTION Graphically: Adding two vectors A and B graphically can be visualized like two successive walks, with the
vector sum being the vector distance from the beginning to the end point.
+ =
Add the two vectors on graph paper, using a protractor and ruler and specifying a scale. Give the
magnitude and direction of the resultant vector.
1) 3m 90 oT + 5m 270oT
2) 5m 90oT + 3m 0oT
3) 3N 45oT + 3N 315oT
4) 4N 45oT + 2N 45oT
5) 5ms-1 135oT + 5 ms-1 225oT
6) 15m 30 oT + 5m 110oT
5 ms-1 30o above the horizontal
Pag
e8
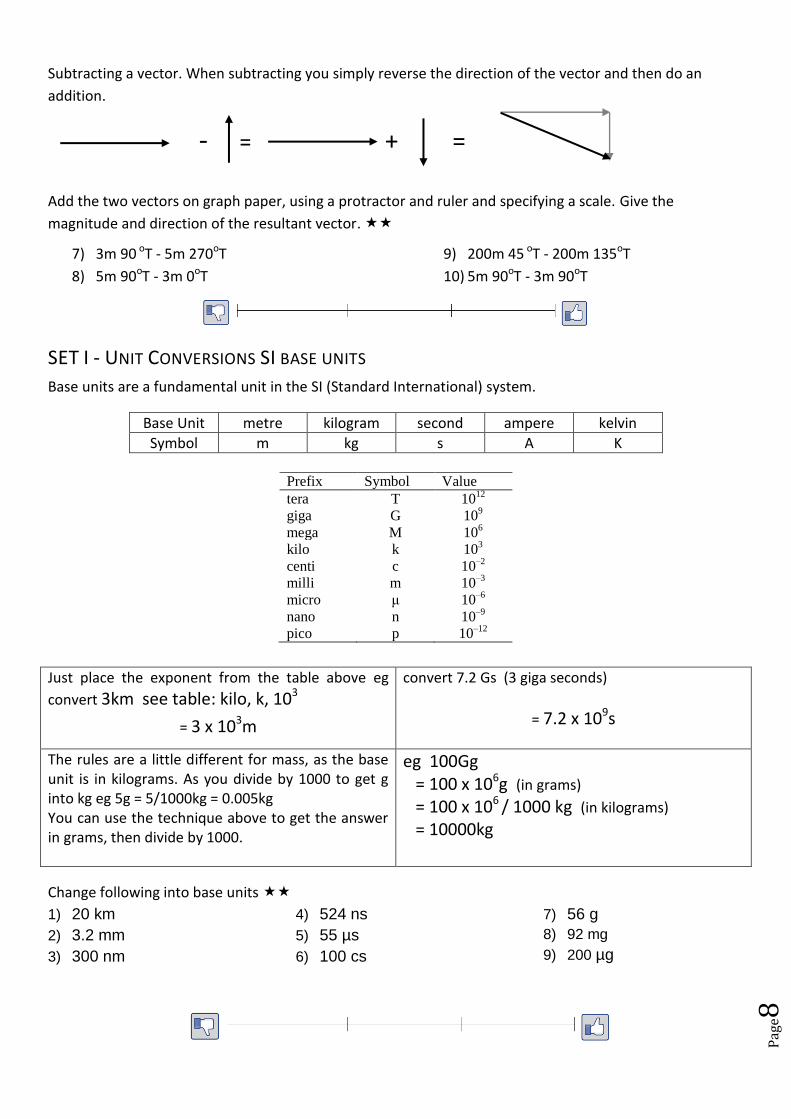
Subtracting a vector. When subtracting you simply reverse the direction of the vector and then do an
addition.
- = + =
Add the two vectors on graph paper, using a protractor and ruler and specifying a scale. Give the
magnitude and direction of the resultant vector.
7) 3m 90 oT - 5m 270oT
8) 5m 90oT - 3m 0oT
9) 200m 45 oT - 200m 135oT
10) 5m 90oT - 3m 90oT
SET I - UNIT CONVERSIONS SI BASE UNITS
Base units are a fundamental unit in the SI (Standard International) system.
Base Unit metre kilogram second ampere kelvin
Symbol m kg s A K
Prefix Symbol Value
tera T 1012
giga G 109
mega M 106
kilo k 103
centi c 10–2
milli m 10–3
micro μ 10–6
nano n 10–9
pico p 10–12
Just place the exponent from the table above eg
convert 3km see table: kilo, k, 103
= 3 x 10³m
convert 7.2 Gs (3 giga seconds)
= 7.2 x 10⁹s
The rules are a little different for mass, as the base unit is in kilograms. As you divide by 1000 to get g into kg eg 5g = 5/1000kg = 0.005kg You can use the technique above to get the answer in grams, then divide by 1000.
eg 100Gg = 100 x 106g (in grams) = 100 x 106 / 1000 kg (in kilograms)
= 10000kg
Change following into base units
1) 20 km
2) 3.2 mm
3) 300 nm
4) 524 ns
5) 55 µs
6) 100 cs
7) 56 g
8) 92 mg
9) 200 µg
Pag
e9
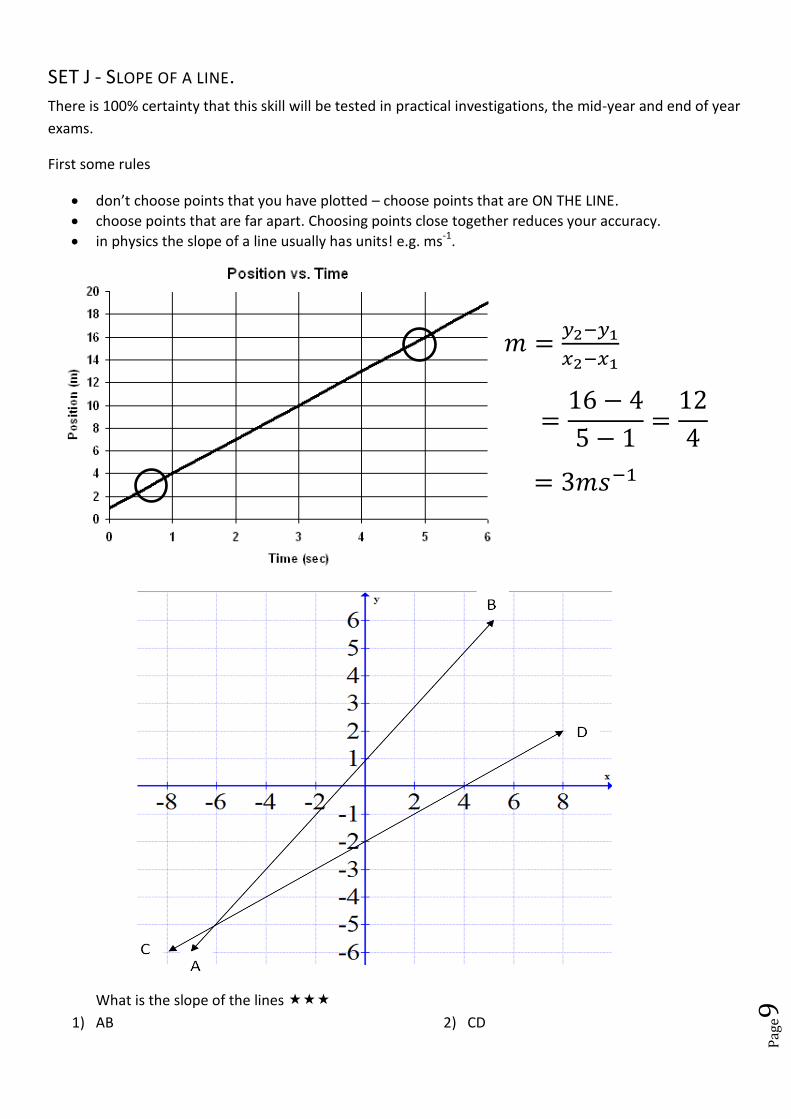
SET J - SLOPE OF A LINE.
There is 100% certainty that this skill will be tested in practical investigations, the mid-year and end of year
exams.
First some rules
don’t choose points that you have plotted – choose points that are ON THE LINE.
choose points that are far apart. Choosing points close together reduces your accuracy.
in physics the slope of a line usually has units! e.g. ms-1.
What is the slope of the lines
1) AB 2) CD

Pag
e10
3) What is the slope of the line above?
4) What are the appropriate units?
5) What is the slope of the line above?
6) What are the appropriate units?
Pag
e11
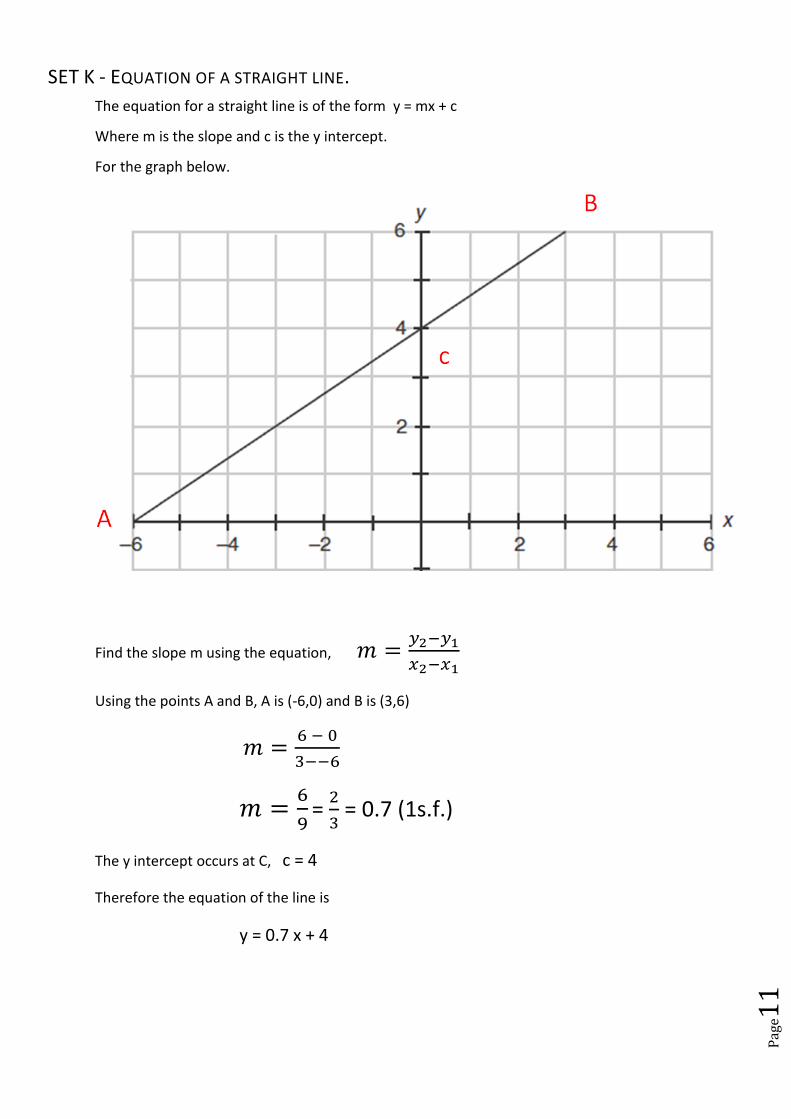
SET K - EQUATION OF A STRAIGHT LINE.
The equation for a straight line is of the form y = mx + c
Where m is the slope and c is the y intercept.
For the graph below.
Find the slope m using the equation,
Using the points A and B, A is (-6,0) and B is (3,6)
=
= 0.7 (1s.f.)
The y intercept occurs at C, c = 4
Therefore the equation of the line is
y = 0.7 x + 4
Pag
e12
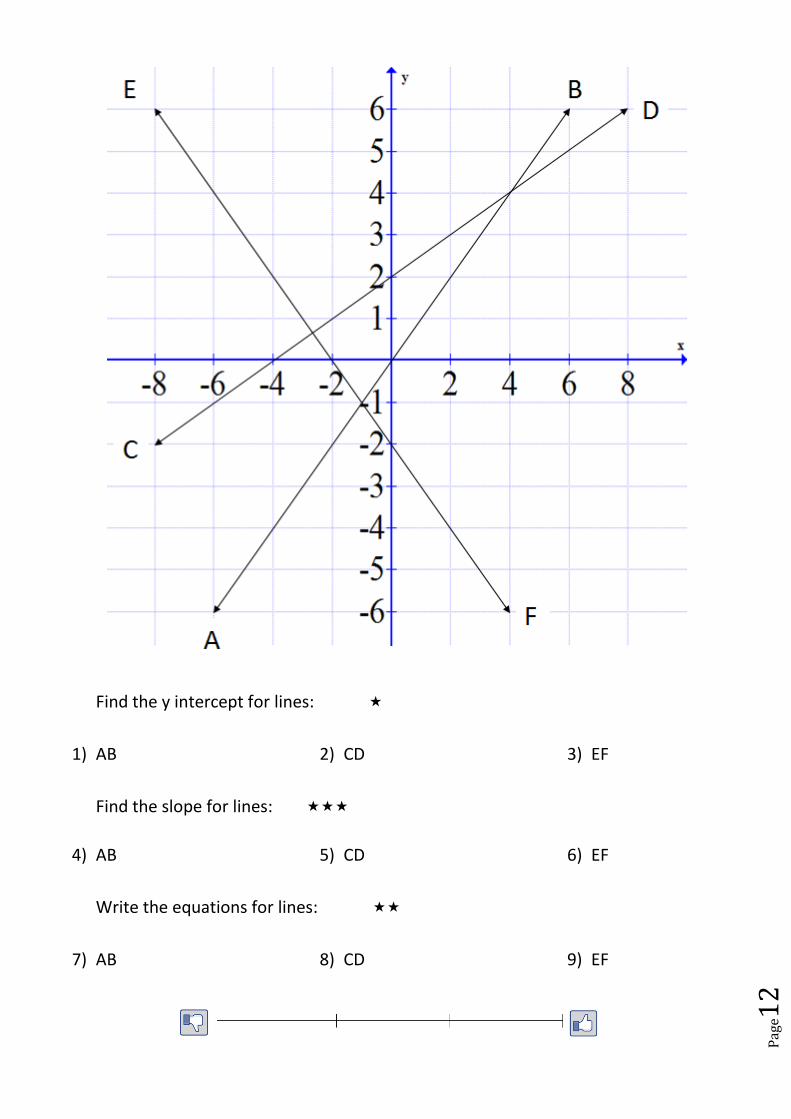
Find the y intercept for lines:
1) AB 2) CD 3) EF
Find the slope for lines:
4) AB 5) CD 6) EF
Write the equations for lines:
7) AB 8) CD 9) EF
Pag
e13
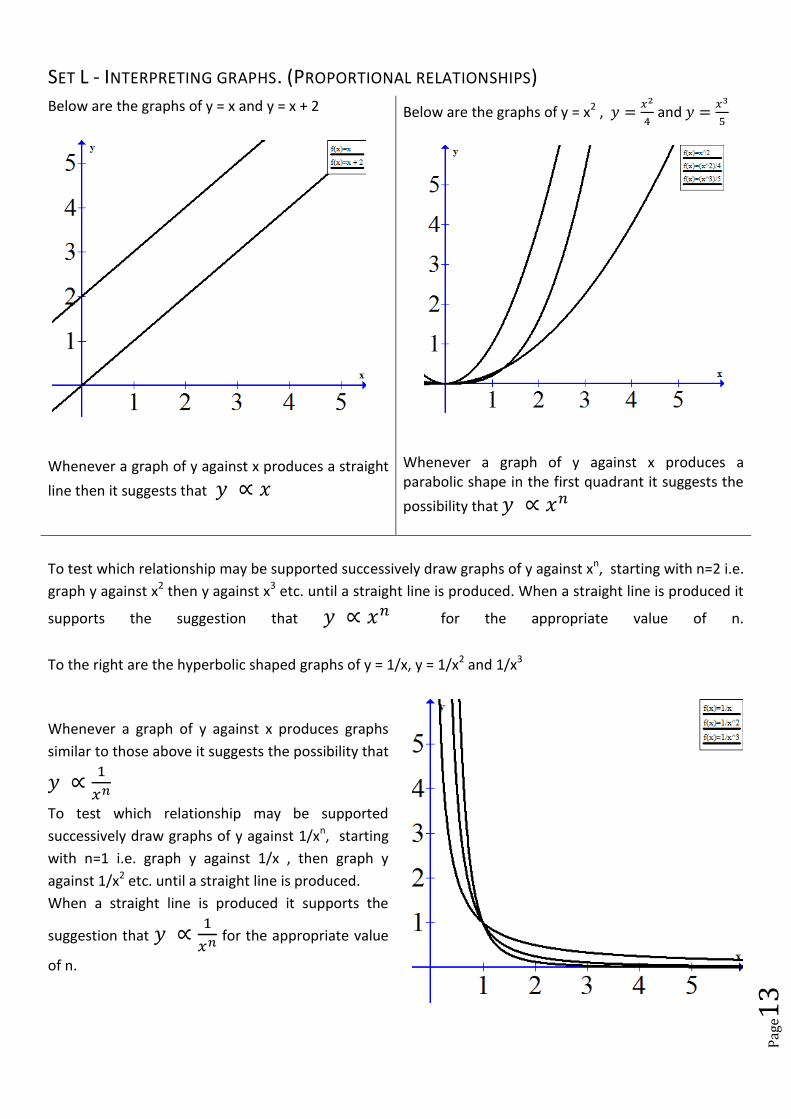
SET L - INTERPRETING GRAPHS. (PROPORTIONAL RELATIONSHIPS)
Below are the graphs of y = x and y = x + 2
Whenever a graph of y against x produces a straight
line then it suggests that
Below are the graphs of y = x2 ,
and
Whenever a graph of y against x produces a parabolic shape in the first quadrant it suggests the
possibility that
To test which relationship may be supported successively draw graphs of y against xn, starting with n=2 i.e.
graph y against x2 then y against x3 etc. until a straight line is produced. When a straight line is produced it
supports the suggestion that for the appropriate value of n.
To the right are the hyperbolic shaped graphs of y = 1/x, y = 1/x2 and 1/x3
Whenever a graph of y against x produces graphs
similar to those above it suggests the possibility that
To test which relationship may be supported
successively draw graphs of y against 1/xn, starting
with n=1 i.e. graph y against 1/x , then graph y
against 1/x2 etc. until a straight line is produced.
When a straight line is produced it supports the
suggestion that
for the appropriate value
of n.
Pag
e14
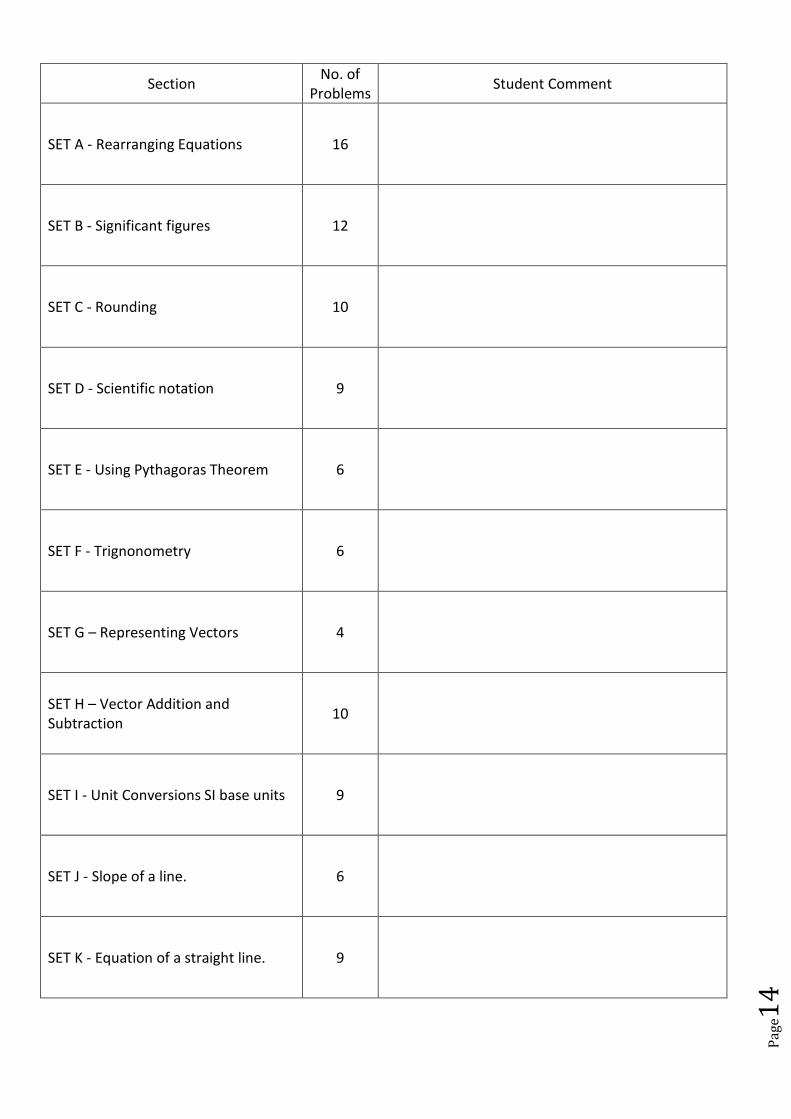
Section No. of
Problems Student Comment
SET A - Rearranging Equations 16
SET B - Significant figures 12
SET C - Rounding 10
SET D - Scientific notation 9
SET E - Using Pythagoras Theorem 6
SET F - Trignonometry 6
SET G – Representing Vectors 4
SET H – Vector Addition and Subtraction
10
SET I - Unit Conversions SI base units 9
SET J - Slope of a line. 6
SET K - Equation of a straight line. 9