mathematical practices and prior learning, current ...npsd.k12.ri.us/sites/default/files/np...
TRANSCRIPT

Adapted from the Charles A. Dana Center work with SORICO 2012
Common Core Standards Curriculum Map - Algebra II
Quarter One
Unit One - Linear Programming (8 days/4 blocks)
Common Core Standards and
Content to Be Learned
Mathematical Practices and
Essential Questions Prior Learning, Current Learning and Future Learning
Create equations that describe numbers or
relationships [Equations using all available types of
expressions, including simple root functions]. A-CED.2. Create equations in two or more variables to
represent relationships between quantities; graph
equations on coordinate axes with labels and scales. A-CED.3. Represent constraints by equations or
inequalities, and by systems of equations and/or
inequalities, and interpret solutions as viable or nonviable
options in a modeling context. For example, represent
inequalities describing nutritional and cost constraints
on combinations of different foods.
• Interpret the verbal model to define the variables and
write the objective function. • Represent constraints as equations or inequalities. • Graph systems of equations and/or inequalities on
coordinate axes with labels and scales and determine a
feasible region. • Identify important quantities in a practical situation and
map their relationships. • Interpret the corner points to find the optimal solution. • Identify and interpret solutions as viable or non-viable
options in a real-world context.
SMP 1 Make sense of problems
and persevere in solving them.
SMP 4 Model with
mathematics.
SMP 5 Use appropriate tools
strategically.
How does the feasible region
contribute to identifying
solutions to a problem?
How might the number of
constraints affect possible
solutions?
Prior Learning: In grades 7, 8, and 9, students graphed linear equations and inequalities
in two variables, solved 2 x 2 linear systems, graphed solutions to a
system of inequalities in two variables, created a mathematical model
from a verbal description, interpreted solutions, and determined
appropriate domains.
Current Learning: Students create a mathematical model from a verbal description. They
create equations and inequalities in one or two variables to represent
relationships between quantities. They represent constraints as equations
or inequalities. They graph systems of equations and/or inequalities on
coordinate axes with labels and scales, and interpret solutions as viable
or non-viable options in a modeling context.
Future Learning: Students will access prior knowledge when they determine the domain
that reflects the context of a situation and when they determine optimal
solutions. They will graph and interpret functions with more than one
variable, identify bounded and unbounded regions, and determine when
a problem has a unique solution, no solution, or infinitely many
solutions. This knowledge transfers to calculus and college-level
business courses.

Adapted from the Charles A. Dana Center work with SORICO 2012
Unit Two - Complex Numbers (6 days/3 blocks)
Common Core Standards and
Content to Be Learned
Mathematical Practices and
Essential Questions Prior Learning, Current Learning and Future Learning
Perform arithmetic operations with complex numbers. N-CN.1. Know there is a complex number i such that i2 = –1,
and every complex number has the form a + bi with a and b
real. N-CN.2. Use the relation i2 = –1 and the commutative,
associative, and distributive properties to add, subtract, and
multiply complex numbers.
Use complex numbers in polynomial identities and equations. N-CN.7. Solve quadratic equations with real coefficients that
have complex solutions.
• Use the definition i
2 = –1 to simplify radicals.
• Use the commutative, associative, and distributive properties
to add, subtract, and multiply complex numbers. • Solve quadratic equations with real coefficients that have
real and complex solutions. • Use the process of factoring and completing the square in
quadratic functions to show real and complex zeros.
SMP 6 Attend to precision.
SMP 7 Look for and make use
of structure.
Why do imaginary numbers exist?
When does a quadratic equation
have imaginary solutions?
Prior Learning: In prior courses, students have operated with rational number systems and have
understood the basic concepts of functions including linear and quadratic. In
eighth grade, students learned that there are numbers that are not rational, and
they approximated them by using rational numbers.
Current Learning: Building on A-REI.4a and A-REI.4b, students are introduced to the relation i
2=–1
and to the complex number system. Students solve quadratic equations and
inequalities with complex solutions, and they perform operations with complex
numbers.
Future Learning: Students will interpret and model quadratic relationships between two
quantities. They will use factoring, completing the square, and graphing to
identify zeros, intercepts, and intervals where the functions are increasing and
decreasing and positive and negative. Students will also find extreme values of
functions. A key feature in graphing will be recognizing that not all zeros of functions are x-
intercepts. In the fourth year course, students will apply the concepts of
complex roots to higher-degree polynomial functions, and they will apply the
Fundamental Theorem of Algebra. Students will use conjugates to find quotients
of complex numbers and represent complex numbers and their operations
geometrically on the complex plane.

Adapted from the Charles A. Dana Center work with SORICO 2012
Unit Three - Quadratic Functions (20 days/10 blocks)
Common Core Standards and
Content to Be Learned
Mathematical Practices and
Essential Questions Prior Learning, Current Learning and Future Learning
Use complex numbers in polynomial identities and equations. N-CN.7. Solve quadratic equations with real coefficients that
have complex solutions.
Create equations that describe numbers or relationships
[Equations using all available types of expressions including
simple root functions]. A-CED.1. Create equations and inequalities in one variable and
use them to solve problems.Include equations arising from
linear and quadratic functions, and simple rational and
exponential functions. A-CED.2. Create equations in two or more variables to
represent relationships between quantities; graph equations
on coordinate axes with labels and scales.
Build a function that models a relationship between two
quantities [For F.BF.1,2 linear; exponential and quadratic]. F-BF.3. Identify the effect on the graph of replacing f(x) by f(x)
+ k, k f(x), f(kx), and f(x + k) for specific values of k (both
positive and negative); find the value of k given the graphs.
Experiment with cases and illustrate an explanation of the
effects on the graph using technology. Include recognizing
even and odd functions from their graphs and algebraic
expressions for them. (Just as an informal discussion as an
introduction piece to the next unit.)
Interpret functions that arise in applications in terms of the
context [Emphasize selection of appropriate models]. F-IF.4. For a function that models a relationship between two
quantities, interpret key features of graphs and tables in terms
of the quantities, and sketch graphs showing key features
given a verbal description of the relationship. Key features
include: intercepts; intervals where the function is increasing,
decreasing, positive, or negative; relative maximums and
SMP 1 Make sense of problems
and persevere in solving them.
SMP 4 Model with mathematics.
SMP 7 Look for and make use of
structure.
What are the connections between
the algebraic solutions to a
quadratic equation in one variable
and the graph (including complex
solutions)?
What are the connections between
the solutions to a quadratic
equation in two variables, the table,
and the symmetry of the graph?
How do you identify when a real
world problem is quadratic?
Prior Learning: In algebra 1, students used the structure of an expression to factor the
difference of squares (A-SSE.2), and they factored quadratic expressions, found
function zeros, completed the square, and found function maximums and
minimums (A-SSE.3a and A-SSE.3b). Students completed the square to derive
the quadratic formula and to transform quadratic equations. They solved
quadratic equations by inspection, taking square roots, completing the square, using the quadratic formula, and
factoring. Students learned to recognize complex solutions and write them in
the form a ± bi for real numbers a and b (A-REI.4a and AREI4b). Previously in
algebra 2, students were introduced to the definition i 2= –1 and the complex
number system, and they solved quadratic equations and inequalities with
complex solutions; students also performed operations with complex numbers.
Current Learning: Students interpret and model quadratic relationships between two quantities.
They use factoring, completing the square, and graphing to identify zeros,
intercepts, and intervals where the functions are increasing and decreasing and
positive and negative, and they find extreme values. A key feature in graphing
is recognizing that not all zeros of functions are x-intercepts.
Future Learning: In the fourth-year course, students will apply the concepts of complex roots to
higher-degree polynomial functions and apply the Fundamental Theorem of
Algebra. The will use conjugates to find quotients of complex numbers and
represent complex numbers and their operations geometrically on the complex
plane.

Adapted from the Charles A. Dana Center work with SORICO 2012
minimums; symmetries; end behavior; and periodicity.★ F-IF.5. Relate the domain of a function to its graph and, where
applicable, to the quantitative relationship it describes. For
example, if the function h(n) gives the number of person-hours
it takes to assemble n engines in a factory, then the positive
integers would be an appropriate domain for the function.★
Analyze functions using different representations [Focus on
using key features to guide the selection of appropriate
models of the function]. F-IF.6. Calculate and interpret the average rate of change of a
function (presented symbolically or as a table) over a specified
interval. Estimate the rate of change from a graph.★ F-IF.8. Write a function defined by an expression in different
but equivalent forms to reveal and explain different properties
of the function. a. Use the process of factoring and completing the square in
a quadratic function to show zeros, extreme values, and
symmetry of the graph, and interpret these in terms of a
context. F-IF.9. Compare properties of two functions each represented
in a different way (algebraically, graphically, numerically in
tables, or by verbal descriptions). For example, given a graph
of one quadratic function and an algebraic expression for
another, say which has the larger maximum.
• Create equations and inequalities in one variable and use
them to solve quadratic problems. • Create and graph equations and inequalities in two variables
to represent quadratic relationships between quantities. • Interpret key features and sketch graphs of quadratic
relationships from verbal descriptions including zeros,
intercepts, intervals of increase and decrease, intervals of
positive and negative values, extreme values, symmetries, and
end behaviors. • Use the domain to determine the reasonableness of
solutions to quadratic applications. • Compare the properties of two quadratic functions, each
represented in a different way (i.e., one in algebraic form and
one in table form).

Adapted from the Charles A. Dana Center work with SORICO 2012
Unit Four - Functions Overview (6 days/3 blocks)
Common Core Standards and
Content to Be Learned
Mathematical Practices and
Essential Questions Prior Learning, Current Learning and Future Learning
Build a function that models a relationship between two
quantities [For F.BF.1,2 linear; exponential and quadratic]. F-BF.3. Identify the effect on the graph of replacing f(x) by f(x)
+ k, k f(x), f(kx), and f(x + k) for specific values of k (both
positive and negative); find the value of k given the graphs.
Experiment with cases and illustrate an explanation of the
effects on the graph using technology. Include recognizing
even and odd functions from their graphs and algebraic
expressions for them.
Interpret functions that arise in applications in terms of the
context [Emphasize selection of appropriate models]. F-IF.4. For a function that models a relationship between two
quantities, interpret key features of graphs and tables in terms
of the quantities, and sketch graphs showing key features
given a verbal description of the relationship. Key features
include: intercepts; intervals where the function is increasing,
decreasing, positive, or negative; relative maximums and
minimums; symmetries; end behavior; and periodicity.★ F-IF.5. Relate the domain of a function to its graph and, where
applicable, to the quantitative relationship it describes. For
example, if the function h(n) gives the number of person-hours
it takes to assemble n engines in a factory, then the positive
integers would be an appropriate domain for the function.★
Analyze functions using different representations [Focus on
key features to guide selection of appropriate models of the
function]. F-IF.7. Graph functions expressed symbolically and show key
features of the graph, by hand in simple cases and using
technology for more complicated cases.★
SMP 1 Makes sense of problems
and persevere in solving them.
SMP 4 Model with mathematics.
SMP 7 Look for and make use of
structure.
What are the effects on the graph
of replacing f(x) by f(x) + k, k f(x),
f(kx), and f(x + k) for specific values
of k (both positive and negative)?
How would you compare and
contrast the domain, range, rate,
and end behavior of the following
parent functions and
transformations of them: f(x) = x2,
f(x) = |x|, f(x) = √x, f(x) = x3, f (x) = x
3 , piecewise, and step functions?
What are the key features of any
function such as: minimums,
maximums, intercepts, and
increasing and decreasing intervals?
Prior Learning: In grade 8, students interpreted and constructed linear functions. In algebra 1,
students learned the concepts of a function and the use of function notation.
They have interpreted linear, exponential, and quadratic functions in
applications or in terms of a context. They have analyzed linear, exponential, quadratic, absolute value, step, and piecewise
functions using a graphical representation.
Current Learning: Students graph and identify key features of the parent functions f(x) = x2, f(x) =
|x|, f(x) = √x, f(x) = x3, f (x) = 3 x . They also graph piece-wise and step functions.
Future Learning: In the fourth-year course, students will analyze logarithmic and trigonometric
functions using different representations.

Adapted from the Charles A. Dana Center work with SORICO 2012
b. Graph square root, cube root, and piecewise-defined
functions, including step functions and absolute value
functions.
• Graph and identify key features of the parent functions f(x) = x
2, f(x) = |x|, f(x) = √x, f(x) = x
3, f (x) = 3 x .
• Explore transformations of selected functions. • Graph piece-wise and step functions. • Given a graph, determine domain, range, intercepts, end
behavior, minimums, maximums, symmetries, and intervals
where the function is positive, negative, increasing, decreasing,
and/or constant.

Adapted from the Charles A. Dana Center work with SORICO 2012
Adapted from the Charles A. Dana Center work with SORICO 2012
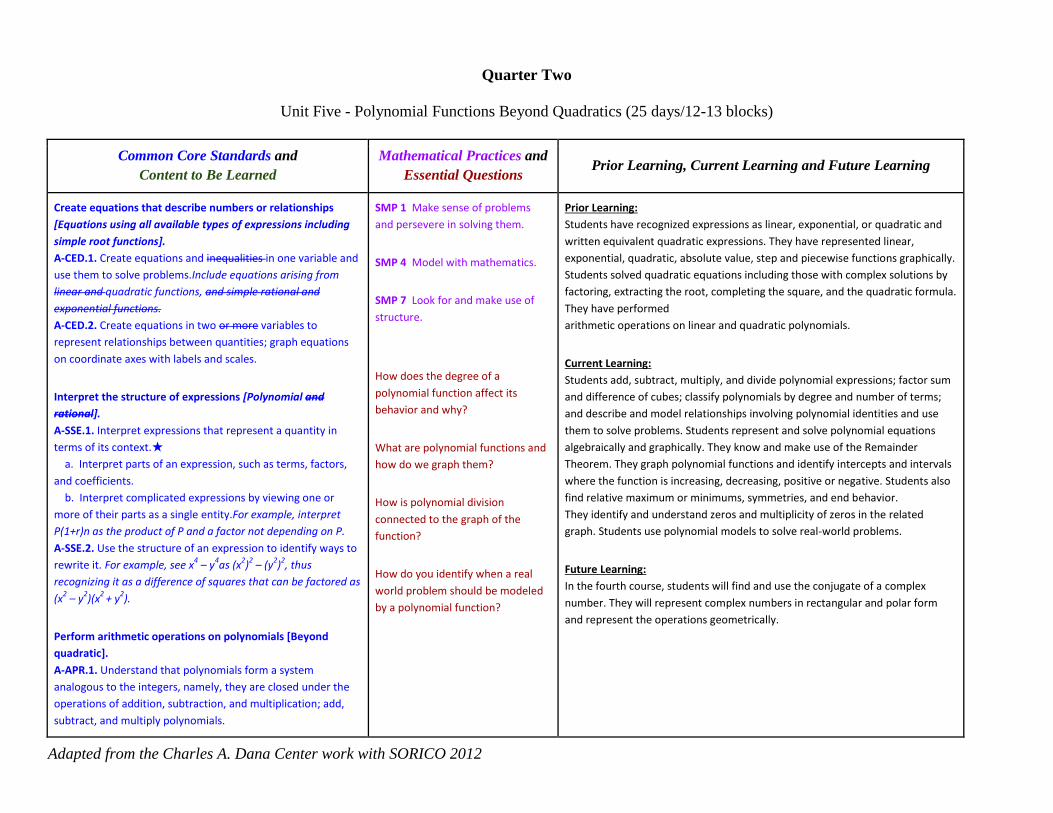
Quarter Two
Unit Five - Polynomial Functions Beyond Quadratics (25 days/12-13 blocks)
Common Core Standards and
Content to Be Learned
Mathematical Practices and
Essential Questions Prior Learning, Current Learning and Future Learning
Create equations that describe numbers or relationships
[Equations using all available types of expressions including
simple root functions]. A-CED.1. Create equations and inequalities in one variable and
use them to solve problems.Include equations arising from
linear and quadratic functions, and simple rational and
exponential functions. A-CED.2. Create equations in two or more variables to
represent relationships between quantities; graph equations
on coordinate axes with labels and scales.
Interpret the structure of expressions [Polynomial and
rational]. A-SSE.1. Interpret expressions that represent a quantity in
terms of its context.★ a. Interpret parts of an expression, such as terms, factors,
and coefficients. b. Interpret complicated expressions by viewing one or
more of their parts as a single entity.For example, interpret
P(1+r)n as the product of P and a factor not depending on P. A-SSE.2. Use the structure of an expression to identify ways to
rewrite it. For example, see x4 – y
4as (x
2)
2 – (y
2)
2, thus
recognizing it as a difference of squares that can be factored as
(x2 – y
2)(x
2 + y
2).
Perform arithmetic operations on polynomials [Beyond
quadratic]. A-APR.1. Understand that polynomials form a system
analogous to the integers, namely, they are closed under the
operations of addition, subtraction, and multiplication; add,
subtract, and multiply polynomials.
SMP 1 Make sense of problems
and persevere in solving them.
SMP 4 Model with mathematics.
SMP 7 Look for and make use of
structure.
How does the degree of a
polynomial function affect its
behavior and why?
What are polynomial functions and
how do we graph them?
How is polynomial division
connected to the graph of the
function?
How do you identify when a real
world problem should be modeled
by a polynomial function?
Prior Learning: Students have recognized expressions as linear, exponential, or quadratic and
written equivalent quadratic expressions. They have represented linear,
exponential, quadratic, absolute value, step and piecewise functions graphically.
Students solved quadratic equations including those with complex solutions by
factoring, extracting the root, completing the square, and the quadratic formula.
They have performed arithmetic operations on linear and quadratic polynomials.
Current Learning: Students add, subtract, multiply, and divide polynomial expressions; factor sum
and difference of cubes; classify polynomials by degree and number of terms;
and describe and model relationships involving polynomial identities and use
them to solve problems. Students represent and solve polynomial equations
algebraically and graphically. They know and make use of the Remainder
Theorem. They graph polynomial functions and identify intercepts and intervals
where the function is increasing, decreasing, positive or negative. Students also
find relative maximum or minimums, symmetries, and end behavior. They identify and understand zeros and multiplicity of zeros in the related
graph. Students use polynomial models to solve real-world problems.
Future Learning: In the fourth course, students will find and use the conjugate of a complex
number. They will represent complex numbers in rectangular and polar form
and represent the operations geometrically.

Adapted from the Charles A. Dana Center work with SORICO 2012
Understand the relationship between zeros and factors of
polynomials. A-APR.2. Know and apply the Remainder Theorem: For a
polynomial p(x) and a number a, the remainder on division by
x – a is p(a), so p(a) = 0 if and only if (x – a) is a factor of p(x). A-APR.3. Identify zeros of polynomials when suitable
factorizations are available, and use the zeros to construct a
rough graph of the function defined by the polynomial.
Use polynomial identities to solve problems. A-APR.4. Prove polynomial identities and use them to describe
numerical relationships. For example, the polynomial identity
(x2 + y
2)
2 = (x
2 – y
2)
2 + (2xy)
2 can be used to generate
Pythagorean triples.
Represent and solve equations and inequalities graphically
[Combine polynomial, rational, radical, absolute value, and
exponential functions]. A-REI.11. Explain why the x-coordinates of the points where
the graphs of the equations y = f(x) and y = g(x) intersect are
the solutions of the equation f(x) = g(x); find the solutions
approximately, e.g., using technology to graph the functions,
make tables of values, or find successive approximations.
Include cases where f(x) and/or g(x) are linear, polynomial,
rational, absolute value, exponential, and logarithmic
functions.★
Build a function that models a relationship between two
quantities [For F.BF.1, 2, linear, exponential and quadratic].
F-BF.1. Write a function that describes a relationship between
two quantities.★ b. Combine standard function types using arithmetic
operations. For example, build a function that models the
temperature of a cooling body by adding a constant function to
a decaying exponential, and relate these functions to the
model.
Interpret functions that arise in applications in terms of

Adapted from the Charles A. Dana Center work with SORICO 2012
context [Emphasize selection of appropriate models]. F-IF.4. For a function that models a relationship between two
quantities, interpret key features of graphs and tables in terms
of the quantities, and sketch graphs showing key features
given a verbal description of the relationship. Key features
include: intercepts; intervals where the function is increasing,
decreasing, positive, or negative; relative maximums and
minimums; symmetries; end behavior; and periodicity.★
Analyze functions using different representations [Focus on
key features to guide selection of appropriate models of the
function]. F-IF.7. Graph functions expressed symbolically and show key
features of the graph, by hand in simple cases and using
technology for more complicated cases.★ c. Graph polynomial functions, identifying zeros when
suitable factorizations are available, and showing end
behavior.
• Classify polynomials by degree and terms. • Perform arithmetic operations on polynomial expressions
including addition, subtraction, multiplication, and division
(long and synthetic). • Compare representations of different polynomial functions. o Interpret key features of graphs and tables including
intercepts; intervals where the function is increasing,
decreasing, positive or negative; relative maximum or minimums; symmetries; and end behavior. o Identify and understand zeros and multiplicity of zeros in the related graph. • Write polynomial expressions in standard and factored form. o Factor sum/difference of cubes. • Use polynomial models to solve real-world problems. • Sketch the graphs of polynomial functions. • Understand and apply the Remainder Theorem.

Adapted from the Charles A. Dana Center work with SORICO 2012

Adapted from the Charles A. Dana Center work with SORICO 2012
Unit Six - Rational Functions (15 days/7-8 blocks)
Common Core Standards and
Content to Be Learned
Mathematical Practices and
Essential Questions Prior Learning, Current Learning and Future Learning
Rewrite rational expressions [Linear and quadratic
denominators]. A-APR.6. Rewrite simple rational expressions in different
forms; write a(x)/b(x) in the form q(x) +r(x)/b(x), where a(x),
b(x), q(x), and r(x) are polynomials with the degree of r(x) less
than the degree of b(x), using inspection, long division, or, for
the more complicated examples, a computer algebra system. A-APR.7. (+) Understand that rational expressions form a
system analogous to the rational numbers, closed under
addition, subtraction, multiplication, and division by a nonzero
rational expression; add, subtract, multiply, and divide rational
expressions.
Understand solving equations as a process of reasoning and
explain the reasoning [Simple radical and rational]. A-REI.2. Solve simple rational and radical equations in one
variable, and give examples showing how extraneous solutions
may arise.
Build new functions from existing functions [Include simple
radical, rational, and exponential functions; emphasize
common effect of each transformation across function types]. F-BF.1. Write a function that describes a relationship between
two quantities.★ b. Combine standard function types using arithmetic
operations. For example, build a function that models the
temperature of a cooling body by adding a constant function to
a decaying exponential, and relate these functions to the
model. F-BF.3. Identify the effect on the graph of replacing f(x) by f(x)
+ k, k f(x), f(kx), and f(x + k) for specific values of k (both
positive and negative); find the value of k given the graphs.
Experiment with cases and illustrate an explanation of the
SMP 2 Reason abstractly and
quantiatively
SMP 4 Model with mathematics.
SMP 7 Look for and make use of
structure
How does changing the values of h
and k affect the graph of h(x)=a/(x-
h) +k?
What causes horizontal asymptotes,
vertical asymptotes, and removable
discontinuities to occur in the
graphs of rational functions?
How do you use operations of
rational numbers to perform
operations on rational expressions?
What is the domain of a word
problem represented by a rational
function?
How do you identify when a real
Prior Learning: Students have simplified polynomial expressions. They have solved linear and
polynomial (including quadratic) equations. Students graphed polynomial
functions and identified domain, range, and intercepts. They built new functions from existing ones and graphed transformations of
select parent functions.
Current Learning: Students rewrite rational expressions in different forms, where the denominator
is linear or quadratic. Students solve rational equations; they explain their
reasoning with regard to rational functions and build new rational functions. As appropriate, they graph rational functions indicating
domain, horizontal and vertical asymptotes, and removable discontinuities.
Future Learning: Students will apply transformations to rational functions. They will solve
systems involving non-linear equations.

Adapted from the Charles A. Dana Center work with SORICO 2012
effects on the graph using technology. Include recognizing
even and odd functions from their graphs and algebraic
expressions for them.
Create equations that describe numbers of relationships
[Equations using all available types of expressions, including
simple root functions]. A-CED.1. Create equations and
inequalities in one variable and use them to solve
problems.Include equations arising from linear and quadratic
functions, and simple rational and exponential functions. A-CED.2. Create equations in two or more variables to
represent relationships between quantities; graph equations
on coordinate axes with labels and scales.
Interpret functions that arise in applications in terms of
context [Emphasize selection of appropriate models]. F-IF.4. For a function that models a relationship between two
quantities, interpret key features of graphs and tables in terms
of the quantities, and sketch graphs showing key features
given a verbal description of the relationship. Key features
include: intercepts; intervals where the function is increasing,
decreasing, positive, or negative; relative maximums and
minimums; symmetries; end behavior; and periodicity.★ F-IF.5. Relate the domain of a function to its graph and, where
applicable, to the quantitative relationship it describes. For
example, if the function h(n) gives the number of person-hours
it takes to assemble n engines in a factory, then the positive
integers would be an appropriate domain for the function.★ F-IF.7. Graph functions expressed symbolically and show key
features of the graph, by hand in simple cases and using
technology for more complicated cases.★ d. (+) Graph rational functions, identifying zeros and
asymptotes when suitable factorizations are available, and
showing end behavior. F-IF.9. Compare properties of two functions each represented
in a different way (algebraically, graphically, numerically in
tables, or by verbal descriptions). For example, given a graph
of one quadratic function and an algebraic expression for
another, say which has the larger maximum.
world problem should be modeled
by a rational function?

Adapted from the Charles A. Dana Center work with SORICO 2012
Understand solving equations as a process of reasoning and
explain the reasoning [Simple radical and rational]. A-REI.2. Solve simple rational and radical equations in one
variable, and give examples showing how extraneous solutions
may arise.
Represent and solve equations and inequalities graphically
[Combine polynomial, rational, radical, absolute value, and
exponential functions]. A-REI.11. Explain why the x-coordinates of the points where
the graphs of the equations y = f(x) and y = g(x) intersect are
the solutions of the equation f(x) = g(x); find the solutions
approximately, e.g., using technology to graph the functions,
make tables of values, or find successive approximations.
Include cases where f(x) and/or g(x) are linear, polynomial,
rational, absolute value, exponential, and logarithmic
functions.★
• Rewrite rational expressions in different forms, where the denominator is linear or quadratic. • Solve rational equations. • Build new rational functions from previously learned rational functions. • Determine the domain of rational functions. • Determine horizontal and vertical asymptotes using their definitions. • Identify any removable discontinuities. • Graph rational functions, indicating intercepts.

Adapted from the Charles A. Dana Center work with SORICO 2012

Adapted from the Charles A. Dana Center work with SORICO 2012
Quarter Three
Unit Seven - Radical Functions (8 days/4 blocks)
Common Core Standards and
Content to Be Learned
Mathematical Practices and
Essential Questions Prior Learning, Current Learning and Future Learning
Interpret functions that arise in applications in terms of
context [Emphasize selection of appropriate models]. F-IF.4. For a function that models a relationship between two
quantities, interpret key features of graphs and tables in terms
of the quantities, and sketch graphs showing key features
given a verbal description of the relationship. Key features
include: intercepts; intervals where the function is increasing,
decreasing, positive, or negative; relative maximums and
minimums; symmetries; end behavior; and periodicity.★ F-IF.5. Relate the domain of a function to its graph and, where
applicable, to the quantitative relationship it describes. For
example, if the function h(n) gives the number of person-hours
it takes to assemble n engines in a factory, then the positive
integers would be an appropriate domain for the function.★ F-IF.7. Graph functions expressed symbolically and show key
features of the graph, by hand in simple cases and using
technology for more complicated cases.★ b. Graph square root, cube root, and piecewise-defined
functions, including step functions and absolute value
functions.
● Solve radical equations. ● Determine if an equation has any extraneous
solutions. ● Determine the domain of radical functions. ● Graph radical functions, indicating intercepts. ● Connect the graph of radical functions to the
solutions o radical equations.
SMP 1 Make sense of problems
and persevere in solving them.
SMP 4 Model with mathematics.
SMP 7 Look for and make use of
structure.
Why do radical equations
sometimes have extraneous
solutions?
How can you determine if a solution
to a radical equation is extraneous?
How do you determine the domain
of a rational function and how does
this connect to the solutions of a
radical equation?
How can you use your knowledge of
function transformations to graph a
radical function?

Adapted from the Charles A. Dana Center work with SORICO 2012

Adapted from the Charles A. Dana Center work with SORICO 2012
Unit Eight - Exponential Functions (16 days/8 blocks)
Common Core Standards and
Content to Be Learned
Mathematical Practices and
Essential Questions Prior Learning, Current Learning and Future Learning
Create equations that describe numbers or relationships
[Equations using all available types of expressions, including
simple root functions]. A-CED.1. Create equations and inequalities in one variable and
use them to solve problems.Include equations arising from
linear and quadratic functions, and simple rational and
exponential functions. A-CED.2. Create equations in two or more variables to
represent relationships between quantities; graph equations
on coordinate axes with labels and scales. A-CED.4. Rearrange formulas to highlight a quantity of
interest, using the same reasoning as in solving equations. For
example, rearrange Ohm’s law V = IR to highlight resistance R.
Build new functions from existing functions. F-BF.5. (+) Understand the inverse relationship between
exponents and logarithms and use this relationship to solve
problems involving logarithms and exponents.
Interpret functions that arise in application in terms of
context [Emphasize selection of appropriate models]. F-IF.4. For a function that models a relationship between two
quantities, interpret key features of graphs and tables in terms
of the quantities, and sketch graphs showing key features
given a verbal description of the relationship. Key features
include: intercepts; intervals where the function is increasing,
decreasing, positive, or negative; relative maximums and
minimums; symmetries; end behavior; and periodicity.★ F-IF.5. Relate the domain of a function to its graph and, where
applicable, to the quantitative relationship it describes. For
example, if the function h(n) gives the number of person-hours
it takes to assemble n engines in a factory, then the positive
integers would be an appropriate domain for the function.★
SMP 2 Reason abstractly and
quantitatively.
SMP 4 Model with mathematics.
SMP 5 Use appropriate tools
strategically.
SMP 6 Attend to precision.
How is the process of solving
equations and rearranging formulas
for a quantity of interest similar or
different?
How do you identify when a real
world problem should be modeled
by an exponential function?
By looking at the equation for an
exponential model, how can you
determine whether it is a growth or
decay model and why?
What are the key graphical features
of an exponential function?
Why does the parent graph of an
Prior Learning: In Algebra 1, students learned to create linear equations. They were also
introduced to quadratic and exponential equations. In the first unit of Algebra 2,
students learned to create equations, including quadratic. Grade 8 students
graphed linear functions and learned to identify domain and intercepts. In
Algebra 1, they were introduced to simple exponential functions and their
graphs. In Unit 2.2 of Algebra 2, students learned to create equations that
describe relationships.
Current Learning: Students learn to create exponential equations and inequalities with one and
two or more variables. They also learn to represent equations and inequalities
on the coordinate grid with proper labels and scales. Students learn to
understand and interpret solutions as viable or nonviable. Students also learn to
rearrange formulas for a quantity of interest. Students learn to represent and
solve exponential equations. They learn to use technology in the process of solving exponential functions. Students learn to differentiate between
exponential growth and decay. They learn to relate the domain of a function to
its graph.
Future Learning: Students will use exponential equations in Precalculus when learning about
inverse functions. They will also use this knowledge when working with
logarithmic functions. In Pre-calculus, students will extend exponential functions
to include relative extremes. This also extends to the Pre-calculus topic of
concavity. Students in Calculus will determine the area under the curve and
infinite rectangles.

Adapted from the Charles A. Dana Center work with SORICO 2012
Analyze functions using different representations [Focus on
using key features to guide selection of appropriate models
for the function]. F-IF.7. Graph functions expressed symbolically and show key
features of the graph, by hand in simple cases and using
technology for more complicated cases.★ e. Graph exponential and logarithmic functions, showing
intercepts and end behavior, and trigonometric functions,
showing period, midline, and amplitude. F-IF.8. Write a function defined by an expression in different
but equivalent forms to reveal and explain different properties
of the function. b. Use the properties of exponents to interpret expressions
for exponential functions. For example, identify percent rate of
change in functions such as y = (1.02)t, y = (0.97)
t, y = (1.01)
12t,
y = (1.2)t/10,
and classify them as representing exponential
growth or decay. Write expressions in equivalent forms to solve problems. A-SSE.4. Derive the formula for the sum of a finite geometric
series (when the common ratio is not 1), and use the formula
to solve problems. For example, calculate mortgage
payments.★
• Create exponential equations in one variable. • Create exponential equations in two or more variables. • Use equations to solve real world problems. • Represent relationships and constraints between quantities. • Rearrange formulas to solve for quantity of interest. • Graph and solve exponential functions. • Use technology to find solutions to exponential functions. • Identify and interpret key features of exponential functions. • Graphically represent exponential growth and decay. • Determine the range of exponential functions, and relate the
range to the graph of the function.
exponential function only exist for
functional values greater than zero?
How and why does the range
change when you shift this model
up or down?
How is the domain of an
exponential function related to its
graph?
What is the importance of the use
of technology in solving exponential
equations and inequalities?

Adapted from the Charles A. Dana Center work with SORICO 2012

Adapted from the Charles A. Dana Center work with SORICO 2012
Unit Nine - Logarithmic Functions (16 days/8 blocks)
Common Core Standards and
Content to Be Learned
Mathematical Practices and
Essential Questions Prior Learning, Current Learning and Future Learning
Build new functions from existing functions. F-BF.5. (+) Understand the inverse relationship between
exponents and logarithms and use this relationship to solve
problems involving logarithms and exponents. Interpret functions that arise in application in terms of
context [Emphasize selection of appropriate models]. F-IF.4. For a function that models a relationship between two
quantities, interpret key features of graphs and tables in terms
of the quantities, and sketch graphs showing key features
given a verbal description of the relationship. Key features
include: intercepts; intervals where the function is increasing,
decreasing, positive, or negative; relative maximums and
minimums; symmetries; end behavior; and periodicity.★ F-IF.5. Relate the domain of a function to its graph and, where
applicable, to the quantitative relationship it describes. For
example, if the function h(n) gives the number of person-hours
it takes to assemble n engines in a factory, then the positive
integers would be an appropriate domain for the function.★
Analyze functions using different representations [Focus on
using key features to guide selection of appropriate models
for the function]. F-IF.7. Graph functions expressed symbolically and show key
features of the graph, by hand in simple cases and using
technology for more complicated cases.★ e. Graph exponential and logarithmic functions, showing
intercepts and end behavior, and trigonometric functions,
showing period, midline, and amplitude.
Construct and compare linear, quadratic and exponential
models and solve problems [Logarithms as solutions for
exponentials].
SMP 2 Reason abstractly and
quantitatively.
SMP 4 Model with mathematics.
SMP 5 Use appropriate tools
strategically.
SMP 7 Look for and make use of
structure.
SMP 8 Look for and express
regularity in repeated reasoning.
What is a method for solving
logarithmic equations?
What are the characteristics of a
logarithmic function and how do
these characteristics relate to
exponential functions?
How do you use the characteristics
of inverse functions to graph
logarithmic functions?
What is the process for solving
logarithmic equations?
Prior Learning: In Algebra 1, students were introduced to exponential functions and their
graphs. They also learned to find inverse functions. Early in Algebra 2, students
learned to graph exponential functions. In Algebra 1, students were introduced
to exponential functions and their graphs. They also learned to find inverse
functions. Early in Algebra 2, students learned to graph exponential functions.
They also learned the relationship between exponential and logarithmic
functions. Students learned to identify the domain of a logarithmic function and
to convert to and from logarithmic equations to exponential equations. Students also learned about the base e.
Current Learning: In Algebra 2, students learn the relationship between exponential and
logarithmic functions. They also learn to identify the domain of a logarithmic
function. Students convert to and from logarithmic equations to exponential
equations. Students also learn about the base e. Students learn how the
parameters affect the graph of a logarithmic function. They understand the
relationship of the domain and its function, and they understand key features of
a graph. Students use this understanding to graph logarithmic functions by
hand.
Future Learning: Algebra 2 students will learn about intercepts and end behavior of logarithmic
functions. They will also learn about change of base formula. In Pre-calculus,
students will graph logarithmic functions. They will also use the concept of inverse functions and apply it to the trigonometric
functions. In Pre-calculus, students will graph logarithmic functions. In Calculus, they will
use these concepts to find the derivatives and integrals of functions.
Adapted from the Charles A. Dana Center work with SORICO 2012
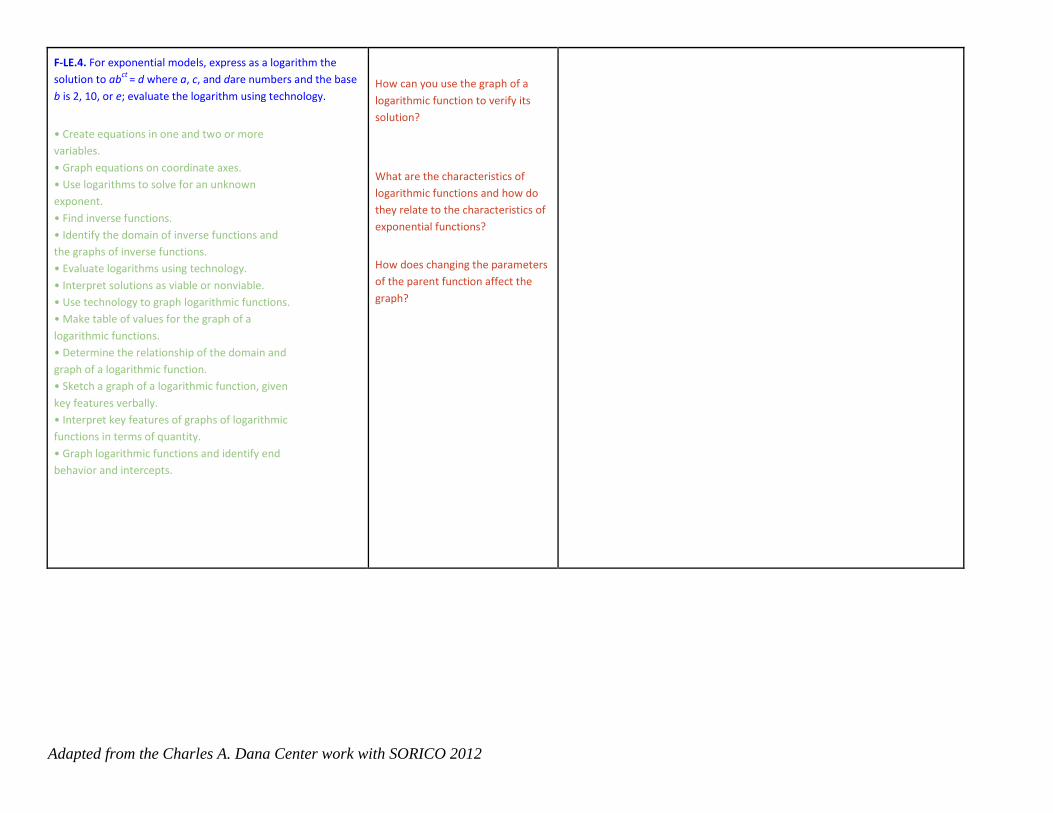
F-LE.4. For exponential models, express as a logarithm the
solution to abct
= d where a, c, and dare numbers and the base
b is 2, 10, or e; evaluate the logarithm using technology.
• Create equations in one and two or more variables. • Graph equations on coordinate axes. • Use logarithms to solve for an unknown exponent. • Find inverse functions. • Identify the domain of inverse functions and the graphs of inverse functions. • Evaluate logarithms using technology. • Interpret solutions as viable or nonviable. • Use technology to graph logarithmic functions. • Make table of values for the graph of a logarithmic functions. • Determine the relationship of the domain and graph of a logarithmic function. • Sketch a graph of a logarithmic function, given key features verbally. • Interpret key features of graphs of logarithmic functions in terms of quantity. • Graph logarithmic functions and identify end behavior and intercepts.
How can you use the graph of a
logarithmic function to verify its
solution?
What are the characteristics of
logarithmic functions and how do
they relate to the characteristics of
exponential functions?
How does changing the parameters
of the parent function affect the
graph?

Adapted from the Charles A. Dana Center work with SORICO 2012
Quarter Four
Unit Ten - Trigonometry - The Unit Circle, Radian Measure, Angles of Rotation (15 days/7-8 blocks)
Common Core Standards and
Content to Be Learned
Mathematical Practices and
Essential Questions Prior Learning, Current Learning and Future Learning
Extend the domain of trigonometric functions using the unit
circle. F-TF.1. Understand radian measure of an angle as the length of
the arc on the unit circle subtended by the angle. F-TF.2. Explain how the unit circle in the coordinate plane
enables the extension of trigonometric functions to all real
numbers, interpreted as radian measures of angles traversed
counterclockwise around the unit circle.
• Recognize the radian measure of an angle as the arc length on the unit circle. • Determine the connection between the unit circle and radian measures. • Prove the Pythagorean trigonometric identity. • Find trigonometric angle measures using trigonometric identities.
SMP 2 Reason abstractly and
quantitatively.
SMP 5 Use appropriate tools
strategically.
SMP 7 Look for and make use of
structure.
SMP 8 Look for and express
regularity in repeated reasoning.
What is the relationship between
the radian measure of an angle and
the unit circle?
How can the sine, cosine, and
tangent functions be defined using
the unit circle?
How can you use a given value of a
trigonometric function to
determine the values of other
functions?
What method(s) are used to
determine the Pythagorean
trigonometric identity?
Prior Learning: In grade 8, students were introduced to the Pythagorean Theorem and its
application. Geometry students used right-angle trigonometry and the Laws of
Sines and Cosines. Geometry students also derived the equation of a circle.
Current Learning: Students determine the relationship between radian measures and arc length
on the unit circle. They also identify the trigonometric functions on the unit
circle and their measures. Students determine the Pythagorean trigonometric identity and use it to determine the value of other
functions.
Future Learning: Precalulus students will continue to determine trigonometric values on the unit
circle. They will also continue to use the unit circle to explain symmetry and
periodicity of trigonometric functions. Precalculus students will graph
trigonometric functions, identifying zeros and asymptotes. They will also use
inverse functions to solve trigonometric equations.

Adapted from the Charles A. Dana Center work with SORICO 2012
What is the relationship between
the trigonometric angle measures
and their identities?

Adapted from the Charles A. Dana Center work with SORICO 2012
Unit Eleven - Trigonometric Functions - Sine and Cosine (10 days/5 blocks)
Common Core Standards and
Content to Be Learned
Mathematical Practices and
Essential Questions Prior Learning, Current Learning and Future Learning
Build new functions from existing functions [Include simple
radical, rational, and exponential functions; emphasize
common effect of each transformation across function types]. F-BF.3. Identify the effect on the graph of replacing f(x) by f(x)
+ k, k f(x), f(kx), and f(x + k) for specific values of k (both
positive and negative); find the value of k given the graphs.
Experiment with cases and illustrate an explanation of the
effects on the graph using technology. Include recognizing
even and odd functions from their graphs and algebraic
expressions for them.
Model periodic phenomena with trigonometric functions. F-TF.5. Choose trigonometric functions to model periodic
phenomena with specified amplitude, frequency, and
midline.★
SMP 5 Use appropriate tools
strategically.
SMP 7 Look for and make use of
structure.
How do you identify when a real
world problem should be modeled
by a trigonometric function?
What are the key criteria to
consider when modeling a
trigonometric function and how do
you integrate these into the
equation and the graph?
How do you relate the properties of
function transformations previously
learned to the key vocabulary of
trigonometric functions?
Adapted from the Charles A. Dana Center work with SORICO 2012
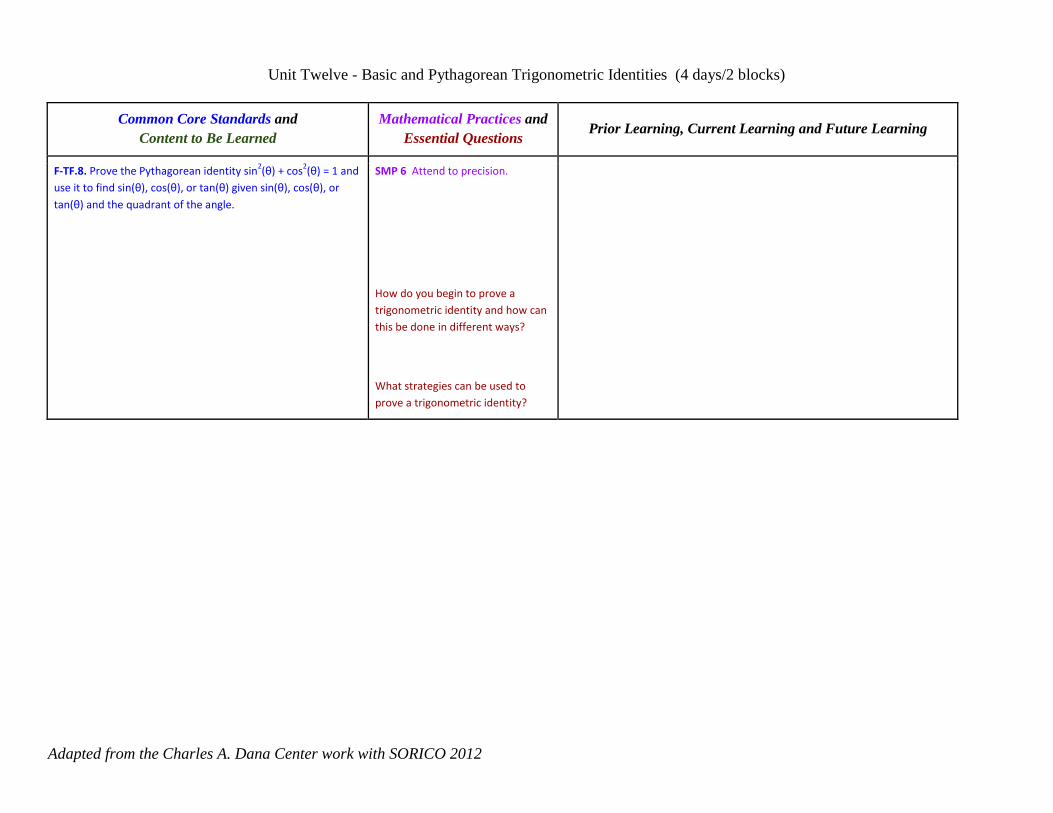
Unit Twelve - Basic and Pythagorean Trigonometric Identities (4 days/2 blocks)
Common Core Standards and
Content to Be Learned
Mathematical Practices and
Essential Questions Prior Learning, Current Learning and Future Learning
F-TF.8. Prove the Pythagorean identity sin2(θ) + cos
2(θ) = 1 and
use it to find sin(θ), cos(θ), or tan(θ) given sin(θ), cos(θ), or
tan(θ) and the quadrant of the angle.
SMP 6 Attend to precision.
How do you begin to prove a
trigonometric identity and how can
this be done in different ways?
What strategies can be used to
prove a trigonometric identity?

Adapted from the Charles A. Dana Center work with SORICO 2012
Unit Thirteen - Statistics - Experiments, Surveys, and Observational Studies (5 days/2-3 blocks)
Common Core Standards and
Content to Be Learned
Mathematical Practices and
Essential Questions Prior Learning, Current Learning and Future Learning
Understand and evaluate random processes underlying
statistical experiments. S-IC.1. Understand statistics as a process for making inferences
about population parameters based on a random sample from
that population. S-IC.2. Decide if a specified model is consistent with results
from a given data-generating process, e.g., using simulation.
For example, a model says a spinning coin falls heads up with
probability 0.5. Would a result of 5 tails in a row cause you to
question the model?
Make inferences and justify conclusions from sample surveys,
experiments, and observational studies. S-IC.3. Recognize the purposes of and differences among
sample surveys, experiments, and observational studies;
explain how randomization relates to each. S-IC.4. Use data from a sample survey to estimate a population
mean or proportion; develop a margin of error through the use
of simulation models for random sampling. S-IC.5. Use data from a randomized experiment to compare
two treatments; use simulations to decide if differences
between parameters are significant. S-IC.6. Evaluate reports based on data.
SMP 1 Make sense of problems
and persevere in solving them.
SMP 2 Reason abstractly and
quantitatively.
What is the purpose of creating a
statistical model?
How do you decide if a specific
model is consistent with the results
from a given data-generating
process?
How do you create a simulation to
model an event?
How do you use sample surveys to
estimate a population mean or
proportion and what other factors
must you consider when you do
this?

Adapted from the Charles A. Dana Center work with SORICO 2012