mathematical morphology in the lab colour space
TRANSCRIPT

8/13/2019 Mathematical Morphology in the Lab Colour Space
http://slidepdf.com/reader/full/mathematical-morphology-in-the-lab-colour-space 1/48
Mathematical Morphology in the L*a*b*Colour Space
Allan Hanbury
and Jean Serra
30 August 2001Some corrections made 25 October 2002
Technical report N-36/01/MM
Centre de Morphologie Mathématique
Ecole des Mines de Paris
35, rue Saint-Honoré
77305 Fontainebleau cedex
France

8/13/2019 Mathematical Morphology in the Lab Colour Space
http://slidepdf.com/reader/full/mathematical-morphology-in-the-lab-colour-space 2/48
Abstract
The use of mathematical morphology in the L*a*b* colour space is discussed. Initially, a de-
scription of the characteristics of the L*a*b* space and a comparison to the HLS space are
given. This is followed by a theoretical demonstration of the use of weighting functions to im-
pose a complete order on a vector space. Various colour weighting functions are considered, and
one based on a model of an electrostatic potential is chosen for further development. A lexico-
graphical order using this weighting function allows one to simulate a complete order by coloursaturation, a notion absent from the definition of the L*a*b* space. Demonstrations of the basic
morphological operators and of the top-hat operator making use of the proposed colour order are
shown.
Keywords: L*a*b* colour space, mathematical morphology, lexicographical order, vector
order, vector weighting function, electrostatic potential.
Mots clés: Espace couleur L*a*b*, morphologie mathématique, ordre lexicographique, ordre
vectoriel, fonction de ponderation de vecteurs, potentiel électrostatique.

8/13/2019 Mathematical Morphology in the Lab Colour Space
http://slidepdf.com/reader/full/mathematical-morphology-in-the-lab-colour-space 3/48
Contents
1. Introduction 5
2. The L*a*b* space 62.1. Description . . . . . . . . . . . . . . . . . . . . . . . . . . . . . . . . . . . . . 6
2.2. Colour difference . . . . . . . . . . . . . . . . . . . . . . . . . . . . . . . . . . 7
2.3. Transformation from RGB to L*a*b* . . . . . . . . . . . . . . . . . . . . . . . 7
2.4. Characteristics of the L*a*b* space . . . . . . . . . . . . . . . . . . . . . . . . 8
2.4.1. Component distributions . . . . . . . . . . . . . . . . . . . . . . . . . . 82.4.2. Extrema . . . . . . . . . . . . . . . . . . . . . . . . . . . . . . . . . . . 10
2.5. Comparison between the HLS and L*a*b* spaces . . . . . . . . . . . . . . . . . 11
2.6. Notation . . . . . . . . . . . . . . . . . . . . . . . . . . . . . . . . . . . . . . . 12
3. Mathematical Morphology 153.1. Colour morphology theory . . . . . . . . . . . . . . . . . . . . . . . . . . . . . 15
3.2. The weighting function . . . . . . . . . . . . . . . . . . . . . . . . . . . . . . . 17
3.2.1. Distance methods . . . . . . . . . . . . . . . . . . . . . . . . . . . . . . 17
3.2.2. Electrical potential . . . . . . . . . . . . . . . . . . . . . . . . . . . . . 18
3.3. Basic operations . . . . . . . . . . . . . . . . . . . . . . . . . . . . . . . . . . . 22
3.3.1. Colour order . . . . . . . . . . . . . . . . . . . . . . . . . . . . . . . . 25
3.3.2. Operators . . . . . . . . . . . . . . . . . . . . . . . . . . . . . . . . . . 26
3.3.3. Examples . . . . . . . . . . . . . . . . . . . . . . . . . . . . . . . . . . 26
3.4. Top-hat . . . . . . . . . . . . . . . . . . . . . . . . . . . . . . . . . . . . . . . 26
3.5. Lexicographical order statistics . . . . . . . . . . . . . . . . . . . . . . . . . . . 30
3.6. Rotational invariance . . . . . . . . . . . . . . . . . . . . . . . . . . . . . . . . 31
4. Conclusion 34
A. Colour space conversions 36
A.1. RGB to XYZ derivation . . . . . . . . . . . . . . . . . . . . . . . . . . . . . . . 36
A.1.1. Primaries and white point . . . . . . . . . . . . . . . . . . . . . . . . . 36
A.1.2. Transformation between two systems of primaries . . . . . . . . . . . . 38
A.2. RGB to XYZ . . . . . . . . . . . . . . . . . . . . . . . . . . . . . . . . . . . . 40
A.3. XYZ to L*a*b* . . . . . . . . . . . . . . . . . . . . . . . . . . . . . . . . . . . 40
3

8/13/2019 Mathematical Morphology in the Lab Colour Space
http://slidepdf.com/reader/full/mathematical-morphology-in-the-lab-colour-space 4/48
8/13/2019 Mathematical Morphology in the Lab Colour Space
http://slidepdf.com/reader/full/mathematical-morphology-in-the-lab-colour-space 5/48
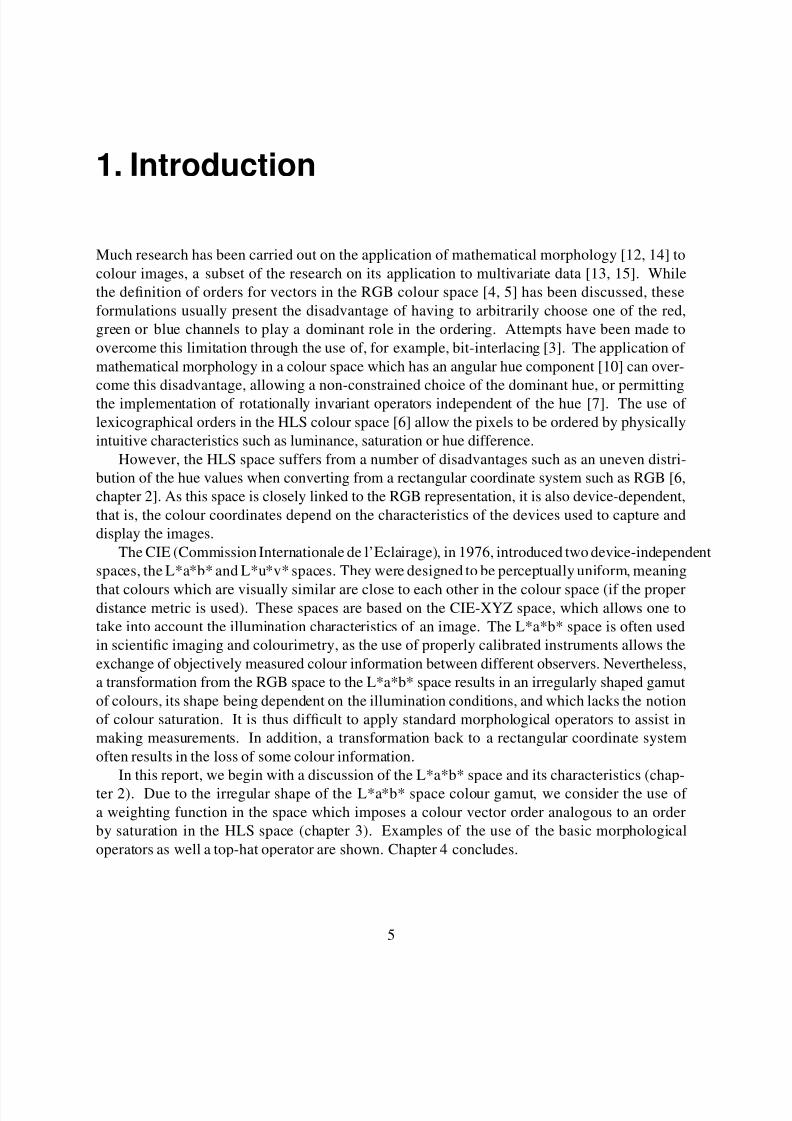
1. Introduction
Much research has been carried out on the application of mathematical morphology [12, 14] to
colour images, a subset of the research on its application to multivariate data [13, 15]. While
the definition of orders for vectors in the RGB colour space [4, 5] has been discussed, these
formulations usually present the disadvantage of having to arbitrarily choose one of the red,
green or blue channels to play a dominant role in the ordering. Attempts have been made to
overcome this limitation through the use of, for example, bit-interlacing [3]. The application of
mathematical morphology in a colour space which has an angular hue component [10] can over-
come this disadvantage, allowing a non-constrained choice of the dominant hue, or permittingthe implementation of rotationally invariant operators independent of the hue [7]. The use of
lexicographical orders in the HLS colour space [6] allow the pixels to be ordered by physically
intuitive characteristics such as luminance, saturation or hue difference.
However, the HLS space suffers from a number of disadvantages such as an uneven distri-
bution of the hue values when converting from a rectangular coordinate system such as RGB [6,
chapter 2]. As this space is closely linked to the RGB representation, it is also device-dependent,
that is, the colour coordinates depend on the characteristics of the devices used to capture and
display the images.
The CIE (Commission Internationale de l’Eclairage), in 1976, introduced two device-independent
spaces, the L*a*b* and L*u*v* spaces. They were designed to be perceptually uniform, meaning
that colours which are visually similar are close to each other in the colour space (if the properdistance metric is used). These spaces are based on the CIE-XYZ space, which allows one to
take into account the illumination characteristics of an image. The L*a*b* space is often used
in scientific imaging and colourimetry, as the use of properly calibrated instruments allows the
exchange of objectively measured colour information between different observers. Nevertheless,
a transformation from the RGB space to the L*a*b* space results in an irregularly shaped gamut
of colours, its shape being dependent on the illumination conditions, and which lacks the notion
of colour saturation. It is thus difficult to apply standard morphological operators to assist in
making measurements. In addition, a transformation back to a rectangular coordinate system
often results in the loss of some colour information.
In this report, we begin with a discussion of the L*a*b* space and its characteristics (chap-
ter 2). Due to the irregular shape of the L*a*b* space colour gamut, we consider the use of
a weighting function in the space which imposes a colour vector order analogous to an order
by saturation in the HLS space (chapter 3). Examples of the use of the basic morphological
operators as well a top-hat operator are shown. Chapter 4 concludes.
5

8/13/2019 Mathematical Morphology in the Lab Colour Space
http://slidepdf.com/reader/full/mathematical-morphology-in-the-lab-colour-space 6/48
2. The L*a*b* space
Before applying image analysis operators to an image represented in a certain colour space, it is
useful to know the characteristics of the colour space. This helps avoid unexpected behaviour
of the operators due to colour space particularities. The characteristics of the L*a*b* space are
examined in detail in this chapter. Sections 2.1 to 2.3 provide basic information on the colour
space, and sections 2.4 and 2.5 examine the component distributions and the relation of the
L*a*b* space to the HLS space.
2.1. Description
The L*a*b* space is one of two device-independent colour spaces developed by the CIE to be
approximately perceptually uniform. This means that colours which appear similar to an observer
are located close to each other in the L*a*b* coordinate system.
In the L*a*b* colour space:
represents the lightness (luminance).
encodes the red-green sensation, with positive
indicating a red colour, and negative
a green colour.
encodes the yellow-blue sensation, with positive
indicating yellow and negative
indicating blue.
The grey-levels or colourless points are located on the luminance axis
, with
black at
, and white at
. The colour characteristics are summarised schematically
in figure 2.1. As is clear, it is possible to define a polar representation of the chrominance
coordinates. The chroma
and hue
are defined as
and
The hue
is obviously an angular value, and has the property that
.
Combining the
and
coordinates with
leads to a cylindrical representation of the L*a*b*
space.
6

8/13/2019 Mathematical Morphology in the Lab Colour Space
http://slidepdf.com/reader/full/mathematical-morphology-in-the-lab-colour-space 7/48
Figure 2.1.: A schematic representation of the chrominance information in the L*a*b* colour
space (from [1]).
2.2. Colour difference
The total colour difference
between two colours, each expressed in terms of
,
and
is given by the Euclidean metric
(2.1)
In the cylindrical representation, the Euclidean distance between two colours
and
, is
(2.2)
where
.
The perceptual uniformity of the L*a*b* space implies that if, for two colours,
is small,
then the colours are visually similar.
2.3. Transformation from RGB to L*a*b*
The transformation from the RGB to the L*a*b* colour space is done by first transforming to the
CIE XYZ space, and then to the L*a*b* space. The details of this transformation are given, for
both directions, in appendix A.
Before doing the transformation from RGB to XYZ, one needs to specify the coordinates of
the three primary colour stimuli and of the white point (the nominally white object-colour stimu-
lus) in the XYZ space. The primary colour stimuli depend on the hardware characteristics of the
image capture device (i.e. the camera). The white point is usually specified by the spectral radi-
ant power of one of the CIE standard illuminants, such as (daylight) or (tungsten filament
7

8/13/2019 Mathematical Morphology in the Lab Colour Space
http://slidepdf.com/reader/full/mathematical-morphology-in-the-lab-colour-space 8/48
lamp), reflected into the observer’s eye by the perfect reflecting diffuser [16]. If one knows the
illumination conditions used when acquiring the image, then the specification of the white point
is simple. If the illumination conditions are unknown, a hypothesis can be made, or a technique
for estimating the white point from the image [2] can be used. For all the transformations in
this report, the primary colour stimuli and
white point specified in the Rec. 709 HDTV stan-
dard [11] have been used. These correspond closely to the display characteristics of computer
monitors. The coordinates of the Rec. 709 primaries and white point are given in appendix A.
2.4. Characteristics of the L*a*b* space
The transformation from an RGB cube completely filled with points does not fill the L*a*b*
space, but produces a gamut of colours whose shape depends on the primaries and white point.
In this section, we investigate the shape of the resultant colour gamut. This analysis is performed
for the specific case of an RGB space transformed to the L*a*b* space using the Rec. 709
standard primaries and white point, but can easily be adapted to other situations.
2.4.1. Component distributions
An analysis of the component distributions in the L*a*b* space can give an idea of the shape
of the colour gamut. This is similar to the analysis of the HLS space in [6]. To allow the
distributions of the L*a*b* components to be visualised, a transformation from an RGB colour
cube containing points equally spaced by
throughout the region
to the
L*a*b* space is done. For each point
, the corresponding values of
,
, and
,
and
are rounded to the nearest integer and the corresponding bins in the histograms are
incremented. The
,
,
,
and
histograms are shown in figure 2.2.
The
,
,
and
distributions are all smooth, with the peaks of the
and
distributions
close to zero. The chrominance distribution shows that there are very few pixels which are onthe luminance axis (i.e. at
. A comparison of the hue distribution with the corresponding
distribution for the HLS space [6] shows that the L*a*b* hue component
does not suffer
from regularly spaced spikes in the histogram like the HLS hue component . However, the
component does not have a flat distribution, and there are some values of
which appear to have
an excess of pixels assigned to them. This is examined further by calculating a two-dimensional
chrominance histogram.
For the calculation of the two-dimensional chrominance histogram, the transformation from
an RGB colour cube containing points equally spaced by
throughout the region
to the L*a*b* space is done. For each point
, the resulting coordinates
and
are rounded to the nearest integer, and the bin
of the histogram is incremented. A plot
of the histogram is shown in figure 2.3. In this image, the grey-level at each point
indi-cates the number of pixels in the RGB cube mapped to this point. In the full three-dimensional
L*a*b* space, these pixels would be mapped to different luminance values. However, this two-
dimensional histogram allows one to make some useful observations:
8

8/13/2019 Mathematical Morphology in the Lab Colour Space
http://slidepdf.com/reader/full/mathematical-morphology-in-the-lab-colour-space 9/48
1000
2000
3000
4000
5000
6000
7000
8000
0 50 100 150 200 250 300 350
c o u n t
hue angle
(a) Hue
0
2000
4000
6000
8000
10000
12000
14000
16000
18000
0 20 40 60 80 100 120
c o u n t
Chrominance
(b) Chrominance
0
5000
10000
15000
20000
25000
30000
0 20 40 60 80 100
c o u n t
Luminance
(c) Luminance
0
2000
4000
6000
8000
10000
12000
-100 -50 0 50 100
c o u n t
a
(d)
0
2000
4000
6000
8000
10000
12000
-100 -50 0 50 100
c o u n t
b
(e)
Figure 2.2.: The histograms of the Hue
, Chrominance
and Luminance
, and the chromi-
nance Cartesian coordinates
and
calculated from a set of equally-spaced points
filling an RGB cube.
9

8/13/2019 Mathematical Morphology in the Lab Colour Space
http://slidepdf.com/reader/full/mathematical-morphology-in-the-lab-colour-space 10/48
Figure 2.3.: The
histogram which results from transforming an RGB cube to the L*a*b*
space. The grey-level at each point
indicates the number of pixels in the
RGB cube mapped to this point. The zero-valued regions are indicated in blue.
1. The largest number of points are concentrated near the origin, the position of the luminance
axis
2. The distribution of colours is not circular — the maximum value assumed by
depends
on
.
2.4.2. Extrema
The extremal points of the L*a*b* colour gamut are those points which are furthest away from
the luminance axis, that is, the points with the maximum values of
. These extrema can
be seen on the histogram in figure 2.3. It is, however, interesting to find the luminance value
corresponding to each of these extremal chroma points.
For the transformation from the RGB cube, for each integer value of
, the point with the
largest chroma
is found. In figure 2.4, the value of
is plotted for the extremal points
10

8/13/2019 Mathematical Morphology in the Lab Colour Space
http://slidepdf.com/reader/full/mathematical-morphology-in-the-lab-colour-space 11/48
20
40
60
80
100
120
140
0 50 100 150 200 250 300 350
h (degrees)
CL
Figure 2.4.: The values of the extrema of the chroma
and their corresponding luminance
as a function of hue
in the L*a*b* space.
corresponding to each integer value of
, along with the luminance
of the extremal point.
These functions are henceforth denoted as
and
, where the values can be read off
the graph for integer values of
, and interpolated for non-integer values.
2.5. Comparison between the HLS and L*a*b* spaces
In the HLS (double-cone) space, the points with highest saturation (
) have luminance
values of half the maximum (
). It is interesting to examine the relation between these
points and the extremal chroma points in the L*a*b* colour gamut. For the case we are treating,where use is made of primaries and a white point well adapted to computer monitors, the extrema
of the two spaces should coincide.
The extremal chroma points of the L*a*b* colour gamut are those plotted in figure 2.4, and
the colours corresponding to these points for integer hues between
and
are shown in
11

8/13/2019 Mathematical Morphology in the Lab Colour Space
http://slidepdf.com/reader/full/mathematical-morphology-in-the-lab-colour-space 12/48
Figure 2.5.: The colours corresponding to the extremal
values. The first line has values of
from
to
, the second from
to
, etc.
figure 2.5. The
,
and
values corresponding to these colours are shown in the grey-level
images in figure 2.6.
To test that the extremal points of the L*a*b* colour gamut correspond to those of the HLS
space, figure 2.5 was converted to the HLS space (via the RGB space). These , and
components are shown in figure 2.7. The values for all the pixels in the band (figure 2.7b) are
, and for all the pixels in the
band (figure 2.7c) are
. Apart from a small displacement of
the hue origin between the two spaces, it is clear that the extremal points of the L*a*b* colour
gamut correspond exactly to the points of highest saturation in the HLS space.
2.6. Notation
In this report, we deal with a colour image in the L*a*b* space
or its associated polar representation
where
. The components of the two possible representations are written
,
,
,
and
.
To simplify the notation in some sections, we assign an index to each of the
vectors in
the image, written as
. The individual components of the vector with index
are written as
,
,
,
and
.
is a structuring element, and
indicates the structuring
element at point
in the image.
12

8/13/2019 Mathematical Morphology in the Lab Colour Space
http://slidepdf.com/reader/full/mathematical-morphology-in-the-lab-colour-space 13/48
(a)
(b)
(c)
Figure 2.6.: The
,
and
bands of the image in figure 2.5.
13

8/13/2019 Mathematical Morphology in the Lab Colour Space
http://slidepdf.com/reader/full/mathematical-morphology-in-the-lab-colour-space 14/48
(a)
(b)
(c)
Figure 2.7.: The , and
bands of the colour image in figure 2.5, obtained by transforming
the image to the RGB space and then to the HLS space.
14

8/13/2019 Mathematical Morphology in the Lab Colour Space
http://slidepdf.com/reader/full/mathematical-morphology-in-the-lab-colour-space 15/48
3. Mathematical Morphology
The L*a*b* space does not have a notion of colour saturation. Nevertheless, we have shown
in the previous chapter that for the chosen set of primaries and white point, the most highly
saturated points in the HLS space correspond to the extremal points of the L*a*b* colour gamut.
In this chapter, we make use of this and of the fact that the least saturated points are found on
the luminance axis to develop an analogue to the lexicographical order by saturation described
in [6].
Due to the irregular shape of the L*a*b* colour gamut, one cannot simply, in analogy with the
HLS space, define the supremum to be the pixel with the largest value of
, as the maximumpossible value of
varies with hue. We therefore proceed by defining a weighting function
which assigns a weight to each colour based on its distance to an extremal colour. In Section 3.1,
the theory relating to the use of weighting functions for colour morphology (or morphology on
vector-valued images) is presented. The development leading to the choice of a good weighting
function is given in section 3.2, and the use of this weighting function in morphological operators
is demonstrated in section 3.3. Lastly, the top-hat (section 3.4), statistics on the lexicographical
order (section 3.5) and rotational invariance (section 3.6) are discussed.
3.1. Colour morphology theory
We know that the morphological operators are expressed as products of the suprema and infima
of the elements of the lattice under study. When we deal with numerical functions in
or
,
which also form a vector space, we append additions and multiplication to the operators used. In
practice, we are always led to take the biggest or smallest value of a family with a finite number
of elements, a value which obviously belongs to the family.
However, once we define the lattice
as the product of two numerical lattices, lets say
and
for red and green, this property ceases to be true. The supremum of
and
is
, different from the two operands. The proposition developed here
indicates the conditions under which one has the desirable property of “remaining in the family”.
We formulate it in the general framework of a compact lattice with closed order, which has the
advantage of modelling all the colour spaces, and also allows us to place ourselves in
or
.A lattice
is called topological if we assign it a topology, and its order is closed if two families
satisfy
,
,
in
, then
.
A family
in a lattice
is filtering increasing (resp. decreasing) if the set of indices
has an order relation verifying the following two properties:
15

8/13/2019 Mathematical Morphology in the Lab Colour Space
http://slidepdf.com/reader/full/mathematical-morphology-in-the-lab-colour-space 16/48
1.
(resp.
)
2. For every
, there exists a
which is bigger the and .
We also note that in a complete lattice
, the notion of a monotone limit of a filtering increas-
ing (resp.decreasing) family
, i.e.
(3.1)
is purely algebraic, and does not use any topology ([9], pg. 16).
Finally, Matheron showed that if the complete lattice
is completely ordered, it permits a
unique topology which renders it compact with closed order (CCO) ([9], criterion 6-1). This
topology satisfies the following two equivalent properties ([9], theorem 5-2)
1. The monotone and topological limits coincide (i.e. equation 3.1 is equivalent to
).
2. When the family
is closed in
, the operators
and
are
continuous.
These preliminaries lead to the property for which we are aiming, that is
Proposition Let
be a complete lattice, and
an arbitrary family of elements of
,
with
and
. The elements
and
belong to the family
(finite or not)
if and only if the lattice
is completely ordered and
is a closed subset of
.
Proof Suppose that
is completely ordered. All filtering families
of elements are
ordered in the lattice by decreasing values
, and by increasing values
. For the unique
topology CCO induced on
by its complete order, we have, by theorem 5-2 of Matheron
If we assume that the family
is closed, and hence that it contains its adherent points, we
have
and
.
Conversely, suppose that
contains a class of families which contain their extremal elements.
As this class contains the finite families, by hypothesis, it contains all the pairs of elements, which
are therefore all comparable. It follows from this that the lattice
is completely ordered, and
from the Matheron criterion that the class of families is the class of closed sets of
.
The proposition says that we must use a completely ordered lattice, without imposing a par-
ticular one. Therefore any lattice derived from a convenient one by an order-preserving bijection
is also usable. This allows a large number of solutions.
When we apply this proposition to a colour space, L*h*C* for example, it shows that if we do
not want to generate new colours, it is essential to construct a scalar function
for which we can construct the suprema and infima. The proposition does not give any
indication on the physical pertinence of a function , but guarantees that the procedure is
sufficient if is injective. As this is not generally the case, it is necessary to complete the
16
8/13/2019 Mathematical Morphology in the Lab Colour Space
http://slidepdf.com/reader/full/mathematical-morphology-in-the-lab-colour-space 17/48
numerical order of , so that one can order the points
and
where
. One can, for example, use cascades of lexicographical orders,
possibly dependent on the values of . In this new completely ordered lattice, the function is
replaced by a composite function , bi-unique, which permits one to assign a triplet
to a supremum or infimum of
.
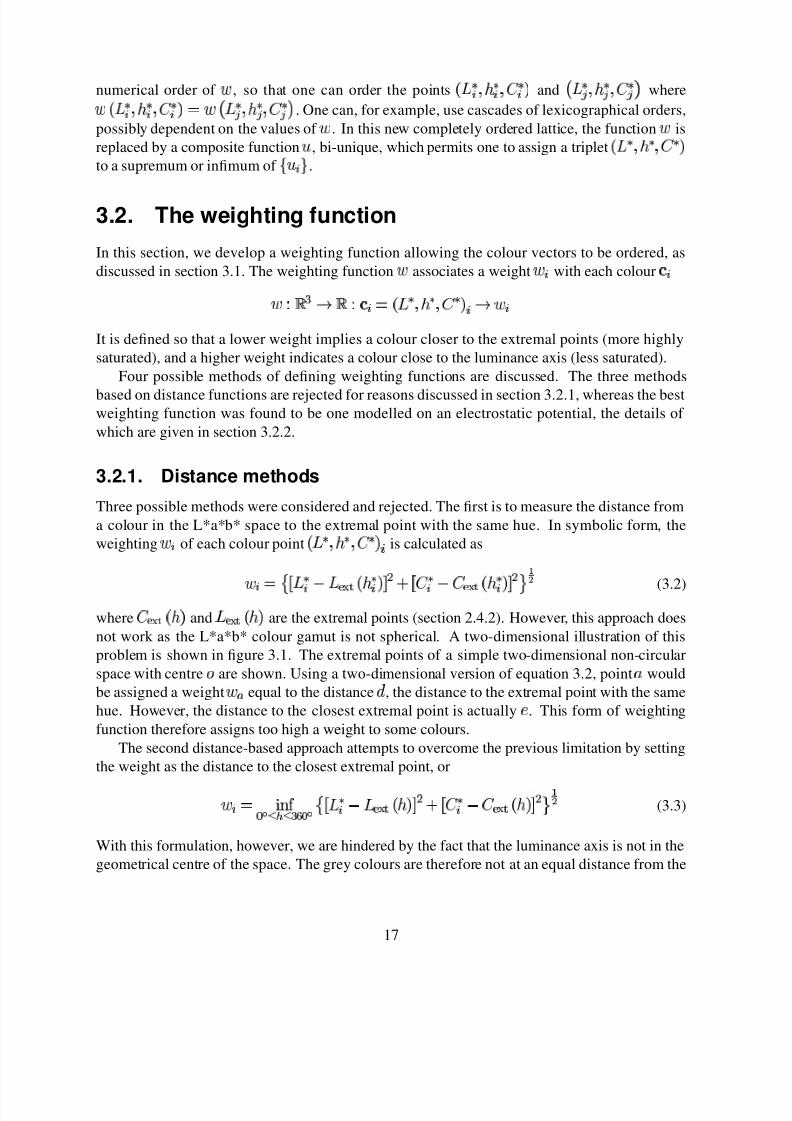
3.2. The weighting function
In this section, we develop a weighting function allowing the colour vectors to be ordered, as
discussed in section 3.1. The weighting function associates a weight
with each colour
It is defined so that a lower weight implies a colour closer to the extremal points (more highly
saturated), and a higher weight indicates a colour close to the luminance axis (less saturated).
Four possible methods of defining weighting functions are discussed. The three methods
based on distance functions are rejected for reasons discussed in section 3.2.1, whereas the bestweighting function was found to be one modelled on an electrostatic potential, the details of
which are given in section 3.2.2.
3.2.1. Distance methods
Three possible methods were considered and rejected. The first is to measure the distance from
a colour in the L*a*b* space to the extremal point with the same hue. In symbolic form, the
weighting
of each colour point
is calculated as
(3.2)
where
and
are the extremal points (section 2.4.2). However, this approach does
not work as the L*a*b* colour gamut is not spherical. A two-dimensional illustration of this
problem is shown in figure 3.1. The extremal points of a simple two-dimensional non-circular
space with centre are shown. Using a two-dimensional version of equation 3.2, point would
be assigned a weight
equal to the distance , the distance to the extremal point with the same
hue. However, the distance to the closest extremal point is actually . This form of weighting
function therefore assigns too high a weight to some colours.
The second distance-based approach attempts to overcome the previous limitation by setting
the weight as the distance to the closest extremal point, or
(3.3)
With this formulation, however, we are hindered by the fact that the luminance axis is not in the
geometrical centre of the space. The grey colours are therefore not at an equal distance from the
17

8/13/2019 Mathematical Morphology in the Lab Colour Space
http://slidepdf.com/reader/full/mathematical-morphology-in-the-lab-colour-space 18/48
a
e
d
Figure 3.1.: An illustration of the principal disadvantage of the first distance method proposed.
extremal points for all the colours. Thus the colours assigned the highest weights do not coincide
with the luminance axis. This leads to the undesired effect of sometimes assigning a non-grey
colour a higher weighting than a grey on the luminance axis.
The third approach tried is to make use of two-dimensional homothetic functions in the planes
perpendicular to the luminance axis. A homothetic function is defined so that, if we denote by
the distance from the centre to the extremal point at angle , the
-homothetic function passes
through all the points
, where
and
. The weight of a colour is
simply taken to be
. With this approach, we cannot take the extremal points correctly
into account — Every point on the envelope surrounding the colour gamut is given a minimum
weight of zero.
3.2.2. Electrical potential
The best solution found is to take the weighting as the value of a
potential in the L*a*b* space.
We choose to model this as an electrostatic potential obtained by placing “charges” at various
astutely chosen positions. Note that the electrostatic potential model is chosen for convenience.
We are in no way modelling a physical situation, only making use of a concept which is well
understood to simplify the problem at hand. We therefore do not make use of any units or
constants from electrostatic theory. One could just as easily visualise this model in terms of
gravitational potential, but with negative masses allowed. The actual numerical values of the
potential are not important, only the order which they impose on the colours.
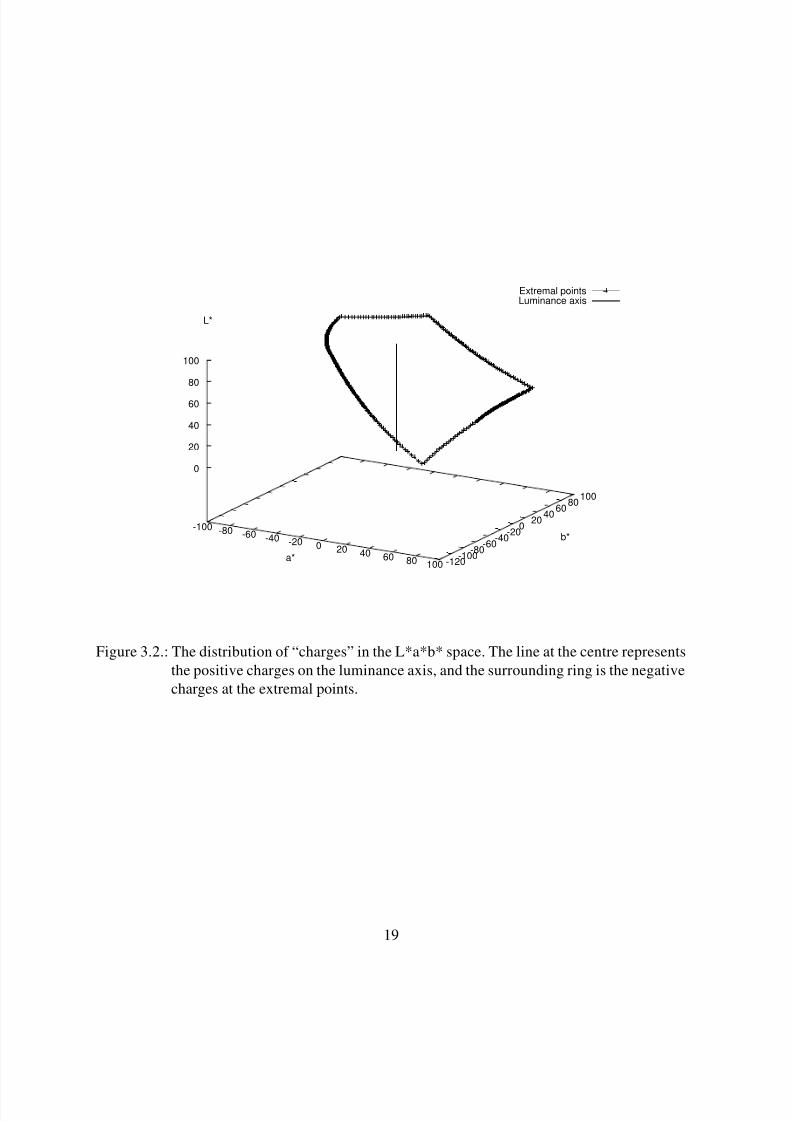
The potential is set up in the L*a*b* space by placing a line of positive “charge” on the lumi-
nance axis, thereby ensuring that the surrounding greys have the highest potential; and placing
negative “charges” at the extremal points, imposing minima on the potential field. This configu-
ration is illustrated in figure 3.2.
General expressions for the potential
The potential due to a line charge can be determined analytically, as is shown in appendix B.
Given a positively-charged line of length
, and a point on the line at a distance from the line
18
8/13/2019 Mathematical Morphology in the Lab Colour Space
http://slidepdf.com/reader/full/mathematical-morphology-in-the-lab-colour-space 19/48
Extremal pointsLuminance axis
-100 -80 -60 -40 -20 0 20 40 60 80 100a* -120
-100-80
-60-40
-200
2040
6080
100
b*
0
20
40
60
80
100
L*
Figure 3.2.: The distribution of “charges” in the L*a*b* space. The line at the centre represents
the positive charges on the luminance axis, and the surrounding ring is the negative
charges at the extremal points.
19

8/13/2019 Mathematical Morphology in the Lab Colour Space
http://slidepdf.com/reader/full/mathematical-morphology-in-the-lab-colour-space 20/48
centre, the potential at a point with a perpendicular distance of from point on the line
charge is
(3.4)
where
is the charge per unit distance,
and
. Note that for a numerical im-
plementation, it is not advisable to combine the two log terms into one, as this leads to numerical
instability.For the potential due to the negative charges at the extremal points, we assume that a charge
is placed at every integer hue degree
, so that the total potential
at
an arbitrary point due to these charges is
(3.5)
where is the Euclidean distance of extremal point
to the point at which the potential is being
calculated.
Adaptation to the L*a*b* space
The values and positions of the charges in the L*a*b* space are, of course, heuristically chosen to
produce the most useful potential function for the problem to be solved. As the numerical values
of the potentials are not important, the magnitudes of the charges can be adjusted to produce
potential values in a useful range.
We first consider the magnitudes of the negative charges
. Two “obvious” possibilities
exist, either each charge has an equal magnitude, or the magnitude of the charges is proportional
to their distance from the luminance axis. In order to compare these two possibilities, a simple
calculation in two dimensions is done. In a two-dimensional polar coordinate system
,
a positive point charge is placed at the origin, and negative charges are placed at the points
, where
. Two sets of equipotential lines are calculated:
1. The charges
at the extremal points all have equal magnitude, resulting in the equipoten-
tial lines drawn in figure 3.3a.
2. The charges
at the extremal points have magnitude proportional to
, with equipo-
tential lines drawn in figure 3.3b.
On comparing these two diagrams, it appears as if the second configuration is to be pre-
ferred. For this configuration, the equipotential lines near the extremal points are evenly spaced,
demonstrating that colours near these extrema will have equal weighting. In addition, the transi-
tion from the equipotential lines following the shape of the extrema to the circular ones near the
centre is smoother.
With the luminance axis, we aim to give a slight preference to lighter greys. This is ac-
complished by using a positively charged line of length
luminance units, with the
point of the luminance axis placed at the centre of this line. The effect of this line charge is best
20

8/13/2019 Mathematical Morphology in the Lab Colour Space
http://slidepdf.com/reader/full/mathematical-morphology-in-the-lab-colour-space 21/48

8/13/2019 Mathematical Morphology in the Lab Colour Space
http://slidepdf.com/reader/full/mathematical-morphology-in-the-lab-colour-space 22/48
Figure 3.4.: The equipotential lines due only to a line charge placed on the luminance axis.
appreciated by looking at vertical slices parallel to and passing through the luminance axis of
the L*a*b* space. Such a slice showing hues with value
on the right, and
on the left
is shown in figure 3.4. Equipotential lines have been superimposed on the space (the values of
the potential falling on a line are equal). They are due only to the positively charged line on the
luminance axis, so the potential decreases as one moves further from the centre.
Charge configuration chosen
For the L*a*b* space, the positive charge on the luminance axis and the negative charges at the
extremal points are combined to create a potential function in the space as described here. At the
point with coordinates
, the potential due to the positive line charge is calculated
using equation 3.4 with
,
,
and
. The potential due to the negative
charges at the extremal points is calculated using equation 3.5, with
and given by
equation 2.2 as
The weighting at point is then taken as the sum of these two potentials, or
(3.6)
Some diagrams of the equipotential lines in the L*a*b* space due to this charge distribution
are shown in figure 3.5. Each image shows a slice along a vertical plane of the L*a*b* space
parallel to and passing through the luminance axis, and hence showing colours corresponding to
two hue values:
to the right of the axis, and
to the left.
3.3. Basic operations
The use of the weighting function in morphological operations is demonstrated. The supremum
of a set of points corresponds to the most highly saturated colour, and hence to the point with the
lowest weight. Conversely, the infimum is the point with the maximum weight. The two images
used in the examples in this section, the L IZARD and MIRO images, are shown in figures 3.6a
and b.
22

8/13/2019 Mathematical Morphology in the Lab Colour Space
http://slidepdf.com/reader/full/mathematical-morphology-in-the-lab-colour-space 23/48
(a) –
(b) –
(c) –
(d) –
Figure 3.5.: The equipotential lines for some vertical slices through the L*a*b* space. The hue
values on the left and right of the luminance axis are given below each image.
23

8/13/2019 Mathematical Morphology in the Lab Colour Space
http://slidepdf.com/reader/full/mathematical-morphology-in-the-lab-colour-space 24/48
(a) (b)
(c) (d)
Figure 3.6.: The example images (a) L IZARD — a lizard statue in Barcelona (size
pixels) and (b) MIRO — “Le Chanteur” by Joan Mirò (size
pixels). (c)
and (d): The potential functions for images (a) and (b).
24

8/13/2019 Mathematical Morphology in the Lab Colour Space
http://slidepdf.com/reader/full/mathematical-morphology-in-the-lab-colour-space 25/48
3.3.1. Colour order
The weight (equation 3.6) is calculated for each colour vector in the L*a*b* space. A weight
image corresponding to a colour image is produced by replacing each colour pixel with its cor-
responding weight. The two weight images corresponding to figures 3.6a and b are shown in
figures 3.6c and d, where the grey-level represents the weight of the colour vector, and hence
darker pixels indicate colours which are closer to the extremal points.With the potential function approach, we have created a lattice of equipotential surfaces. The
colour vectors making up an equipotential surface have not yet been ordered. Unfortunately, the
best order for the colour vectors in the same equipotential surface is not obvious. In order to
obtain a complete ordering of the colour vectors, we make use of the lexicographical order. The
order of the equipotential surfaces is placed in the first level, followed by an arbitrary ordering
of the vectors in the same equipotential surface in the second and lower levels.
The following lexicographical orders for vectors
and
are introduced
(3.7)
and
(3.8)
where
is the hue origin chosen by the user, and
(3.9)
These two extra levels in the order relation are sufficient to completely order the colour vectors
as long as there are no spherical equipotential surfaces contained in the colour gamut. If use is
made of a charge configuration resulting in a spherically shaped equipotential surface included
in the colour gamut, then a fourth level relation for
would be necessary to retain the complete
ordering.
In a practical application of a morphological operator, the value of
is not critical, as it is
very seldom used, a phenomenon discussed further in section 3.5.
Note that the use of equation 3.9 does not directly result in a complete order, as is explained
in the following example. Two points
and
, where
is an arbitrary angle, have the same distances from the origin, even though they are not the
same point. We can impose a complete order by stating, for example, that in the situation where
and
, we take
if
, else
.
25

8/13/2019 Mathematical Morphology in the Lab Colour Space
http://slidepdf.com/reader/full/mathematical-morphology-in-the-lab-colour-space 26/48
3.3.2. Operators
Once these orders have been defined, the morphological operators are defined in the standard
way. The vector erosion at point
by structuring element
is
(3.10)
and the corresponding dilation by structuring element
is
(3.11)
An opening
is an erosion followed by a dilation, and a closing
is a dilation followed by
an erosion.
3.3.3. Examples
The first example demonstrates the behaviour of these operators. The L IZARD image was pur-
posely chosen as it contains highly coloured regions — the mosaic tiles — separated by greylines. The result of the erosion, dilation, opening and closing operators are shown in figure 3.7.
The operators produce the expected results, with the dilation operator enlarging the tiles, and the
erosion operator enlarging the regions between the tiles.
The second set of examples in figures 3.8 and 3.9 serve to illustrate the similarities and
differences between the approach presented for images in the L*a*b* space, and the analogous
approach in the HLS space of the lexicographical order with saturation in the first position [6].
The MIRO image used in the example is more demanding than the LIZARD image as it contains
black and white regions in addition to the coloured regions.
The results of the two approaches are strikingly similar, with the colours always being chosen
in preference to the black, white and grey pixels for the dilation operator. The main differences
are found when pixels of similar grey level or colours of similar saturation are ordered. Theeffects of the operators near the image borders have not been standardised, so the results in these
regions should be ignored.
3.4. Top-hat
One can create an operator analogous to the greyscale top-hat [12] for use on image in the L*a*b*
space. The greyscale opening top-hat is defined as
for all points
in
, and the greyscale closing top-hat is defined as
26

8/13/2019 Mathematical Morphology in the Lab Colour Space
http://slidepdf.com/reader/full/mathematical-morphology-in-the-lab-colour-space 27/48
(a) erosion (b) dilation
(c) opening (d) closing
Figure 3.7.: An (a) erosion, (b) dilation, (c) opening and (d) closing of the LIZARD image with a
square structuring element of size 2 (
).
27

8/13/2019 Mathematical Morphology in the Lab Colour Space
http://slidepdf.com/reader/full/mathematical-morphology-in-the-lab-colour-space 28/48
(a) L*a*b* erosion (b) HLS erosion
(c) L*a*b* dilation (d) HLS dilation
Figure 3.8.: The MIRO image eroded in the (a) L*a*b* and (b) HLS spaces, and dilated in the
(c) L*a*b* and (d) HLS spaces with a structuring element of size 2.
28

8/13/2019 Mathematical Morphology in the Lab Colour Space
http://slidepdf.com/reader/full/mathematical-morphology-in-the-lab-colour-space 29/48
(a) L*a*b* opening (b) HLS opening
(c) L*a*b* closing (d) HLS closing
Figure 3.9.: The MIRO image opened in the (a) L*a*b* and (b) HLS spaces, and closed in the
(c) L*a*b* and (d) HLS spaces with a structuring element of size 2.
29

8/13/2019 Mathematical Morphology in the Lab Colour Space
http://slidepdf.com/reader/full/mathematical-morphology-in-the-lab-colour-space 30/48
(a) opening top-hat (b) closing top-hat
Figure 3.10.: The (a) opening and (b) closing top-hats of the L IZARD image with a square of
size 2.
The L*a*b* space top-hat introduced here produces a greyscale image which encodes the
colour distances between pixels in the initial L*a*b* colour image and either its opening or
closing. The opening top-hat is
and the closing top-hat is
for all points
in
, where the notation
indicates the colour (Euclidean) difference
between vectors
and
(equations 2.1 and 2.2). Notice that as the distance is always positive,
the order of the images in the subtraction does not matter.An example of an opening and closing top-hat on the L IZARD image is shown in figure 3.10.
The closing top-hat, as expected, extracts the lines between the mosaic tiles. The intensity of the
pixels is proportional to the colour distance between the tiles and the lines surrounding them.
3.5. Lexicographical order statistics
When applying a morphological operator based on the lexicographical order described by rela-
tions 3.7 and 3.8, it is useful to know the proportion of comparisons for which a decision on
vector order is made based only on the first level, and the number of times the relations in the
second and third levels need to be used. This is especially important given that in the third level,there is a parameter
set by the user, and the effect of this parameter on the final result depends
on the number of times the third level of the relation is used.
An experiment counting the number of times each level of the relation was used in a com-
parison between colour vectors was thus performed. A morphological operation on an image of
30

8/13/2019 Mathematical Morphology in the Lab Colour Space
http://slidepdf.com/reader/full/mathematical-morphology-in-the-lab-colour-space 31/48
size
pixels with a square structuring element of size requires
vector
comparisons. For an image, the number of times each level was invoked to resolve a comparison
was counted, as well as the number of times a comparison was done on two identical vectors. As
we are dealing with floating-point images, it is necessary to define the largest difference between
two floating-point numbers which are considered to be equal, that is, for two arbitrary numbers and ,
if
. For the results below, we used
.
The experiments were performed on five images, and the erosion, dilation, opening and clos-
ing operators with a square of size 2 were applied to each image. The images are MIRO and
LIZARD used above; and CUGAT, FRUIT and FIFER which are shown in appendix C.
The results are shown in table 3.5. The image name and number of comparisons are given
in the first column. The second column lists the four operators applied to each image. The
third operator is a dilation of the eroded image to produce an opened image, and the fourth
operator is an erosion of the dilated image to produce a closed image. The third column shows the
percentage of comparisons which were resolvable using only the first level of the lexicographical
relation, and the fourth column shows the percentage of comparisons for which, after passing
through the three levels, the vectors turned out to be identical. The fifth and sixth columns show
the number of times that use was made of the second and third level relations to resolve the orderof two non-identical vectors.
For the images in the experiment, the third level relation is never used, so the value of
has no effect on the results. The second level relation is used only a negligible number of times.
As one would predict, the number of comparisons of identical pixels is larger when an operator
is applied to an image which has already been eroded or dilated (i.e. for the second step in the
opening or closing operators).
Even though it appears that the second and third levels can be removed without loss, it would
be simple to modify the order relation so that they play a more important part. If we coarsen the
weighting function by limiting its output to a finite number
of integer values (i.e. by using a
step function), then the utilisation of the second and third levels in the decision process is related
to the value of
. If
is small, then the second and third level relations will be needed moreoften to resolve the order of a larger number of vectors having equal weights.
3.6. Rotational invariance
By rotational invariance, we mean that the results are invariant to a change of position of the hue
origin. If we, for example, move the hue origin from the red segment of the hue circle to the blue
segment, we would ideally like the colour order to remain the same.
In the HLS space, the lexicographical order with saturation at the first level [6] is described
by the relation
31

8/13/2019 Mathematical Morphology in the Lab Colour Space
http://slidepdf.com/reader/full/mathematical-morphology-in-the-lab-colour-space 32/48

8/13/2019 Mathematical Morphology in the Lab Colour Space
http://slidepdf.com/reader/full/mathematical-morphology-in-the-lab-colour-space 33/48
(3.12)
The first two levels of this relation are obviously independent of the choice of the hue origin
. The hue only enters into the third level relation, and given the results of section 3.5, one
may be tempted to ignore this parameter as in practice it has little or no effect on the outcome of
the morphological operators. On the other hand, if we consider the complete ordering of all the
vectors in the HLS space, it is clear that the resulting order depends critically on the value of
.
The lexicographical order suggested for the L*a*b* space is similar to the above HLS space
order, and also consists of two levels which are rotationally invariant, and a third level depending
on the hue. These levels can be summarised as:
Order of equipotential surfaces (rotationally invariant).
Order of the luminance within each equipotential surface (rotationally invariant). This levelis in fact the order of a set of one-dimensional rings tracing out lines of equal potential and equal
luminance.
Order by hue within each equipotential equi-luminance ring (depends on the choice of a hue
origin).
In conclusion, the approach adopted in this report is to make the morphological operators
as “rotationally invariant as possible”. We do this by placing the relations which depend on the
choice of an origin in positions which have been experimentally shown to be almost never used,
so that in practice, their effect is almost negligible.
An alternative approach would be to start with operators which are designed to be rotationally
invariant on the hue, such as those introduced in [7], and add ways for them to take the othervector components into account. This remains to be explored.
33

8/13/2019 Mathematical Morphology in the Lab Colour Space
http://slidepdf.com/reader/full/mathematical-morphology-in-the-lab-colour-space 34/48
4. Conclusion
The use of a weighting function to impose an order on colours in the L*a*b* space is presented.
After introducing the theory underlying the use of a weighting function in the context of a vector
space, the electrostatic potential model is used as a basis for creating a weighting function which
simulates an order by colour saturation in the L*a*b* space. The weighting function has the
advantages of taking the positions of the luminance axis and extremal colours into account, and
being adaptable to many L*a*b* colour gamuts. The development of such a weighting function
is useful in that it avoids the necessity to transform to another colour space, an action possibly
accompanied by loss of colour information, before applying morphological operators based onan order by saturation. This is well demonstrated by the top-hat example, where we initially
ignore the inherent characteristics of the L*a*b* space by imposing an order based on colour
saturation, and then make intensive use of the perceptual uniformity characteristics during the
subtraction step.
The adaptation of the weighting function to other colour gamuts can be done by following
the steps presented in this report. One begins with the transformation of an RGB colour cube
completely filled with points to the L*a*b* space, after which the position of the extremal points
of the resultant colour gamut are found. The negative charges are placed at these extremal points,
and, not forgetting to take the positive charge on the luminance axis into account, the weight of
each colour can be determined.
The way in which the charge distribution at the extremal points is modelled should be im-proved. At the moment, the irregularly-shaped curve on which the extremal points are found is
approximated by a line of point charges. A formulation allowing these charges to be represented
as a continuous line charge, as for the line at the centre, will improve the results for highly satu-
rated colours. The calculation time of the weighting function is not critical, as the weight of each
colour only has to be calculated once for each colour gamut, after which a three-dimensional
look-up table can be used. An accurate implementation of the weighting function calculation
should therefore be possible.
This improvement in the accuracy of the weight calculation is necessary before this formu-
lation can be used for morphological reconstruction operators. With the current approximation
of the negatively charged line by relatively widely spaced point charges, some fully saturated
colours have lower weights than others, and one can therefore have an “invasion” of an image by
certain colours during a reconstruction process.
A possible useful modification to this technique could be to change the potential function
by adding charges elsewhere in the space. For example, if one is interested in regions of a
specific colour, an additional negative point charge could be placed at the position of this colour
34

8/13/2019 Mathematical Morphology in the Lab Colour Space
http://slidepdf.com/reader/full/mathematical-morphology-in-the-lab-colour-space 35/48
in order to modify the shape of the potential function. One would then still have the framework
potential function so that colours not affected by the new charge would continue to be treated in
a predictable way.
When designing colour morphological operators, one would ideally like them to be com-
pletely rotationally invariant so that they do not depend at all on the choice of a hue origin. Here
we have adopted the approach of sweeping the problem of rotational invariance as far under the
carpet as it will go, by placing the dependence on the hue origin in the third level of a lexico-
graphical order relation. Thus, the position of this origin is critical when ordering all the vectors
in the space, but as can be demonstrated experimentally, almost never taken into account when
applying morphological operators to images.
35

8/13/2019 Mathematical Morphology in the Lab Colour Space
http://slidepdf.com/reader/full/mathematical-morphology-in-the-lab-colour-space 36/48
A. Colour space conversions
The transformation from the RGB to the L*a*b* space requires a passage through the XYZ
space. It is during the transformation from RGB to XYZ that the characteristics of the image
capture or display device and the illumination conditions are taken into account. A derivation of
the transformation from the RGB to XYZ colour space is given in section A.1, and shows how
any set of primaries and white point can be taken into account. For people pressed for time, a
matrix for transforming from RGB to XYZ for a set of commonly used primaries and white point
is given in section A.2. The other necessary transformations are XYZ to L*a*b* (section A.3)
and the inverse transformations, L*a*b* to XYZ (section A.4) and XYZ to RGB (section A.5).The material in this appendix is mainly from Poynton [11] and Wyszecki and Stiles [16].
A.1. RGB to XYZ derivation
A.1.1. Primaries and white point
We are working in a tristimulus RGB space with primary stimuli
so that an arbitrary stimulus is written as
where
,
and
are called the tristimulus values.
In colourimetric practice, a two-dimensional representation is often used, in which the coor-
dinates of the colours in the plane
are given. These chromaticity coordinates are
defined as
36

8/13/2019 Mathematical Morphology in the Lab Colour Space
http://slidepdf.com/reader/full/mathematical-morphology-in-the-lab-colour-space 37/48
CIE-R
CIE-G
CIE-B
Rec.709-R
Rec.709-G
Rec.709-B
The CIE [16] and Rec.709 [11] primary chromaticity coordinates.
CIE-Illuminant A (tungsten filament lamp)
CIE-Illuminant B (direct sunlight)
CIE-Illuminant C (average daylight)
Rec.709
The chromaticity coordinates of some CIE standard illuminants [16] and the Rec.709 white point[11].
from which it follows that
In 1931, in order to overcome certain deficiencies in the RGB system, the CIE introduced a new
tristimulus coordinate system, the XYZ system, with corresponding chromaticity coordinates
where
The
chromaticity coordinates of the three CIE-RGB primary stimuli and the internation-
ally agreed primaries (Rec. 709 [8]) for high definition television (HDTV), which corresponds
closely to the primaries used in computer monitors, are given in Table A.1.1.
In order to completely specify an XYZ coordinate system, the coordinates of the three pri-
mary stimuli and the white point must be given. The white point is the colour obtained when the
,
and
tristimulus values are at their maxima. The chromaticity coordinates of some CIE
standard illuminants are given in table A.1.1, along with the coordinates of the Rec. 709 HDTV
standard white point. If the white point of an image is not known, there exist methods which can
be used to estimate it [2].
37

8/13/2019 Mathematical Morphology in the Lab Colour Space
http://slidepdf.com/reader/full/mathematical-morphology-in-the-lab-colour-space 38/48
The chromaticity coordinates
of the CIE D (daylight) illuminants with a correlated
colour temperature
can be calculated using the following equations [16]: For correlated colour
temperatures from approximately
K to
K:
For correlated colour temperatures from approximately
K to
K:
The
coordinate is calculated as
The CIE
daylight illuminant has a correlated colour temperature of approximately
K.
A.1.2. Transformation between two systems of primaries
The transformation between any two systems of primaries is linear. The relation between a colour
measured in the XYZ system and in the RGB system is
(A.1)
where
is the
matrix with columns giving the tristimulus values of the RGB primaries in
the XYZ coordinate system
The inverse transformation is
We know the chromaticity coordinates of the primaries. The tristimulus values are written in
terms of the chromaticity coordinates as
so that the matrix
becomes
38
8/13/2019 Mathematical Morphology in the Lab Colour Space
http://slidepdf.com/reader/full/mathematical-morphology-in-the-lab-colour-space 39/48
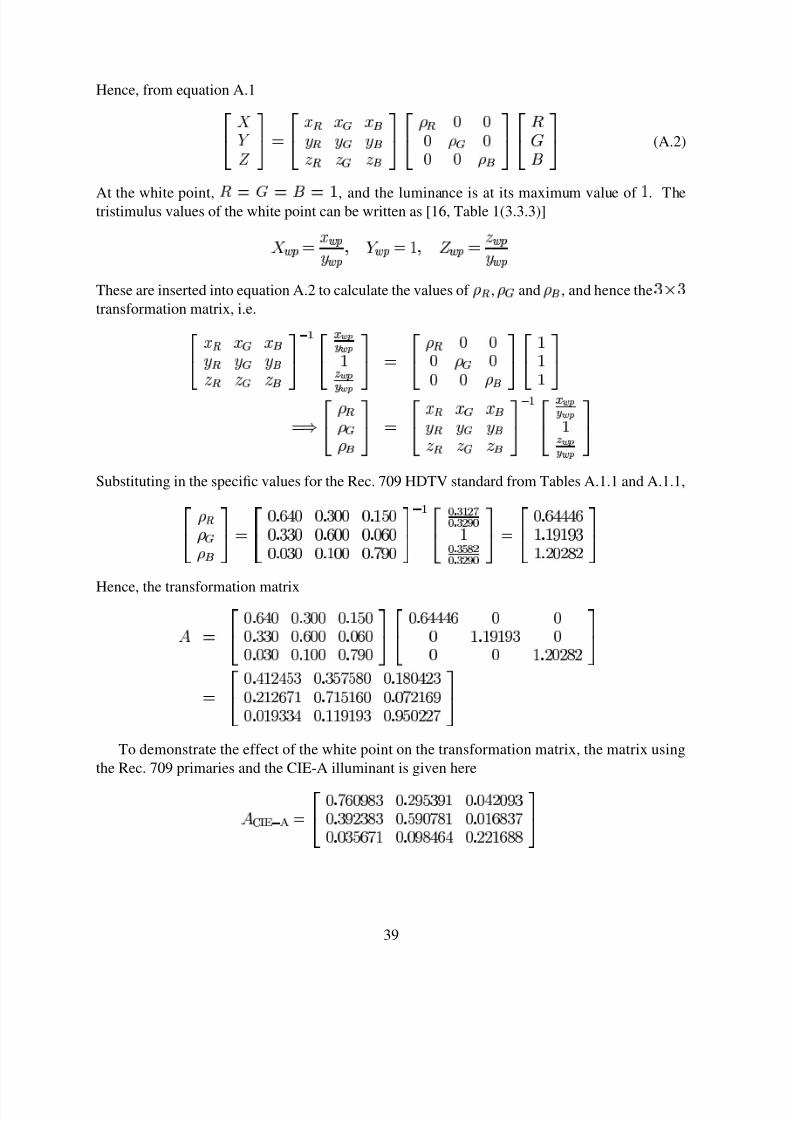
Hence, from equation A.1
(A.2)
At the white point,
, and the luminance is at its maximum value of
. Thetristimulus values of the white point can be written as [16, Table 1(3.3.3)]
These are inserted into equation A.2 to calculate the values of
,
and
, and hence the
transformation matrix, i.e.
Substituting in the specific values for the Rec. 709 HDTV standard from Tables A.1.1 and A.1.1,
Hence, the transformation matrix
To demonstrate the effect of the white point on the transformation matrix, the matrix using
the Rec. 709 primaries and the CIE-A illuminant is given here
39

8/13/2019 Mathematical Morphology in the Lab Colour Space
http://slidepdf.com/reader/full/mathematical-morphology-in-the-lab-colour-space 40/48
A.2. RGB to XYZ
The transformation from RGB into XYZ using the Rec. 709 HDTV primaries and white
point [11] is
(A.3)
A.3. XYZ to L*a*b*
The luminance
is calculated as
and
The chroma coordinates
and
are calculated as
where
and
The symbol represents any of ,
or
.
Note that the coordinates of the white point,
,
and
are obtained by substituting
the point
into equation A.3. The values obtained are
,
and
.
A.4. L*a*b* to XYZ
Note that this conversion from L*a*b* back to XYZ should be used only for visualisation of
an image, as information is lost in this conversion. This is because one cannot tell whether the
initial values of
and
were greater than or less than the threshold of
, and hence
which equation was used in the conversion to L*a*b*. In this conversion, we use the fact that
when
,
.
40

8/13/2019 Mathematical Morphology in the Lab Colour Space
http://slidepdf.com/reader/full/mathematical-morphology-in-the-lab-colour-space 41/48
If
then
else
The and
coordinates are calculated as
and
A.5. XYZ to RGBThe transformation from XYZ to RGB with the same primaries and white point as section A.2 is
41

8/13/2019 Mathematical Morphology in the Lab Colour Space
http://slidepdf.com/reader/full/mathematical-morphology-in-the-lab-colour-space 42/48
B. Derivation of the potential due to a
line charge
We have a line of linear charge density
on the -axis between the points
and . The charge
per unit length
. The units are ignored in this derivation.
d
x
P
Z b−a
The point P shown is at a distance perpendicular to the line charge from the origin O. The
potential at point P due to the charge on the line at point Z is
The potential at point P due to the charge on the whole line is obtained by integrating this
expression
where the second line is obtained from a table of integrals.
42

8/13/2019 Mathematical Morphology in the Lab Colour Space
http://slidepdf.com/reader/full/mathematical-morphology-in-the-lab-colour-space 43/48
C. Some further results
Some further examples of applications of the lexicographical order described in this report to
colour images are presented here. The images are FRUIT, CUGAT and FIFER. On each image,
an erosion, dilation, opening and closing has been applied, using a square structuring element of
size 2.
43

8/13/2019 Mathematical Morphology in the Lab Colour Space
http://slidepdf.com/reader/full/mathematical-morphology-in-the-lab-colour-space 44/48
(a) original
(b) erosion (c) dilation
(d) opening (e) closing
Figure C.1.: The FRUIT image (size
pixels).
44

8/13/2019 Mathematical Morphology in the Lab Colour Space
http://slidepdf.com/reader/full/mathematical-morphology-in-the-lab-colour-space 45/48
(a) original
(b) erosion (c) dilation
(d) opening (e) closing
Figure C.2.: The CUGAT image — Virgin by P. Serra, the central panel of a triptych in the
Monastery of St. Cugat, Barcelona (size
pixels).
45

8/13/2019 Mathematical Morphology in the Lab Colour Space
http://slidepdf.com/reader/full/mathematical-morphology-in-the-lab-colour-space 46/48
(a) original (b) erosion (c) dilation
(d) opening (e) closing
Figure C.3.: The FIFER image — “Jouer de Fifre” by E. Manet (size
pixels).
46
8/13/2019 Mathematical Morphology in the Lab Colour Space
http://slidepdf.com/reader/full/mathematical-morphology-in-the-lab-colour-space 47/48
Bibliography
[1] Heidelberger Druckmaschinen AG. Color manager manual. URL:
http://www.linocolor.com/colorman/sp_ciela_2.htm, 2000.
[2] Vlad C. Cardei, Brian Funt, and Kobus Barnard. White point estimation for uncalibrated
images. In Proceedings of the Seventh Color Imaging Conference (CIC’99) . Imaging Sci-
ence and Technology Society, November 1999.
[3] J. Chanussot and P. Lambert. Total ordering based on space filling curves for multivalued
morphology. In Proceedings of the International Symposium on Mathematical Morphology(ISMM ’98), pages 51–58, 1998.
[4] Mary L. Comer and Edward J. Delp. Morphological operations for colour image process-
ing. Journal of Electronic Imaging, 8(3):279–289, 1999.
[5] M. C. d’Ornellas, R. Boomgaard, and J. Geusebroek. Morphological algorithms for color
images based on a generic-programming approach. In Proceedings of the XI Brazilian
Symposium on Computer Graphics and Image Processing (SIBGRAPI’98). IEEE Press,
1998.
[6] Allan Hanbury. Lexicographical order in the HLS colour space. Technical Report N-
04/01/MM, Centre de Morphologie Mathématique, Ecole des Mines de Paris, 2001.
[7] Allan Hanbury and Jean Serra. Morphological operators on the unit circle. IEEE Transac-
tions on Image Processing, 10(12):1842–1850, December 2001.
[8] ITU-R Recommendation BT.709. Basic parameter values for the HDTV standard for the
studio and for international programme exchange. Geneva: ITU, 1990.
[9] Georges Matheron. Treillis compacts et treillis coprimaires. Technical Report N-5/96G,
Centre de Geostatistique, Ecole des Mines de Paris, 1996.
[10] R. A. Peters II. Mathematical morphology for angle-valued images. In Non-Linear Image
Processing VIII , volume 3026. SPIE, February 1997.
[11] Charles Poynton. Frequently asked questions about color. URL:
http://www.inforamp.net/˜poynton/PDFs/ColorFAQ.pdf, 1999.
[12] J. Serra. Image Analysis and Mathematical Morphology. Academic Press, London, 1982.
47

8/13/2019 Mathematical Morphology in the Lab Colour Space
http://slidepdf.com/reader/full/mathematical-morphology-in-the-lab-colour-space 48/48
[13] Jean Serra. Anamorphosis and function latices (multivalued morphology). In Edward R.
Dougherty, editor, Mathematical Morphology in Image Processing, chapter 13, pages 483–
523. Marcel Dekker, Inc., 1992.
[14] Pierre Soille. Morphological Image Analysis: Principles and Applications. Springer-
Verlag, 1999.
[15] H. Talbot, C. Evans, and R. Jones. Complete ordering and multivariate mathematical mor-
phology: Algorithms and applications. In Proceedings of the International Symposium on
Mathematical Morphology (ISMM ’98), pages 27–34, 1998.
[16] Günter Wyszecki and W. S. Stiles. Color Science: Concepts and Methods, Quantitative
Data and Formulae. John Wiley and Sons, deuxième edition, 1982.