application of mathematical morphology to...
TRANSCRIPT
22 Copyright © 2006 C.M.B. Edition
Cellular and Molecular Biology TM 52, N°2, 22-35 ISSN 1165-158X DOI 10.1170/T784 2007 Cell. Mol. Biol.TM
AAPPPPLLIICCAATTIIOONN OOFF MMAATTHHEEMMAATTIICCAALL MMOORRPPHHOOLLOOGGYY TTOO TTHHEE QQUUAANNTTIIFFIICCAATTIIOONN OOFF IINN VVIITTRROO EENNDDOOTTHHEELLIIAALL CCEELLLL OORRGGAANNIIZZAATTIIOONN IINNTTOO TTUUBBUULLAARR--LLIIKKEE SSTTRRUUCCTTUURREESS
J. ANGULO1✟ AND S. MATOU2A,2B
1✟
Centre de Morphologie Mathématique, Ecole des Mines de Paris, 35 rue Saint-Honoré, 77 300 Fontainebleau, France Fax: +33 1 64 69 47 07; Email: [email protected]
2A Institut Nationale de la Santé et de la Recherche Médicale U428, Université Paris V, 75006 Paris, France 2B IFREMER, Nantes, France Email: [email protected]
Received November 25th, 2005; March 22nd, 2006; Published April 27th, 2007
Abstract – Experiments of in vitro angiogenesis are important tools for studying both the mechanisms of formation of new blood vessels and the potential development of therapeutic strategies to modulate neovascularisation (e.g., screening of new pharmacological molecules). One of the most frequently used angiogenesis assays is the culture of endothelial cells on a reconstituted basement membrane named Matrigel, since the cells constitute a capillary-like network which can be quantified by image analysis. In this paper, a global, robust and fully automated methodology is proposed to segment and quantify in vitro endothelial cell networks from greyscale images using mathematical morphology operators. After extracting the established cell network by means of a top-hat transformation and separating the tubular structures and the cell aggregates by size and shape an interpolation algorithm yields a reconstituted closed network. Using these image data results different kinds of quantitative parameters are calculated: size/shape, morphological distribution, spatial organisation, etc. In this paper, we have established an automatic quantitative analysis to evaluate a modulator effect of a sulphated exopolysaccharide on FGF-2-induced in vitro angiogenesis, according to different parameters. Experimental results allow us to draw a discussion of the pertinence of the alternative morphological parameters to evaluate the characteristics and behaviour of cell cultures. Key words: endothelial cells, angiogenesis, quantitative image analysis, mathematical morphology, granulometry, top-hat transformation, watershed, morphological wavefront
INTRODUCTION
Angiogenesis, formation of new blood vessels from pre-existing ones, is a complex process involved in embryonic implantation (Sherer and Abulafia, 2001, 31), in development tissue (Martin et al., 1998, 21) and in wound repair (Li et al., 2003, 20). This process also contributes to the dissemination of solid tumor growth via metastasis formation or to the development of angioproliferative diseases (psoriasis, diabetic retinopathy, rheumatoid arthritis) (Folkman, 1995, 10). Endothelial cells constitute a monolayer lining the luminal surface of blood vessels and play a central role in angiogenesis process. Under an angiogenic factor effect, activated endothelial cells degrade the underlying basement membrane, migrate into surrounding vascular tissue toward the angiogenic factor and proliferate to increase the length of neo-vessels formed after cell differentiation (Kutryk and Stewart, 2003, 18).
Many in vitro and in vivo assays have been set up for the study of angiogenesis (Auerbach et al., 2003,2). Several candidate pro-angiogenic or anti-angiogenic factors have been identified by these assays which allow the study of their biological role or to test their potential therapeutic effect. In vitro
angiogenesis assays make it possible to interpret results in a shorter time at a lower cost and system
complexity than in vivo assays (Vailhé et al., 2001,32). Consequently, the need for quantitative angiogenesis assays has been growing in recent years (Donovan et al., 2001, 9). Among in vitro angiogenesis assays the most frequently used, the reconstituted basement membrane (Matrigel), is a fast angiogenesis assay that could be accompanied by an accurate and fast quantification analysis. In the contact with Matrigel, endothelial cells undergo morphological differentiation: they assume bipolar cytoplasmic elongations and spindle shapes, align and associate with others to form tubular-like structures. They can also clump together into cell aggregates and thus form anastomoses or branch points characterized by interconnecting segments. At the end of this cell differentiation step (about 18-24hrs) and according to experimental conditions, these tubular-like structures may organize into a capillary-like network. It has been shown that endothelial cells exert tractions on the matrix that generate planar guidance pathways used by cells which form a polygonal-like geometric network (Korff and Augustin, 1999, 17) (Davis and Camarillo, 1995, 8).

Morphological analysis of endothelial cell networks
23 Copyright © 2006 C.M.B. Edition
Fig. 1(a) shows the example of a culture of endothelial cells in a Matrigel support. The image (b) corresponds to the preparation after fixing and staining with Giemsa and illustrates the different morphological phenomena observed: cell aggregates, interconnecting segments, branch points and capillary-like network structure. By these regularities, it is possible to develop automated quantitative analysis based on image processing techniques.
Figure 1. (a) Example of endothelial cells culture in Matrigel support. (b) Example of image to be processed (culture cells after fixing and staining) illustrating the different morphological phenomena of the tubular-like cell network.
From fig. 1 (a) and (b), the tubular-like
structures formed on Matrigel before and after staining show that bi-dimensional morphometric parameters such as size/shape parameters, morphologic distribution of length, geodesic parameters are not modified. However, the depth of the Matrigel is affected by dehydration step towards a reduction. Compared to bi-dimensional geometric and morphologic parameters, this three-dimensional parameter is negligible and does not affect the accuracy of the estimated morphometric values. The interest of the staining is just to make easier the segmentation and quantification of the structures.
In this paper, a global, robust and fully automated methodology is proposed to segment and quantify in vitro endothelial cell networks from greyscale images using mathematical morphology operators. The complexity of the algorithms is relatively low and their execution is fast (i.e. taking less a minute by image). In particular, we have established an automatic quantitative analysis to evaluate a modulator effect of a sulphated exopolysaccharide on FGF-2-induced in vitro angiogenesis (23,24), with respect to the different
parameters. Experimental results allow us to draw a discussion of the pertinence of the alternative morphological parameters to evaluate the characteristics and behavior of cell cultures. State-of-the-art on the quantification of angiogenesis assays
Quantification of angiogenesis assays has been proposed in literature according to different approaches used to compare the morphological and geometric features of several types of cells and types of supports. Most of these methods are manual (Nicosia and Ottinetti, 1990, 27) (Brown et al., 1996, 6) or semi-automatic (Donovan et al., 2001, 9); these techniques are however slow, annoying and subjective. Several previous studies have reported attempts to use automated image analysis in order to improve the quantification of angiogenesis. The main problem has commonly been the segmentation of the cell network in the grey level images. In (Nissanov et al., 1995, 28) an automatic approach for segmentation of vessels in the rat aortic ring assay of angiogenesis is presented, but the quantification is relatively simple. A more elegant and interesting approach using mathematical morphology is proposed in (Blacher et al., 2001, 4) which has been used for advanced studies (Hajitou et al., 2002, 15). In (Gidolin et al., 2004, 13) a topological analysis using a classical skeleton and a fractal analysis to evaluate the complexity of a network is proposed.
Still, none of these solutions seem to be robust enough to deal with a vast variety of initial images as contrast, noise level and lighting conditions may greatly vary from one case to the other. While lot of work remains to be done on the definition of useful quantitative parameters which allow the interpretation of the results. Image processing in general (Master et al., 1990, 22) and mathematical morphology in particular (Laing et al., 1981, 19) (Vicent et Master, 1992, 33) have already been successfully applied to study the in vivo endothelial cells of the cornea; however the problems are very different, since the established cell network is homogenously constituted as an uniform cellular tissue.
Our purpose here is precisely to propose new ways to quantify robustly for instance the spatial progression of the vascular network, the topological features of the network, etc.
MATERIALS AND METHODS
In this section are included all the details concerning the biological assay (material and methods) and the acquisition of the microscopic field images.
Biological material and preparation

ANGULO J. AND MATOU S.
24 Copyright © 2006 C.M.B. Edition
Medium M199 (containing Hank’s salts, L-glutamine and 25mM HEPES), RPMI 1640 medium, antibiotics (penicillin and streptomycin), L-glutamine, Hank’s balanced salt solution with phenol red (HBSS), phosphate buffered saline (PBS), HEPES, 0.05% trypsin/0.02% EDTA, and versene were from Gibco BRL (Cergy-Pontoise, France); HBSS without phenol red was from Eurobio (Ulis, France); fetal bovine serum (FBS) was from ATGC (Noisy-le-Grand, France); collagenase A was from Boehringer (Mannheim, Germany); and gelatin was from Sigma Chemical Co. (St Louis, MO, USA). Growth factor-reduced Matrigel (without detectable FGF-2) was from Becton Dickinson Labware (Bedford, MA, USA). Human recombinant basic fibroblast growth factor (FGF-2) was from Valbiotech (Paris, France).
Exopolysaccharide was produced and secreted by a mesophilic strain (Alteromonas infernus) found in deep-sea hydrothermal events. This polysaccharide was purified and depolymerised according to the method described by Guezennec et al. (1998). Added to the radical depolymerization, an over-sulfation step was performed. So, this sulfated exopolysaccharide derivative is a homogenous fraction with an average molecular weight of 24000g/mol, as determined by analytical high-performance size-exclusion chromatography. This fraction is mainly composed of 31% neutral sugars (glucose, galactose), 19% uronic acids (glucuronic acid, galacturonic acid) and of 40% SO3Na.
Cell culture
Endothelial cells were isolated from human umbilical cords (HUVEC) by enzymatic digestion with 0.1% collagenase according to the method described by Jaffe et al (1973, 16) and modified by Giraux et al (1998, 12). HUVEC were cultured in M199 and RPMI medium (v/v) supplemented with 20% fetal bovine serum, 2mM L-glutamine, 10mM HEPES, 2.5µg/ml fungizone, 80units/ml penicillin and 80µg/ml streptomycin. They were seeded into flasks precoated with 0.5% gelatin and incubated in humidified 5% CO2-air at 37°C. Endothelial cells were identified by their typical cobblestone morphology. All experiments were performed with HUVEC at a second passage.
Endothelial cell treatment
HUVEC (3x10⁵ cells) were seeded on 0.5% gelatin-covered 6-well plates. After 24hrs, the medium was renewed by a medium containing the sulfated exopolysaccharide at concentrations varying from 0.1 to 100µg/ml with FGF-2 (5ng/ml). The conditioned medium (with or without polysaccharide and FGF-2) was renewed after 2 days of treatment. After 72hrs, the cells were detached from the well with versene -0.01% collagenase, then they were counted with a hematocytometer to be used for tubular-like structures formation assay. Matrigel tubular-like structures formation assay
Forty-eight-well plates were coated with 150µ l undiluted growth factor-reduced Matrigel (10mg/ml, Becton Dickinson, San Jose, CA), which was allowed to gel for 1hr at 37°C. Untreated HUVEC or treated HUVEC were suspended in medium containing only 5% FBS (without FGF-2 or polysaccharide) and seeded on Matrigel (3 x 10⁴ cells/well). After 18hrs incubation, the cells were then fixed with 1.1% glutaraldehyde. Matrigel was dehydrated with 75% ice-cold ethanol then 96% of ethanol before staining with Giemsa.
Image acquisition
Tube formation was examined by phase-contrast microscopy. For quantitative analysis, five fields (four quadrants and the center) of the Matrigel well were digitised by using a microscope (x 40 objective) equipped with a CCD camera connected to a computer equipped with the VEVA software. Each experiment was performed in duplicate.
OVERVIEW TO THE APPROACH
To automatically quantify the morphology of an endothelial cell network we have developed an approach of two main steps. The image analysis is based on firstly processing the original image to obtain intermediate images, which are used as the input to the second phase, which correspond to the quantification of the morphological parameters.
The image analysis starts with the extraction of the cellular structures by means of a top-hat transformation, following by the separation of the tubular structures and the cell aggregates. An interpolation algorithm yields a reconstituted closed network and the skeleton of the tubes is also calculated by a thinning transformation. Then from these transformed images, different kinds of quantitative parameters are calculated. While the isolated cells and the cell aggregates are described both by a series of scalar size/shape parameters and by two curves of multi-scale aggregation. The quantification of the tubular-like structures implies the determination of the following geometric and morphologic parameters: (i) series of scalar size/shape parameters, (ii) morphological distribution of length, (iii) geodesic parameters such as branch points and extremities and (iv) spatial organisation of the reconstituted closed network.
Mathematical morphology is a nonlinear image processing theory based on the application of lattice theory to spatial structures. A tutorial can be found in (Serra, 1982, 1988, 29). Additional references to particular operators are also given in the text.
Further details of the different algorithmic steps are given below in Sections 4 and 5. The summary of the experimental results achieved and the associated discussion are presented in Section 6. Finally, the conclusions and perspectives of the present work are reported in Section 7.
AUTOMATED IMAGE ANALYSIS
The goal of this section is to introduce the full automated image processing steps of the approach. In order to easily follow the algorithms some examples and intermediate images are included.
We must point out that image analysis is only fully automated only if the image acquisition is performed under relatively similar conditions

Morphological analysis of endothelial cell networks
25 Copyright © 2006 C.M.B. Edition
(e.g., staining procedure, microscope magnification, CCD camera performance, etc.). For similar endothelial cell images from other
laboratories, some parameters of the algorithms would probably need to be adjusted.
Notations and main operators In the framework of digital grids, a grey level
image can be represented by a function I: D I →T, where DI is a subset of Z2 and T={tmin,…, tmax} is an ordered set of grey-levels. Let B be a subset of Z2 and s∈N a scaling factor. sB is called structuring element (shape probe) B of size s. The basic morphological operators are: • Dilation: δB(I(x))=supy∈B{ I(x-y)}
• Erosion: εB(I(x))=inf-y∈B{ I(x-y)}
The two elementary operations of erosion and dilation can be composed together to yield a new set of operators having desirable feature extractor properties which are given by: • Opening: γB(I)=δB[εB(I)]
• Closing: ϕB(I)=εB[δB(I)]
The morphological openings (closings) filter out light (dark) structures from the images according to the predefined size and shape criterion of the structuring element.
A morphological tool that complements the opening and closing operators for feature extraction (extract the marked particles) is the morphological reconstruction, implemented using the geodesic dilation operator based on restricting the iterative dilation of a function marker I by B to a function mask J, i.e., δn
J (I) = δ1Jδn-1
J (I), where δ1J (I) =
δB(I)∧J. The reconstruction by dilation is defined by γrec (J,I) = δi
J (I), such that δiJ (I) = δi+1
J (I) (idempotence).
A granulometry is the study of the size distribution of the objects of an image. Formally, a granulometry can be defined as a family of openings Γ=(γn)n≥0 such that ∀n≥0, ∀m≥0, γnγm = γmγn = γmax(m,n). Moreover, a granulometry by closings (or anti-granulometry) can also be defined as a family of increasing closings Φ=(ϕn)n≥0. Performing the granulometric analysis of an image I where Γ is equivalent to mapping each opening of size n with a measure M(γn(I)) of the opened image. M(I) is the area of I in the binary case (number of pixels) and the volume in the grey scale case (sum of pixel values). The size distribution or pattern spectrum of I with respect to Γ, denoted PSΓ(Ι ) is defined as the following (normalised) mapping:
PSΓ (Ι, n) = [ M(γn(I)) - M(γn+1(I))] / M (γ0(I)), n≥0 The pattern spectrum PSΓ(Ι , n) maps each size n
to some measure of the bright image structures with this size (loss of bright image structures between two
successive openings). The pattern spectrum PSΓ(Ι , n) is a probability density function (a histogram): a large impulse in the pattern spectrum at a given scale indicates the presence of many image structures at that scale. It is also possible to use standard probabilistic definitions to compute the moments of PS. The first moment µ is given by µ=µ1=Σn nPS(I,n), the k-th pattern spectrum moment, k≥2, is computed as µk=Σn (n-µ) k PS(I,n).
The distance function of a binary set X is a mapping distX(x) that associates to each point x∈X its distance to the background Xc, i.e., distX(x)=infx∈Xc d(x,y). The distance d(x,y) between two points x and y is usually defined by the length of the shortest path joining x to y (a path (x0, x1,…, xN) being a sequence of points of the grid such that, for each i, xi+1 is a neighbour of xi). Many algorithms have been proposed to compute the distance function (Borgefors, 1986, 5). The distance function is used as the transition between the binary images and the grey level images.
The watershed line is one of the most powerful tools for segmenting images (Beucher and Meyer, 1992, 3). The watershed line of the function I associates a catchment basin to each minimum of this function. Using the watershed on a grey tone image without any preparation leads to a strong over-segmentation. The best solution to this problem consists in initially determining markers for each region of interest (the image corresponding to the markers is denoted M). The other possibility is to filter the image I for removing the parasitic minima (the new minima can be considered as the markers M). It is then possible to construct a watershed line associated with these markers Wshed(I,M ).
Endothelial network extraction
Let I culture be the original grey level image of a culture of endothelial cells. In this image, the cytological structures appear as dark upon a bright background relatively variable (shading effect). In order to filter out the noise and the small mistakes of digitalization, the first step is a Gaussian filter of size n×n, Gn×n (typically n=3), followed by an opening of size s1 which removes the small bright particles in the tubes (they could “disconnect” the structures which belongs to the same tube), i.e., I’ culture = γs1(Gn×n (I culture)), such that the value of s1 must be

ANGULO J. AND MATOU S.
26 Copyright © 2006 C.M.B. Edition
smaller than the typical diameter for a tube; experimentally we have fix s1 = 4.
The top-hat transformation is a powerful operator which permits the detection of contrasted objects on
non-uniform backgrounds (Meyer, 1977, 26). The black (or dual) top-hat transform is the residue of a closing ϕ(I) and the initial image I and it is used for
extracting dark structures. Therefore, from the image I’ culture, a black top-hat, ρ-
s2, enhances the endothelial network structures, I’’ culture = ρ-
s2 (I’ culture) = ϕs2 (I’ culture) - I’ culture, where s2 corresponds to the size of the biggest cellular structure which can be found. After different tests, the value has been experimentally fixed to s2 = 20. The structuring element B for the above presented transformations is a circle.
On the image I’’ culture a thresholding operation T[u,
tmax] is performed to provide the binary mask of the endothelial network (the interval [u, tmax] determines the set of grey levels associated to the object of interest): Inet = T[u, tmax] (I’’ culture); here the choice of the threshold value is not critical (the top-hat facilitates just the thresholding), e.g. u = 40. In fig. 2 an example for extracting the endothelial network by means of the present algorithm is depicted. Systematic tests on a selection of images have shown that the approach is quite robust.
Figure 2. Extraction of the image structures corresponding to the endothelial network: (a) original image Iculture, (b) opening of size 4, I’ culture = γ4(Gn×n (Iculture)), (c) dual top-hat of size 20, I’’ culture = ρ-
20
(I’ culture), (d) binary image after thresholding, Inet = T[40,
255] (I’’ culture) (here is shown the negative).
Separation of tubular structures / cell aggregates
In this second stage of the segmentation, the aim is the separation of the tubular-like structures (which constitute the actual endothelial network) from the isolated cells and the cellular clusters or aggregates (which have no elongated shape) on the other hand. That is, to classify the structures of Inet according to two criteria,
• Size: The size of the connected component X (a binary set) is calculated by its surface area (i.e., the number of pixels), A(X).
• Shape: Based on the form factor or circularity index of a set X, i.e., FF(X)=P(X)2 / 4πA(X), which is equal to 1 for a circle-shaped object. The FF increases when the shape becomes elongated or irregular, or if its boundary becomes wiggly.
The isolated cells and the cellular clusters are structures with a surface area smaller than a given threshold, usize; or structures with a larger surface area but with an index of circularity smaller than a fixed threshold, ucircular. The endothelial tubes (and the lengthened clusters or quasi-tubes) are the structures with a surface larger than usize and with an index of circularity larger than ucircular. Connected cell aggregates with large surfaces are also considered as a part of the network (by their irregularity, their FFs are large); and in fact, this is profitable to use these aggregates as anchorage points of the tubes in the network.
See in fig. 3 (a) an example of the classification of the connected components in a binary image with the tubular structures, I tubes, and another image with the isolated cells and the cell aggregates, Icells. After an exhaustive analysis on a representative selection of images, we found that for our images the application of the values usize = 200 and ucircular = 1.5 provides good results for classifying the structures.
Figure 3. Binary processing of the endothelial network (negative images are shown). Separation of the tubular structures and the cell

Morphological analysis of endothelial cell networks
27 Copyright © 2006 C.M.B. Edition
aggregates using the criteria of size and shape (usize=200 and ucircular=1.5): (a1) Inet, (a2) Icells, (a3) Itubes. Morphological skeleton by homotopic thinning of the tubes: (b) Isk-tubes = Thinnτ (Itubes).
Skeleton of tubes by thinning
The concept of skeleton of a binary set X is very intuitive however, its mathematical definition is not simple. Here, we propose to build the morphological skeleton using the thinning transformation. The thinning τB(X) is a morphological operator which is the subtraction between the input image and the hit-or-miss transformation:
ηB = (B', B'') = ε B'' (X) ∩ ε B' (Xc)
with the structuring elements B' and B'' (B'∩B''=∅), i.e., τB(X) = X \ ηB(X). The result is an image preserving the pixels which center contains the pattern specified by B' and B'' marked as zero and removing the pixels which satisfies the pattern given by the structuring elements B' and B''. The skeleton by thinning, Thinnτ, is the application until stability (or nτ times) of the thinning operator using a sequence of structuring elements B' and B'', generated by successive rotations of a pattern. See in (Serra, 1982,29) details on the suitable series of patterns to be used to obtain homotopic skeletons.
Note that the skeleton is calculated only for the endothelial tubes: Isk-tubes = Thinnτ (I tubes). In practice, the iteration nτ = 20 is sufficient for the structures which one can find on these networks. In the fig. 3 (b) an example of the application of the algorithm is given, after separation of the tubular structures. The skeleton Isk-tubes later allows the calculation of several parameters for the tubes. Interpolation of partial tubular network
On the images of endothelial cell networks (see the original ones in fig. 1 and 5), we can observe that tubular-like structures have the tendency to be organised into polygonal structures which lead to a network. This geometrical organisation in a network, which divides the space (partition of the space), is very interesting to know the biological/physical phenomena involved in the process of cellular differentiation. For instance, one could be interested by the state of formation of the network or by the number and the average surface of the polygons, etc. Consequently, it seems important to be able to evaluate which would have been the natural differentiation of the cellular structures if the network would have continued to be formed and also which is the current state (after fixing the cellular culture) compared to the supposed final one. From the mathematical morphology viewpoint, we can regard that as the interpolation of the network structures. We discuss here an algorithm for this binary interpolation.
We propose the application of the watershed transformation on the distance function for the
interpolation of the tubular structures (this is the dual algorithm of the classic approach for the separation of overlapping particles).
Figure 4. Interpolation of the tubular-like image structures: (a) initial image Itubes (negative), (b) filtered distance function, I’ dist-tubes , (c) watershed lines superposed on the original structures, I interpol-tubes , (d) result of the interpolation of the tubular network on the culture image. This approach was satisfactory used for extracting
the 3D structures in polyurethane foam (7). The common methodology is quite simple and is achieved in three steps (see fig. 5 for an example of interpolation):
Figure 5. Three examples of morphological inter-polation of the partial tubular network.

ANGULO J. AND MATOU S.
28 Copyright © 2006 C.M.B. Edition
1. Computation of the distance function of the negative of the binary image, i.e., Idist-tubes = dist(Ictubes). The maxima (positive peaks) of the function distance are the centers of the quasi-polygons (the zones between the tubes) and the minima (valleys) are associated to the tubular structures.
2. Simplification of the distance function by means of an opening by reconstruction using as marker the function obtained by subtracting a constant value h from the distance function: I’dist-tubes = γrec(Idist-tubes , Idist-tubes - h). The maxima of the distance function after filtering will depend on the value of h and these maxima are important as markers for the watershed line which interpolates the structures (ideally, we need a maximum for each center of polygon). We found that using h=5 the results are satisfactory.
3. Determination of the watershed for the negative of the simplified distance function:
Iinterpol-tubes = Wshed((I’dist-tubes)c, Min ((I’dist-tubes)
c)). This transformation provides a means of deciding if the beginning of a structure must be prolonged, to be linked with another neighbouring structure (that is, if this edge creates a minimum of the distance). In fig. 5 the result of the application of the algorithm on three networks of tubes is shown. It is possible to find a good trade-off between false positives and false negatives, due to the result of the initial detection of tubes as well as the size of filtering.
MEASURED PARAMETERS AND
MORPHOLOGICAL QUANTIFICATION
Once these images have been obtained, the binary connected components corresponding to the elements of the
endothelial network can be analysed. The different steps of quantification are considered in this section. Quantification of cell aggregates
In order to quantify the cell size/shape, classical global parameters can be calculated from the binary connected components of image Icells: (1) Normalised Number of Cells (relative to the studied surface) Nnorm
cells = Ncells / Npixels, (2) Relative Area of Cells (in comparison with the area of tubes) Acells = A (Icells)/ A (Inet), (3) Cell Mean Area Amean
cells = A (Icells)/ Ncells. It is more interesting to calculate the distribution and the spatial organisation (dispersion) of the isolated cells/clusters compared to the tubular-like structures. To do that, we propose a study of cell aggregation based on computing a granulometry, combined with the skeleton of influence zones, SKIZ. The influence zone of a connected component Xi of X is the set of points of the plane that are closer to Xi than to any other component of X. The SKIZ(X) is then defined as the boundary of all zones of influence (29).
In fig. 6 (a) an example of aggregation analysis is given. Starting from this morphological muti-scale decomposition it is possible to define two curves. The Anti-Granulometry Curve of Cells, PS(Icells , -n), which corresponds directly to the pattern spectrum by closings, associating to each size n the increasing surface taken up by the cell aggregates (40 ≤ n ≤ 160). n → PS(Icells , -n) = [ M(ϕn(Icells)) - M(ϕn-1(Icells))] / M (ϕ0(Icells))
A second curve is derived from the n images SKIZ(ϕn(Icells)). The Aggregation Curve of Cell Regions, AGCR(Icells , n) is obtained by computing for each n the standard deviation of area of influence regions, i.e., AGCR(Icells , n) = σAskiz (n).
Figure 6. Aggregation analysis of cells by means of anti-granulometry from Icells. (a1)-(a4) isotropic closings ϕn(Icells) of size n=0, n=40, n=60 and n=80 respectively; where the corresponding SKIZ is superposed. (b1) Anti-granulometry Curve of Cells associated and (b2) the corresponding Aggregation Curve of Cell Regions.

Morphological analysis of endothelial cell networks
29 Copyright © 2006 C.M.B. Edition
This curve yields a compact description of dispersion in the aggregation (peaks correspond to maximal disorder). As we will shown below the aggregation curves are very useful to compare different cell populations obtained according to the concentration of the molecule to be tested. Quantification of tubular structures
Again, starting from I tubes and Isk-tubes, several global parameters can be defined in order to quantify the tubular structures: (1) Normalised Number of Tubules, Nnorm
tubes = Ntubes / Npixels, (2) Relative Area of Tubules, Atubes = 1-Acells , (3) Tubule Mean Area, Amean
tubes= A (I tubes) / Ntubes, (4) Normalised Length of Tubules, Lnorm
tubes = A(Isk-tubes) / Npixels,, (5) Tubule Mean Length, Lmean
tubes= A(Isk-tubes) / Ntubes, (6) Thickness Factor of Tubules, TFmean
tubes = Σi TFi /
Ntubes, where the thickness factor of tubule i is defined as the ratio of areas, i.e., TFi = Ai
sk-tube/ Ai tube.
However, in order to quantify adequately the tubes, a granulometry analysis can again be applied. In fact, the most indicated transformation to be used is a linear opening of size n which is obtained by the supremum of openings according to several directions, i.e., γL
n = γ0°n ∨ γ45°
n ∨ γ90°n ∨ γ315°
n . Then, the associated granulometry or Linear Pattern Spectrum of Tubes, LPS(I tubes,n), allows us to describe length distribution of tubular structures:
n → LPS(Itubes,n) = [ M(γLn(Itubes)) - M(γL
n+1(Itubes))] / M (γL0 (Icells)),
with 10≤n≤150. Fig. 7 shows an example of LPS(I tubes,n). Its
derived moments (mean and variance) are very useful to estimate compactly the length distribution of tubes. Besides the previous length parameters, for this type of tubular network, it is interesting to quantify other intrinsic features to evaluate the complexity of their ramified structure. These characteristics are mainly the extremity points and the branch points of the particles.
Figure 8. Geodesic description of tubular structure: (a) end-points and triple-points from skeleton by thinning, (b) two examples of extremities and branch points from geodesic distance function.
A classical way to obtain these two features
consists of, starting from the skeleton of the tubes, obtaining the end-points and the triple-points by means of the hit-or-miss transformation, see example in fig. 8 (a). However, we prefer to use the technique of morphological wavefronts (30), which consists in considering the geodesic distance as an isotropic wave, with a origin at the most distant extremity, and to study the evolution of the connected components (branching points) as well as the maxima of the geodesic distance function (extremity points). The most important advantage of this method with respect to the skeleton is that the passage that we can make from a binary object to a weighted graph which describes its characteristics (with this second more compact representation), the analysis of the object can be done more effectively. All details concerning the implementation can be found in (1) and the theoretical background in (30). Fig. 8 (b) shows two examples of extremities/branches obtained by this technique. So, from a quantitative viewpoint, we propose three parameters for the endothelial cell networks: (1) Normalised Number of Ends, Nnorm
ends (for all tubes of the network with respect to the surface), (2) Normalised Number of Branch Points, Nnorm
branches, (3) Tubule Mean Geodesic Length Factor, ρmean
tubes = Σi ρi / Ntubes, where ρ = πL2/4S, such that L
is the geodesic length of the tube (obtained from the morphological wavefront) and S its surface.
Figure 7. Granulometric analysis of Itubes using a linear pattern spectrum: (a1)-(a3) linear openings γLn(Itubes) of size n=0, n=5 and n=10 respectively (negative images). (b) Associated granulometric curve (linear pattern spectrum).
ANGULO J. AND MATOU S.
30 Copyright © 2006 C.M.B. Edition
Finally, starting from the result of the morphological interpolation Iinterpol-tubes, we propose a last set of parameters to characterise the progression of differentiation cellular process consider as associated to the spatial network organisation. The result of this polygonal partition of space Iinterpol-tubes is very similar to the result of a SKIZ; and mathematically, it is rather close to a known probabilistic model of space partition (the partition of Voronoï). However, to quantify the spatial partitions obtained by interpolation we propose to use simple scalar parameters: (1) Normalised Number of Polygons, Nnorm
polygons, (2) Normalised Length of Polygons, Lnorm
polygons, (3) Network Progression Factor, NPF = A(Inet ∧ Iinterpol-tubes) / A(Iinterpol-tubes), (4) Polygon Mean Area, Amean
polygons, (5) Polygon Standard Deviation Area, σApolygons .
RESULTS AND DISCUSSION
After a pretreatment for 72hrs incubation of HUVEC with or without FGF-2 (angiogenic growth factor) in the presence of different concentrations (from 0.1 to 100µg/ml) of sulfated exopolysaccharide, EPS, alone untreated or treated endothelial cells were seeded on Matrigel. After a FGF-2 pretreatment and during 18hrs of culture on Matrigel, activated endothelial cells adhered, aligned, migrated and formed tubular-like structures into a partially organized capillary-like network. When HUVEC were previously treated with FGF-2 and EPS, this sulfated polysaccharide modulated the density of the capillary-like network induced by FGF-2 in a concentration-dependent manner. For the different concentrations of FGF-2 + EPS (and for a
negative control), five image fields were acquired and each experiment was performed in duplicate.
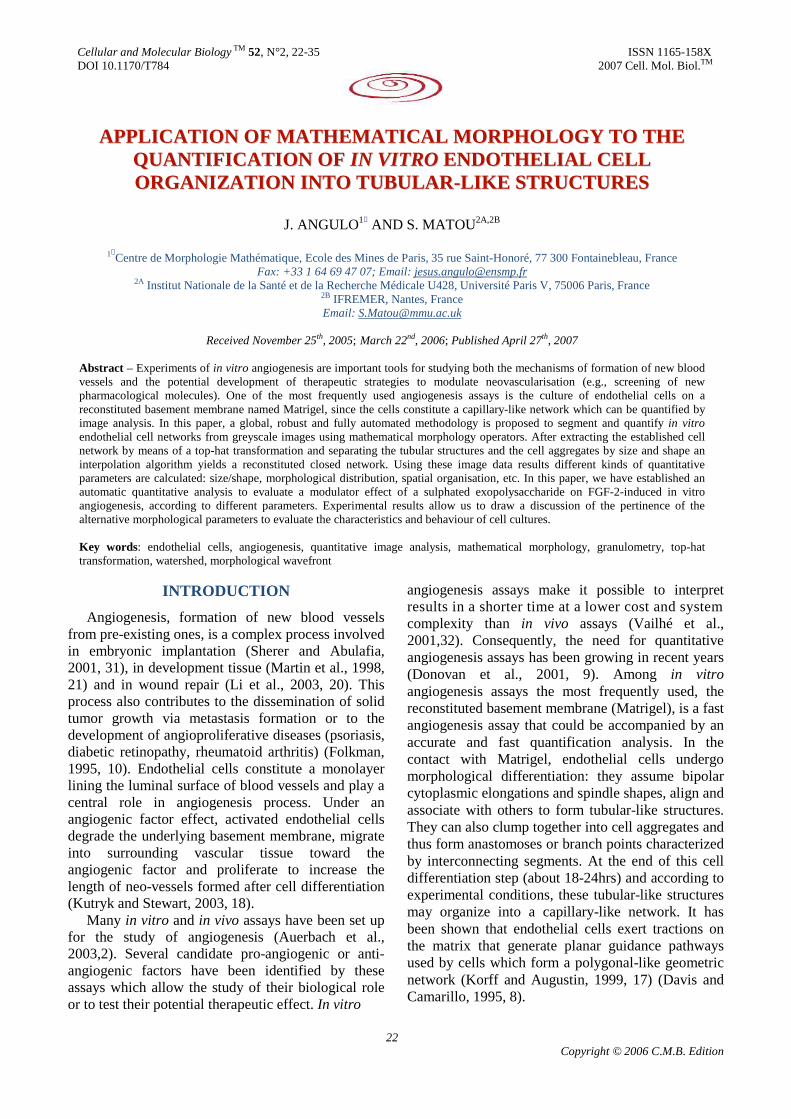
Figure 9. Example of an image field for each endothelial cell culture used in the study of the effect of sulphated exopolysaccharide (EPS) on FGF-2-induced network structures: (a) negative control, NC (untreated), (b) FGF-2 alone, (c) FGF-2 + EPS tested at 0.1µg/ml, (d) FGF-2 + EPS at 1 µg/ml, (e) FGF-2 + EPS at 10µg/ml, (d) FGF-2 + EPS at 100µg/ml.
Therefore ten images are available for each cellular culture. In Fig. 9 the example of an image field for each endothelial cell culture used in the study is given.
The automated morphological analysis was performed on four image fields (selected randomly from the ten). All of the above presented morphological parameters were computed and the mean of the four processed images is considered as summary of these morphological parameters are depicted in Fig. 10 to 15. As it is showed in Fig. 9, endothelial cell differentiation into tube-like structures was only observed by the presence of FGF-2 with or without EPS (between 0.1 and 10µg/ml) whereas no or a few tubule-like structures were observed without FGF-2 (negative control) or with FGF-2 + EPS tested at 100 µg/ml, respectively.
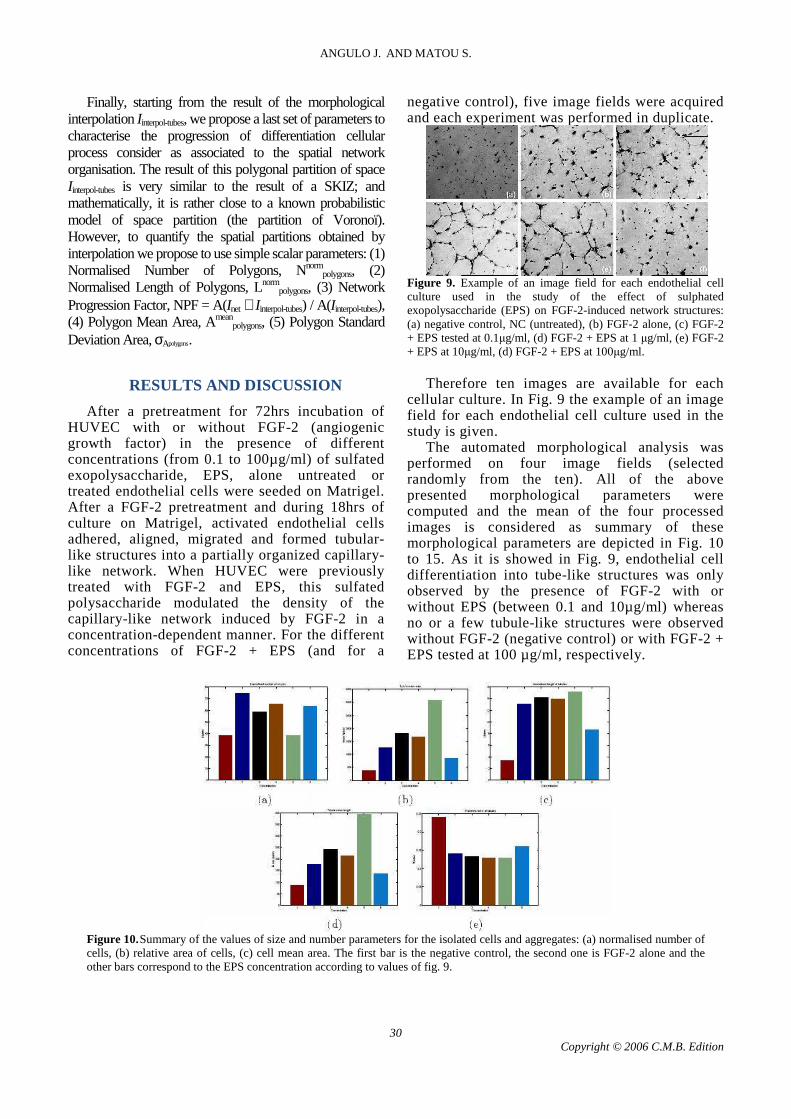
Figure 10. Summary of the values of size and number parameters for the isolated cells and aggregates: (a) normalised number of cells, (b) relative area of cells, (c) cell mean area. The first bar is the negative control, the second one is FGF-2 alone and the other bars correspond to the EPS concentration according to values of fig. 9.
Morphological analysis of endothelial cell networks
31 Copyright © 2006 C.M.B. Edition
To optimize the quantification of tubes, some morphological parameters such as isolated vs. aggregated cells were analysed. From these parameters two main cell populations were characterized, non- or less-differentiated and differentiated cells. From the non- or less-differentiated cells, many isolated cells (especially from negative control) were quantified with maxima values obtained for the relative area of cells and cell mean area (especially for FGF-2 + EPS at 100µg/ml). With their curves describing the pattern spectrum of cell aggregation or aggregation of cell regions which
showed similar profiles reaching the same peak of PSAG (Fig. 11 (a)) or the same start point in AGCR and final point in size of closing (Fig. 11 (b)). These morphological parameters indicate that isolated cells with mainly round shapes were homogenously distributed on Matrigel. Concerning differentiated cells, low number of normalised isolated cells were quantified, especially from experimental conditions FGF-2 + EPS tested at 1 and 10µg/ml with the lowest values of cell relative area and of cell mean area from FGF-2 + EPS at 10µg/ml only.
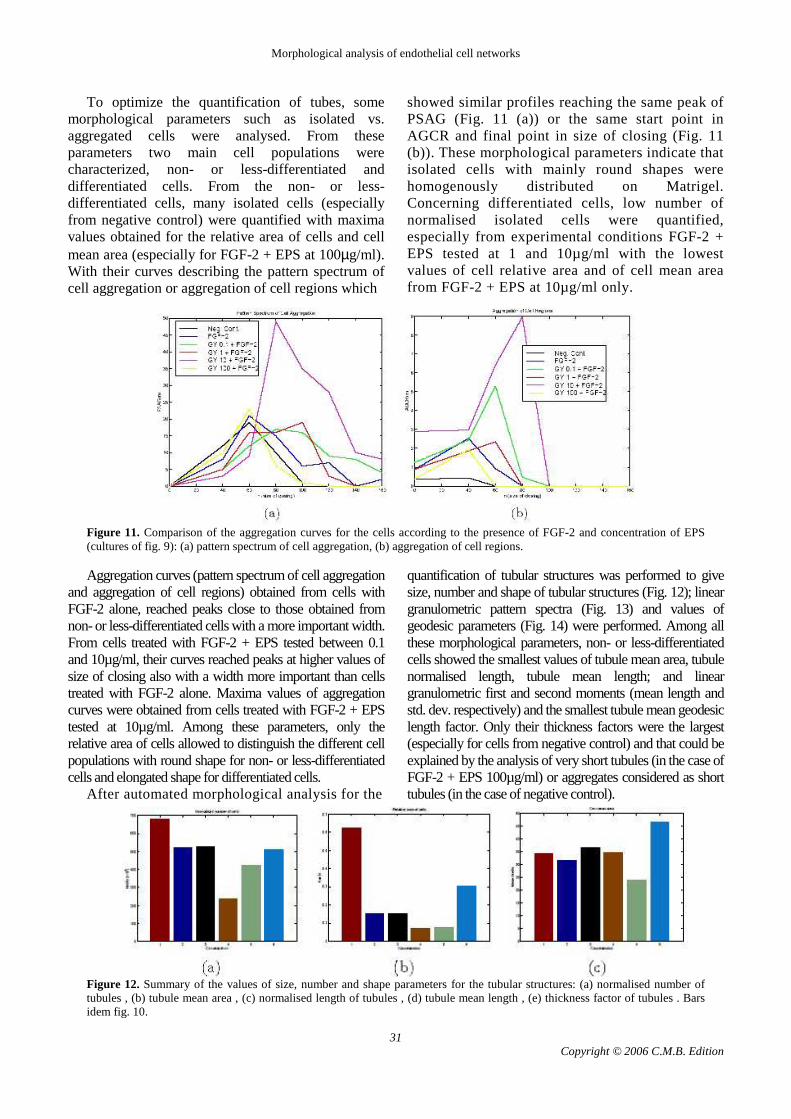
Figure 11. Comparison of the aggregation curves for the cells according to the presence of FGF-2 and concentration of EPS (cultures of fig. 9): (a) pattern spectrum of cell aggregation, (b) aggregation of cell regions. Aggregation curves (pattern spectrum of cell aggregation
and aggregation of cell regions) obtained from cells with FGF-2 alone, reached peaks close to those obtained from non- or less-differentiated cells with a more important width. From cells treated with FGF-2 + EPS tested between 0.1 and 10µg/ml, their curves reached peaks at higher values of size of closing also with a width more important than cells treated with FGF-2 alone. Maxima values of aggregation curves were obtained from cells treated with FGF-2 + EPS tested at 10µg/ml. Among these parameters, only the relative area of cells allowed to distinguish the different cell populations with round shape for non- or less-differentiated cells and elongated shape for differentiated cells.
After automated morphological analysis for the
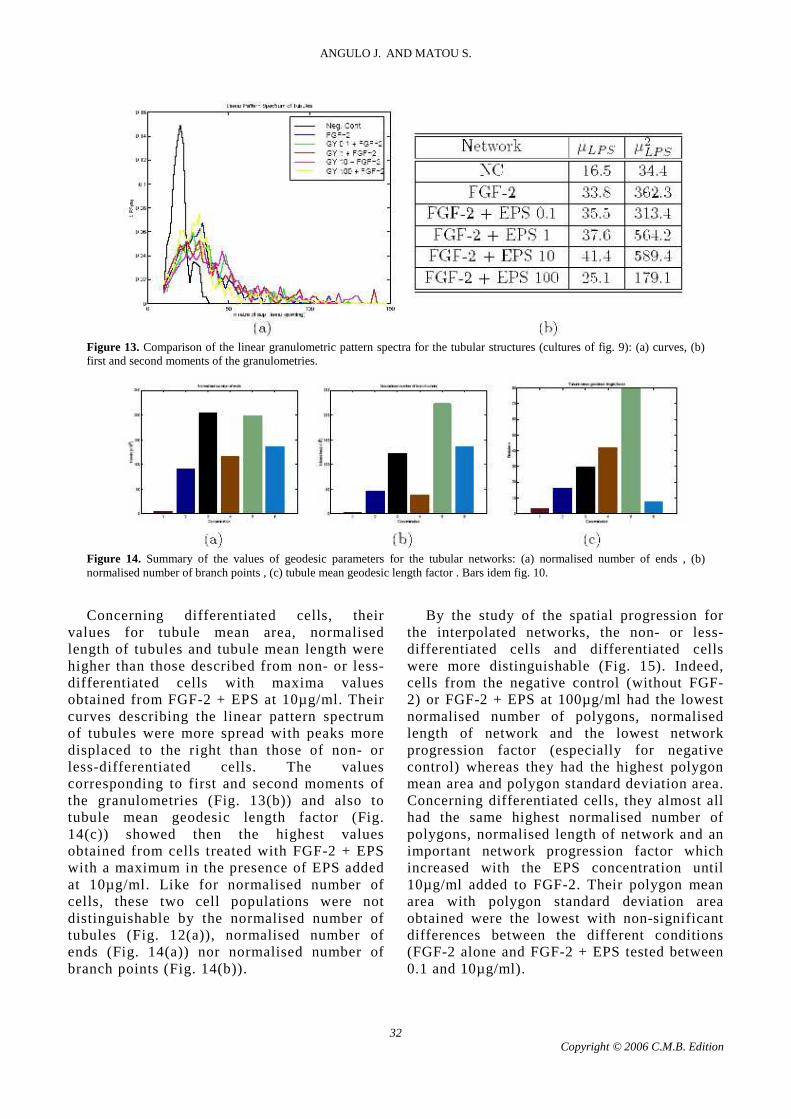
quantification of tubular structures was performed to give size, number and shape of tubular structures (Fig. 12); linear granulometric pattern spectra (Fig. 13) and values of geodesic parameters (Fig. 14) were performed. Among all these morphological parameters, non- or less-differentiated cells showed the smallest values of tubule mean area, tubule normalised length, tubule mean length; and linear granulometric first and second moments (mean length and std. dev. respectively) and the smallest tubule mean geodesic length factor. Only their thickness factors were the largest (especially for cells from negative control) and that could be explained by the analysis of very short tubules (in the case of FGF-2 + EPS 100µg/ml) or aggregates considered as short tubules (in the case of negative control).
Figure 12. Summary of the values of size, number and shape parameters for the tubular structures: (a) normalised number of tubules , (b) tubule mean area , (c) normalised length of tubules , (d) tubule mean length , (e) thickness factor of tubules . Bars idem fig. 10.
ANGULO J. AND MATOU S.
32 Copyright © 2006 C.M.B. Edition
Figure 13. Comparison of the linear granulometric pattern spectra for the tubular structures (cultures of fig. 9): (a) curves, (b) first and second moments of the granulometries.
Figure 14. Summary of the values of geodesic parameters for the tubular networks: (a) normalised number of ends , (b) normalised number of branch points , (c) tubule mean geodesic length factor . Bars idem fig. 10. Concerning differentiated cells, their
values for tubule mean area, normalised length of tubules and tubule mean length were higher than those described from non- or less-differentiated cells with maxima values obtained from FGF-2 + EPS at 10µ g/ml. Their curves describing the linear pattern spectrum of tubules were more spread with peaks more displaced to the right than those of non- or less-differentiated cells. The values corresponding to first and second moments of the granulometries (Fig. 13(b)) and also to tubule mean geodesic length factor (Fig. 14(c)) showed then the highest values obtained from cells treated with FGF-2 + EPS with a maximum in the presence of EPS added at 10µ g/ml. Like for normalised number of cells, these two cell populations were not distinguishable by the normalised number of tubules (Fig. 12(a)), normalised number of ends (Fig. 14(a)) nor normalised number of branch points (Fig. 14(b)).
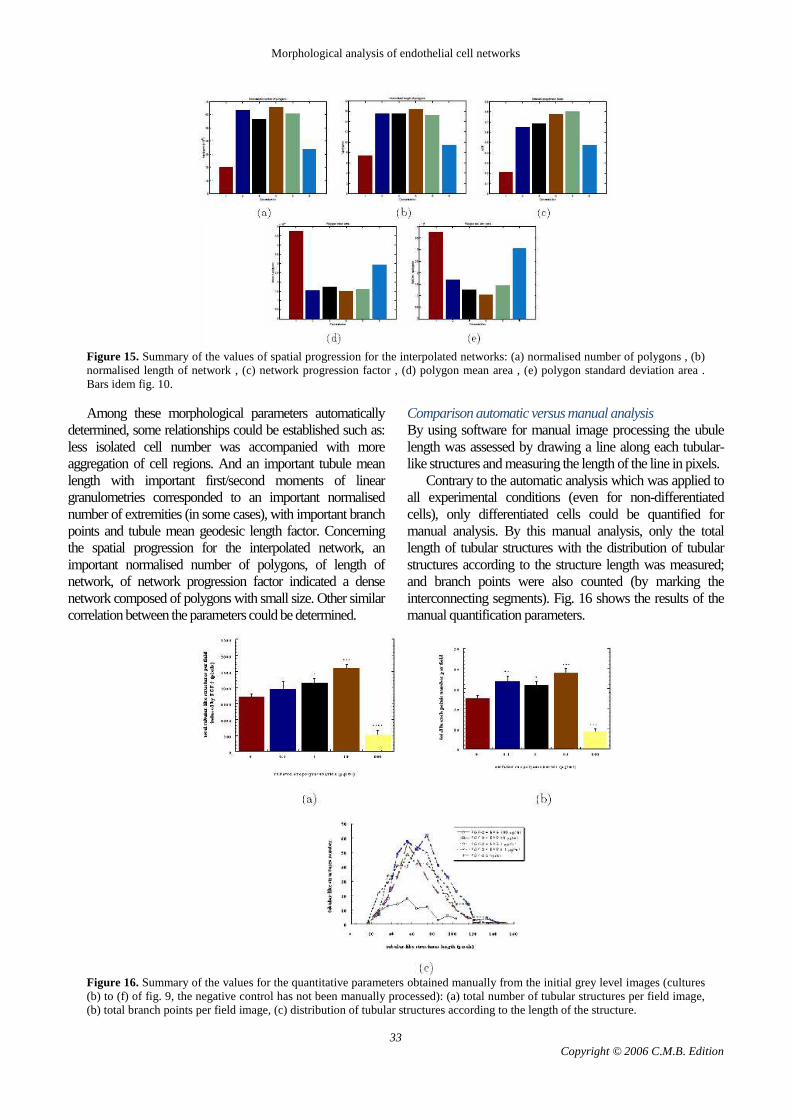
By the study of the spatial progression for the interpolated networks, the non- or less-differentiated cells and differentiated cells were more distinguishable (Fig. 15). Indeed, cells from the negative control (without FGF-2) or FGF-2 + EPS at 100µg/ml had the lowest normalised number of polygons, normalised length of network and the lowest network progression factor (especially for negative control) whereas they had the highest polygon mean area and polygon standard deviation area. Concerning differentiated cells, they almost all had the same highest normalised number of polygons, normalised length of network and an important network progression factor which increased with the EPS concentration until 10µg/ml added to FGF-2. Their polygon mean area with polygon standard deviation area obtained were the lowest with non-significant differences between the different conditions (FGF-2 alone and FGF-2 + EPS tested between 0.1 and 10µg/ml).
Morphological analysis of endothelial cell networks
33 Copyright © 2006 C.M.B. Edition
Figure 15. Summary of the values of spatial progression for the interpolated networks: (a) normalised number of polygons , (b) normalised length of network , (c) network progression factor , (d) polygon mean area , (e) polygon standard deviation area . Bars idem fig. 10. Among these morphological parameters automatically
determined, some relationships could be established such as: less isolated cell number was accompanied with more aggregation of cell regions. And an important tubule mean length with important first/second moments of linear granulometries corresponded to an important normalised number of extremities (in some cases), with important branch points and tubule mean geodesic length factor. Concerning the spatial progression for the interpolated network, an important normalised number of polygons, of length of network, of network progression factor indicated a dense network composed of polygons with small size. Other similar correlation between the parameters could be determined.
Comparison automatic versus manual analysis By using software for manual image processing the ubule length was assessed by drawing a line along each tubular-like structures and measuring the length of the line in pixels.
Contrary to the automatic analysis which was applied to all experimental conditions (even for non-differentiated cells), only differentiated cells could be quantified for manual analysis. By this manual analysis, only the total length of tubular structures with the distribution of tubular structures according to the structure length was measured; and branch points were also counted (by marking the interconnecting segments). Fig. 16 shows the results of the manual quantification parameters.
Figure 16. Summary of the values for the quantitative parameters obtained manually from the initial grey level images (cultures (b) to (f) of fig. 9, the negative control has not been manually processed): (a) total number of tubular structures per field image, (b) total branch points per field image, (c) distribution of tubular structures according to the length of the structure.
ANGULO J. AND MATOU S.
34 Copyright © 2006 C.M.B. Edition
We can therefore observe the coherence of both methods of quantification: the tubule mean geodesic length factor and first/second moments of granulometries obtained for each experimental condition showed the same profile obtained after manual measurement of total tubular length per field. This can be considered as a validation of the automatic approach.
Statistics of parameters
Fig. 10 to 15 present the mean values of the morphological parameters measured on images under different concentrations of FGF-2+EPS and for the negative control. In fact, each concentration is represented by ten images: four by well, with duplicated wells. Remember that all the parameters were computed from four images, selected randomly between the ten. Most of parameters, especially for the tubular structures, have small dispersion (CV lower than 10%).
CONCLUSIONS AND PERSPECTIVES
In this paper we have presented a set of algorithms developed for quantitatively analysing the differentiation in tubular-like networks of in vitro endothelial cells cultured on a Matrigel support. The method deals with a completely automatic approach which provides a complex and powerful descriptor, by taking into account all the morphological features which describe the structure.
We have proved the interest of the approach for an improved automated quantifying (compared with manual techniques) to evaluate the angiogenic modulator effect of a molecule, and in order to determine their optimal concentration. In addition, the usefulness of this descriptor or a part of the present algorithms is not limited to study the assays of endothelial cells on Matrigel. Other angiogenesis assays such as the rat aortic ring or in general, other experimental models of the proliferation of biological structures in tubular-like networks,branching phenomena, etc. could be objectively quantified by means of the suggested techniques.
We have shown that the most interesting parameters to quantify this kind of structures are the morphological distributions of lengths, the geodesic parameters (branch points and extremity points), the spatial distribution of the isolated cells and the spatial organisation of the tubes into polygonal networks.
Obviously, the present approach can be used to study the kinetics of the dynamic process of migration of the endothelial cells. To do that, the main difficulty is to obtain the sequence of images, using for instance a time lapse phase contrast video microscopy (Meade-Tollin and Van Noorden, 2000, 25). In view of the fact that the cells can not be fixed or stained, see Fig. 1 (a), the segmentation task becomes more difficult.
Concerning the perspectives of this study, we believe that the next stage to be considered is the development a morphological-based mathematical model for the simulation of the cellular organisation into tubular-like networks. Mathematical models using the Burgers dynamics equation have been developed to simulate endothelial cell networks by (Gamba et al., 2003, 11).
Acknowledgements -- Dr. Sabine Matou is now working as an associate research in the School of Biology, Chemistry and Health Science at The Manchester Metropolitan University, UK. We would like to thank Prof. Georges Flandrin who favours this scientific collaboration. The authors also wish to thanks the reviwers and Prof. Fernand Meyer for its valuable comments and suggestions. Exopolysaccharide was provided by IFREMER (Fance).
REFERENCES
1. Angulo J., Morphologie mathématique et indexation d’images couleur. Application à la microscopie en biomédecine. Ph.D. Thesis, Ecole des Mines, Paris, December 2003. 2. Auerbach R, Lewis R, Shinners B, Kubai L and Akhtar N., Angiogenesis assays: a critical overview (Review). Clin Chem. 2003, 49(1):32-40. 3. Beucher S and Meyer F., The Morphological Approach to Segmentation: The Watershed Transformation. In E. Dougherty (ed), Mathematical Morphology in Image Processing, Marcel-Dekker, 1992. 4. Blacher S, Devy L, Burbridge MF, Roland G, Tucker G, Noel A and Foidart JM. Improved quantification of angiogenesis in the rat aortic ring assay. Angiogenesis 2001; 4:133–142. 5. Borgefors G. Distance transformations in digital space. Computer Vision, Graphics and Image Processing. 1986 ; 34:344–377. 6. Brown KJ, Maynes SF, Bezos A et al. A novel in vitro assay for human angiogenesis. Lab Invest 1996; 75:539–555. 7. Cenens J, Huis R, Chauvaux B, Dereppe JM, Gratin C, and F. Meyer F. 3D Cellular Structure characterization of flexible polyurethane foam. In V. Kumar and K. A. Seeler (eds), Cellular and Microcellular Materials, pp. 29–44, 1994. 8. Davis GE and Camarillo CW. Regulation of endothelial cell morphogenesis by integrins, mechanical forces, and matrix guidance pathways. Exp Cell Res. 1995 ; 216(1):113-23. 9. Donovan D, Brown NJ, Bishop ET and Lewis CE. Comparison of three in vitro human ’angiogenesis’ assays with capillaries formed in vivo. Angiogenesis. 2001 ; 4(2):113-21. 10. Folkman J. Angiogenesis in cancer, vascular, rheumatoid and other disease (Review). Nat Med. 1995 ; 1(1):27-31. 11. Gamba A, Ambrosi D, Coniglio A, de Candia A, Di Talia S, Guraudo E, Sereni G, Preziosi L and Bussolino F. Percolation, Morphogenesis, and Burgers Dynamics in Blood Vessels Formation. Phys Rev Letters 2003; 90:–. 12. Giraux JL, Matou S, Bros A, Tapon-Bretaudière J, Letourneur D, and Fischer AM. Modulation of human endothelial cell proliferation and migration by fucoidan and heparin. Eur J Cell Biol 1998 ; 77:352-9. 13. Guidolin D, Vacca A, Nussdorfer GG, and Ribatti D. A new image analysis method based on topological and fractal parameters to evaluate the angiostatic activity of docetaxel by using the Matrigel assay in vitro. Microvascular Research 2004 ; 67:117-124. 14. Grimaud M. A new measure of contrast: dynamics. In Proc. SPIE, Image Algebra and Morphological Image Processing III, San Diego, Vol. 1769, pp:292-305, 1992.

Morphological analysis of endothelial cell networks
35 Copyright © 2006 C.M.B. Edition
15. Hajitou A, Grignet C, Devy L, Berndt S, Blacher S, Deroanne CF, Bajou K, Fong T, Chiang Y, Foidart JM and Noel A. The antitumoral effect of endostatin and angiostatin is associated with a down-regulation of vascular endothelial growth factor expression in tumor cells. FASEB Journal 2002, 16(13): 1802–1804. 16. Jaffe EA, Nachman EL, Becker CG and Minick CR. Culture of human endothelial cells derived from umbilical veins. Identification by morphologic and immunologic criteria. J Clin Invest 1973 ; 52:2745-56. 17. Korff T and Augustin HG. Tensional forces in fibrillar extracellular matrices control directional capillary sprouting. J Cell Sci. 1999 ; 112 ( Pt 19):3249-58. 18. Kutryk MJ and Stewart DJ. Angiogenesis of the heart. Microsc Res Tech. 2003 ; 60(2):138-58. 19. Laing RA, Brenner JF, Lester JM and Mcfarland JL. Automated morphometric analysis of endothelial cells. Invest. Ophthalmol Vis Sci 1981; 407–410. 20. Li J, Zhang YP and Kirsner RS. Angiogenesis in wound repair: angiogenic growth factors and the extracellular matrix (Review). Microsc Res Tech. 2003 ; 60(1):107-14. 21. Martin RJ, Hausman GJ and Hausman DB. Regulation of adipose cell development in utero (Review). Proc Soc Exp Biol Med. 1998 ; 219(3):200-10. 22. Masters B, Lee YK and Rhodes WT. Fourier transform method for statistical evaluation of corneal endothelial morphology. In Noninvasive diagnostic techniques in opthalmology, B. Masters ed., Spring Verlag, New York, pp:122–141, 1990. 23. Matou S, Helley D, Chabut D, Bros A and Fischer, AM. Effect of fucoidan on fibroblast growth factor-2-induced angiogenesis in vitro. Thrombosis Research ; 106:213–221, 2002. 24. Matou S, Colliec-Jouault S, Galy-Fauroux I, Ratiskol J,
Sinquin C, Guezennec J, Fischer AM and Helley D. Effect of an oversulfated exopolysaccharide on angiogenesis induced by fibroblast growth factor-2 or vascular endothelial growth factor in vitro. Biochem. Pharmacol ; 69(5):751–9, 2005. 25. Meade-Tollin LC and Van Noorden CJF. Time lapse phase contrast video microscopy of directed migration of human microvascular entothelial cells on matrigel. Acta histochem. 2000; 102:299-307. 26. Meyer F. Constrast features extraction. in Quantitative Analysis of microstructures in Materials Science, Biology and Medecine, (ed. by J. L. Chermant), 1977; 374–380, Riederer Verlag. 27. Nicosia RF, Ottinetti A. Growth of microvessels in serum-free matrix culture of rat aorta: A quantitative assay of angiogenesis in vitro. Lab Invest 1990; 63: 115–122. 28. Nissanov J, Tuman RW, Gruver LM, Fortunato JM. Automatic vessel segmentation and quantification of the rat aortic ring assay of angiogenesis. Lab Invest 1995; 73:734–739. 29. Serra J, Image Analysis and Mathematical Morphology. Vol I, and Image Analysis and Mathematical Morphology. Vol II: Theoretical Advances. Academic Press, London, 1982 and 1988. 30. Serra, J. Morphological descriptions using three-dimensional wavefronts. Image Anal Sterol; 21:S13–S21, 2002. 31. Sherer DM and Abulafia O. Angiogenesis during implantation, and placental and early embryonic development (Review). Placenta. 2001 ; 22(1):1–13. 32. Vailhé B, Vittet D and Feige JJ. In vitro models of vasculogenesis and angiogenesis (Review). Lab Invest. 2001. 81(4):439–52. 33. Vincent L and Masters B. Morphological Image Procesing and Network Analysis of Cornea Endothelial Cell Images. In SPIE Vol. 1769 Image Algebra and Morphological Image Processing III, pp:212–226, 1992.