materials final report
TRANSCRIPT

Materials, 2012
Oleksandr Matviienko, Soufianne Ayoche, Huizhong Li

Oleksandr Matviienko, Soufianne Ayoche, Huizhong Li
Materials, 2012
1
Agenda Introduction ----------------------------------------------------------------------------------------------------------------------- 1
Investment Recommendations Summary ---------------------------------------------------------------------------------- 2
Materials Industry Analysis ---------------------------------------------------------------------------------------------------- 2
Materials Industry overview ------------------------------------------------------------------------------------------------ 2
Diversified Metals and Mining Industry --------------------------------------------------------------------------------- 3
Specialty and Diversified Chemicals Industry ------------------------------------------------------------------------- 7
Fertilizers and Agricultural Chemicals Industry ---------------------------------------------------------------------- 11
Steel Industry------------------------------------------------------------------------------------------------------------------ 13
Construction Material Industry ------------------------------------------------------------------------------------------- 17
Metal & Glass Containers industry -------------------------------------------------------------------------------------- 20
Paper and Forest Products Industry -------------------------------------------------------------------------------------- 23
Materials Industry outlook ------------------------------------------------------------------------------------------------- 26
Investing Process Description ------------------------------------------------------------------------------------------------ 27
Quantitative Screens and Analysis ------------------------------------------------------------------------------------------ 28
Qualitative Screens and Analysis -------------------------------------------------------------------------------------------- 30
Fundamental Analysis ---------------------------------------------------------------------------------------------------------- 31
Sensient Technologies (SXT). Current DFF holding. --------------------------------------------------------------- 32
Cytec Industries (CYT) ----------------------------------------------------------------------------------------------------- 37
Minerals Technologies (MTX) ------------------------------------------------------------------------------------------- 42
Scott Miracle Growth (SMG) --------------------------------------------------------------------------------------------- 48
Domtar Corporation (UFS) ------------------------------------------------------------------------------------------------ 52
Steel Dynamics (STLD) ---------------------------------------------------------------------------------------------------- 57
Silgan Holdings (SLGN). Current DFF holding. --------------------------------------------------------------------- 63
Investment Idea Summary ---------------------------------------------------------------------------------------------------- 68
Cytec Industries (CYT): STRONG BUY ------------------------------------------------------------------------------ 68
Scott Miracle Growth (SMG): MODERATE BUY------------------------------------------------------------------ 69
Sensient Technologies (SXT). Current DFF holding: HOLD ----------------------------------------------------- 70
Silgan Holdings (SLGN). Current DFF holding: SELL ------------------------------------------------------------ 71
References ------------------------------------------------------------------------------------------------------------------------ 72
Appendix--------------------------------------------------------------------------------------------------------------------------- 73

Oleksandr Matviienko, Soufianne Ayoche, Huizhong Li
Materials, 2012
1
Introduction
As of the date of current analysis, materials sector within S&P 400 is represented by 27
companies and 10 sub industries. Temple-Inland company which was previously one of
constituents of S&P 400 Materials sector was removed form it as the company was acquired in
February 2012. The materials companies are involved in exploration and processing of raw
materials into basic industrial and consumer products which have broad utilization in various
industries in the USA, as well as internationally. The table below presents current sector
constituents and their respective sub-industries.
It is worth noting that DFF fund currently has 2 holdings in the respective sector which were
indicated in the table. The weight of Silgan Holdings is around 5.1% and of Sensient
Technologies is approximately 5.9%. These companies were acquired in May 2010 and May
2011 respectively.
Company Name Ticker Sub-Industry
Martin Marietta Materials MLM Construction Materials
Ashland Inc ASH Diversified Chemicals
Cabot Corp CBT Diversified Chemicals
Olin Corp OLN Diversified Chemicals
Compass Minerals International CMP Diversified Metals & Mining
Scotts Co A SMG Fertilizers & Agricultural Chemicals
Intrepid Potash Inc IPI Fertilizers & Agricultural Chemicals
Louisiana Pacific Corp LPX Forest Products
AptarGroup Inc ATR Metal & Glass Containers
Greif Bros Corp A GEF Metal & Glass Containers
Silgan Holdings SLGN Metal & Glass Containers
Packaging Corp of America PKG Paper Packaging
Rock-Tenn RKT Paper Packaging
Sonoco Products Co SON Paper Packaging
Domtar Corp UFS Paper Products
Albemarle Corp ALB Specialty Chemicals
Cytec Industries Inc CYT Specialty Chemicals
Minerals Technologies Inc MTX Specialty Chemicals
RPM International Inc. RPM Specialty Chemicals
Sensient Technologies Corp SXT Specialty Chemicals
Valspar Corp VAL Specialty Chemicals
NewMarket Corp NEU Specialty Chemicals
Carpenter Technology Corp CRS Steel
Commercial Metals Co CMC Steel
Reliance Steel & Aluminum RS Steel
Steel Dynamics Inc STLD Steel
Worthington Industries Inc WOR Steel
Note:
represents current DFF holdings

Oleksandr Matviienko, Soufianne Ayoche, Huizhong Li
Materials, 2012
2
Investment Recommendations Summary We recommend a strong buy for Cytec Industries company, a moderate buy Scott Miracle
Growth company, a hold for Sensient Technologies company (current DFF holding), and a sell
for Silgan Holdings company (current DFF holding). It is worth noting that Silgan Holing was
also a sell recommendation previous year. Table below summarizes our recommendations:
Materials Industry Analysis Materials Industry overview
Materials Industry encompasses such sub-industries as Specialty, Diversified, and Agricultural
Chemicals, Fertilizers, Diversified Metals and Mining, Steel, Construction Materials, Forest and
Paper Products, Metal and Glass Containers, Paper Packaging.
This industry supplies commodities to such industries as aerospace, automotive,
telecommunications, construction, agriculture, general manufacturing, consumer staples, oil and
gas, etc.
The industry can be characterized as cyclical and to some degree oligopolistic and depends,
mainly, on industrial production rates, real GDP growth rates, construction activities, as well as
weather and population growth rates.
Also, the industry can be characterized by relative capital- and labor-intensiveness and energy-
dependence.
As main products are relatively uniform, producers tend to compete on prices by achieving the
effective cost control.
The average size of Materials Industry in the S&P 400 is $3.1 billion and average revenue figure
was $3.3 in FY2010.
The figure below allows tracking relative performance of Materials Industry to S&P 400 and
S&P 500 for past 6 months.
Materials Sector Final Recommendations
Company Name Ticker Sub-Industry Recommendation
Cytec Industries Inc CYT Specialty Chemicals Strong Buy
Scott Miracle Growth SMG Fertilizers & Agricultural Chemicals Moderate Buy
Sensient Technologies Corp SXT Specialty Chemicals Hold
Silgan Holdings SLGN Metal & Glass Containers Sell
Note:
represents current DFF holdings

Oleksandr Matviienko, Soufianne Ayoche, Huizhong Li
Materials, 2012
3
Source: FactSet
Based on this figure, generally, Materials Industry had similar trend to those of S&P 400 and
500. However, for past two months it outperformed both indices and continues to do so now.
Bollinger bands analysis, however, suggests some bearish trend of given Materials index.
Diversified Metals and Mining Industry
Industry Overview
Diversified Metals and Mining companies mine and produce non-ferrous metals, related base
materials and products.
This industry supplies commodities used in manufacturing various equipment and products used
in such industries as aerospace, automotive, telecommunications, construction etc.
According to S&P, this industry is dominated by copper companies. Apart from copper and
copper products, companies in this industry manufacture aluminum, nickel, zinc and related
products, as well as base chemicals, salt etc. The graph below describes recent production trends
in this industry.

Oleksandr Matviienko, Soufianne Ayoche, Huizhong Li
Materials, 2012
4
Note: Data is in Million metric tons
Source: Bloomberg
This sub-industry is represented in S&P 400 by a single company Compass Minerals. This
company produces salt used primarily in highway de-icing, water conditioning, food preparation,
and sulfate of potash for specialty fertilizers production. Please find descriptive financial
information in the table below.
Main players in this industry are represented by such companies as Freeport McMoRan Copper
and Gold (exploration, mining, and production of mineral resources), Titanium Metals Corp
(produces and sells titanium melted and mill products), as well as by smaller companies such as
Lundin Mining (produces copper, zinc, lead, and nickel), Quadra FNX Mining Ltd (produces
copper, gold, and platinum group metals), and Compass Minerals.
Revenue and Earnings Drivers
We will consider specifically Compass Minerals in this analysis, as our investment options for
diversified metals and mining are limited to this company.
Company‟s main revenue drivers are weather, which drives de-icing salt demand as well as
governmental budget policy allocating money for de-icing and safety purposes. Safety of
citizens is one of the main priorities of any government, thus, making Compass‟s salt highly
demanded in winter, especially cold, icy and snowy one.
1.39 1.39 1.40 1.39 1.46 1.45
3.02
3.33 3.12
3.21 3.44 3.58
0.12 0.12 0.11 0.12 0.14 0.16
0.00
0.50
1.00
1.50
2.00
2.50
3.00
3.50
4.00
2006 2007 2008 2009 2010 2011
Non-ferrous metals production
Copper Aluminium Nickel
Target Companies Comparable Statistics*
In billions Mkt Cap Revenue P/E TEV/Sales TEV/EBITDA GM B/M
5-Year
GS
Compass Minerals 2.36 1.11 14.94 2.45 9.74 28.39% 0.189 10.80%
Peers Average 3.14 3.57 13.72 1.18 7.93 26.62% 0.33 10.64%
*Based on Bloomberg Peers

Oleksandr Matviienko, Soufianne Ayoche, Huizhong Li
Materials, 2012
5
From the other side, agricultural demand drives fertilizers demand. Fertilizers demand, in turn,
drives demand for the Company‟s potash production.
Agricultural, and, thus, fertilizers demands are expected to be robust in near and medium future,
as such trends as population growth, which drives demand for food, and a decline of arable land
per person, which drives demand for fertilizers to increase a land‟s productivity to compensate
for a decline in land‟s quantity may both boost demand for Company‟s potash products.
Moreover, constantly increasing level of personal income, especially in developing countries
where the majority of world‟s population is concentrated, stimulates such population to change a
diet towards more valuable food products, which require a more extensive use of fertilizers.
Such factors as anticipated crop prices also drive a fertilizers demand.
Moreover, according to Morningstar, this industry is oligopolistic in nature, which may produce
a positive effect on the Compass‟s profitability.
Risk Drivers
The industry is characterized by little differentiation of its products. Therefore, companies
mostly compete on price.
This produces such risks as the possibility of market damping by competitors willing gain more
of a market share.
Also, the threat of substitutes to road de-icing using salt exists, which may negatively impact
Company‟s position.
However, according to Morningstar, the threat of substitutes is not high.
The risk of warm weather seriously impacts Company‟s financial results.
Also, consistently low agricultural prices also may produce a devastating effect on the
Company‟s financial health.
The inability to find new mineral resources to support existing salt and potash production may
also greatly impact Company‟s operations. Please find risk matrix below.

Oleksandr Matviienko, Soufianne Ayoche, Huizhong Li
Materials, 2012
6
Outlook
As the industry is oligopolistic, we expect it to be profitable and stable, as prices, thus, profits
tend to be less volatile.
Moreover, as such natural resources as salt
and potash are non-renewable and scarce,
while population growth and demand for
food is expected to increase, as well as
budget spending on the safety of roads in
winter is expected to be stable, prices on
Company‟s main products are expected to
be relatively stable.
Total planted acreage for major crops in the
US is expected to increase in next 2 years
stimulating fertilizers demand. However,
according to Morningstar, potash supply
growth will outpace potash demand growth
in near future, thus, providing some
downside potential for potash prices. Please
find anticipated acreage dynamics for major crops in the US in the table below.
According to S&P, the outlook on general diversified metals and mining sub-industry for next 12
months is positive, as main products‟ prices are forecast to increase, thus, driving sales and
earnings of companies upward. Please find detailed information below.

Oleksandr Matviienko, Soufianne Ayoche, Huizhong Li
Materials, 2012
7
This, in turn, is dictated by stable non-ferrous metals demand growth outpacing supply growth,
reflecting new housing construction growth (especially in the US – second largest consumer) and
intensified industrialization rates in India and China.
Specialty and Diversified Chemicals Industry
Industry Overview
Specialty and diversified chemical products are mostly made from basic chemicals. They include
coatings, adhesives, pesticides, paints, sealants, catalysts, plastic additives, ethers, alkali, carbon
products etc. Please find more information on
current industry production trends in the graph
to the right.
Such products are usually produced in smaller
volumes, than basic chemicals, and require
higher R&D spending and
marketing/distribution costs.
Such industries as manufacturing, automobile,
agriculture, housing, construction,
pharmaceuticals are the major consumers of
specialties.
According to S&P, companies in this industry have greater control over prices and, thus, more
stable profit margins than commodity producers.
This sub-industry is represented in S&P 400 by a range of companies indicated in table below.

Oleksandr Matviienko, Soufianne Ayoche, Huizhong Li
Materials, 2012
8
Main players in this industry are represented by such companies as Dow Chemicals (largest US
chemical producer: from base chemicals to sophisticated specialties), DuPont (basic materials,
fertilizers, specialties, agricultural products, enzymes etc.), as well as by smaller companies such
as Albemarle (polymers, catalysts, performance chemicals etc.), Ashland (water solutions,
lubricants, polymers other).
Revenue and Earnings Drivers
As Specialty and Diversified Chemicals Industry supplies products to a wide range of industries
and consumers, its main drivers are also well diversified.
Such macro factors as industrial production growth rates, construction activity levels, personal
consumption expenditures, agricultural production growth rates are one of the main revenue
drivers.
Chemical production is capital intensive.
Thus, it requires significant modernization
and expansion capex. Therefore, capex is
also one of main revenue as well as
earnings drivers. According to American
Chemistry Council, aggregate capex in
chemical industry reached $27.5 billion in
2010, from which $4.9 billion was spent on
maintenance and repairs.
From the earnings perspective, energy
prices dynamics is an important driver.
Chemical industry is highly energy
intensive, as companies use energy
commodities as raw materials, fuels, and
power sources, according to S&P.
According to S&P, chemical industry
accounts for about 6% of total energy
Target Companies Comparable Statistics*
In billions Mkt Cap Revenue P/E TEV/Sales TEV/EBITDA GM B/M
5-Year
GS
Ashland Inc. 5.01 7 15.59 1.19 28.23 27.05% 0.81 3.82%
Cabot Corp. 2.58 3.27 13.17 0.81 7.27 18.77% 0.58 3.28%
Olin Corp. 1.7 1.96 7.94 0.9 6.18 21.36% 0.59 15.48%
Albemarle Corp. 5.89 2.87 13.86 1.73 9.13 33.09% 0.27 4.41%
Cytec Industries 2.85 3.07 15.83 0.74 7.5 23.55% 0.64 6.03%
Mineral Technologies 1.18 1.04 18.08 0.68 5.48 20.92% 0.63 0.43%
NewMarket Corp. 2.54 2.15 13.59 1.33 8.01 24.74% 0.21 10.96%
RPM International 3.34 3.56 16.91 1.13 9.95 40.28% 0.37 2.75%
Sensient Technologies 1.92 1.43 15.74 1.36 9.39 31.77% 0.55 4.64%
Valspar Corp. 4.29 4 16.3 1.25 11.25 33.12% 0.28 5.86%
Peer Average 4.13 4.23 14.24 1.07 8.27 27.10% 0.21 7.38%
*Based on Bloomberg Peers

Oleksandr Matviienko, Soufianne Ayoche, Huizhong Li
Materials, 2012
9
consumption in the US, as well as 9% of natural gas consumption. Of this consumption,
according to S&P, 53.7% by volume (72% by value) was used as raw materials with the
remainder used for fuel and power in 2010.
Energy costs, especially, natural gas, can occupy up to 90% of COGS for chemicals companies.
Governmental regulation can also produce large impact on companies‟ earnings as chemical
industry is highly regulated both on federal and state levels. Please find major regulation acts in
the graph to the right.
Risk Drivers
The industry is relatively cyclical (to a lesser degree than basic chemicals) and vulnerable to
changes in US/global industrial production and GDP growth rates, as well as personal income
levels, construction activities, international chemicals trade etc. The earnings tend to emulate
basic economic cycles.
The industry is characterized by high differentiation and customization of its products.
Therefore, companies mostly compete on quality of products, and, to a lesser degree, on prices.
However, low global chemical prices, as well as steel, agricultural and housing prices may
produce negative impact on the profitability of industry.
High energy prices, as well as relative elasticity of demand on main specialty chemical products
may erode chemical companies‟ margins.
According to S&P, threat of substitutes is low. Please find risk matrix below.

Oleksandr Matviienko, Soufianne Ayoche, Huizhong Li
Materials, 2012
10
Outlook
We believe Specialty and Diversified Chemicals Industry would benefit from US/global
industrial recovery as, according to EIU, US Real GDP growth rate is expected to be 1.8% in
2012 and accelerate to 2.3% by 2015, as well as global Real GDP growth rate is expected to be
3.1% in 2012 and reach 4.3% by 2015.
US industrial production growth rate is also projected to recover to be in a range of 2.4-3% for
the next 5 years. Please find main macroeconomic statistics which may produce high influence
on chemical industry in the table below.
Energy prices, especially, natural gas, have decelerated its growth recently.
Moreover, according to S&P, business
environment for chemical industry will
remain strong and manufacturing
industry will continue to grow.
Agricultural demand for chemicals is
also expected to be strong as population
growth rate and increase in personal
income levels in developing countries
would stimulate agricultural production.
All the aforementioned factors are
beneficial to the chemical industry.
Note: GR=Growth Rate
Gas Prices represent Henry Hub, Crude Oil Prices represent WTI
Source: EIU, Bloomberg
Macroeconomic factorsItem 2011/Spot 2012 2013 2014 2015
Global Real GDP GR 3.7 3.1 3.9 4.1 4.3
USA GR 1.7 1.8 2 2.2 2.3
Western Europe Real
GDP GR 1.7 -0.5 0.8 1.2 1.6
Transition Economies
Real GDP GR 3.7 2.3 3.4 3.8 3.8US Industrial
Production Growth 4.2 3 2.4 2.3 2.4
Gas Prices, $/MMBtu 2.56 3.15 3.85 4.2 4.4
Crude Oil Prices,
$BBL 102.31 103.49 102.27 97.72 94.08
US Personal
Disposable Income
($trillions, PPP) 11.656 12.021 12.435 12.894 13.410
Corn Price, cent/bu 639.75 641.64 560.85 561.41 558.21Wheat Price, cent/bu 635.25 663.74 718.01 739.24 n/a

Oleksandr Matviienko, Soufianne Ayoche, Huizhong Li
Materials, 2012
11
Moreover, Producer Price Index for Chemical Industry also shows positive dynamics after a drop
in 2008/2009, suggesting further increase.
Fertilizers and Agricultural Chemicals Industry
Industry Overview
We will first begin by giving a quick overview of the sector. The fertilizers sector is one of the
sub sectors of the chemical industry. Fertilizers contain one or more of the major plant nutrients
and sometimes secondary and/or trace nutrients. They are added to soil to replace essential
nutrients depleted by crops. Its main nutrients are phosphorus, nitrogen and potassium. The USA
is the world‟s largest consumer and importer of phosphate rocks and sulfur. Both chemicals are
nutrients for fertilizer and represents 95% and 90% of the use of such nutrients respectively;
therefore, if we can have analyze how the US demand is going to change in the future, we may
be able to forecast how the fertilizers sector will perform. Since the main consumers of fertilizers
are agricultural companies, forecasting the level of agricultural activity in the USA will yield
strong insights about the future fertilizers demand. The common distribution system is by rails.
This sector is also subject to a high level of mergers and acquisitions, which can yield in the
longer term to a more oligopolistic market.
Here is a table summarizing key statistics for the companies we are studying in our sector.
Revenue and Earnings Drivers
Agricultural demand for fertilizers and other chemicals is dictated by projected increase in
world‟s population, decrease in arable land per person and, thus, increase in agricultural
production. Furthermore, the expected increase in biofuel usage may boost the use of fertilizers.
Another revenue driver is the level of personal income: an increasing level of personal income in
developing world would stimulate the demand for quality food, and, thus, for fertilizer use in
agricultural production. Also, the risks of adverse weather conditions would stimulate the
fertilizers use. The price of natural gas is also a very important driver since it has a large impact
in pricing of agricultural chemicals as it occupies a vast part in COGS of fertilizers‟ companies.
As a result, prices of gas are major drivers for both revenue and earnings of fertilizers‟
companies. Finally, fertilizers are one of major parts of agricultural companies‟ raw materials
expenses. These raw materials expenses are determined by the anticipated prices of the end
products. Therefore, agricultural prices may produce a high impact on fertilizers and related
chemicals prices.
Since we have seen that overall agricultural activity is one of the most, if not the most, important
revenue driver, we have decided to look for corn and soybean projection for 2012. As you can
Target Companies Comparable Statistics*
In billions Mkt Cap Revenue P/E TEV/Sales TEV/EBITDA GM B/M
5-Year
GS
Intrepid Potash Inc 1.91 0.44 20.52 3.48 9.17 40.88% 0.45 n/a
Scotts Miracle-Gro 2.92 2.82 19.29 1.33 10.2 11.74% 0.16 -4.46%
Peer Average 16.29 10.67 15.69 2.24 8.87 32.98% 0.30 19.99%
*Based on Bloomberg Peers

Oleksandr Matviienko, Soufianne Ayoche, Huizhong Li
Materials, 2012
12
see, the consensus is quite bullish, which may positively affect the demand for fertilizers in the
short term.
The same goes for the crop producer confidence index which is slightly increasing again
suggesting that producers are no longer in the pessimistic loop they used to be in.
Risk Drivers
The first and most important risk driver is linked to high energy prices, especially, natural gas
prices since it may erode fertilizers‟ companies‟ margins and profitability. Moreover, agricultural
cycles may affect the financial stability of fertilizers‟ companies. Finally, low agricultural prices
may negatively impact fertilizers‟ and related chemicals prices.

Oleksandr Matviienko, Soufianne Ayoche, Huizhong Li
Materials, 2012
13
Outlook
According to Bloomberg, the recent rapid growth in the production of biofuels initiatives,
including ethanol, has been driving a boost in grain and oilseed use globally which in turns is
expected to affect positively the demand for fertilizers. In addition, longer term nutrient use is
expected to grow at about 2% per year, with the developing nations of Asia and Latin America
accounting for nearly all of this growth potential. On the other hand, according to Bloomberg,
there were some bearish trends concerning global corn and soybean demand/supply expectations.
Another bearish trend lies in the fact that US famers‟ future expectation are falling. Nonetheless,
the USDA long run projections for fertilizers were incrementally positive with 2.2 Million acres
of added planting of major crops.
Finally, the USDA expects higher wheat and corn planting, the latter being the highest end
market for fertilizers.
As a result of all those elements, the outlook for this sector is quiet mitigated since we both
bullish and bearish trends that must be taking into consideration. We however believe that this
sector will tend to market perform at the light of these facts. Below is a graph that supports our
view:
Steel Industry
Industry Overview
Steel products are mostly made from raw iron. Steel industry, as the base industry in the
industrial world, supplies commodities to industries ranging from appliances, automotive,
construction, containers to electrical equipment, machinery etc. The graph shows on the right.
Steel industry is energy and capital intensive industry. The integrated production process
requires expensive plant and equipment purchases.

Oleksandr Matviienko, Soufianne Ayoche, Huizhong Li
Materials, 2012
14
Main players in this industry are represented by such companies as Nucor Corp (segment: steel
mills, steel products, and raw materials), United States Steel Corp (segment: flat-rolled
products), U.S. steel (segment: tubular products), and Steel Dynamics Inc. (segment: steel
operations, metals recycling and ferrous resources operations, and steel fabrication operations),
as well as by smaller companies such as Reliance Steel & Aluminum (provides metals
processing services and distributes metal products).
Note: Data is in thousands of net tons Source: American Iron and Steel Institute
This sub-industry is represented in S&P 400 by a range of companies indicated in table below.
Revenue and Earning Drivers
The primary revenue driver is economic growth, measured by real GDP. The demand for steel is
cyclical in nature and highly sensitive to whether the economy is growing or declining.
Steel industry highly relies on the cyclical auto and construction industries, since steel
commodities rely heavily on demand for such consumer products as appliances, cars, and
containers. In addition, steel relies more on the capital goods markets.
According to S&P, scrap price has negative effect to Steel industry; higher scrap costs increase
the cost of raw steel production for integrated mills.
Target Companies Comparable Statistics*
In billions Mkt Cap Revenue P/E TEV/Sales TEV/EBITDA GM B/M
5-Year
GS
Carpenter Technology Corp 2.35 1.79 22.76 1.32 10.31 19.55% 0.33 0.48%
Commercial Metals Corp 1.58 8.12 n/a 0.31 10.04 8.68% 0.75 0.98%
Reliance Steel & Aluminum 4.24 8.13 12.44 0.6 7.83 21.66% 0.74 5.32%
Steel Dynamics Inc 3.37 8 12.59 0.54 6.83 9.25% 0.68 17.22%
Worthington Industries Inc 1.25 2.41 10.84 0.7 10.04 10.01% 0.53 -4.95%
Peer Average 6.43 8.87 41.62 0.78 7.37 13.00% 0.61 5.67%
*Based on Bloomberg Peers

Oleksandr Matviienko, Soufianne Ayoche, Huizhong Li
Materials, 2012
15
Steel companies face fierce competition from foreign producers. If the price of imported steel
products is lower than domestic steel price, domestic steel industry will be negative affected.
Steel industry is more concentrated and fragmented compared to other base metals industries.
Greater financial sources from mergers enable companies to directly source raw materials
through acquisitions. The four big companies are shown below.
As the world‟s largest steelmaking country, China has placed immense upward pressure on the
prices of raw materials, such as iron ore, ferrous scrap, coke, and coal. Graphs show below.
Steel industry is highly regulated with respect to the environment, subject to a variety of federal,
state, and local environmental laws that regulate air emissions, wastewater, and hazardous waste
disposal.
Risk Drivers
The industry is relatively cyclical and vulnerable to volatility in GDP growth rates, as well as
construction activities, autos industry performance and distributors‟ inventory accumulations etc.
The earnings tend to emulate basic economic cycles. Due to the fierce competition from
international steel markets, high global production and low global steel prices may produce
negative impact on the profitability of industry. Consolidations can dramatically cut down cost,
which is positive effect to Steel industry. At the same time, the industry is more fragmented than
before in terms of the number companies, who typically use about a 3-to-1 ratio of molten pig
iron to scrap and, thus, are less sensitive to rising prices for scrap.
0
5,000
10,000
15,000
20,000
25,000
2006 2007 2008 2009 2010
Largest US Steel Companies
Nucor Corp. United States Steel Corp.*
AK Steel Holding Steel Dynamics Inc.
151 182 222 280 356 423
495 501 574 627
90 92 91 100 95 99 98 91 64 81
850 903 969 1,069
1,146 1,250
1,351 1,327 1,231
1,414
-
500
1,000
1,500
2001200220032004200520062007200820092010
World Steel Production
China US World Total
*North American operations only.
Source: Company Reports
*North American operations only.
Note: Data is in thousands of net tons
Source: American Iron and Steel Institute *North American operations only.
Source: Company Reports
*North American operations only.

Oleksandr Matviienko, Soufianne Ayoche, Huizhong Li
Materials, 2012
16
Outlook
We have a slight positive fundamental outlook for the Steel industry for the following 12-month.
The projection of a 2.0% in U.S. GDP increase in 2012, compared with the GDP growth of 1.8%
in 2011. According to S&P, in the year 2012, there‟s an increase in auto sales to 13.5 million
units, from 12.8 million units in 2011. Weak construction markets in the U.S. will weigh on the
company's growth potential in the near term. Below two graphs are the outlook by Standard &
Poor and Value Line.

Oleksandr Matviienko, Soufianne Ayoche, Huizhong Li
Materials, 2012
17
Source: Standard and Poor’s Source: Value Line
Construction Material Industry
Industry Overview
Companies in Construction Materials Industry are engaged in the mining, quarrying and
processing of raw materials involved in road and building construction.
The industry includes a highly diverse range of suppliers, from cement manufacturers to
specialty glass and steel manufacturers, as well as provides a large market to white goods
manufacturers, furniture manufacturers, etc.
Construction materials companies have a wide range of customers from small house-builders, to
multiple projects within one country, even to shopping mall construction, or office blocks,
operating in multiple countries.
The industry has high barriers to entry. Main players in this industry are represented by such
companies as Vulcan Materials Corp. (engages in the production and sale of construction
aggregates for the infrastructure industry; segments: aggregates, concrete, asphalt mix, and
cement), as well as by smaller companies such as Martin Marietta Materials (engages in the
production and sale of aggregates for the construction industry).

Oleksandr Matviienko, Soufianne Ayoche, Huizhong Li
Materials, 2012
18
This sub-industry is represented in S&P 400 by a single company Martin Marietta Materials Inc.,
the second largest U.S. producer of aggregates for the construction industry.
Revenue and Earning Drivers
The macroeconomic performance, which is measured by real GDP, is one of the revenue drivers
for Construction Materials industry. Construction activity in the U.S. is the single most important
driver of earnings power for Construction Materials industry.
Construction activity is driven by highway construction (public construction and supported by
government funding), commercial construction
(public construction), and housing (private
construction). Construction activity is highly
cyclical.
Public construction, funded by the government, is
an important segment of the industry. The
infrastructure spending is a key driver for the
industry.
The industry is subject to increasing challenges
from environmental advocates hoping to control
the pace and direction of future development,
which made it difficult for the industry to expand
and grow.
Meanwhile, these restrictions on supply have created a favorable pricing environment that is
expected to continue.
Risk Drivers
The biggest risk for Construction Materials industry is weak construction activity. Weak federal
and state budgets are a concern. Politicians are focused on cutting government spending. Future
restrictions will be more likely to make zoning and permitting more difficult, which means that
the favorable pricing environment is expected to continue. The commercial sector in coming
months will continue to be weak, but according to S&P, the residential spending has bottomed
and will improve gradually in 2012, which is a bull say. Raw material is like to inflate in the
form of higher costs for diesel and asphalt, which will drive up COGS and decrease earnings.
Target Companies Comparable Statistics*
In billions Mkt Cap Revenue P/E TEV/Sales TEV/EBITDA GM B/M
5-Year
GS
Martin Marietta Materials 3.99 1.81 48.59 2.48 15.11 16.60% 0.36 -4.07%
Peer Average 2.56 2.98 28.73 1.54 19.61 24.41% 0.53 -3.64%
*Based on Bloomberg Peers

Oleksandr Matviienko, Soufianne Ayoche, Huizhong Li
Materials, 2012
19
Outlook
Our fundamental outlook for the construction materials sub-industry for the next 12 months is
neutral. For the commercial construction sector, there‟s no obvious recovery trend leading to a
rebound in demand. Since the regression in 2008, housing starts stayed at quite low levels in the
past several years. According to S&P, in the coming months, the weak trend will continue but is
likely to show some recovery in 2012. Spending on infrastructure is uncertain. Due to the limited
visibility on federal infrastructure spending levels in 2012, we expect that public construction
demand for aggregates will be low. Pricing for aggregates is likely to hold up because of the
restrictions being placed on mining due to environmental concerns. Below two graphs are the
outlook by Standard & Poor and Value Line.

Oleksandr Matviienko, Soufianne Ayoche, Huizhong Li
Materials, 2012
20
Source: Standard and Poor’s Source: Value Line
Metal & Glass Containers industry
Industry Overview
The Containers & Packaging industry are engaged in the manufacturing of containers, as well as
offering packaging services. The food-and-beverage and household products sectors account for
the biggest portion of overall business.
The industry is concentrated toward metal, glass and plastic containers and packaging operations.
For DFF, we only focus on metal and glass containers.
Companies within the industry serve a wide variety of markets, but most rely on the food-and-
beverage, household products, and pharmaceutical sectors for the majority of business.
Main players in this industry are represented by such companies as Ball Corp. (supplies metal
packaging to the beverage, food, and household products industries worldwide) and Owens-
Illinois Inc.(manufactures and sells glass container products), as well as by smaller companies
such as AptarGroup Inc. (engages in the design, manufacture, and sale of consumer product
dispensing systems.), Greif Bros Corp A (manufactures and sells industrial packaging products)
and Silgan Holdings (engages in the manufacture and sale of metal and plastic consumer goods
packaging products).

Oleksandr Matviienko, Soufianne Ayoche, Huizhong Li
Materials, 2012
21
This sub-industry is represented in S&P 400 by a range of companies indicated in table below.
Revenue and Earning Drivers
Though companies in the industry offer their products to diversified end markets to stabilize
earnings and enhances customer base, the industry is not immune to macroeconomic cycles. As
the broader economy goes, so goes the Packaging and Containers Industry.
According to Value Line, consumer spending habits
can have an impact on operating results. Global sales
of beer, wine and spirits and food containers remain
fairly strong, due in part to more cost-conscious
consumers continuing to dine at home.
Since a good number of products utilize oil-based
materials, energy price is also a key driver factor
affecting revenues and earnings. Volatile petroleum-
based material prices can make cost management a
challenge. In addition, the raw material, such as steel
and aluminum etc. has a clear and direct effect on the
revenue and earnings. Thus, some companies in the
industry consider acquiring the self-make steel can
operations.
The metal container business' sales are dependent, in
part, upon the vegetable and fruit harvests in some
regions of the US.
Metal & Glass Containers industry is subject to the
global beverage industry. International expansion helps to limit volatility and enhance these
companies‟ attractiveness.
In terms of environment concern, government implements extensive regulations on mandating
recycling and limitations on certain packaging items. It will affect the sale of beverage
containers, as well as the supplies of post-consumer recycled glass.
New technology and production efficiencies can boost sales volume and margins.
Target Companies Comparable Statistics*
In billions Mkt Cap Revenue P/E TEV/Sales TEV/EBITDA GM B/M
5-Year
GS
AptarGroup Inc 3.48 2.34 19.66 1.5 8.38 32.17% 0.37 5.21%
Greif Bros Corp A 2.43 4.25 13.81 0.86 7.94 18.24% 0.51 n/a
Silgan Holdings 3.02 3.51 16.49 1.05 7.62 13.97% 4.58 5.35%
Peer Average 3.53 5.07 14.72 1.01 15.72 18.26% 2.43 7.30%
*Based on Bloomberg Peers

Oleksandr Matviienko, Soufianne Ayoche, Huizhong Li
Materials, 2012
22
Risk Drivers
The packaging industry is highly competitive. Most participants in the industry have to compete
on price, especially in the food-and-beverage segment. The global containers and packaging
industry is witnessing an increasing trend. Companies‟ operations in the industry are subject to
federal, foreign, state and local environmental laws and regulations. These laws and regulations
limit the discharge of pollutants and establish standards for the treatment. In addition to costs
associated with regulatory compliance, companies may be held liable for alleged environmental
damage associated with the past disposal of hazardous substances. Due to dependence on crop
market, the weather conditions in those regions will affect the results of operations accordingly.
Outlook
We have moderately positive outlook for the metal and glass containers sub-industry in the
following 12-month, based on our view of a gradual economic recovery and growth in global
packaging and containers markets. According to Data monitor‟s report on 'Global Containers and
Packaging', the global containers and packaging market generated total revenues of $420.3
billion in 2009, representing a compound annual growth rate (CAGR) of 2.2% for the period
spanning 2005-09. The performance of the market is forecast to accelerate, at an anticipated
CAGR of 3.3% for the five-year period 2009-14, which is expected to drive the market to a value
of $493.5 billion by the end of 2014. The industry is undertaking consolidations to seek to
improve operating efficiencies and expand their global market reach. We believe improved
production efficiencies and new products, such as easy-open closures on cans and lighter-weight
glass bottles in new sizes, will eventually boost sales volume and margins. The structure and
enforcement of laws mandating recycling and limitations on certain packaging items can affect
the sale of beverage containers, as well as the supplies of post-consumer recycled glass, which
we view as a positive for companies within this group. Below two graphs are the outlook by
Standard & Poor and Value Line.

Oleksandr Matviienko, Soufianne Ayoche, Huizhong Li
Materials, 2012
23
Source: Standard and Poor’s Source: Value Line
Paper and Forest Products Industry
Industry Overview
These industries are involved in the manufacturing of paper, paperboards and wood products
According to S&P, the main raw materials are timber and wood fiber (virgin or recycled). The
production process in this industry is very capital intensive which leads to large consolidations
within the industry. The main end users of such paper and forest products include industries as
manufacturing, automobile, agriculture, housing, construction, pharmaceuticals. The main
players are large paper and forest companies such as International Papers and Weyerhaeuser (see
table), whose financial structures and supply management abilities allow them to survive. The
main products of the paper industry are paperboard (containerboards and boxboards), paper
(printing and writing), newsprint, tissue paper and other.
For the Forest products industries, the main products are wood products such as lumber and
structural panels.

Oleksandr Matviienko, Soufianne Ayoche, Huizhong Li
Materials, 2012
24
Here is a table summarizing key statistics for the companies we are studying in our sector.
Revenue Drivers
Housing starts is the most important driver for forest products since it is the highest end market
for lumber and other wood products. Moreover, interest rates are also important revenue drivers
since they affect the whole GDP outlook and corporate operating strategy, which is very
important for such industries since they are strongly correlated with the overall level of the
general economy. In this case, falling interest rates are positive since investment activity
increases. Another very important driver is GDP. Indeed, it is a very important indicator for
economic health with high impacts on paper and forest products. In addition, operating rates are
also important to consider. Indeed, the proportion of total manufacturing capacity being utilized
is a key indicator of the health of the overall industry. Main raw materials prices as well as final
product prices are also important to consider they affect operating rates and overall profitability.
Paper/Packaging Products: Target Companies Comparable Statistics*
In billions Mkt Cap Revenue P/E TEV/Sales TEV/EBITDA GM B/M
5-Year
GS
ROCK-TENN
COMPANY 4.86 6.91 13.16 1.09 9.28 17.30% 0.71 47.20%
PACKAGING CORP
OF AMERICA 2.94 2.62 18.21 1.14 8.09 20.51% 0.33 3.73%
SONOCO PRODUCTS CO 3.27 4.50 14.62 0.98 8.16 16.36% 0.43 3.04%
TEMPLE-INLAND I 3.51 3.94 34.77 1.05 11.56 12.32% 0.28 -5.93%
DOMTAR CORP 3.43 5.61 8.35 0.6 3.47 17.17% 0.86 23.81%
LOUISIANA-PACIFIC
CORP 1.10 1.36 n/a 1.1 118.38 6.79% 0.92 0.60%
Peer Average 3.56 5.41 14.09 0.94 12.91 16.88% 0.45 9.65%
*Based on Bloomberg Peers

Oleksandr Matviienko, Soufianne Ayoche, Huizhong Li
Materials, 2012
25
You can check in graph X that the prices of lumber and structural panels have rebounded since
its low in 2009, which in turn explained the increased production in 2010 as you can see in table
X. Finally, international trade is very important for the forest industry because solid level of
exports help exponentially the industry in periods of strengths and mitigates the bad effects in
periods of bad domestic performances.
Risk Drivers
According to S&P, expanding electronic communications are hurting the print market. Moreover,
growth in e-readers may be detrimental for some grades of paper products. Finally, pine beetles
impact can last for years for the lumber productions.

Oleksandr Matviienko, Soufianne Ayoche, Huizhong Li
Materials, 2012
26
Outlook
We believe Paper and Forest Products Industry would benefit from US/global industrial recovery
as, according to EIU, US Real GDP growth rate is expected to be 1.8% in 2012 and accelerate to
2.3% by 2015, as well as global Real GDP growth rate is expected to be 3.1% in 2012 and reach
4.3% by 2015. Those results are show in graph Y. This factor coupled with the fact that the Fed
is expecting to keep interest rates low until 2015 are very good news for the industry. In addition,
according to S&P, supply is being controlled which is a good indicator of the industry capacity
to react to its environment. Moreover, pulp prices and other raw materials prices has decreased
significantly recently which coupled with the recent prices increase of many grades of paper,
which affected positively the industry‟s profitability. Another interesting element is linked to
new opportunities that may arise since cellulosic ethanol by contrast to traditional ethanol for
biofuel energy may add a market for this industry. Finally, existing home sales and housing
formation are improving which may have a positive effect on the forest products industry. You
can also check graph Z about housing starts information.
All in all, our outlook for the paper and forest products industries is positive and we expect those
industries to slightly over perform the market in 2012.
Materials Industry outlook
We believe Materials Industry would benefit from US/global industrial recovery, high industrial
demand and production levels in developing world, strong
agricultural production levels, as well as low substitution trends
and favorable government regulation regimes, as well as
accelerated international trade levels
In addition, we believe Materials industry is undervalued
currently on basis of overstated pessimism concerning current
global recovery and industrial production growth levels, as well
as relatively high B/M and low P/E levels. Please find more
information in table to the right.
Indices comparison
Index P/E B/M
S&P 400
Materials 17.35 0.478
S&P 400 20.19 0.476
S&P 500 14.44 0.452
Nasdaq 21.73 0.357
Source: Factset

Oleksandr Matviienko, Soufianne Ayoche, Huizhong Li
Materials, 2012
27
Investing Process Description The flowchart below describes our general approach towards stock screening, analysis, and
selection processes.
We executed our analysis on three distinct levels: Quantitative, Qualitative, and Fundamental.
On the Qualitative and Quantitative levels each stock got a distinct score as a rank of the
company according to a given screen. Quantitative scores were aggregated in a C-score, which
measured a companies‟ overall standing according to quantitative screens, and qualitative scores
were aggregated in a Q-score, which measured companies‟ standing according to qualitative
screens. Further, we assigned 70% weight to quantitative score and 30% to qualitative score to
get a CQ-score. Top 6 companies according to CQ-score were sorted out for fundamental
analysis. As a result of fundamental analysis we selected 3 stocks for buy/hold recommendations
and 1 current DFF holding – Silgan Holdings – for a sell recommendation. Table below presents
the CQ-scores for each 27 companies. Also, since the past 3-year data was missing for Intrepid
Potash, we were unable to complete the screens for this company.

Oleksandr Matviienko, Soufianne Ayoche, Huizhong Li
Materials, 2012
28
“Leading Quant” means top 6 companies according to quantitative screens, “Leading Qualt”
means top 6 companies according to qualitative screens. One company, which is also a current
DFF holding – Sensient Technologies – was among top 6 companies in both quantitative and
qualitative screens.
Quantitative Screens and Analysis The quantitative analysis was based on different screening criteria to analyze the stocks from
different perspectives. Specifically we used such screening techniques as:
Glamour/Value screens, as based on DeBondt and Thaler, as well as Lakonishok,
Shleifer, Vishny (LSV) papers, characterize companies from value investing standpoint.
We used such parameters as past 3-year buy and hold returns and past 5-year sales
growth rates, as well as book value of equity to market value of equity and cash flow per
share to price per share screens. We averaged 3-year buy and hold return rank and 5-year
sales growth ranks of analyzed companies to get combined score used further in our
analysis. Also we averaged ranks of companies according to book-to-market and cash
Weights: Ticker Company C-Score Q-Score CQ-Score
C 70% IPI INTREPID POTASH n/a 70 n/a
Q 30% CYT CYTEC INDUSTRIES INC 135 46 108.3
SXT SENSIENT TECHNOLOGIES CORP 121.5 70 106.1
Legend: SMG SCOTT MIRACLE GROWTH 126 58 105.6
Ultimate Selection MTX MINERALS TECHNOLOGIES INC 133 39 104.8
Leading Quant UFS DOMTAR CORPORATION 125 57 104.6
Leading Qualt STLD STEEL DYN 118.5 59 100.7
Leading Both PKG PACKAGING CORPORATION OF AMERICA 106 80 98.2
Current Holding OLN OLIN CORP 111 64 96.9
No data available ALB ALBEMARLE CORP 108.5 62 94.6
SON SONOCO PRODUCTS 106 63 93.1
ATR APTARGROU 99.5 61 88.0
CMP COMPASS MINERALS INTL INC 92 58 81.8
MLM MARTIN MA 104 29 81.5
WOR WORTHINGT 87 68 81.3
CBT CABOT CORP 91.5 56 80.9
ASH ASHLAND INC NEW 90.5 53.5 79.4
SLGN SILGAN HO 86 58 77.6
CMC COMMERCIA 102 18.5 77.0
VAL VALSPAR CORP 95 33.5 76.6
RS RELIANCE 74 81 76.1
CRS CARPENTER 81.5 57 74.2
NEU NEWMARKET CORP 71.5 68 70.5
GEF GREIF INC 74.5 50 67.2
RKT ROCK TENN 59.5 67 61.8
RPM R P M INTERNATIONAL INC 60 63 60.9
LPX LOUISIANA PACIFIC CORPORATION 73 22.5 57.9

Oleksandr Matviienko, Soufianne Ayoche, Huizhong Li
Materials, 2012
29
flow-to-price screens to get combined score used further in our analysis. Please refer to
Appendix A for detailed calculations.
Earnings surprise screens, as based on Doyle, Lundholm, and Soliman paper, to
investigate how the market participants actually perceive the perspectives of companies
and how effectively market is valuing given securities. This measure is directly related to
companies‟ abilities to generate abnormal returns, as higher earnings surprises they
experience lead to higher abnormal returns they exhibit. Thus, we allocated higher ranks
to companies which exhibited higher earnings surprise as of the end of FY2011. Please
find detailed calculations in Appendix A.
Volatility screens, as based on Baker, Bradley, and Wurgler paper, measured by both
standard deviation and beta are used to investigate companies‟ risks as perceived by the
market. We allocated higher ranks to companies with lower standard deviation and betas
of 2 year monthly returns (regressed on S&P 400 for beta calculations). Then we
calculated average rank according to these two indicators to serve as a volatility score.
Please find detailed calculations in Appendix A.
Accruals screens, as based on Sloan paper, were used to check the earnings quality of
respective companies. Stocks with the lowest ranks got the highest scores. Please find
detailed calculations in Appendix A.
F-score screens, as based on Piotroski paper, were used to determine the fundamental
strength of the companies. Please find detailed calculations in Appendix A.
External financing screens, as based on Bradshaw, Richardson, and Sloan paper, to
determine companies‟ recent financing activities taking into account the scientifically
determined market reaction to the companies‟ financing activities. Please find detailed
calculations in Appendix A.
Thus, we believe proposed quantitative process would characterize the firm from different
investing and financing perspectives and allow us to make a better selection by basing our choice
on the variety of criteria. We aggregated each score obtained by companies according to the
aforementioned screens and got such results:
Oleksandr Matviienko, Soufianne Ayoche, Huizhong Li
Materials, 2012
30
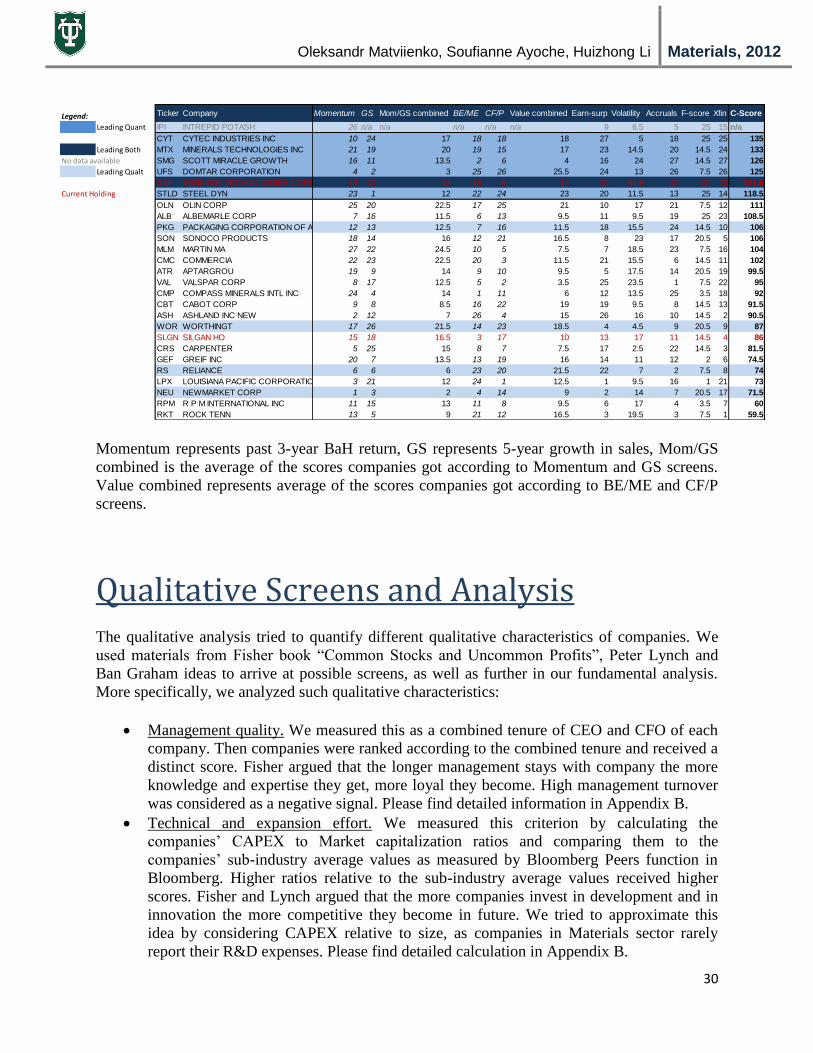
Momentum represents past 3-year BaH return, GS represents 5-year growth in sales, Mom/GS
combined is the average of the scores companies got according to Momentum and GS screens.
Value combined represents average of the scores companies got according to BE/ME and CF/P
screens.
Qualitative Screens and Analysis The qualitative analysis tried to quantify different qualitative characteristics of companies. We
used materials from Fisher book “Common Stocks and Uncommon Profits”, Peter Lynch and
Ban Graham ideas to arrive at possible screens, as well as further in our fundamental analysis.
More specifically, we analyzed such qualitative characteristics:
Management quality. We measured this as a combined tenure of CEO and CFO of each
company. Then companies were ranked according to the combined tenure and received a
distinct score. Fisher argued that the longer management stays with company the more
knowledge and expertise they get, more loyal they become. High management turnover
was considered as a negative signal. Please find detailed information in Appendix B.
Technical and expansion effort. We measured this criterion by calculating the
companies‟ CAPEX to Market capitalization ratios and comparing them to the
companies‟ sub-industry average values as measured by Bloomberg Peers function in
Bloomberg. Higher ratios relative to the sub-industry average values received higher
scores. Fisher and Lynch argued that the more companies invest in development and in
innovation the more competitive they become in future. We tried to approximate this
idea by considering CAPEX relative to size, as companies in Materials sector rarely
report their R&D expenses. Please find detailed calculation in Appendix B.
Legend: Ticker Company Momentum GS Mom/GS combined BE/ME CF/P Value combined Earn-surp Volatility Accruals F-score Xfin C-Score
Leading Quant IPI INTREPID POTASH 26 n/a n/a n/a n/a n/a 9 6.5 5 25 15 n/a
CYT CYTEC INDUSTRIES INC 10 24 17 18 18 18 27 5 18 25 25 135
Leading Both MTX MINERALS TECHNOLOGIES INC 21 19 20 19 15 17 23 14.5 20 14.5 24 133
No data available SMG SCOTT MIRACLE GROWTH 16 11 13.5 2 6 4 16 24 27 14.5 27 126
Leading Qualt UFS DOMTAR CORPORATION 4 2 3 25 26 25.5 24 13 26 7.5 26 125
SXT SENSIENT TECHNOLOGIES CORP 14 10 12 15 9 12 15 22.5 15 25 20 121.5
Current Holding STLD STEEL DYN 23 1 12 22 24 23 20 11.5 13 25 14 118.5
OLN OLIN CORP 25 20 22.5 17 25 21 10 17 21 7.5 12 111
ALB ALBEMARLE CORP 7 16 11.5 6 13 9.5 11 9.5 19 25 23 108.5
PKG PACKAGING CORPORATION OF AMERICA 12 13 12.5 7 16 11.5 18 15.5 24 14.5 10 106
SON SONOCO PRODUCTS 18 14 16 12 21 16.5 8 23 17 20.5 5 106
MLM MARTIN MA 27 22 24.5 10 5 7.5 7 18.5 23 7.5 16 104
CMC COMMERCIA 22 23 22.5 20 3 11.5 21 15.5 6 14.5 11 102
ATR APTARGROU 19 9 14 9 10 9.5 5 17.5 14 20.5 19 99.5
VAL VALSPAR CORP 8 17 12.5 5 2 3.5 25 23.5 1 7.5 22 95
CMP COMPASS MINERALS INTL INC 24 4 14 1 11 6 12 13.5 25 3.5 18 92
CBT CABOT CORP 9 8 8.5 16 22 19 19 9.5 8 14.5 13 91.5
ASH ASHLAND INC NEW 2 12 7 26 4 15 26 16 10 14.5 2 90.5
WOR WORTHINGT 17 26 21.5 14 23 18.5 4 4.5 9 20.5 9 87
SLGN SILGAN HO 15 18 16.5 3 17 10 13 17 11 14.5 4 86
CRS CARPENTER 5 25 15 8 7 7.5 17 2.5 22 14.5 3 81.5
GEF GREIF INC 20 7 13.5 13 19 16 14 11 12 2 6 74.5
RS RELIANCE 6 6 6 23 20 21.5 22 7 2 7.5 8 74
LPX LOUISIANA PACIFIC CORPORATION 3 21 12 24 1 12.5 1 9.5 16 1 21 73
NEU NEWMARKET CORP 1 3 2 4 14 9 2 14 7 20.5 17 71.5
RPM R P M INTERNATIONAL INC 11 15 13 11 8 9.5 6 17 4 3.5 7 60
RKT ROCK TENN 13 5 9 21 12 16.5 3 19.5 3 7.5 1 59.5

Oleksandr Matviienko, Soufianne Ayoche, Huizhong Li
Materials, 2012
31
Cost control. We measured this criterion by comparing respective companies‟ Gross
margins to their sub-industry Gross margin average figures as measured by Bloomberg
Peers function in Bloomberg. Higher ratios relative to the sub-industry average values
received higher scores. Fisher argued that the lower production costs companies have the
more competitive and stable they are. Please find detailed calculation in Appendix B.
Operational efficiency. We measured this criterion as companies‟ ROIC ratios relative to
their sub-industry average values as measured by Bloomberg Peers function in
Bloomberg. Higher ratios relative to the sub-industry average values received higher
scores. Fisher argued that operational efficiency is one of the most important factors
determining companies‟ performance, competitiveness, and stability, thus, indicating
investment appeal. Please find detailed calculation in Appendix B.
After aggregating each stock‟s scores into distinct Q-score we got such results:
Fundamental Analysis On the basis of combined CQ-score we selected 6 companies for further fundamental analysis.
We also analyzed Silgan Holdings, a current DFF holding which performed poorly on
quantitative screens so may be candidate for a sell recommendation.
Legend: Ticker Company Oper Eff Tech and Exp Cost Control Mngmt Quality Q-Score
Leading Quant RS RELIANCE 22 6 27 26 81
Leading Qualt PKG PACKAGING CORPORATION OF AMERICA21 24 18 17 80
Leading Both IPI INTREPID POTASH 16 25 19 10 70
Current Holding SXT SENSIENT TECHNOLOGIES CORP 10 11 22 27 70
No data available WOR WORTHINGT 24 1 20 23 68
NEU NEWMARKET CORP 27 5 16 20 68
RKT ROCK TENN 12 16 14 25 67
OLN OLIN CORP 8 26 8 22 64
SON SONOCO PRODUCTS 18 15 9 21 63
RPM R P M INTERNATIONAL INC 11 2 26 24 63
ALB ALBEMARLE CORP 23 13 24 2 62
ATR APTARGROU 19 14 25 3 61
STLD STEEL DYN 25 10 13 11 59
SMG SCOTT MIRACLE GROWTH 13 12 15 18 58
CMP COMPASS MINERALS INTL INC 6 23 10 19 58
SLGN SILGAN HO 20 18 4 16 58
UFS DOMTAR CORPORATION 17 21 5 14 57
CRS CARPENTER 26 3 21 7 57
CBT CABOT CORP 14 27 6 9 56
ASH ASHLAND INC NEW 2.5 19 17 15 53.5
GEF GREIF INC 15 22 12 1 50
CYT CYTEC INDUSTRIES INC 7 20 11 8 46
MTX MINERALS TECHNOLOGIES INC 9 17 7 6 39
VAL VALSPAR CORP 2.5 4 23 4 33.5
MLM MARTIN MA 5 9 2 13 29
LPX LOUISIANA PACIFIC CORPORATION 2.5 7 1 12 22.5
CMC COMMERCIA 2.5 8 3 5 18.5

Oleksandr Matviienko, Soufianne Ayoche, Huizhong Li
Materials, 2012
32
Sensient Technologies (SXT). Current DFF holding.
Industry analysis and trends
Sensient Technologies operates in a Specialty chemicals sub-industry. As indicated in our
Materials industry analysis we are optimistic about this industry outlook:
US/global industrial recovery as measured by acceleration in real GDP and industrial
production growth rates
Deceleration of growth in energy prices
Strong agricultural demand for chemicals
Positive chemical price dynamics
All of the aforementioned factors would produce a positive impact on Sensient Technologies
growth and profitability.
Porter’s five forces analysis
The Specialty chemicals sub-industry can be characterized by greater control over prices than
basic chemicals industry, as specialty chemical products are diversified and customized. This, in
turn, affects the bargaining power of buyers which we believe is moderate, as buyers may
have moderate-to-high switching costs and
special preferences for special features and
quality of chemical products which only few
producers could satisfy. Also, we believe that
bargaining power of suppliers is moderate
as Specialty chemical companies‟ main
productive inputs are natural gas and other
energy products which are scarce in nature
and chemical companies have little power in
price negotiations as prices are determined on
world markets. The threat of substitutes is
low as specialty chemical products are
oftentimes used as intermediate goods in
making final products using latest
technologies and scarce natural resources, thus, making them irreplaceable. The threat of new
entrants is also low as current players oftentimes achieve considerable economies of scale in
production, distribution and marketing, as well as the industry itself is highly capital and labor
intensive requiring high capital expenditures. On the basis of all of the aforementioned factors
and the fact that specialty chemical companies mostly compete on quality and customization, but
there are high barriers to entry and low substitution threat, there is a moderate rivalry among
companies in Specialty chemicals sub-industry. This results in specialty chemical companies
having moderate control over prices and costs, thus, relatively stable margins.

Oleksandr Matviienko, Soufianne Ayoche, Huizhong Li
Materials, 2012
33
Company overview
Sensient Technologies (Sensient) is engaged in manufacturing, distribution, and marketing of
flavors, fragrances and colors throughout the world. According to Company‟s documents, it
develops specialty food and beverage systems, cosmetic and pharmaceutical formulations; inkjet
and specialty inks and colors; and other specialty chemicals. Its customers include major
international producers. It has two divisions: Flavors and Fragrances Group (produces systems
products comprising flavor-delivery systems, and compounded and blended products; and
ingredient products, such as essential oils, natural and synthetic flavors, and aroma chemicals),
Color Group (provides natural and synthetic color systems for use in foods, beverages, and
pharmaceuticals; colors and other ingredients for cosmetics and pharmaceuticals; and technical
colors for industrial applications and digital imaging). The company was founded in 1882 and is
headquartered in Milwaukee, Wisconsin. It operates in majority of international markets
including Brazil, Russia, Australia, Germany, France, UK, Mexico, Poland, Portugal, China etc
It serves food industries, which include savory, beverage, dairy, confectionery, and bakery
flavors; and non-food industries that comprise personal and home care-markets, and
pharmaceuticals markets, as well as such industries as cosmetics, digital imaging industry etc.
Table below represents Sensient‟s main competitors.
Management performance
The SXT‟s main management consists of CEO, CFO, and COO. After studying key executives
biographies, as provided by GlobalData services, we concluded that management is relatively
professional and experienced, as the average age of the team is 63 years and everybody has
around 35+ years of chemical industry experience and stayed with Sensient for a considerable
amount of time. Under current management market capitalization increased for around 50% for
past several years and 2011 was a record profitability year. Form a profitability standpoint,
management performance was fair, as, basically, main profitability ratios were increasing
consistently except for FY 2009. However, the Company had a steady growth in dividends.
Exhibits below summarize key management performance measures:
SXT: Key Competitors
Name Headquarters FY 2011 Revenue, mln USD
Agrium U.S. Inc. USA n/a
Covidien plc Ireland 11,574
International Flavors &
Fragrances Inc. USA 2,788
Sumitomo Bakelite
Company Limited Japan 2,395
Symrise France n/a
Valmont Industries, Inc. USA 2,661
Sensient USA 1,430
Source: Global Data

Oleksandr Matviienko, Soufianne Ayoche, Huizhong Li
Materials, 2012
34
On basis of the aforementioned analysis we believe management‟s qualifications and
performance was relatively strong.
Product differentiation and competitive position
The Company‟s products are highly diversified as portfolio of the company includes natural and
synthetic food and beverage colors; flavors, flavor enhancers and bionutrients; fragrances and
aroma chemicals; dehydrated vegetables and other food ingredients; cosmetic and
pharmaceutical colors and additives; and technical colors, inkjet colors and inks, and specialty
dyes and pigments. Such products are used in variety of industries (both cyclical and non-
cyclical) across various geographies, including Americas, Europe and Asia, presenting a rigid
hedge to the Company‟s margins and growth. Speaking about Company‟s competitive position,
according to Company‟s documents, Sensient is engaged in research and development, and
quality assurance to improve existing products, develop new products and improve its services.
In 2010, the company spent around $30.6m for its research and development. This would have a
positive effect on the company‟s competitiveness. According to S&P, Sensient invested
sufficiently in selling and technical support, which strengthens its competitive position. Also, it
is worth noting the Company‟s fundamental strength and a healthy balance sheet. Moreover, as
consumers become increasingly conscious of food and beverage ingredients, we believe Sensient
has strong growth perspectives in natural colors segment. It is also worth noting the acquisition
strategy of the Company: according to KeyBanc, having put nearly $75 million into investments
during 2011, which included two acquisitions, expansion of North America natural color
capacity and a color and flavor facility in Brazil, analysts expect SXT to grow that amount in
2012. It is believed that the Company will continue to pursue growth opportunities in some of
the faster growing color markets including digital inks, cosmetics, pharmaceutical and natural
color applications. Ending the year with $23 million in cash on hand, having generated roughly
$30 million in free cash flow, and holding a manageable Net Debt-to-EBITDA ratio of 1.3x, the
Company has an adequate balance sheet and cash generation capability to fund external and
internal growth measures. All-in-all, the Company has a strong product differentiation and solid
competitive standing.
SWOT Analysis
Source: Global Data

Oleksandr Matviienko, Soufianne Ayoche, Huizhong Li
Materials, 2012
35
North-
America
53%Europe
28%
Asia Pacific
13%
Other
6%
Geographic revenue breakdown in 2010
Source: Global Data
SXT: SWOT Analysis
Strenghts Weaknesses
Product and geographical Legal proceedings
diversification
Strategic invesments
Strong financial position
Opportunities Threats
Emerging markets operations Environmental regulations
Healthcare increased demand High competition
International business risk
M&A failure
Source: Team
The Company has numerous strengths, as well as weaknesses. One of the most important
strengths is the Company‟s
diversification strategy. A great level
of product differentiation is reflected in
two distinct segments – Flavors &
Fragrances (59% of revenue in 2010),
and Color (32% of revenue in 2010) –
the company operates in. These
segments supply products to various
industries described above. Thus,
Company effectively protects itself
from various industries‟ risks as well
as general economic risks as its
consumers represent companies from
different cyclical and non-cyclical
industries. Moreover, Company‟s
overall diversification is buttressed by
its presence in various geographic regions. It operates in a majority of countries in Americas,
Europe and Asia where the Company runs
plants, distribution and marketing facilities, as
well as research and development laboratories.
Thus, the Company defends itself from any
unanticipated business interruptions, or
economic meltdown from being geographically
and product-diversified. Moreover, Company‟s
recent strategic investments in technology
improvements, new production facilities in
China and USA, as well as new processing
equipment in the USA would allow it to
strengthen its competitive position, especially
in relation to Color Group business. Such
investments were possible due to the
Company‟s strong fundamental position. Our
quantitative F-sort showed Sensient to be one of the financially strongest companies. Also, its
debt ratios have been consistently falling for last 5 years, as well as liquidity ratios consistently
rising for last 5 years.
Speaking about Sensient‟s weaknesses it is worth mentioning some legal proceedings and other
claims the Company is subject to as part of its ongoing operations. According to Global Data,
such proceedings include Pleasant Gardens Realty Corp. v. H. Kohnstamm & Co.; Cherry
Blossom Litigation; S.A.M. (Amaral) v. Sensient Technologies Corp.; and Daito Kasei Kogyo
Co. Ltd. vs. Sensient Cosmetic Technologies SAS. Such proceedings may potentially result in
substantial losses, as well as divert management‟s attention and efforts from the Company‟s
operations and strategy.
The Company has significant opportunities, as well as threats. We believe Sensient‟s substantial
presence in emerging markets of Eastern Europe, South and Central America and Asia is a
great opportunity for growth and expansion. Various experts forecast that emerging economies‟

Oleksandr Matviienko, Soufianne Ayoche, Huizhong Li
Materials, 2012
36
growth rates, particularly in chemical industry, will significantly outperform developed ones.
According to Global Data, the chemical industry in the emerging nations is expected to grow
7.6% in 2011 and 2012. Moreover, the demand for main Company‟s products is growing more
rapidly in emerging countries. Therefore, the Company would benefit by increasing its
operations in emerging markets.
Also it is worth noting that the Company is perfectly posed to take an advantage of growing
pharmaceuticals and healthcare markets in the USA, which drive the demand for Company‟s
main products. According to the National Coalition on Healthcare, annual healthcare spending in
the US increased to $2.5 trillion in 2009. It is projected to reach $3.1 trillion by 2012 and $4.3
trillion by 2016. According to Global Data, the increase in the aging population contributes to
the rising healthcare expenditure in the US.
Speaking about Company‟s threats, we believe the most important is stringent government
regulations of Flavors and Fragrances industry. There are a lot of different standards,
compliance procedures, laws, regulations imposed by various regulations agencies, governments
and professional boards. The Chemical industry analysis contains the most important US
governmental regulations. These laws are highly complex and require significant investments in
adequate compliance and quality controls systems. The failure to comply with any of the
aforementioned regulations may result in huge fines and penalties, the loss of reputation,
products recall, market share loss, and damage to reputation. Also, intensified competition in
chemicals industry requires Company‟s constant investment in new technologies, processes,
upgrade of its existing products, marketing and customer services. If the Company‟s products
become obsolete or customer services inadequate, it will lose its market shares and possible go
bankrupt.
Company‟s operations in various locations across the globe create substantial international
business risks, such as nationalization of assets, political and economic instability, fluctuations
in currency exchange rates, etc.
The Company‟s recent M&A activity may also pose a significant threat, if such acquisitions are
not integrated properly into existing business model or cannibalize existing sales.
Analysts’ and investors’ sentiment
Analysts generally are optimistic about the stock in a near term, as EPS forecasts are increasing
till 2013 and then decreasing in 2014. Speaking about the ratings, the general analysts‟ rating is
hold, which is the recommendation of 4 out of 5 analysts. One more analysts recommends
moderate buy. We couldn‟t indicate that such sentiment changed recently. Since the beginning of
2012 there were only two changes of the rating and in both cases the stock was downgraded from
“buy” to “hold”. For past three months this stock was a consistent “hold”. We believe the low
number of analysts following the Company and their uncertainty of the stock investment appeal
is a positive sign indicating that the Company is not obviously a “glamour stock” and may be
priced irrationally. Current mean target price is $40.5 which represents around 11% upside of
current price of $36.5. The stocks‟ trading volume also looks quite stable indicating that
investors currently have no extreme sentiment concerning the stock.

Oleksandr Matviienko, Soufianne Ayoche, Huizhong Li
Materials, 2012
37
Source: Thompson One Banker
Conclusion
We believe Sensient has strong fundamentals because:
The industry has a positive outlook and is moderately competitive
The management is experienced and demonstrated strong performance for past years
It has diversified products and operations which allows the Company to defend itself
from various specific industries/regions risks
It has strong presence in emerging markets where chemical growth is expected to be
robust
It has a strong presence in the US healthcare market which is also projected to grow
consistently
It has a solid competitive position created by recent successful investments and M&A
activity
It is a thinly followed stock with a positive outlook.
Cytec Industries (CYT)
Industry analysis and trends, Porter’s five forces analysis
Cytec Industries is a specialty chemicals company. Please refer to Sensient Technologies
analysis for chemicals industry outlook and analysis.
Company overview
Cytec Industries (Cytec) develops, manufactures, and markets value-added specialty chemicals
and materials. The Company breaks down its operations into four reportable segments: Coating
Resins, Additive Technologies, In Process Separation and Engineered Materials. According to
Company‟s documents, Cytec, through its Coating Resins segment, offers three product lines
including radcure resins, powder coating resins, and liquid coating resins. The major products of
radcure resins include oligomers, monomers, and photo-initiators. The powder coating resins
include conventional and ultraviolet powder coating resins. Its liquid coating resins include
amino cross-linkers, waterborne resins, urethane resins and solvent borne resins. Its coatings and
inks are used in industrial metal, wood and plastic coatings sector. The powder coatings are used
in industrial and heavy duty metal applications, while its industrial coatings are used in
automobiles, cans, coil, metal fixtures, metal and wood furniture. The Company's Additive

Oleksandr Matviienko, Soufianne Ayoche, Huizhong Li
Materials, 2012
38
Technologies segment offers polymer additives, specialty additives, and polyurethanes. These
products have applications in plastics, coatings, fibers, automotive parts, agricultural films,
architectural lighting, textiles, non-woven and adhesives, pharmaceuticals and super absorbent
polymers. Company‟s In Process Separation segment offers mining chemicals and phosphines.
Its mining chemicals are used in mineral separation and processing of copper, alumina and other
minerals. Phosphines are used in the applications of chemical and electronic manufacturing,
pharmaceutical, and fumigants. The company‟s Engineered Materials business segment provides
technologically advanced materials for aerospace, high performance automotive, launch vehicles
and other extreme-demand environments. It produces carbon fibers, advanced composites and
aerospace adhesives and high performance industrial materials.
The Company operates in the Americas, Asia Pacific, Europe, Middle East, and Africa.
Table below represents Sensient‟s main competitors.
Management performance
The CYT‟s main management consists of CEO and CFO. After studying key executives
biographies, as provided by GlobalData services, we concluded that management is relatively
professional and experienced, as the average age of the team is 53 years and everybody has
around 25+ years of chemical industry experience and stayed with Sensient for more than 10
years. Under current management the Company has undergone significant changes by focusing
on higher-margins segments and divesting non-core businesses, as well as making consistent
investments in R&D, patents and emerging markets. Moreover, the management was able to
sustain significant market downturn of FY2008-2009 and direct a company to a profitable path
staring FY2010. Form a profitability standpoint, management performance was fair, as,
basically, main profitability ratios were increasing consistently except for FY 2008. However,
the Company had negative profitability in FY2008 and 2009 and unstable dividends.
CYT: Key Competitors
Name Headquarters FY 2011 Revenue, mln USD
Arch Chemicals USA 1,377
H. B. Fuller USA 1,558
Momentive Specialty
Chemicals USA 5,207
PPG Industries USA 14,885
The Lubrizol Corp USA 5,418
Sensient USA 3,073
Source: Global Data

Oleksandr Matviienko, Soufianne Ayoche, Huizhong Li
Materials, 2012
39
Tables below summarize key management performance measures:
On basis of the aforementioned analysis we believe management‟s qualifications and
performance was relatively solid.
Product differentiation and competitive position
The company‟s products are highly diversified both by products offered and geographically.
Thus, we believe, Company‟s strong differentiation backed by the fact that Company‟s
customers represent companies from both cyclical and non-cyclical industries is one of its most
evident strengths.
Speaking about Company‟s competitive position, according to Company‟s documents, CYT has
around 1,800 patents issued in various countries across the world with manufacturing and
research facilities in 16 countries globally. In 2010, the company spent around $72.5m for its
R&D activities. Thus, the Company effectively protects margins by holding various patents and
continuously investing in new technology preserving its competitiveness.
Source: Global Data
Source: Global Data

Oleksandr Matviienko, Soufianne Ayoche, Huizhong Li
Materials, 2012
40
According to Deutsche Bank, CYT has agreed to make an acquisition of Umeco, a UK based
advanced composites manufacturer, which will be accretive and secure the access of Cytec to
perspective auto composite market. The composite market is believed to be highly attractive as it
provides necessary materials to make cars lighter. The weight of the car recently became
extremely important, thus, Cytec believes that with Umeco's application expertise and strong
relationships with auto companies, coupled with its leading composites technology, it will be
well positioned to capitalize on this evolving and growing trend.
All-in-all, the Company has a strong product differentiation and solid competitive standing.
SWOT Analysis
The Company has numerous strengths, as well as weaknesses. One of the most important
strengths is the Company‟s diversification strategy. A great level of product differentiation is
reflected in four distinct segments the company operates in. These segments supply products to
various industries described above. Thus, company effectively protects itself from various
industries‟ risks as well as general
economic risks as its consumers
represent companies from different
cyclical and non-cyclical industries.
Moreover, company‟s overall
diversification is buttressed by its
presence in various geographic
regions. It operates in a majority of
countries in Americas, Europe, Asia,
Middle East, and Africa where the
Company runs plants, R&D
laboratories, and distribution and
marketing facilities. Moreover, apart
from other US chemical companies,
CYT does not derive the majority of
its revenue from North-American market. Thus, the Company defends itself from any
unanticipated business interruptions, or economic meltdown from being geographically and
product-diversified. Company‟s also protects itself by constantly investing in new technology
and protecting it by patents. Such investments were possible due to the Company‟s sound
fundamental position. Our quantitative F-sort showed CYT to be one of the financially
strongest companies. Also, its debt ratios have been consistently falling for last 3 years, as well
as liquidity ratios consistently rising for last 2 years.
Speaking about CYT‟s weaknesses it is worth mentioning some legal proceedings and other
claims the Company is subject to as part of its ongoing operations. According to Global Data, the
Company has substantial environmental liabilities, which include obligations to remove or limit
the environmental effects caused by release of wastes at various sites now or formerly owned by
Cytec or to pay compensation to the affected parties. It is also involved in the cleanup of various
other sites. Besides, Cytec is involved in numerous other lawsuits and claims related to product
liability, personal injury including asbestos, environmental, contractual, employment and
intellectual property matters. Such proceedings may potentially result in substantial losses, as
well as divert management‟s attention and efforts from the Company‟s operations and strategy.
CYT: SWOT Analysis
Strenghts Weaknesses
Product and geographical Legal proceedings
diversification Dependence on few
Technological expertise suppliers
Solid financial position
Opportunities Threats
Umeco acquisition Environmental regulations
Emerging markets growth Raw materials supply risk
New product launchesSource: Team

Oleksandr Matviienko, Soufianne Ayoche, Huizhong Li
Materials, 2012
41
Other substantial weakness is the dependence on few suppliers, specifically, of carbon fibers.
The delay or loss of a supplier would negatively affect Company‟s operations.
The Company has significant opportunities, as well as threats. We believe Cytec‟s substantial
presence in emerging markets of Eastern Europe, Middle East, Africa, South and Central
America and Asia is a great opportunity for growth and expansion. Various experts forecast that
emerging economies‟ growth rates, particularly in chemical industry, will significantly
outperform developed ones. According to Global Data, the chemical industry in the emerging
nations is expected to grow 7.6% in 2011 and 2012. Moreover, the demand for main Company‟s
products is growing more rapidly in emerging countries. Therefore, the Company would benefit
by increasing its operations in emerging markets.
Also, as noted above, the Company‟s acquisition of Umeco would position CYT to take an
advantage of rapidly growing auto composite market.
Successful new product launches help the Company to sustain its competitive position as well
as grow its top and bottom lines. More specifically, according to Global Data, to name few,
Cytec launched its latest ACORGA OR15 extractants and ACORGA OR25 extractants in May
2011. It introduced EBECRYL 8100, a newly developed urethane acrylate for consumer
electronics and a new product, CYASORB CYNERGY SOLUTIONS V703 stabilizer in April
2011. The Company launched EBECRYL 570, a chlorine-free diluted polyester oligomer in
March, 2011. In February 2011, the Company introduced RESYDROL AY6150 low VOC
(volatile organic compound) one-component core-shell alkyd emulsion and two new CYASORB
CYNERGY SOLUTIONS stabilizers for plastics applications. Cytec also formulated the new
generation of RESYDROL AY6705 waterborne acrylic modified alkyd resin in February 2011.
In January 2011, the Company launched EBECRYL 4858, aliphatic urethane acrylate for UV/EB
cured films and plastics. If the Company continues to introduce new successful products it will
remain profitable and competitive.
Speaking about Company‟s threats, we believe the most important is stringent government
regulations, especially in Europe. There are a lot of different standards, compliance procedures,
laws, regulations imposed by various regulations agencies, governments and professional boards.
The Chemical industry analysis contains the most important US governmental regulations. These
laws are highly complex and require significant investments in adequate compliance and quality
controls systems. The failure to comply with any of the aforementioned regulations may result in
huge fines and penalties, the loss of reputation, products recall, market share loss, and damage to
reputation. Also, main raw materials supply risks, such as carbon fiber, natural gas, methanol
derivatives, could adversely affect Company‟s margins, as such materials are irreplaceable in the
Company‟s productions cycle and scarce in nature. The prices of such products have been rising
in recent past negatively affecting Company‟s margins. However, relatively rigid competition
prevents CYT from increasing prices of end-products to compensate for increase in raw
materials prices.
Analysts’ and investors’ sentiment
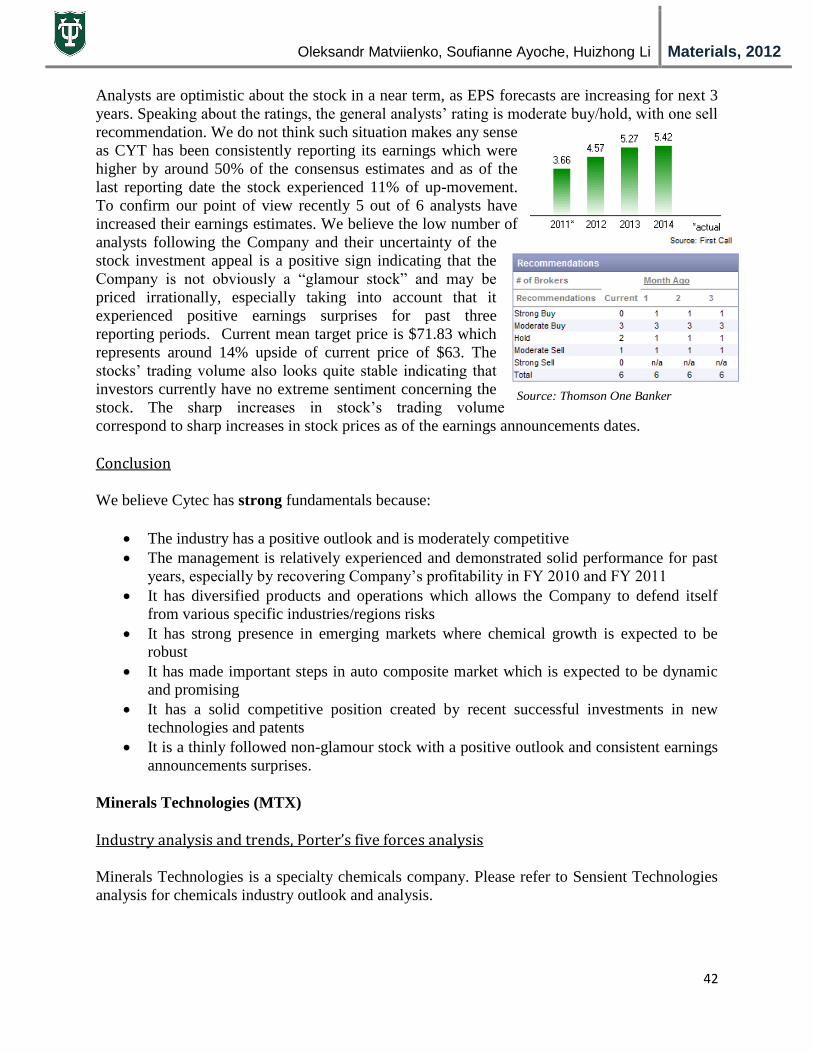
Oleksandr Matviienko, Soufianne Ayoche, Huizhong Li
Materials, 2012
42
Source: Thomson One Banker
Analysts are optimistic about the stock in a near term, as EPS forecasts are increasing for next 3
years. Speaking about the ratings, the general analysts‟ rating is moderate buy/hold, with one sell
recommendation. We do not think such situation makes any sense
as CYT has been consistently reporting its earnings which were
higher by around 50% of the consensus estimates and as of the
last reporting date the stock experienced 11% of up-movement.
To confirm our point of view recently 5 out of 6 analysts have
increased their earnings estimates. We believe the low number of
analysts following the Company and their uncertainty of the
stock investment appeal is a positive sign indicating that the
Company is not obviously a “glamour stock” and may be
priced irrationally, especially taking into account that it
experienced positive earnings surprises for past three
reporting periods. Current mean target price is $71.83 which
represents around 14% upside of current price of $63. The
stocks‟ trading volume also looks quite stable indicating that
investors currently have no extreme sentiment concerning the
stock. The sharp increases in stock‟s trading volume
correspond to sharp increases in stock prices as of the earnings announcements dates.
Conclusion
We believe Cytec has strong fundamentals because:
The industry has a positive outlook and is moderately competitive
The management is relatively experienced and demonstrated solid performance for past
years, especially by recovering Company‟s profitability in FY 2010 and FY 2011
It has diversified products and operations which allows the Company to defend itself
from various specific industries/regions risks
It has strong presence in emerging markets where chemical growth is expected to be
robust
It has made important steps in auto composite market which is expected to be dynamic
and promising
It has a solid competitive position created by recent successful investments in new
technologies and patents
It is a thinly followed non-glamour stock with a positive outlook and consistent earnings
announcements surprises.
Minerals Technologies (MTX)
Industry analysis and trends, Porter’s five forces analysis
Minerals Technologies is a specialty chemicals company. Please refer to Sensient Technologies
analysis for chemicals industry outlook and analysis.

Oleksandr Matviienko, Soufianne Ayoche, Huizhong Li
Materials, 2012
43
Company overview
Minerals Technologies Inc. (MTX) is a resource and technology based company in United States
that engages in developing, producing, and marketing a wide range of specialty mineral, mineral-
based, and synthetic mineral products and supporting systems and services. According to Global
Data, MTX manufactures and sells synthetic mineral products for the paper, building materials,
paint and coatings, glass, ceramic, polymer, food, automotive, and pharmaceutical industries. It
operates in two segments, Specialty Minerals and Refractories. The Specialty Minerals segment
produces and sells precipitated calcium carbonate, a synthetic mineral product; and quicklime, a
processed mineral product. It also mines mineral ores; and processes and sells natural mineral
products, primarily limestone and talc. The Refractories segment produces and markets
monolithic and shaped refractory materials and specialty products, services, and application and
measurement equipment; and calcium metal and metallurgical wire products. Minerals
Technologies Inc. was founded in 1968 and is headquartered in New York, New York. MTX
relies principally on its worldwide direct sales force to market its products. The Company
oversees domestic marketing and sales activities from Bethlehem, Pennsylvania, and from
regional sales offices in the eastern and western United States. The Company's international
marketing and sales efforts are directed from regional centers located in Brussels, Belgium; Sao
Jose Dos Campos, Brazil; and Shanghai, China.
Table below represents MTX‟s main competitors.
Management performance
Through a careful study of MTX‟s management, as shown by GlobalData services, we have a
relatively positive opinion on MTX‟s management. The average age of the management team is
53 years. However, none of the senior management members has stayed in MTX for a long time.
Under current management ROE, ROIC, EPS ratios are not very stable. MTX suffered a
significant loss in 2007 and 2009, which is due to the acquisition with Phoenix Pulp & Paper
Public in 2007 and the economic recession in 2009, respectively. Nevertheless, in most recent
two years, MTX has demonstrated a very good performance. From a profitability standpoint,
management performs well in 2010 and 2011. However, the company didn‟t increase dividends
from 2007 to 2011. According to SADIF, MTX rank sixth among competitors for the
management efficiency rating, according to following key indicators: return on assets, earnings
per employee and the earnings growth rate. As the figure shown below:
MTX: Key Competitors
Name Headquarters FY 2011 Revenue, mln USD
Didier-Werke AG Germany 943
DONGKUK REFRACTORIES
& STEEL CO., LTD
Republic of
KoreaN/A
Nippon Crucible Co., Ltd Japan 75
Rath Aktiengesellschaft Austria 111
Yotai Refractories Co., Ltd Japan N/A
Minerals Technologies USA 1,045
Source: Global Data

Oleksandr Matviienko, Soufianne Ayoche, Huizhong Li
Materials, 2012
44
Source: SADIF
Tables below summarize key management performance measures:
On basis of the aforementioned analysis we believe management‟s qualifications and
performance was medium.
Product differentiation and competitive position
MTX‟s products are highly diversified as portfolio including synthetic mineral product
precipitated calcium carbonate, quicklime, limestone, talc, mineral ores and a range of dry PCC
products. In addition, according to Global Data, the Company also provides monolithic and
shaped refractory materials specialty products, application equipment and related supporting
systems and services. These products can be used in a wide range of industries, such as paint and
coatings, paper, building materials, glass, polymer, ceramic, food, pharmaceutical, and
automotive industries. MTX also has wide domestic and global markets, just as we have
mentioned in company overview part. In addition, MTX pay great attention to research and
development. Over the past recent years, MTX is continually engaged in efforts to develop new
products and technologies and refine existing products and technologies in order to remain
competitive and to position itself as a market leader. According to company‟s document, MTX's
research and development capability for developing and introducing technologically advanced
new products has enabled the Company to anticipate and satisfy changing customer
requirements, creating market opportunities through new product development and product
application innovations. A diversified product portfolio that caters to a range of industries and
research and development focus provide a competitive edge for the company. However, ending
the year with $414 million in cash on hand, having generated only $82 million in free cash flow,
Source: Global Data

Oleksandr Matviienko, Soufianne Ayoche, Huizhong Li
Materials, 2012
45
and having Net Debt-to-EBITDA ratio of -2.0x, MTX, in our view, is not strong enough to play
a market leader role. All-in-all, the Company has a strong product differentiation, positive
competitive standing, and medium financial position.
SWOT Analysis
The company has obvious strengths and weaknesses. One of the most important strengths is the
Company‟s diversification strategy. As we have written before, the Company operates in two
segments, Specialty Minerals (53.7% of revenue in 2011) and Refractories (35.3% of revenue in
2011). The Specialty Minerals
segment‟s products are primarily used
in the paper, building materials, paint
and coatings, glass, ceramic, polymer,
food, automotive, and pharmaceutical
industries. The Refractories
segment‟s products are primarily used
in high-temperature applications in
the steel, non-ferrous metal, and glass
industries. Obviously, the Company‟s
two segments supply products to
various industries described above.
Thus, MTX can relatively effectively
MTXigate various business risks. However, since the principal market for the Company's
refractory products is the steel industry, which is a cyclical in nature, some threats to the
Company‟s stability exist.. In addition, the Company‟s operates domestically and globally. The
Company‟s domestic markets are located in Bethlehem, Pennsylvania, and in some regional sales
offices in the eastern and western United States. The Company has markets in Europe, like
Belgium, South America, like Brazil and Asia, like China. According to the Company‟s
documents, MTX relies principally on its direct sales force in global market. The technical
service teams that are familiar with the industries to which the Company markets its products
add more efficiency to its direct sales force. The Company considers continuing international
expansion in a majority of countries in Americas, Europe and Asia.
Moreover, according to Global Data, the Company has maintained strong Research &
Development focus over the years. Many of MTX‟s product lines are technologically advanced.
This has enabled the Company to maintain expertise in the fields of inorganic chemistry,
crystallography and structural analysis, fine particle technology and other aspects of materials
science. MTX‟s growth in sales is largely due to its continued success of its research and
development activities. The R&D efforts have resulted in numerous patents and trademarks. For
the years ended December 31, 2011, 2010 and 2009, the Company spent approximately $19.3
million, $19.6 million and $19.9 million, respectively, on research and development. The
Company's research and development spending for 2011, 2010 and 2009 was approximately 1.9
%, 2.0% and 2.2% of net sales, respectively. Even in the weak economic conditions, the
company has still invested a considerable amount of its revenues in Research and Development.
According to the Company‟s document, The Company will continuously reformulate its
refractory materials to be more competitive.
MTX: SWOT Analysis
Strenghts Weaknesses
Diversification Legal proceedings
Large R&D investments
Strong financial performance
Opportunities Threats
New technologies introduced Industry cycle
Growng demand in India Fierce competition
Change in labor laws
Source: Team

Oleksandr Matviienko, Soufianne Ayoche, Huizhong Li
Materials, 2012
46
MTX reported good financial performance for the fiscal year ended December 2011 following
another well-performed year 2010, reflecting its ability to fulfill operational and business
expansion needs. MTX has a relatively strong balance sheet and is diligent in reducing costs and
increasing capital returns. The Company posted operating margin of 9.6% and 9.8% in 2011 and
2010, respectively, against operating margin of -1.88% in 2009. The company recorded net profit
of $67.5m and $66.9m in 2011 and 2010, respectively, against a net loss of $23.80m in 2009.
The two years‟ increase in the operating and net profit improved the company‟s profitability. The
company‟s return on equity increased to 9.10% in 2011 from 8.85% in 2010, a remarkable
increase from -3.29% in 2009. Substantial increase in profitability ratios in 2011 and 2010
indicates that the Company had a good performance.
In terms of MTX‟s weaknesses, just as most of the companies in materials industry, MTX has
also faced several litigation cases. According to the Company‟s document, The Company
currently has 77 pending silica cases and 27 pending asbestos cases. To date, 1,389 silica cases
and 8 asbestos cases have been dismissed. One new silica case and one new asbestos case were
filed in the fourth quarter of 2011. The aggregate cost to the Company for the legal defense of
these cases since inception was approximately $0.2 million, according to Company‟s documents.
The Company has significant opportunities, as well as threats. As we mentioned above, MTX
has robust research and development capabilities, which enabled it to develop new technological
edge. In August 2011, the Company launched a new product line of engineered mineral
additives for reinforcement in bioplastic applications, which designed for bioplastic-based
consumer disposables including packaging, food and beverage gift cards, service ware, signage,
films and bags. This new technology enables the Company to exploit the great opportunity in
biopolymer market. Due to the growing concern for environment, consumers are looking for
„green‟ products, leading to the expectation of the improvement of the biopolymers market in the
US. Biopolymers could account between 5%-10 % of the total plastics market in Europe,
according to European Bioplastics‟ estimates. MTX could increase its presence and cater to these
potential markets. From historical data, we can predict that the new technologies introduced by
the company could lead to increase in market share and revenue in the future.
MTX intends to capture the great India opportunity and capitalize on the emerging
opportunities in the Indian infrastructure, which are being driven by the current and expected
demand and supply imbalance in India. According to the Company‟s document, the company‟s
projects are positioned to benefit under the SEZ Project policy of the government of India.
Already in February 2011, MTX's wholly owned subsidiary, Specialty Minerals Inc., entered
into an agreement with JK Paper LiMTXed for constructing a satellite precipitated calcium
carbonate (PCC) facility in Rayagada, Orissa, India. In January 2011, the company signed a
similar agreement with The West Coast Paper Mills LiMTXed for Dandeli, India. And In July
2010, the company had signed a similar contract with Ballarpur Industries LiMTXed. The
infrastructure sector in India is growing at a faster rate and is given importance to support the
growth rate and to fulfill the existing gap.
Speaking about Company‟s threats, we believe the most important is Cyclical Nature of
Businesses. As we mentioned above, the principal market for the Company's refractory products
is the steel industry. MTX‟s majority of the sales come from industries like steel, construction
and paper which are very cyclical industries. The macroeconomic performance has a very close
relationship with the performance of these industries. A robust growth in GDP will have a

Oleksandr Matviienko, Soufianne Ayoche, Huizhong Li
Materials, 2012
47
positive influence on performance for these sectors, which leading to much demand for products
whereas a downturn could negatively impact the businesses. If the steel, construction and
automotive industries slump, MTX has to reduce workforce and production..
MTX has many strong competitors, such as Nippon Crucible, Didier-Werke AG, Yotai
Refractories Co., Ltd. Rath Aktiengesellschaft and Dongkuk Refractories & Steel. As a result of
the competitive environment in the markets in which MTX operate, the Company currently faces
and will continue to face price pressures from competitors.
The changing labor laws in MTX‟s global marketplace, like Europe, Middle East and Africa,
may have negative effect. Currently, the Company has about 2,132 employees across the world.
For example, the minimum wage rate was increased from $7.25 per hour in 2009 to $8.5 an hour
in January 2011 by the US government. Higher employee base, increasing costs of labor and new
or revised labor laws, rules or regulations could adversely affect the company‟s profitability.
Analysts’ and investors’ sentiment
The market sentiment in relation to MTX is positive and improving. Currently, MTX‟s EPS is
3.75. According to Standard & Poor, MTX‟s EPS will increase to 4.04 in 2012. In terms of the
ratings, the general rating is buy or buy/hold. For past three months this stock was a consistent
“buy”. MTX‟s current price is $64.77; the 12 months target price given by Standard & Poor is
$75, a 15.8% increase. The stocks‟ trading volume also looks quite stable in past six months
indicating that investors currently have no extreme sentiment concerning the stock.
Source: Thompson One Banker
Conclusion
We believe MTX has moderate-to-strong fundamentals because:
The specialty chemical industry has a positive outlook and is moderately competitive
It has diversified products and operations which allows the Company to defend itself
from various specific industries/regions risks
It has robust research and development initials which can help MTX maintain expertise
in its industry and create more revenues
Recent unstable financial performance, which stabilized only in past two years, medium
current financial position
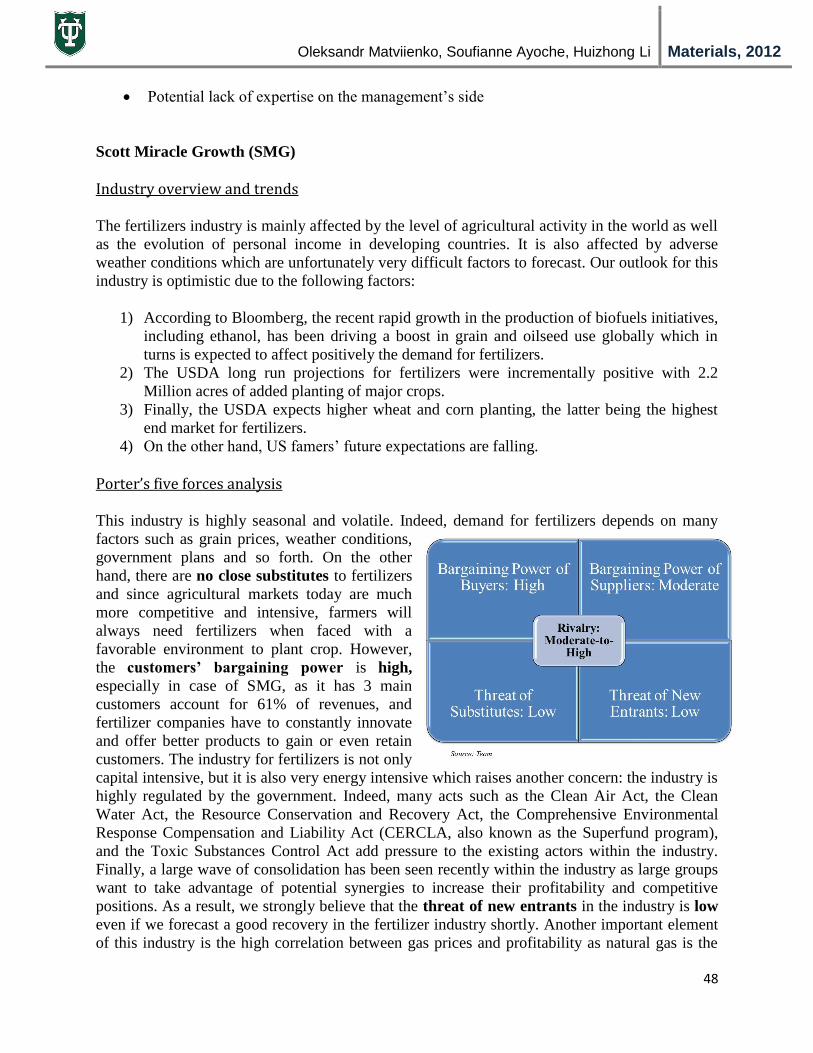
Oleksandr Matviienko, Soufianne Ayoche, Huizhong Li
Materials, 2012
48
Potential lack of expertise on the management‟s side
Scott Miracle Growth (SMG)
Industry overview and trends
The fertilizers industry is mainly affected by the level of agricultural activity in the world as well
as the evolution of personal income in developing countries. It is also affected by adverse
weather conditions which are unfortunately very difficult factors to forecast. Our outlook for this
industry is optimistic due to the following factors:
1) According to Bloomberg, the recent rapid growth in the production of biofuels initiatives,
including ethanol, has been driving a boost in grain and oilseed use globally which in
turns is expected to affect positively the demand for fertilizers.
2) The USDA long run projections for fertilizers were incrementally positive with 2.2
Million acres of added planting of major crops.
3) Finally, the USDA expects higher wheat and corn planting, the latter being the highest
end market for fertilizers.
4) On the other hand, US famers‟ future expectations are falling.
Porter’s five forces analysis
This industry is highly seasonal and volatile. Indeed, demand for fertilizers depends on many
factors such as grain prices, weather conditions,
government plans and so forth. On the other
hand, there are no close substitutes to fertilizers
and since agricultural markets today are much
more competitive and intensive, farmers will
always need fertilizers when faced with a
favorable environment to plant crop. However,
the customers’ bargaining power is high,
especially in case of SMG, as it has 3 main
customers account for 61% of revenues, and
fertilizer companies have to constantly innovate
and offer better products to gain or even retain
customers. The industry for fertilizers is not only
capital intensive, but it is also very energy intensive which raises another concern: the industry is
highly regulated by the government. Indeed, many acts such as the Clean Air Act, the Clean
Water Act, the Resource Conservation and Recovery Act, the Comprehensive Environmental
Response Compensation and Liability Act (CERCLA, also known as the Superfund program),
and the Toxic Substances Control Act add pressure to the existing actors within the industry.
Finally, a large wave of consolidation has been seen recently within the industry as large groups
want to take advantage of potential synergies to increase their profitability and competitive
positions. As a result, we strongly believe that the threat of new entrants in the industry is low
even if we forecast a good recovery in the fertilizer industry shortly. Another important element
of this industry is the high correlation between gas prices and profitability as natural gas is the

Oleksandr Matviienko, Soufianne Ayoche, Huizhong Li
Materials, 2012
49
main raw material for fertilizers development. Indeed, fertilizers are made from nutrients such as
phosphorus, nitrogen or potassium, but they need natural gas regardless of the nutrient to create
fertilizers. Thus, it is essential to analyze the natural gas market to assess the level of bargaining
power of suppliers. Since, natural gas trade on international markets and its price is subject to
wide fluctuation due to supply and demand, we believe that supplier have some power over its
prices; thus the bargaining power of suppliers is moderate. Finally, given all the elements we
have been documenting in this part, we believe that the rivalry among competitors is
moderate-to-high as consumers have substantial bargaining power, and the industry is cyclical,
volatile and subject to large consolidations.
Company overview
The Scotts Miracle-Gro Co. (SMG) is among the oldest marketers and manufacturers of products
used to grow and maintain lawns, gardens and golf courses. Its revenues are distributed as
follows:
As we have seen before, demand for fertilizers is pretty seasonal and depend on many factors. As
a result, the bulk of SMG sales occurs in the second and third quarter in any fiscal year. SMG
have two main segment. The first one, Global Consumer segment, is pretty diversified in terms
of product line. Some of its products are Turf Builder, Miracle-Gro, Ortho, Growing Media,
Roundup, and Morning Song wild bird food. The second segment Scotts LawnService, provides
residential lawn care and limited external pest control services in the U.S., consisting of
fertilizer, weed control and disease control applications.
Now, let‟s talk about the company corporate strategies. Overall, Management plans to continue
to invest in consumer marketing, technology and innovation, while focusing on supply chain cost
savings, free cash generation, return on invested capital (ROIC), and investing in Europe,
especially in the United Kingdom. According to S&P analysts, SMG has introduced a new
product in 2010, E-Z seeds, in the US and UK and was its most successful product with very
high operating margins. Analysts are pretty optimistic regarding SMG ability to continue
increasing its margins with this product. Moreover, the recent government and global concerns
concerning organic versus chemical fertilizers has triggered SMG attention. As a result SMG
plans to have 50% of its products natural in the future. Finally, SMG is forecasting new
82%
18%
Geographical revenues
North America International Home Depot 30%
Lowe's 18%
Wal-Mart 13%
Others 39%
Revenues by custmomers
Source: Global Data

Oleksandr Matviienko, Soufianne Ayoche, Huizhong Li
Materials, 2012
50
innovative product launches during FY 2012, including Scott's SNAP, a line of lawn fertilizer,
grass seed, insect killer and weed & feed.
Management performance
Scott Miracle Grow top management consists mainly of CEO and CFO. The average age of the
top management team is 52 years old. Moreover, by looking up at the top management
biographies, we found out that all of them have solid experiences in their fields. To assess
whether the top management of SMG is efficient or not we have chosen to look over selected
financial data. Here are the two graphs we have considered.
As you can see, here the return on equity has consistently increased from 2008 to now which
signal solid management performances. On the other hand, the ROIC has decreased again in
2011 but seems to follow a path centered near 15% yearly on average which is good compared to
competitors. Additionally, the EPS have seen an overall increasing trend exept in 2011. Overall,
such stattistic show a solid top management team. Moreover, we have found out that the CEO of
the company, James Hagedorn, was planning to retire in 2011 but has annouced in 2010 that he
will stay longer. This represents good news for us at the light of the financial perormances of the
company. Moreover, given that M. Hagedorn has 31% of common stocks, we have no doubt
concerning his commitment to SMG success.
Product differentiation and competitive position
As we have seen in the company overview section, SMG occupies a strong competitive poisition
in its industry due to its ability to constantly innovate and reach the market on time. Its new
product, E-Z seeds, have also fabulous success and have very high operating margins. Moreover,
the fact that the company has two divisions with many product lines adds up to its competitivity.
SWOT Analysis
We will conduct this SWOT analysis following the order implied by its name.
23.66
-2.5
26.23 26.7 29.99
16.39
9.46
17.8
25.44
15.6
-5
0
5
10
15
20
25
30
35
2007 2008 2009 2010 2011
ROE
ROIC
1.69 0.51 2.01
2.97
1.84
8.5
0.5 0.5 0.63 1.05
0
2
4
6
8
10
2007 2008 2009 2010 2011
EPS
Dividend pershare
Source: Global Data

Oleksandr Matviienko, Soufianne Ayoche, Huizhong Li
Materials, 2012
51
SMG: SWOT Analysis
Strenghts Weaknesses
Strong management High customer concentration
Product differentiation High dependence on suppliers
Steady financial performance Legal proceedings
Opportunities Threats
Low-cost supply chain model Stringent environmental
Further expansion in the USA regulations
Recent decline in natural gas Intensified competition
prices
Source: Team
We believe that SMG has many strenghts it can capitalize upon. First, it has a strong
management team whose records have been very decent over the last 5 years especially in the
context of a shrinking industry during this time period. Morever, SMG possesses strong
innovative capabilities, and product differention with high operating margins, occupying, thus,
a strong competitive position within its industry. Additionally, steady financial performance
allows the company to pursue its growth plans and maintain its strong market position.
One of the major weaknesses of SMG is
that the company has 61% of its revenue
depending on three main customers.
The potential drawbacks are huge and
SMG should diversify its distribution
policy since there is a high risk
associated with such a configuration.
Moreover, the company depends on
many third party manufacturers. This
dependence could result in various risks
such as decreased control over the
production process leading to production
delays or interruptions and inferior
product quality control. Finally, SMG
has some pending legal proceedings. It is easily perceivable that such legal problems can cause
a financial burden on the company. The main reason behind those legal problems concern one of
the company‟s products that contain a substance that have been identified as dangerous by some
customers. Clearly, SMG should deal with this situation.
We believe SMG faces many opportunities worth of mentioning. First, SMG strengthens its
existing businesses with diverse strategic initiatives. One of them concerns its regional supply
chain management model. This model increase cost savings for the company. The
opportunities here are that the companies can now exports this efficient model to other regions of
the world increasing thus cost saving activities and making the company more profitable in the
future. The second opportunity SMG face concerns its expansion activities. The company
expanded its presence in Ohio with the addition of new facilities in September 2009. It also
purchased new production facilities and opened regional sales and marketing offices in the
Northeast and the Midwest of the US in first half of 2009. The point here is that all these new
facilities and expansions are expected to provide significant opportunities for the Company to
enhance its services and revenue. Finally, a last opportunity concerns the recent decline in
natural gas prices which has now reach new historical lows. Such trends have significantly
decreased fertilizer companies‟ raw materials costs and will continue to do so until natural gas
reverse its declining trend.
The threats for SMG are mainly linked to stringent environmental regulations which can have
negative impacts on the Company‟s processes and profitability. Another important threat comes
from the intensified competition within the industry. As a result, SMG need to constantly
innovate and differentiate successfully its products in order to survive.

Oleksandr Matviienko, Soufianne Ayoche, Huizhong Li
Materials, 2012
52
Source: Thomson One Banker
Analysts’ and investors’ sentiment
Source: Thompson One Banker
As you can see from the graph and table, analysts seem to share our opinion on the stock and
forecast a growth in EPS at a compounded annual growth rate of 11.37% annually. On the other
hand, analysts do not see the stock as a strong buy and value it more like a hold stock as seen by
the following chart, and consider it overpriced.
This consensus nevertheless also reflects the group overall
consensus as the industry is pretty competitive and that even if
SMG is doing right at this time and have huge potential in the
future, risks of better innovation and differentiation for
competitors can yield substantial risks. At the end, it all comes
down at whether you believe in the human assets of the
company.
Conclusion
We believe Scott Miracle Grow has moderate-to-strong fundamentals:
The industry is moderately-to-high competitive
Sound track records in innovation and differentiation
Solid financial performances
The Company has cyclical nature of business
It depends on few customers and critically on natural gas supply.
Domtar Corporation (UFS)
Industry analysis and trends
Domtar Corporation competes in the paper products industry. This industry is sensitive to the
level of interest rates in the economy as well as the overall GDP outlook. Moreover, the paper
products industry is also very sensitive to operating rates as they affect the profitability of the
companies and show the overall health of the industry. After analyzing the industry trends, we

Oleksandr Matviienko, Soufianne Ayoche, Huizhong Li
Materials, 2012
53
have come up with a slightly positive outlook for this industry over the next year for the
following reasons:
1) US Real GDP growth rate is expected to be 1.8% in 2012 and accelerate to 2.3% by
2015, as well as global Real GDP growth rate is expected to be 3.1% in 2012 and reach
4.3% by 2015.
2) According to S&P, supply is being controlled which is a good indicator of the industry
capacity to react to its environment.
3) New opportunities may arise since cellulosic ethanol by contrast to traditional ethanol
may be used for biofuel energy, adding thus a market for this industry.
4) On the other hand, the demand for many grades of paper is expected to fall during the
next years. Such grades include demand for printing and writing papers.
Porter’s five forces analysis
The industry produces different grades and types of papers, some of which have strong
substitutes (electronic reading) and some of which don‟t have such close substitutes (paper
products used for packaging activities). Moreover, paper products are more or less standardized,
thus, companies mostly compete on prices. As a result, we believe that the customers’
bargaining power is high and the threat of
substitutes is medium. Moreover, since the
raw material needed in this industry (mainly
pulp) is traded on international market and
fluctuate based on the laws of demand and
supply, the paper companies have less
bargaining power in price negotiations with
suppliers. Therefore, we believe that the
bargaining power of suppliers is moderate
given those circumstances. Finally, given the
fact that this industry is the relatively capital
intensive, according to the USDA, and that
the bulk of the production is held by the
largest players, the threat of new entrants
is low. Moreover, although the companies have achieved higher degrees of efficiency (as seen by
higher operating rates) these years through better production processes (which may attract new
entrants), such economies of scale are tough to replicate. This result is further accentuated by the
fact that in recent years we can observe an increase in mergers and acquisitions activity within
the industry which now seem to give even more power to the biggest actors. As a result, we
believe that the rivalry among competitors is moderate-to-high and we expect it to increase in
the longer run due to the observed oligopolistic trend.
Company overview
Domtar Corporation was formed on August 16, 2006, for the purpose of combining the fine
paper assets of Weyerhaeuser with those of Domtar Inc. That transaction was completed on
March 7, 2007. The company is now the largest integrated manufacturer of uncoated free sheet
paper in North America and the second largest in the world, based on production capacity. The
company also makes papergrade, fluff, and specialty pulp. In 2011, 85% of the company's

Oleksandr Matviienko, Soufianne Ayoche, Huizhong Li
Materials, 2012
54
revenues were generated from the sale of pulp and paper, 14% came from paper distribution, and
1% was from the sale of personal care products (a business it purchased in 2011). The products
that Domtar manufacture are used for three main market: businesses (46% of shipments),
commercial printing and publication (27%), and converting and specialty applications (27%).
The corporate goals of Domtar are pretty interesting. The company strives to be recognized as
the supplier of choice of branded and customer-branded pulp and paper products in North
America and to be recognized as leaders in sustainability and the manufacture of fiber-based
products. The strategies Domtar has chosen to pursue in order to achieve those objectives are
pretty straightforward: build customers loyalty and balance production with demand (by
adopting processes like just-in-time). On the front of their objectives regarding their willingness
to be recognized as leaders in sustainability and the manufacture of fiber-based products, Domtar
has pursed another strategy: it has developed EarthChoice, a line of environmentally and socially
responsible papers. The EarthChoice line is supported by leading environmental groups such as
the Forest Stewardship Council (FSC) from which it has managed a proper certification.
Management performance
Domtar top management consists mainly of CEO and CFO. We studied and analyzed the data
about the current management team of the company and we found out that the average age of a
top executive in the company is 58 years old. Moreover, upon looking at the top executives
biography, we found out that almost all of them have solid experience in their expertise that
profits the Company on many sides such as marketing, finance and, of course, operations. We
also analyzed some data concerning the ratios that we judge necessary to help us evaluate how
efficient the management team is. Graphs below illustrate those metrics of interest.
Source: Global Data
As you can see from those two graphs, the top management has relatively successfully managed
to redress the situation after the huge negative impact 2008 crisis had on the industry. If we take
a look at further data on Global Data, Domtar has managed to do better that the majority of its
competitors during those tough times, which for us clearly indicate a good management team on
the company side. However, some of the indicators continued to be unstable after 2008 crisis.
2.19
-26.74
11.65
18.89
12.28 3.94
-8
10.65
10.71 11.49
-30
-20
-10
0
10
20
30
2007 2008 2009 2010 2011
ROE
ROIC 1.76
-13.33
7.18
14 9.08
-20
-10
0
10
20
2007 2008 2009 2010 2011
EPS
EPS

Oleksandr Matviienko, Soufianne Ayoche, Huizhong Li
Materials, 2012
55
UFS: SWOT Analysis
Strenghts Weaknesses
Leading role in industry High customer concentration
Great brand loyalty Legal proceedings
Develops efficient operations
Opportunities Threats
M&A activity Stringent environmental
Increased demand for some regulations
of the Company's products Dependence on third-party
Increased control of supply transportation
Growth in e-readers and
e-communications
Source: Team
Product differentiation and competitive position
As we have seen in the paragraph dealing with the company‟s overview, Domtar possesses a
strong diversity of products for diverse markets. Indeed, they produce uncoated freesheet papers
as well as papergrade, fluff and specialty pulp. They are also involved in personal care products
as they acquired a company operating in this industry. Moreover, as part of their corporate goals
and strategy that we have described in details in the previous parts, the company strives to
maintain a very competitive position within the industry by encouraging brand loyalty. Indeed,
they make up to 9 different types of paper products and 14 different types of pulp products
regrouped into 7 different brands, one being marketed as type of paper produced in a socially and
responsible way (EarthChoice). Finally, the Company strives to develop processes that match
production to customers‟ demand which can only make the production processes of the
Company even better in the long run and increase their operating efficiency.
SWOT Analysis
We will conduct this SWOT analysis following the order implied by its name.
We believe that Domtar possesses much important strength that make the Company an important
actor in its industry. First, it is largest integrated manufacturer and marketer of uncoated
freesheet paper in North America. Moreover, Domtar is the second largest manufacturer of
paper, based on the production
capacity. Additionally, as we stated
before, Domtar has a great brand
loyalty for its seven brands and is also
considered as a company that acts in a
socially and environmentally
responsible manner as shown by its
FSC certification. The Company also
strives for developing more and more
efficient processes that matches
production and customers‟ demand
which in turns increase their
profitability and shareholder value as
shown by the few financial metrics we
have used to evaluate the management
of Domtar Corporation.
One of the main weaknesses of the
Company lies in the way it manages its
working capital. According to graph
below, the problem lies in the fact that the
current ratio of the company has recently
seen a decrease despite higher levels of
receivables. This can put additional burden
on the financial soundness of Domtar
Corporation if such phenomena continue
Source: Global Data

Oleksandr Matviienko, Soufianne Ayoche, Huizhong Li
Materials, 2012
56
in the long run. Another weakness of the company concerns its involvement in legal
proceedings. Indeed, Domtar is involved in various disputes regarding contract disputes, patent
infringements, environmental and product warranty claims, and labor issues. Such events can not
only add sunk costs to the Company in case of negative court ruling but it can also affect the
Company‟s reputation and integrity which it strives to maintain. In both case, this element puts a
double negative effect on the company future profitability and this problem should be addressed
promptly.
The first opportunity concerns the recent turns the whole industry has recently underwent.
Indeed, the paper products and packaging industry has recently entered a phase of consolidations
trough a lot of mergers and acquisitions activities. Of course Domtar is also involved in such a
wave as it has acquired Attends Healthcare, which has propelled Domtar as the leading suppliers
of adult incontinence products into North American hospitals (acute care) and nursing homes
(long-term care). Domtar through its cost-efficient production platform utilizing manufacturing
expertise and supply chain management would provide a complete and high-quality line of
branded and unbranded products to customers across all channels. Such strategic acquisitions
would expand its business portfolio thereby enhancing its revenue stream and growth prospects.
The second opportunity is linked to the increased demand for some grades of paper and pulp in
the industry such as the demand for newsprint which is expected to grow. As a result, we expect
the Company to increase sales during the next fiscal year. Another opportunity is linked to the
recent trend in the industry in which supply begins to get more and more controlled increasing
the prices for final outputs. This trend coupled with the fact that Domtar is becoming more
efficient in handling its operations can have huge potential for profits in the future if those trends
persist.
The Company is subject to a wide range of general and industry-specific laws and regulations
relating to the protection of the environment. As a result, this factor adds risk to the Company
profile in cases of unforeseen events that may harm the environment as well as their profits and
reputation. Another threat is linked to the fact that the Company depends on third party
companies for handling all their transportation issues. The risk of course comes from the
possibilities that such third parties may deliver products in a non-timely manner or even fail to
deliver it. Other important threats come from the fact that there is a higher growth in e-readers
nowadays and expanding electronic communication. Both factors are expected to increase with
time and technological advancement which will hurt some grades of paper such as newsprint and
reading and printing papers.
Analysts’ and investors’ sentiment
Source: Thompson One Banker

Oleksandr Matviienko, Soufianne Ayoche, Huizhong Li
Materials, 2012
57
As you can see in the above graphs, analysts are confident about the future growth of earning for
Domtar as shown in the consensus. Indeed, they expect a compounded annual growth for the
company of 11.37% for the following 3 years. However, the general analysts‟ opinion is hold.
Moreover, we can see that it is a substantially followed stock.
Conclusion
We believe Domtar has moderate-to-strong fundamentals because of the following reasons:
The industry has a moderately optimistic outlook and is moderately-to-high competitive
The management team is experienced; however, we could observe some profitability
fluctuations
The Company has diversified products and profits from strong brand loyalty. However,
its geographical diversification is not strong
The Company adopts efficient operations management processes. However, its working
capital management procedures have not been entirely efficient recently
It is a substantially followed stock.
Steel Dynamics (STLD)
Industry analysis and trends
Steel Dynamics Inc. (STLD) is in a Steel sub-industry. As indicated in our Materials industry
analysis we have a slightly positive outlook about this industry outlook:
Positive outlook of U.S. GDP in 2012
Increase in auto sales in 2011
Weak construction markets in the U.S.
All of the aforementioned factors would produce a slightly positive impact on Steel Dynamics
growth and profitability.
Porter’s five forces analysis
The steel industry has moderate
bargaining power of buyers, as steel
industry‟s product differentiation is not as
obvious as the luxury or specialty goods
and thus does not have much substantial
price difference, which will increase buyers‟
bargaining power. However, since demand
still exceeds the supply in domestic steel
industry, buyers‟ bargaining power is
weakened. Thus, it‟s moderate. In addition,
we believe that bargaining power of
suppliers is low since companies in the steel industry are fully integrated. Most of companies

Oleksandr Matviienko, Soufianne Ayoche, Huizhong Li
Materials, 2012
58
have their own mines of key raw material like iron ore or coal. However, those who are non-
integrated or semi integrated has to depend on suppliers. However, in general, bargaining power
of suppliers is low in the steel industry. The threat of substitutes is medium to low. Although
usage of aluminum has been growing continuously in the automobile and consumer durables
sectors, it still does not place any significant threat to steel since steel cannot be replaced
completely and the cost differential is also very high. We believe the threat of new entrants is
moderate for the steel industry due to several reasons. Steel industry is an extreme capital
intensive and economics of scale industry, which make it hard to enter. Meanwhile, the
government has both a favorable policy for steel manufacturers and regulations for the new
entrants. To sum up all the analysis, there is a moderate rivalry among companies in steel
industry. This results in steel companies having moderate control over prices and costs, thus,
relatively stable margins.
Company overview
Steel Dynamics, Inc., (STLD) along with its subsidiaries, engages in the manufacture and sale of
steel products in the United States and internationally. According to Company‟s documents, the
Company operations are managed and reported based on three operating segments: steel
operations, metals recycling and ferrous resources operations, and steel fabrication operations.
The Steel Operations segment provides a range of sheet steel products, including hot rolled, cold
rolled, and coated steel products; structural steel beams, pilings, and rails; special bar quality and
merchant bar quality rounds and round-cornered squares; billets and merchant steel products
comprising angles, plain rounds, flats, and channels; and merchant beams and specialty structural
steel sections. The Metals Recycling and Ferrous Resources Operations segment purchases,
processes, and resells ferrous products, such as heavy melting steel, busheling, bundled scrap,
shredded scrap, steel turnings, and cast iron products; and processes nonferrous products
consisting of aluminum, brass, copper, stainless steel, and other nonferrous metals for use in
foundry, mill refining, and smelting applications. The Steel Fabrication Operations segment
fabricates steel building components, which include steel joists, trusses, girders, and decking
products for the non-residential construction industry. The company was founded in 1993 and is
headquartered in Fort Wayne, Indiana.
It serves wide range of industries, such as automotive, agriculture, energy, construction,
commercial, transportation, industrial machinery and non-residential construction markets.
Table below represents the Company‟s main competitors.

Oleksandr Matviienko, Soufianne Ayoche, Huizhong Li
Materials, 2012
59
Management performance
After studying key executives biographies, as provided by GlobalData services, we concluded
that management is relatively professional and experienced, as the average age of the team is 57
years. All three people in the Executive Board including CEO, Executive Vice President and One
of the Directors stayed with STLD since the Company was founded in 1993, nearly twenty years.
It is absolutely a good sign. From the charts below, we can see that STLD performed well except
2009, largely due to the depressed micro economy that year. In 2010 and 2011, we can see strong
recovery sign of this company. Thus, from a profitability standpoint, management performance
was fair. In addition, the Company pays a stable dividend even in its difficult time. According to
SADIF, STLD has an efficient management.
Source: SADIF
Tables below summarize key management performance measures:
STLD: Key Competitors
Name Headquarters FY 2011 Revenue, mln USD
AK STEEL HOLDING CORPORATION USA 6,468
Allegheny Technologies Incorporated USA 5,183
Ampco-Pittsburgh Corporation USA 345
ArcelorMittal Luxembourg 93,973
ArcelorMittal South Afirca Limited South Africa 4,285
Commercial Metals Company USA 7,918
Cookson Group plc United Kindom 4,348
JSW Steel Limited India 5,264
Nucor Corporation USA 20,024
United States Steel Corporation USA 19,884
Steel Dynamics USA 7,997
Source: Global Data

Oleksandr Matviienko, Soufianne Ayoche, Huizhong Li
Materials, 2012
60
On basis of the aforementioned analysis we believe management‟s qualifications and
performance was relatively strong.
Product differentiation and competitive position
The company‟s products are highly diversified as portfolio; the Company includes hot rolled,
cold rolled, and coated steel products; structural steel beams, pilings, and rails; special bar
quality and merchant bar quality rounds and round-cornered squares; billets and merchant steel
products comprising angles, plain rounds, flats, and channels; and merchant beams and specialty
structural steel sections. heavy melting steel, busheling, bundled scrap, shredded scrap, steel
turnings, and cast iron products; and processes nonferrous products consisting of aluminum,
brass, copper, stainless steel, and other nonferrous metals for use in foundry, mill refining, and
smelting applications. It also provides liquid pig iron and hot briquetted iron; and iron nugget
products. Such products are used in variety of industries, such as automotive, agriculture, energy,
construction, commercial, transportation, and industrial machinery industries. Speaking about
Company‟s competitive position, according to Company‟s documents, STLD faces significant
price and other forms of competition from other steel producers and scrap processors, which
could have a material adverse effect on their business, financial condition, results of operation or
prospects. Steel industry is highly consolidated, which results in fierce price competition and low
gross margin. STLD has a strong competitors group, such as Nippon Steel, Wheeling
Corrugating Co. etc. Thus, if the Company doesn‟t focus on their product quality and new
products development, their revenue may be damaged. In addition, due to new players entering
this market, the competition is expected to further intensify in the near future, which may also
result in price reductions. All-in-all, the Company has a strong product differentiation and
moderate competitive standing.
SWOT Analysis
Source: Global Data

Oleksandr Matviienko, Soufianne Ayoche, Huizhong Li
Materials, 2012
61
The Company has pretty obvious strengths, as well as weaknesses. One of the most important
strengths is the Company‟s diversification strategy. Just as we mentioned above, a great level
of product differentiation is reflected in three distinct segments – Steel operations segment (27%
of revenue in 2011), Metals recycling and ferrous resources operations segment (31% of revenue
in 2011), and steel fabrication operations segment (56% of revenue in 2011). These segments
supply products to various industries described above. Thus, company effectively protects itself
from various industries‟ risks as well as general economic as the Company serve a broader
customer base, access an extensive range of end-user markets, and mitigate its exposure to
cyclical downturns in commodity grade flat rolled products or in any one product or end-user
market. Moreover, STLD is the fifth largest producer of carbon steel products in U.S. with 2011
revenues of $8.0 billion on steel shipments of 5.8 million tons, which means STLD is a leader in
steel markets. According to the Company‟s document, STLD acquired Recycle South, a
privately-held, regional scrap metal recycling company, in 2008, acquired both OmniSource
Corporation, one of the country‟s largest ferrous scrap processors and the largest nonferrous
metals processor, and the Techs, three galvanizing plants in Pittsburgh that coat flat-rolled steel,
in 2007. STLD acquired Roanoke
Electric Steel Corporation, including
Steel of West Virginia, in 2006. All
these acquisitions show that STLD‟s
rapid growth has resulted from
discovering and taking advantage of
business opportunities in the areas of
technical and operational expertise. In
addition, STLD has a strong
profitability in recent two years.
Such ratios as the Gross Margin,
Operating Margin, Return on Equity,
Return on Invested Capital and
Return on Working Capital had good dynamic, which shows STLD‟s good performance.
Speaking about the Company‟s weaknesses the major area that causes our concern is that STLD
has substantial debts on its balance sheet. As the end of December 31, 2011, a significant
portion of our indebtedness then may become immediately due and payable if the default is not
remedied. The Company's total long-term debt including current maturities was nearly USD 2.4
billion. In addition, the company‟s Debt to Capital Ratio was 132.7%, which is significantly
high. Highly leveraged towards debt obligation is a serious weakness for the Company as a
substantial portion of cash flow is dedicated for repaying principal and interest on debt. If the
Company is unable to generate sufficient cash flow or is unable to obtain the funds required to
meet payments, STLD could face a major impact on its business. It also constrains the
Company‟s ability to do expansion, strategic acquisitions and research and development.
The Company also has opportunities, as well as threats. The steel industry is rebound in
demand. We have a positive fundamental outlook for the Steel industry for the following 12-
month. The projection of a 2.0% in U.S. GDP increase in 2012, compared with the GDP growth
of 1.8% in 2011. According to S&P, in the year 2012, there‟s an increase in auto sales to 13.5
million units, from 12.8 million units in 2011. Weak construction markets in the U.S. will weigh
on the company's growth potential in the near term. These positive signals will bring STLD some
new opportunity.
STLD: SWOT Analysis
Strenghts Weaknesses
Large Market Share Substantial Debts
Diversification
Opportunities Threats
Recovery in Steel Industry Environmental Regulations
Fierce Competition
Source: Team

Oleksandr Matviienko, Soufianne Ayoche, Huizhong Li
Materials, 2012
62
Speaking about Company‟s threats, we believe the most important is stringent environmental
regulations of steel industry. Meanwhile, the Company also requires government approvals and
permits to maintain its steel manufacturing and processing activities. If the company fails to
comply with these regulations, it may be imposed with hefty fines and penalties, which could
have a material impact on the profitability of the company. The company may also be denied
with new projects, which might hamper its business prospects. Also, as we mentioned before, the
company competes with other steel producers and scrap processors based on the product
availability, service capability, and price. The company faces firm competition from some main
players like Nippon Steel, Wheeling Corrugating Co., Quincy Joist Co., North Star Bluescope
Steel, Duferco Steel, SeverStal, Gerdau Ameristeel, Arcelor Mittal, Voest-Alpine, Moravia Steel,
Akron, U.S. Steel, AK Steel Corporation and etc. The intensified competition in steel industry
requires Company to maintain the product quality and consumer loyalty, or this intense
competition could reduce the sales volume of the company, and could thereby hamper its market
position.
Analysts’ and investors’ sentiment
For fiscal year 2012, analysts estimate that STLD will earn $1.31. For fiscal year 2013, analysts
estimate that STLD's earnings per share will grow by 43% to $1.87. Of the total 22 analysts
following STLD, 19 analysts currently publish recommendations. 47% and 26% of analysts
recommend “hold” and “buy/hold”, respectively. According to Standard & Poor, the
recommendation is “buy/hold”. Figures shown below has a positive outlook on EPS in following
years, from 1.23 in 2011 to 2.10 in 2012, a significant 70% increase. Figure to the right shows
that the majority opinions on STLD are a hold recommendation. Analysts seem to have a
moderate outlook on STLD, which is also our fundamental analysis conclusion.
Source: Thompson One Banker
Conclusion
We believe STLD has medium fundamentals because:
We have a very slight outlook for steel industry
As a leader company in US market, the Company has a strong market position and
market share
It has diversified products and operations which allows the Company to defend itself
from various specific industries/regions risks
The management is experienced and demonstrated strong performance for past two years

Oleksandr Matviienko, Soufianne Ayoche, Huizhong Li
Materials, 2012
63
It faces intensified competition from other steel producers and scrap processors
Its substantial debt on balance sheet is a big concern.
Silgan Holdings (SLGN). Current DFF holding.
Industry analysis and trends
Silgan Holdings (Silgan) operates in a Metal and Glass Containers sub-industry. It is worth
noting that, according to KeyBanc, this industry is a slow-growth relatively mature industry. As
indicated in our Materials industry analysis we are moderately optimistic about this industry
outlook:
US/global industrial recovery as measured by acceleration in real GDP and industrial
production growth rates
Consumer spending recovery
Slow recovery of global packaging market
Stringent government regulation on recycling and packaging
All of the aforementioned factors would produce a neutral-to-positive impact on Silgan growth
and profitability.
Porter’s five forces analysis
The Metals and Glass containers sub-industry can be characterized by relatively low control over
prices, as containers are in majority uniform
products and, according to S&P, companies
in this industry mostly compete on price.
This, in turn, affects the bargaining power
of buyers which we believe is strong, as
buyers may have relatively low switching
costs and very few special preferences for
special features and quality of cans and
other packaging. Also, we believe that
bargaining power of suppliers is
moderate as packaging companies‟ main
productive inputs are basic materials like
steel, plastics, paper which are scarce in
nature and packaging companies have little power in price negotiations as prices are determined
on world markets. The threat of substitutes is high as metal and glass packaging may be
substituted by plastic pouches and carton-board containers to defray higher tinplate costs and
attract consumer attention on store shelves, according to Morningstar. The threat of new
entrants is low-to-moderate as current players oftentimes achieve considerable economies of
scale in production, distribution and marketing, as well as the industry itself is highly capital and
labor intensive requiring high capital expenditures. On the basis of all of the aforementioned
factors and the fact that packaging companies mostly compete on price, as well as high threat of
substitutes, there is a moderate-to-strong rivalry among companies in Metal and Glass

Oleksandr Matviienko, Soufianne Ayoche, Huizhong Li
Materials, 2012
64
containers sub-industry. This results in packaging companies having moderate-to-low control
over prices and costs, thus, relatively volatile margins.
Company overview
Silgan is the largest food can producer in the USA which has gained such a consolidation
through directed M&A activity. According to KeyBanc, it has approximately 50% share of the
US market. The food can business accounts for about 63% of sales. The rest of the Company‟s
sales come from plastic and metal bottle closures (around 20% of sales) and rigid plastic bottles,
predominantly for the personal care industry (approximately 17% of sales). As of the end of
2010 the Company operated 68 plants in various parts of the world. The company was founded
in 1987 and is headquartered in Stamford, Connecticut. It operates in majority of international
markets of North America, Europe, Asia, and South America.
Table below represents Silgan‟s main competitors.
Management performance
The SLGN‟s main management consists of CEO, CFO, and COO. After studying key executives
biographies, as provided by Data Monitor services, we concluded that management is
professionalism and experience is fair, as the average age of the team is 43 years and everybody
has around 15+ years of chemical industry experience. However top management stayed with
Silgan for around 7-10 years, which is not a considerable amount of time as compared to other
companies selected for fundamental analysis. According to KeyBanc, under current management
Silgan‟s stock performance outperformed the Dow Jones Container/Packaging Index and the
S&P 500. Form a profitability standpoint, management performance was solid, as, basically,
main profitability ratios are relatively high and dividends per share have been constantly
increasing for past 5 years. However, the Company has been demonstrating unstable profitability
and EPS performance: the decrease in main ratios in 2008 and 2009 was accompanied by an
increase in 2010 and 2011, or increase in 2009 was accompanied by a decrease in 2010.
Tables below summarize key management performance measures:
SLGN: Key Competitors
Name Headquarters FY 2011 Revenue, mln USD
Ball Corporation USA 8,630
Constar International USA 638
Rexam Plc UK 7,283
CCL Industries Canada 1232
Silgan USA 3,509
Source: Dlobal Data

Oleksandr Matviienko, Soufianne Ayoche, Huizhong Li
Materials, 2012
65
On basis of the aforementioned analysis we believe management‟s qualifications and
performance was relatively fair.
Product differentiation and competitive position
We cannot say that Company‟s products and operations are highly diversified as it mainly
manufactures containers and packaging for food-and-beverage, healthcare, and pharmaceuticals
companies and derives around 90% of its revenue from North American market. Thus,
Company‟s profitability may be seriously harmed by crisis in one of the aforementioned
industries or in North American market. Speaking about Company‟s competitive position, it is
worth noting that SLGN is a market leader in the USA with around 50% market share.
Moreover, according to Morningstar, Silgan‟s operational model is built on low-cost
manufacturing advantage. Shipping empty cans long distances is expensive and Silgan derives its
cost advantage by having its plants either co-located or with its customers' facilities or at least
nearby. Indeed, over the years Silgan has acquired many of its packaging facilities directly from
the food producers and has multidecade relationships with its major customers. We think it
would be very difficult for a would-be competitor to match Silgan's proximity to key customers
and forge similar customer relationships overnight. Unlike its competitors that typically rely on
single-year food can supply contracts, the majority of Silgan's supply contracts are multiyear
(typically 5-7 years in length). All-in-all, the Company has a weak product differentiation and
solid competitive standing.
Source: Global Data
Source: Global Data

Oleksandr Matviienko, Soufianne Ayoche, Huizhong Li
Materials, 2012
66
SWOT Analysis
The Company has numerous strengths, as well as weaknesses. One of the most important
strengths is the Company‟s low
cost production and long-term
contractual relationships with
main customers, which were
discussed previously. Moreover,
the Company has successful
M&A history. More specifically,
Company‟s M&A activity
allowed it to consolidate the US
cans market and achieve
significant economies of scale.
With such an M&A expertise the
Company can continue to grow
by acquisitions.
Speaking about Silgan‟s
weaknesses it is worth mentioning high customer concentration – around 30% of the
Company‟s sales come from 3 main consumers. The worsening of relationships with any of these
customers could adversely affect Company‟s profitability. Also, as indicated in our industry
analysis, Metals and Glass containers is a slow growth mature industry. According to
Morningstar, a negative containers demand volume trend is expected in the North-American
market.
The Company has significant opportunities, as well as threats. Silgan management expects
Eastern Europe food can demand to grow between 4% and 5% per year. Therefore, the
Company would benefit by increasing its operations in Easter European markets, which,
basically, the Company was doing in 2010 and 2011. Also, according to Datamonitor, the global
beverage industry is witnessing significant growth. According to Datamonitor estimates, the
global beverages industry grew by 15% in 2010 to reach a value of $1,749.4 billion. In 2015, the
global beverages industry is forecast to have a value of $1,909 billion, an increase of 9.1% since
2010. The high growth of beverages in turn converts into significant demand for beverages
packaging and, thus, for Silgan‟s products.
Speaking about Company‟s threats, we believe the most important is substitutes threat. As
mentioned before, according to Morningstar, a number of Silgan's major metal food customers
have recently expressed an interest in using alternative packaging types such as plastic pouches
and carton-board containers to defray higher tinplate costs and attract consumer attention on
store shelves. We think it's likely that such customers will have more bargaining power this time
around and may offer less supply volume and may look to share the burden of cost inflation with
Silgan. Also, there are little opportunities in emerging markets of Asia, as, according to
Morningstar, metal cans represented just 6% of the total food packaging mix in 2010 versus 62%
for flexible packaging, 10% for rigid plastic containers, and 7% for glass. Moreover, three
commonly-canned products in North America and Europe are fruits and vegetables, pet food,
and soup, but those products together represented just 3% of total Asia-Pacific food packaging in
2010. By comparison, those three categories represented 45% and 32% of food packaging in
SLGN: SWOT Analysis
Strenghts Weaknesses
Low-cost production High customer concentration
Long-term contractual Low-growth industry
relationships
Strong M&A history
Opportunities Threats
Emerging European markets Little opportunities in emerging
Favourable outlook for markets of Asia
global beverage industry Substitutes threat
M&A failure
Source: Team

Oleksandr Matviienko, Soufianne Ayoche, Huizhong Li
Materials, 2012
67
North America and Western Europe. Far more commonly packaged foods in Asia-Pacific are
noodles, meat products, and condiments, which tend to be presented in flexible packaging,
pouches, and plastic trays. This is also partially true for other emerging markets, except for
Eastern European one where packaging needs basically coincide with those of Western Europe
and USA.
The Company‟s recent M&A activity may also pose a significant threat, if such acquisitions are
not integrated properly into existing business model or cannibalize existing sales.
Analysts’ and investors’ sentiment
Analysts generally are optimistic about the stock in a near term, as EPS forecasts are increasing
for next three years. Speaking about the ratings, the general analysts‟ opinion is highly diverse
ranging from strong buy to hold. However, hold rating is dominant. We couldn‟t indicate that
such sentiment changed recently: there was only moderate downward revision. This Company is
substantially followed by analysts which, we believe, is not a positive factor. Current mean target
price is $45.5 and current is $44.7. The stocks‟ trading volume does not look quite stable which
further indicates the uncertainty of investors concerning the stock.
Source: Thompson One Banker
Conclusion
We believe Silgan has medium fundamentals because:
The industry is slow-growth and highly competitive
The management is relatively experienced, however, it demonstrated unstable
performance for past years
It does not have a well-diversified products and operations
It does not have a strong emerging markets growth opportunities
However, it has a strong presence in the US market and is a leader there
It has a successful M&A history
There is a significant substitution threat to the Company‟s operations
It is a substantially followed stock

Oleksandr Matviienko, Soufianne Ayoche, Huizhong Li
Materials, 2012
68
Investment Idea Summary Based on the results of our quantitative, qualitative, and fundamental analyses we recommend a
strong buy for Cytec Industries company, a moderate buy Scott Miracle Growth company, a hold
for Sensient Technologies company (current DFF holding), and a sell for Silgan Holdings
company (current DFF holding). It is worth noting that Silgan Holing was also a sell
recommendation previous year.
Cytec Industries (CYT): STRONG BUY
Short business description: This is a specialty chemical company which is engaged in the
production and distribution of various chemical products for different industrial, consumer,
agricultural, and other uses. It has extensively diversified geographical operations and portfolio
of products providing necessary chemical components to both cyclical and non-cyclical
industries. Please find detailed company description and analysis in the Fundamental analysis
section.
Reasons to invest:
1. From a quantitative perspective, it is a non-glamour explicit value stock with the highest
earnings surprise ratio, perfect quality of earnings, and a strong fundamental position, as
well as with favorably negative external financing activities. This Company has the
highest quantitative score:
2. From a qualitative perspective, the Company showed high technical and expansion
efforts and relatively fair cost control:
3. From a fundamental perspective, this Company is strong, as we believe that:
The industry has a positive outlook and is moderately competitive
The management is relatively experienced and demonstrated solid performance
for past years, especially by recovering Company‟s profitability in FY 2010 and FY
2011
It has diversified products and operations which allows the Company to defend
itself from various specific industries/regions risks
It has strong presence in emerging markets where chemical growth is expected to
be robust
It has made important steps in auto composite market which is expected to be
dynamic and promising
It has a solid competitive position created by recent successful investments in new
technologies and patents
Ticker Company Momentum GS Mom/GS combined BE/ME CF/P Value combined Earn-surp Volatility Accruals F-score Xfin C-Score
CYT CYTEC INDUSTRIES INC 10 24 17 18 18 18 27 5 18 25 25 135
Ticker Company Oper Eff Tech and Exp Cost Control Mngmt Quality Q-Score
CYT CYTEC INDUSTRIES INC 7 20 11 8 46

Oleksandr Matviienko, Soufianne Ayoche, Huizhong Li
Materials, 2012
69
It is a thinly followed non-glamour stock with a positive outlook and consistent
earnings announcements surprises.
All-in-all, Cytec is a strong buy because it is quantitatively and fundamentally strong non-
glamour value company. Moreover, we expect the Company to continue diversify across various
chemical market in the medium-term future with a special emphasis on emerging markets and
European auto-market.
Scott Miracle Growth (SMG): MODERATE BUY
Short business description: This is an agricultural chemical company which is engaged in the
production and distribution of various chemical products, fertilizers, additives for agricultural
users. It has solid diversified operations in North America and internationally. Please find
detailed company description and analysis in the Fundamental analysis section.
Reasons to invest:
1. From a quantitative perspective, the Company is a non-glamour stock with good growth
in sales and a low book to market ratio. It has a strong negative external financing and
sound earning surprise. The F-score is pretty good and gives us incentive to trade on such
technical:
2. From a qualitative perspective, the Company has a strong cost control management and a
very good management quality. Its Q-score is very sound and gives us solid reason to
think that the company possesses unique attributes not quantifiable that can be capitalized
upon:
3. From a fundamental perspective, this Company is medium-to-strong, as we believe that:
The industry is moderately-to-high competitive
Sound track records in innovation and differentiation
Solid financial performances
The Company has cyclical nature of business
It depends on few customers and critically on natural gas supply.
All-in-all, Scott is a moderate buy because of a very solid quantitative screen and because of
strong qualitative elements. Moreover, although the Company is a growth stock, the historical
track record of the Company in the face of adversity and the outstanding management
performances on the past five years make us think the company is well lead and able to compete
very efficiently in its market as the results of strong R&D and innovative products. Furthermore,
the fact that the current CEO owns 32 % of the shares and has decided to extend its contract in
the company sends a strong signal to the market. Finally, we expect the Company to continue
providing innovative products in the market for the upcoming year while expanding its E-Z seed
Ticker Company Momentum GS Mom/GS combined BE/ME CF/P Value combined Earn-surp Volatility Accruals F-score Xfin C-Score
SMG SCOTT MIRACLE GROWTH 16 11 13.5 2 6 4 16 24 27 14.5 27 126
Ticker Company Oper Eff Tech and Exp Cost Control Mngmt Quality Q-Score
SMG SCOTT MIRACLE GROWTH 13 12 15 18 58

Oleksandr Matviienko, Soufianne Ayoche, Huizhong Li
Materials, 2012
70
worldwide which is until now a very successful product in all the markets it has been introduced
to and possesses a very high profit margin.
Sensient Technologies (SXT). Current DFF holding: HOLD
Short business description: This is a specialty chemical company which is engaged in the
production and distribution of various specialty chemical products for different industrial,
consumer, agricultural, and other uses. It has extensively diversified geographical operations and
portfolio of products providing necessary chemical components to both cyclical and non-cyclical
industries. Please find detailed company description and analysis in the Fundamental analysis
section.
Reasons to hold:
1. From a quantitative perspective, it is neutral-glamour and slightly value stock with a fair
earnings surprise ratio, and low volatility, as well as with solid quality of earnings,
strong fundamental position, and with favorably negative external financing activities:
2. From a qualitative perspective, the Company has a strong management and a high cost-
control quality, as well as relatively fair operational efficiency and technical and
expansion efforts:
3. From a fundamental perspective, this Company is strong, as we believe that:
The industry has a positive outlook and is moderately competitive
The management is experienced and demonstrated strong performance for past
years
It has diversified products and operations which allows the Company to defend
itself from various specific industries/regions risks
It has strong presence in emerging markets where chemical growth is expected to
be robust
It has a strong presence in the US healthcare market which is also projected to
grow consistently
It has a solid competitive position created by recent successful investments and
M&A activity
It is a thinly followed stock with a positive outlook.
All-in-all, Sensient is a hold because it is quantitatively, qualitatively and fundamentally strong
company which is thinly followed and has a positive outlook. This company is the only one
which was among TOP 6 companies both in qualitative and quantitative screens. Moreover, in
the medium future we expect it to continue to benefit from increased healthcare demand in the
USA and enlarge its operations in the emerging markets.
Ticker Company Momentum GS Mom/GS combined BE/ME CF/P Value combined Earn-surp Volatility Accruals F-score Xfin C-Score
SXT SENSIENT TECHNOLOGIES CORP 14 10 12 15 9 12 15 22.5 15 25 20 121.5
Ticker Company Oper Eff Tech and Exp Cost Control Mngmt Quality Q-Score
SXT SENSIENT TECHNOLOGIES CORP 10 11 22 27 70

Oleksandr Matviienko, Soufianne Ayoche, Huizhong Li
Materials, 2012
71
Silgan Holdings (SLGN). Current DFF holding: SELL
Short business description: This is a metals and glass containers company which is engaged in
the production and distribution of various container products for healthcare, pharmaceutical,
industrial and consumer users. It has fairly diversified geographical operations and portfolio of
products providing necessary. Please find detailed company description and analysis in the
Fundamental analysis section.
Reasons to divest:
1. From a quantitative perspective, it is a neutral-glamour and growth stock with average
earnings surprise ratio, and above-average low volatility, as well as with below-average
quality of earnings, average fundamental position, and with non-favorable negative
external financing activities:
2. From a qualitative perspective, the Company has solid operational efficiency, above-
average technical and expansion efforts, average management quality and low cost
control.
3. From a fundamental perspective, this Company is medium, as we believe that:
The industry is slow-growth and highly competitive
The management is relatively experienced, however, it demonstrated unstable
performance for past years
It does not have a well-diversified products and operations
It does not have a strong emerging markets growth opportunities
However, it has a strong presence in the US market and is a leader there
It has a successful M&A history
There is a significant substitution threat to the Company‟s operations
It is a substantially followed stock
All-in-all, Silgan is a sell because it is quantitatively, qualitatively and fundamentally below the
average company which is also substantially followed. This company was also a sell
recommendation previous year. Moreover, it is hard for us to determine the medium future of the
Company as the industry is slow-growth and highly competitive, as well as the Company is
significantly threatened by potential substitutions and has a high customer concentration.
Ticker Company Momentum GS Mom/GS combined BE/ME CF/P Value combined Earn-surp Volatility Accruals F-score Xfin C-Score
SLGN SILGAN HO 15 18 16.5 3 17 10 13 17 11 14.5 4 86
Ticker Company Oper Eff Tech and Exp Cost Control Mngmt Quality Q-Score
SLGN SILGAN HO 20 18 4 16 58

Oleksandr Matviienko, Soufianne Ayoche, Huizhong Li
Materials, 2012
72
References We used such sources and materials to prepare given analysis:
1. Leo J. Larkin, August 4, 2011, Industry Analysis: Diversified Metals & Mining
2. February 2012, USDA Long-term Projections: U.S. Crops
3. Richard O‟Reilly, CFA, Chemicals Analyst, July 7, 2011, Industry Analysis: Chemicals
4. Stuart J. Benway, CFA, February 9, 2012, Industry Analysis: Paper Products & Forest
Products
5. Bloomberg
6. Thompson One Banker http://banker.thomsonib.com/
7. Global Data http://www.globaldata.com/
8. J.P. Morgan http://www.morganmarkets.com
9. Value Line. http://www.valueline.com/
10. Thompson Reuters http://thomsonreuters.com/
11. First Call http://thomsonreuters.com/products_services/financial/financial_products/a-
z/first_call/
12. SADIF http://www.sadifanalytics.com/stockmarks/main.php
13. Morningstar Equity Research http://news.morningstar.com/
14. Standard and Poor‟s http://www.standardandpoors.com/
15. Wharton Research Data Services. http://wrds.wharton.upenn.edu/
16. First Research http://www.firstresearch.com
17. FactSet http://www.factset.com/
18. http://www.finance.yahoo.com
19. http://www.scotts.com/
20. http://www.sensient-tech.com
21. https://www.cytec.com/
22. http://www.silganholdings.com
23. http://www.steel.org/
24. http://www.bea.gov/
25. http://www.commerce.gov/
26. Diversified Metal and Mining-Mid, S&P Market Inside
27. Metal and Glass Containers-Mid, S&P Market Inside
28. Diversified Chemicals-Mid, S&P Market Inside
29. Steel-Mid, S&P Market Inside
30. Specialty Chemicals-Mid, S&P Market Inside
31. Construction Material-Mid, S&P Market Inside
32. Fertilizer and Agriculture Chemical-Mid, S&P Market Inside

Oleksandr Matviienko, Soufianne Ayoche, Huizhong Li
Materials, 2012
73
Ticker Company BaH Return Rank
MLM MARTIN MA -17.58% 27
IPI INTREPID POTASH 8.96% 26
OLN OLIN CORP 25.11% 25
CMP COMPASS MINERALS INTL INC 25.54% 24
STLD STEEL DYN 26.63% 23
CMC COMMERCIA 28.58% 22
MTX MINERALS TECHNOLOGIES INC 39.88% 21
GEF GREIF INC 49.66% 20
ATR APTARGROU 55.55% 19
SON SONOCO PRODUCTS 72.95% 18
WOR WORTHINGT 63.03% 17
SMG SCOTT MIRACLE GROWTH 65.53% 16
SLGN SILGAN HO 68.25% 15
SXT SENSIENT TECHNOLOGIES CORP 72.42% 14
RKT ROCK TENN 75.25% 13
PKG PACKAGING CORPORATION OF AMERICA 105.19% 12
RPM R P M INTERNATIONAL INC 110.97% 11
CYT CYTEC INDUSTRIES INC 114.75% 10
CBT CABOT CORP 129.40% 9
VAL VALSPAR CORP 130.31% 8
ALB ALBEMARLE CORP 141.02% 7
RS RELIANCE 151.64% 6
CRS CARPENTER 169.47% 5
UFS DOMTAR CORPORATION 310.37% 4
LPX LOUISIANA PACIFIC CORPORATION 417.31% 3
ASH ASHLAND INC NEW 467.04% 2
NEU NEWMARKET CORP 492.38% 1
Note:
Current holdings
Appendix Appendix A.
1. 3-year buy and hold (BaH) return screens.
According to DeBondt and
Thaler, stock returns may
reverse in future and
companies which exhibited
highest returns will exhibit
lowest and wise versa. Thus,
the highest rank was allocated
to companies with lowest past
BaH returns. 3-year period is
consistent with the paper itself.

Oleksandr Matviienko, Soufianne Ayoche, Huizhong Li
Materials, 2012
74
2. 5-year growth rate in sales screens.
According to LSV, companies which exhibited highest growth rates in sales for last 5 years are
“glamour stock” and would underperform companies which exhibited lowest growth rates for
last 5 years. Thus, highest rank is allocated to companies which exhibited lowest growth rates.
The growth rate in sales was calculated as historical weighted average growth rate, where “1”
weight was assigned to the latest year (2007) and “5” weight was allocated to the earliest year
(2011).
3. Book value of equity to market value of equity (BE/ME) and cash flow per share to price
per share (CF/P) screens.
High BE/ME and CF/P companies are considered “value” stocks and allocated higher ranks,
according to LSV.
2007 2008 2009 2010 2011 GS Rank
Rank–> 1 2 3 4 5
Worthington Industries Inc -0.05901497 0.02575953 0.03208482 -0.14211518 -0.26156191 -0.11916745 26
Carpenter Technology Corp. 0.19327347 0.24014794 0.00447347 -0.30360891 -0.11893561 -0.07480826 25
Cytec Industries Inc 0.13801825 0.0523502 0.03884354 -0.23363279 -0.01476967 -0.04327535 24
Commercial Metals Company 0.14610402 0.10231712 0.2519336 -0.34855831 -0.07152689 -0.04302191 23
Martin Marietta Materials Inc 0.10086616 0.00033539 -0.03944471 -0.1969171 0.04713967 -0.03791782 22
Louisiana Pacific Corp. -0.1399823 -0.23721534 -0.19279723 -0.2336143 0.31184223 -0.03787005 21
Olin Corp. 0.3368113 -0.59489815 0.38197055 -0.13204874 0.03552073 -0.00384431 20
Minerals Technologies Inc 0.06373514 0.01737924 0.03200275 -0.18421881 0.10473703 -0.00124588 19
Silgan Holdings Inc 0.06891066 0.09577435 0.0677352 -0.0173759 0.00155865 0.02679698 18
Valspar Corp. 0.09731572 0.09107607 0.07173567 -0.17325507 0.12075206 0.02702766 17
Albemarle Corp. 0.12384816 -0.01364571 0.05603996 -0.18715015 0.17820474 0.02713998 16
RPM International Inc 0.17709617 0.10983466 0.09136027 -0.07564102 0.01322677 0.02896107 15
Sonoco Products Company 0.03635184 0.10477625 0.02039361 -0.12736575 0.14539672 0.03497372 14
Packaging Corp. Of America 0.0970025 0.05896527 0.01920544 -0.09019314 0.13411312 0.03882283 13
Ashland Inc -0.2197411 0.07631688 0.07655748 -0.03281231 0.11176906 0.03934408 12
Scotts Miracle-Gro Company 0.1383531 0.06477327 0.0383035 0.05355825 -0.00050931 0.03963311 11
Sensient Technologies Corp. 0.07309093 0.07827844 0.05725958 -0.04088231 0.10551768 0.05103238 10
Aptargroup Inc 0.16041188 0.18158713 0.09486991 -0.11104997 0.12765934 0.06681951 9
Cabot Corp. 0.19623529 0.02911094 0.21980122 -0.29708555 0.28979046 0.07829806 8
Greif Inc 0.08422225 0.26395864 0.1367942 -0.26068376 0.23970891 0.07855544 7
Reliance Steel And Aluminum Company 0.70553155 0.26348124 0.20165718 -0.39004157 0.18703379 0.08083122 6
Rock-Tenn Company 0.23341486 0.08311117 0.22588306 -0.00940505 0.06688713 0.09160679 5
Compass Minerals International Inc -0.1099286 0.29756319 0.36206695 -0.17521624 0.1098536 0.09465345 4
Newmarket Corp. 0.17457277 0.08831631 0.17642395 -0.0539807 0.17467257 0.10252782 3
Domtar Corp. 0.0157897 1.25239711 -0.13965882 0.07169014 0.0333413 0.1703383 2
Steel Dynamics Inc 0.48237195 0.35376174 0.8429531 -0.5100798 0.59161213 0.30909974 1
Note:
Current holdings

Oleksandr Matviienko, Soufianne Ayoche, Huizhong Li
Materials, 2012
75
Companies BE/ME Rank
Compass Minerals International Inc 0.149 1
Scotts Miracle-Gro Company 0.174 2
Silgan Holdings Inc 0.213 3
Newmarket Corp. 0.216 4
Valspar Corp. 0.259 5
Albemarle Corp. 0.284 6
Packaging Corp. Of America 0.322 7
Carpenter Technology Corp. 0.338 8
Aptargroup Inc 0.360 9
Martin Marietta Materials Inc 0.362 10
RPM International Inc 0.371 11
Sonoco Products Company 0.424 12
Greif Inc 0.475 13
Worthington Industries Inc 0.513 14
Sensient Technologies Corp. 0.535 15
Cabot Corp. 0.557 16
Olin Corp. 0.573 17
Cytec Industries Inc 0.621 18
Minerals Technologies Inc 0.651 19
Commercial Metals Company 0.690 20
Rock-Tenn Company 0.713 21
Steel Dynamics Inc 0.760 22
Reliance Steel And Aluminum Company 0.784 23
Louisiana Pacific Corp. 0.813 24
Domtar Corp. 0.835 25
Ashland Inc 0.864 26
Note:
Current holdings
4. Earnings surprise screens.
We calculated Earnings Surprise Ratio (ESR), which is equal to (Actual EPS reported for FY
2011 – Mean analyst EPS estimate for FY 2011)/Price as at the end of FY 2011. Then companies
were ranked according to the estimated ESR where higher ESR means more earnings surprise.
Companies CF/P Rank
Louisiana Pacific Corp. -0.075 1
Valspar Corp. -0.004 2
Commercial Metals Company 0.018 3
Ashland Inc 0.064 4
Martin Marietta Materials Inc 0.066 5
Scotts Miracle-Gro Company 0.069 6
Carpenter Technology Corp. 0.074 7
RPM International Inc 0.079 8
Sensient Technologies Corp. 0.088 9
Aptargroup Inc 0.089 10
Compass Minerals International Inc 0.092 11
Rock-Tenn Company 0.093 12
Albemarle Corp. 0.095 13
Newmarket Corp. 0.098 14
Minerals Technologies Inc 0.110 15
Packaging Corp. Of America 0.112 16
Silgan Holdings Inc 0.114 17
Cytec Industries Inc 0.116 18
Greif Inc 0.116 19
Reliance Steel And Aluminum Company 0.119 20
Sonoco Products Company 0.119 21
Cabot Corp. 0.131 22
Worthington Industries Inc 0.132 23
Steel Dynamics Inc 0.164 24
Olin Corp. 0.198 25
Domtar Corp. 0.201 26
Note:
Current holdings

Oleksandr Matviienko, Soufianne Ayoche, Huizhong Li
Materials, 2012
76
5. Volatility screens.
We calculated beta and standard deviations (StDev) of analyzed stocks on basis of 2-year daily
returns, as we believe this time period and horizon is a consistent measure of recent volatility and
used in practice in valuation firms for measuring volatilities. For beta calculations stocks‟ returns
for regressed on S&P 400 returns. Stocks with lowest standard deviations and betas were
assigned highest ranks and then two distinct ranks for betas and StDevs were averaged to get a
volatility score for each company,
Company Mean Actual Price ESR Rank
Louisiana Pacific Corp -0.198 -0.33 8.07 -1.636% 1
NewMarket Corp 3.416 2.570 198.110 -0.427% 2
Rock-Tenn 1.391 1.18 57.7 -0.366% 3
Worthington Industries Inc 0.315 0.270 17.590 -0.256% 4
AptarGroup Inc 0.601 0.570 52.170 -0.059% 5
RPM International Inc. 0.386 0.380 23.600 -0.025% 6
Martin Marietta Materials 0.391 0.380 75.410 -0.015% 7
Sonoco Products Co 0.46 0.46 32.96 0.000% 8
Intrepid Potash Inc 0.3 0.3 22.63 0.000% 9
Olin Corp 0.229 0.230 19.650 0.005% 10
Albemarle Corp 1.087 1.110 51.510 0.045% 11
Compass Minerals International 1.617 1.650 68.850 0.048% 12
Silgan Holdings 0.539 0.560 38.640 0.054% 13
Greif Bros Corp A 0.612 0.640 44.780 0.063% 14
Sensient Technologies Corp 0.560 0.590 37.900 0.079% 15
Scotts Co A -1.224 -1.18 46.69 0.094% 16
Carpenter Technology Corp 0.512 0.570 51.480 0.113% 17
Packaging Corp of America 0.367 0.4 25.24 0.131% 18
Cabot Corp 0.554 0.630 32.140 0.236% 19
Steel Dynamics Inc 0.107 0.140 13.150 0.251% 20
Commercial Metals Co 0.163 0.200 13.980 0.265% 21
Reliance Steel & Aluminum 0.780 0.910 48.690 0.267% 22
Minerals Technologies Inc 0.897 1.050 56.530 0.271% 23
Domtar Corp 2.242 2.49 81.51 0.304% 24
Valspar Corp 0.480 0.620 43.240 0.324% 25
Ashland Inc 0.986 1.200 57.160 0.374% 26
Cytec Industries Inc 0.472 0.860 44.650 0.869% 27
Note:
Current holdings

Oleksandr Matviienko, Soufianne Ayoche, Huizhong Li
Materials, 2012
77
Ticker Company Name Beta Score
LPX LOUISIANA PACIFIC CORPORATION 1.70 1
CRS CARPENTER 1.45 2
WOR WORTHINGT 1.42 3
RS RELIANCE 1.38 4
CYT CYTEC INDUSTRIES INC 1.33 5
ASH ASHLAND INC NEW 1.33 6
UFS DOMTAR CORPORATION 1.33 7
CMC COMMERCIA 1.32 8
STLD STEEL DYN 1.32 9
CBT CABOT CORP 1.32 10
ALB ALBEMARLE CORP 1.30 11
IPI INTREPID POTASH 1.24 12
NEU NEWMARKET CORP 1.23 13
OLN OLIN CORP 1.20 14
RKT ROCK TENN 1.19 15
MTX MINERALS TECHNOLOGIES INC 1.18 16
RPM R P M INTERNATIONAL INC 1.01 17
SXT SENSIENT TECHNOLOGIES CORP 1.01 18
PKG PACKAGING CORPORATION OF AMERICA 0.98 19
GEF GREIF INC 0.92 20
MLM MARTIN MA 0.90 21
VAL VALSPAR CORP 0.85 22
CMP COMPASS MINERALS INTL INC 0.84 23
ATR APTARGROU 0.80 24
SON SONOCO PRODUCTS 0.79 25
SMG SCOTT MIRACLE GROWTH 0.73 26
SLGN SILGAN HO 0.70 27
Ticker Company Name StDev Score
IPI INTREPID POTASH 51.83% 1
GEF GREIF INC 44.74% 2
CRS CARPENTER 43.97% 3
CMP COMPASS MINERALS INTL INC 43.02% 4
CYT CYTEC INDUSTRIES INC 42.47% 5
WOR WORTHINGT 41.55% 6
SLGN SILGAN HO 40.76% 7
ALB ALBEMARLE CORP 39.81% 8
CBT CABOT CORP 39.40% 9
RS RELIANCE 38.64% 10
ATR APTARGROU 38.59% 11
PKG PACKAGING CORPORATION OF AMERICA 38.47% 12
MTX MINERALS TECHNOLOGIES INC 38.20% 13
STLD STEEL DYN 34.98% 14
NEU NEWMARKET CORP 34.51% 15
MLM MARTIN MA 31.93% 16
RPM R P M INTERNATIONAL INC 30.43% 17
LPX LOUISIANA PACIFIC CORPORATION 29.56% 18
UFS DOMTAR CORPORATION 29.14% 19
OLN OLIN CORP 28.98% 20
SON SONOCO PRODUCTS 28.89% 21
SMG SCOTT MIRACLE GROWTH 28.55% 22
CMC COMMERCIA 28.29% 23
RKT ROCK TENN 26.71% 24
VAL VALSPAR CORP 26.26% 25
ASH ASHLAND INC NEW 22.73% 26
SXT SENSIENT TECHNOLOGIES CORP 22.32% 27
Ticker Company Name Volatility Score
IPI INTREPID POTASH 6.5
GEF GREIF INC 11
CRS CARPENTER 2.5
CMP COMPASS MINERALS INTL INC 13.5
CYT CYTEC INDUSTRIES INC 5
WOR WORTHINGT 4.5
SLGN SILGAN HO 17
ALB ALBEMARLE CORP 9.5
CBT CABOT CORP 9.5
RS RELIANCE 7
ATR APTARGROU 17.5
PKG PACKAGING CORPORATION OF AMERICA 15.5
MTX MINERALS TECHNOLOGIES INC 14.5
STLD STEEL DYN 11.5
NEU NEWMARKET CORP 14
MLM MARTIN MA 18.5
RPM R P M INTERNATIONAL INC 17
LPX LOUISIANA PACIFIC CORPORATION 9.5
UFS DOMTAR CORPORATION 13
OLN OLIN CORP 17
SON SONOCO PRODUCTS 23
SMG SCOTT MIRACLE GROWTH 24
CMC COMMERCIA 15.5
RKT ROCK TENN 19.5
VAL VALSPAR CORP 23.5
ASH ASHLAND INC NEW 16
SXT SENSIENT TECHNOLOGIES CORP 22.5

Oleksandr Matviienko, Soufianne Ayoche, Huizhong Li
Materials, 2012
78
6. Accrual screens.
According to Sloan, accruals were calculated in such way:
Then Accruals figure was scaled by average total assets and ranked accordingly. The smallest
Accruals by avg assets figure was allocated the highest rank.
7. F-score screens.
Companies with higher F-scores are supposed to be fundamentally stronger, thus, they were
allocated higher ranks. We averaged scores for companies with equal F-scores. According to
Piotroski, F-score is calculated as follows:
Ticker Company Name ΔCA Δcash ΔCL ΔSTD ΔTP Dep Accruals Avg. Total Assets Accruals/Total Assets Rank
SMG SCOTT MIRACLE GROWTH -125.60 42.80 -268.20 -191.80 0.00 61.70 -153.70 2,108.10 -7.29% 27
UFS DOMTAR CORPORATION -66.00 -86.00 -9.00 -14.00 -5.00 376.00 -366.00 5,947.50 -6.15% 26
CMP COMPASS MINERALS INTL INC -5.60 39.20 144.20 151.80 -7.80 64.70 -109.70 2,319.80 -4.73% 25
PKG PACKAGING CORPORATION OF AMERICA 14.02 -40.24 -29.06 -93.95 7.80 162.13 -164.95 4,636.77 -3.56% 24
MLM MARTIN MA -38.36 -44.30 -211.78 -243.66 0.00 173.41 -199.34 6,222.57 -3.20% 23
CRS CARPENTER 216.10 161.60 -19.30 -100.00 0.00 73.60 -99.80 3,504.80 -2.85% 22
OLN OLIN CORP -102.5 -153.8 8.1 -65.6 0.00 99.30 -121.70 4,498.30 -2.71% 21
MTX MINERALS TECHNOLOGIES INC 44.72 27.33 25.67 9.79 -1.27 58.22 -57.98 2,281.06 -2.54% 20
ALB ALBEMARLE CORP 7.42 -60.23 37.00 5.43 -11.98 96.75 -72.65 3,135.95 -2.32% 19
CYT CYTEC INDUSTRIES INC -23.60 32.50 -57.70 -2.60 1.10 142.40 -142.30 7,210.60 -1.97% 18
SON SONOCO PRODUCTS 155.28 17.27 55.83 36.72 -1.43 179.87 -62.42 3,633.59 -1.72% 17
LPX LOUISIANA PACIFIC CORPORATION -56.80 -49.30 4.50 13.00 0.00 78.90 -77.90 4,550.50 -1.71% 16
SXT SENSIENT TECHNOLOGIES CORP 34.57 8.60 2.21 -2.48 -2.74 46.10 -27.57 1,626.72 -1.69% 15
ATR APTARGROU 79.97 1.19 95.53 88.10 0.00 134.24 -62.89 4,192.01 -1.50% 14
STLD STEEL DYN 455.26 204.25 539.10 435.15 5.65 222.61 -69.89 5,784.58 -1.21% 13
GEF GREIF INC 156.11 20.46 148.41 76.40 0.00 144.19 -80.54 7,705.73 -1.05% 12
SLGN SILGAN HO 469.23 221.88 182.35 73.83 0.00 158.80 -19.98 2,577.55 -0.77% 11
ASH ASHLAND INC NEW 554.00 320.00 52.00 68.00 0.00 299.00 -49.00 22,496.00 -0.22% 10
WOR WORTHINGT 52.086 -14.46 206.822 205.58 -1.96 54.43 8.91 3,452.41 0.26% 9
CBT CABOT CORP 117.00 -101.00 117.00 91.00 0.00 144.00 48.00 6,027.00 0.80% 8
NEU NEWMARKET CORP 76.96 1.18 9.64 7.21 -1.76 41.75 29.85 2,254.40 1.32% 7
CMC COMMERCIA 151.05 -176.92 95.90 28.07 0.00 159.58 100.57 7,389.28 1.36% 6
IPI INTREPID POTASH 67.82 -2.76 4.27 0.00 0.00 35.79 30.53 1761.754 1.73% 5
RPM R P M INTERNATIONAL INC 1,058.52 394.78 215.19 -5.58 0.00 72.98 370.00 13,069.34 2.83% 4
RKT ROCK TENN 1,519.90 25.80 687.10 -88.30 0.00 278.30 440.40 13,480.90 3.27% 3
RS RELIANCE 573.80 11.69 67.80 -74.03 0.00 133.10 287.18 5,137.40 5.59% 2
VAL VALSPAR CORP 40.21 10.55 50.03 369.23 -15.65 97.75 235.48 3,684.04 6.39% 1
Note:
Current holdings

Oleksandr Matviienko, Soufianne Ayoche, Huizhong Li
Materials, 2012
79
Where F_ROA equals to 1 if ROA is positive and 0 if negative; F_∆ROA=1 if change in ROA
for the year was positive, zero otherwise; F_CFO=1 if CFO (cash-flow from operations/ttl assts)

Oleksandr Matviienko, Soufianne Ayoche, Huizhong Li
Materials, 2012
80
Tick
er
NI(
-1)
be
fore
ext
r
NI(
0)
be
fore
ext
r
Tota
l ass
ets
(-1)
, be
g o
f
the
ye
ar
Tota
l ass
ets
(0)
,
be
g o
f th
e y
ear
RO
AC
FOC
FO/T
AD
RO
AA
CC
RU
AL
LT-D
eb
t (-
1)A
ve A
sse
ts (
-1)
Leve
r (-
1)LT
-De
bt
(0)
Ave
Ass
ets
(0)
Leve
r (0
)D
leve
rC
A(-
1)C
L(-1
)Li
q(-
1)C
A(0
)C
L(0)
Liq
(0)
Dli
qu
idEQ
_Off
er
GM
(-1)
GM
(0)
DG
MTu
rn(-
1)Tu
rn(0
)D
turn
F-Sc
ore
Ran
k
LPX
US
Equ
ity-3
2.2
-171
.92,
620.
302,
410.
600
-40.
20
01
714.
52,
515.
450.
2840
4571
5.9
2,27
5.25
0.31
4647
071
3.6
135
5.28
665
6.8
139.
54.
708
00
0.14
144
0.08
310
0.52
8031
0.56
289
12
1
GEF
US
Equ
ity
215.
457
177.
174
2,82
3.93
3,49
8.45
117
2.34
10
095
3.06
63,
161.
190.
3014
913
45.1
383,
852.
860.
3491
270
1,14
9.22
781.
358
1.47
11,
305.
3492
9.76
81.
404
01
0.20
328
0.18
860
1.22
5788
1.21
424
03
2
CM
P U
S Eq
uit
y15
0.6
149
1,00
3.80
1,11
4.30
125
2.3
10
148
2.5
1,05
9.05
0.45
5597
326.
71,
159.
900.
2816
621
521.
418
2.6
2.85
551
5.8
326.
81.
578
00
0.29
460.
2802
01.
0648
540.
9922
80
43.
5
RP
M U
S Eq
uit
y17
9.91
821
1.93
3,33
7.37
3,15
5.76
116
5.08
21
10
922.
463
3,22
7.96
0.28
5773
1,09
2.45
3,29
3.89
0.33
1661
01,
522.
3760
0.24
12.
536
1,72
1.21
652.
782.
637
10
0.41
475
0.41
110
1.07
7184
1.03
808
04
3.5
MLM
US
Equ
ity
98.8
2679
.616
3,23
9.28
3,07
4.74
125
9.09
41
01
782.
045
3,15
7.01
0.24
7717
1052
.902
3,11
1.28
0.33
8414
069
6.21
138
5.49
31.
806
657.
8517
3.71
23.
787
10
0.19
465
0.17
620
0.51
0263
0.55
739
15
7.5
OLN
US
Equ
ity64
.824
1.7
1,93
2.00
2,04
8.70
121
5.9
11
041
8.2
1,99
0.35
0.21
0114
524.
22,
249.
150.
2330
660
882.
839
12.
258
780.
339
9.1
1.95
50
00.
1488
10.
1974
10.
8208
590.
9572
41
57.
5
RK
T U
S Eq
uit
y230.
714
62,
884.
402,
914.
901
461.
71
01
897.
32,
899.
650.
3094
5133
02.5
6,74
0.45
0.48
9952
070
963
1.2
1.12
322
28.9
1318
.31.
691
10
0.23
992
0.18
370
1.04
0563
1.85
241
15
7.5
RS
US
Equ
ity
197.
849
349.
24,
306.
784,
668.
891
234.
51
10
855.
085
4,48
7.84
0.19
0534
1319
5,13
7.40
0.25
6745
01,
700.
9050
8.59
53.
344
2,27
4.70
576.
43.
946
10
0.23
196
0.22
780
1.46
5782
1.74
232
15
7.5
UFS
US
Equ
ity6
0536
56,
519.
006,
026.
001
883
10
182
56,
272.
500.
1315
2783
75,
947.
500.
1407
310
2,00
0.00
725
2.75
91,
934.
0071
62.
701
00
0.17
744
0.18
981
0.89
7377
0.93
131
57.
5
VA
L U
S Eq
uit
y22
2.05
6-1
38.6
013,
511.
023,
867.
940
291.
174
10
194
3.21
63,
689.
480.
2556
567
9.80
53,
684.
040.
1845
271
1,28
4.92
884.
851
1.45
21,
325.
1412
59.9
331.
052
01
0.33
213
0.31
160
0.91
9016
1.02
198
15
7.5
ASH
US
Equ
ity
8856
9,60
7.00
9,53
0.00
124
51
01
1,10
8.00
9,56
8.50
0.11
5797
3,64
8.00
11,2
48.0
00.
3243
240
2,83
3.00
1,68
7.00
1.67
93,
387.
001,
739.
001.
948
11
0.28
166
0.24
790
0.59
7585
0.68
227
16
14.5
CB
T U
S Eq
uit
y143
205
2,67
6.00
2,88
6.00
119
51
10
600
2,78
1.00
0.21
575
556
3,01
3.50
0.18
4503
11,
438.
0053
92.
668
1,55
5.00
656
2.37
01
0.19
0.18
01.
0149
481.
0748
41
614
.5
CM
C U
S Eq
uit
y-1
66.4
88-1
29.4
273,
687.
563,
706.
150
27.7
471
11
1,19
7.28
3,69
6.85
0.32
3865
1,16
7.50
3,69
4.64
0.31
5997
12,
175.
211,
102.
961.
972
2,32
6.25
1,19
8.85
1.94
00
0.06
264
0.07
791
1.71
0103
2.13
656
16
14.5
CR
S U
S Eq
uit
y25
102.
21,
508.
301,
630.
001
100.
51
10
159.
11,
612.
100.
0986
9140
7.4
1,79
0.60
0.22
7522
081
8.7
325.
22.
518
1,03
4.80
305.
93.
383
10
0.13
225
0.17
61
0.94
7026
1.1
16
14.5
MTX
US
Equ
ity
69.8
8670
.254
1,07
2.14
1,11
6.11
113
3.65
91
01
92.6
211,
094.
120.
0846
5385
.449
1,14
0.53
0.07
492
167
5.57
215
5.23
74.
352
720.
289
180.
902
3.98
20
10.
2087
0.20
310
0.93
4911
0.93
616
16
14.5
PK
G U
S Eq
uit
y20
5.43
515
8.02
72,
152.
842,
224.
271
345.
514
10
157
0.93
12,
188.
560.
2608
7181
4.56
22,
318.
390.
3513
490
798.
041
405.
558
1.96
881
2.06
337
6.5
2.15
71
10.
2185
10.
2068
01.
1313
461.
1779
61
614
.5
SLG
N U
S Eq
uit
y14
4.64
619
3.17
32,
214.
352,
176.
021
359.
582
11
189
0.72
52,
195.
190.
4057
6312
88.4
832,
577.
550.
4998
860
864.
495
413.
135
2.09
313
33.7
2359
5.48
92.
241
00.
1538
10.
1478
01.
3871
071.
6126
81
614
.5
SMG
US
Equ
ity
200.
512
1.9
2,22
0.10
2,16
4.00
112
2.1
10
143
6.7
2,19
2.05
0.19
922
791.
82,
108.
100.
3755
990
1,11
8.10
736.
81.
518
992.
5046
8.6
2.11
81
10.
3712
60.
3537
01.
3053
471.
3104
16
14.5
ATR
US
Equ
ity
173.
589
183.
631,
956.
192,
032.
721
261.
042
11
125
8.77
31,
994.
460.
1297
4625
4.91
2,09
6.01
0.12
1617
11,
063.
9842
3.32
22.
513
1,14
3.95
518.
849
2.20
50
10.
3360
70.
329
01.
0616
131.
1497
81
720
.5
NEU
US
Equ
ity
177.
125
206.
907
1,02
5.19
1,06
2.74
118
4.59
81
10
217.
544
1,04
3.97
0.20
8382
232.
601
1,12
7.20
0.20
6353
160
2.77
520
6.38
72.
921
679.
731
216.
024
3.14
71
10.
2867
80.
2601
01.
7532
252.
0226
51
720
.5
SON
US
Equ
ity
201.
474
218.
044
3,06
2.58
3,28
1.01
124
5.27
51
11
603.
941
3,17
1.80
0.19
041
1232
.966
3,63
3.59
0.33
9324
01,
157.
5278
0.64
91.
483
1,31
2.79
836.
483
1.56
91
10.
1861
10.
1682
01.
3466
171.
3712
17
20.5
WO
R U
S Eq
uit
y12
4.03
125.
51,
363.
831,
520.
351
153.
511
01
250.
2414
42.0
90.
1735
2625
0.25
1,59
3.80
0.15
7015
178
2.29
379.
80.
877
891.
6452
51.
698
11
14.4
114
.58
11.
6066
171.
4724
80
720
.5
ALB
US
Equ
ity
337.
359
464.
363
2,77
1.56
3,06
8.08
148
7.35
91
11
851.
927
2,91
9.82
0.29
1774
749.
257
3,13
5.95
0.23
8925
11,
348.
2036
4.17
73.
702
1,35
5.62
401.
178
3.37
90
10.
3157
0.34
061
0.85
2504
0.93
511
18
25
CYT
US
Equ
ity14
4.8
168.
43,
559.
403,
673.
901
211.
81
11
641.
53,
616.
650.
1773
7463
5.9
3,60
5.30
0.17
6379
11,
311.
4057
9.6
2.26
31,
287.
8052
1.9
2.46
81
10.
2318
50.
2291
00.
7721
250.
8364
71
825
IPI U
S Eq
uit
y45.2
8510
9.41
176
8.99
828.
884
117
3.86
91
11
00
00
120
8.82
245
.405
4.59
927
6.64
549
.675
5.56
91
00.
2952
10.
4204
10.
4672
410.
5344
18
25
STLD
US
Equ
ity
129.
599
265.
692
5,12
9.87
5,58
9.93
148
6.35
51
11
2,37
7.90
5,35
9.90
0.44
3646
1,93
6.02
5,78
4.58
0.33
4687
12,
000.
003,
458.
810.
578
2,45
5.26
3,60
8.63
0.68
10
0.1
0.11
151
1.23
1.43
18
25
SXT
US
Equ
ity
107.
144
120.
484
1,59
1.69
1,59
9.27
114
2.87
71
11
324.
361,
595.
480.
2032
9931
2.42
21,
626.
720.
1920
571
672.
305
205.
063
3.27
970
6.87
207.
275
3.41
10
0.30
746
0.31
431
0.83
4446
0.89
465
18
25
Not
e:
>0, zero otherwise; F_Accrual=1 if CFO>ROA, zero
otherwise; F_∆Margin=1 if Gross margin for FY 2011
is great than that of FY 2010, zero otherwise;
F_∆Turn=1 if FY 2011 assets turnover is greater than
that of FY 2010, zero otherwise; F_∆Lever=1 if long-
term debt ratio declined, zero otherwise; F_∆Liquid=1
if firm‟s current ratio in FY 2011 was higher than in
2010; EQ_Offer=1 if did not issue any equity in 2011,
zero otherwise. F-Scores for each company are
presented to the left.
8. External financing screens.
We estimated ∆Xfin as ∆Debt+∆Equity, where:
Firms with lower levels of ∆Xfin were allocated
higher ranks.

Oleksandr Matviienko, Soufianne Ayoche, Huizhong Li
Materials, 2012
81
Company XFIN Rank
Scotts Miracle-Gro Company -0.0945 27
Domtar Corp. -0.09204 26
Cytec Industries Inc -0.07954 25
Minerals Technologies Inc -0.05486 24
Albemarle Corp. -0.03335 23
Valspar Corp. -0.02573 22
Louisiana Pacific Corp. -0.02183 21
Sensient Technologies Corp. -0.01427 20
Aptargroup Inc -0.01373 19
Compass Minerals International Inc -0.00153 18
Newmarket Corp. -0.00015 17
Martin Marietta Materials Inc 0.010066 16
Intrepid Potash Inc 0.014498 15
Steel Dynamics Inc 0.02612 14
Cabot Corp. 0.031427 13
Olin Corp. 0.042612 12
Commercial Metals Company 0.042675 11
Packaging Corp. Of America 0.067721 10
Worthington Industries Inc 0.107839 9
Reliance Steel And Aluminum Company 0.117101 8
RPM International Inc 0.143618 7
Greif Inc 0.149504 6
Sonoco Products Company 0.154771 5
Silgan Holdings Inc 0.23505 4Carpenter Technology Corp. 0.312189 3
Ashland Inc 0.348668 2
Rock-Tenn Company 1.835878 1
Note:
Current holdings

Oleksandr Matviienko, Soufianne Ayoche, Huizhong Li
Materials, 2012
82
Appendix B.
1. Management Quality Screening Results:
Company
CEO duration,
months
CFO duration,
months Sum Score
Greif Bros Corp A 5 16 21 1
Albemarle Corp 7 16 23 2
AptarGroup Inc 4 31 35 3
Valspar Corp 10 38 48 4
Commercial Metals Co 6 44 50 5
Minerals Technologies Inc 49 16 65 6
Carpenter Technology Corp 21 45 66 7
Cytec Industries Inc 28 47 75 8
Cabot Corp 40 38 78 9
Intrepid Potash Inc 41 37 78 10
Steel Dynamics Inc 4 80 84 11
Louisiana Pacific Corp 88 4 92 12
Martin Marietta Materials 28 82 110 13
Domtar Corp 28 83 111 14
Ashland Inc 102 34 136 15
Silgan Holdings 61 80 141 16
Packaging Corp of America 21 145 166 17
Scotts Co A 119 55 174 18
Compass Minerals International 72 112 184 19
NewMarket Corp 118 82 200 20
Sonoco Products Co 129 72 201 21
Olin Corp 124 82 206 22
Worthington Industries Inc 175 40 215 23
RPM International Inc. 114 114 228 24
Rock-Tenn 138 127 265 25
Reliance Steel & Aluminum 144 144 288 26
Sensient Technologies Corp 174 129 303 27
Note:
Current holdings

Oleksandr Matviienko, Soufianne Ayoche, Huizhong Li
Materials, 2012
83
2. Technical and Expansion Effort Screening Results:
Company CAPEX, mln
Mkt Cap,
mln
(CAPEX/Mkt
Cap)/Average Sub-
Industry CAPEX/Mkt Cap Score
Worthington Industries Inc -22.03 1565.86 13.09% 1
RPM International Inc. -39.83 3068.63 19.79% 2
Carpenter Technology Corp -79.6 2544.11 29.11% 3
Valspar Corp -66.47 3352.04 30.24% 4
NewMarket Corp -53.52 2655.63 30.73% 5
Reliance Steel & Aluminum -156.4 3652.12 39.84% 6
Louisiana Pacific Corp -21.4 1106.72 44.81% 7
Commercial Metals Co 73.22 1357.2 50.19% 8
Martin Marietta Materials -155.36 3448.2 51.35% 9
Steel Dynamics Inc -167.01 2878.19 53.98% 10
Sensient Technologies Corp -72.2 1891.85 58.20% 11
Scotts Co A -72.7 2711.68 58.86% 12
Albemarle Corp -190.57 4576.2 63.51% 13
AptarGroup Inc -179.69 3438 65.51% 14
Sonoco Products Co -173.37 3302.95 66.21% 15
Rock-Tenn -199.4 3430.38 73.32% 16
Minerals Technologies Inc -52.06 998.04 79.55% 17
Silgan Holdings -173.01 2700.31 80.30% 18
Ashland Inc -201 3442.92 82.71% 19
Cytec Industries Inc -116.5 2031.97 87.43% 20
Domtar Corp -144 3398.84 88.60% 21
Greif Bros Corp A -165.87 2108.82 98.58% 22
Compass Minerals International -107.4 2273.65 121.36% 23
Packaging Corp of America -280.21 2481.66 142.42% 24
Intrepid Potash Inc -137.11 1701.95 176.85% 25
Olin Corp -200.9 1573.97 180.83% 26
Cabot Corp -230 1582.47 205.91% 27
Note:
Current holdings

Oleksandr Matviienko, Soufianne Ayoche, Huizhong Li
Materials, 2012
84
3. Cost Control Screening Results:
Company Gross Margin
Gross margin/ Average
Sub-Industry GM Score
Louisiana Pacific Corp 8.31 0.487962419 1
Martin Marietta Materials 17.62 0.589100635 2
Commercial Metals Co 7.76 0.645054032 3
Silgan Holdings 14.78 0.719922065 4
Domtar Corp 18.98 0.735089078 5
Cabot Corp 17.99 0.780138768 6
Minerals Technologies Inc 20.31 0.804994055 7
Olin Corp 19.74 0.856027754 8
Sonoco Products Co 16.82 0.906738544 9
Compass Minerals International 28.02 0.907971484 10
Cytec Industries Inc 22.91 0.908045977 11
Greif Bros Corp A 18.86 0.918655626 12
Steel Dynamics Inc 11.15 0.926849543 13
Rock-Tenn 18.37 0.990296496 14
Scotts Co A 35.37 1.001415629 15
NewMarket Corp 26.01 1.030915577 16
Ashland Inc 24.79 1.075021683 17
Packaging Corp of America 20.68 1.114824798 18
Intrepid Potash Inc 42.05 1.190543601 19
Worthington Industries Inc 14.58 1.211970075 20
Carpenter Technology Corp 14.86 1.23524522 21
Sensient Technologies Corp 31.43 1.245739199 22
Valspar Corp 33.21 1.316290131 23
Albemarle Corp 34.6 1.371383274 24
AptarGroup Inc 32.9 1.602532879 25
RPM International Inc. 41.42 1.641696393 26
Reliance Steel & Aluminum 22.78 1.893599335 27
Note:
Current holdings

Oleksandr Matviienko, Soufianne Ayoche, Huizhong Li
Materials, 2012
85
4. Operational Efficiency Screening Results:
Company ROIC
ROIC/Average Sub-
Industry ROIC Score
Adjusted
Score
Ashland Inc 0 0 1 2.5
Commercial Metals Co 0 0 2 2.5
Louisiana Pacific Corp 0 0 3 2.5
Valspar Corp 0 0 4 2.5
Martin Marietta Materials 5.04 0.422110553 5 5
Compass Minerals International 17.39 0.563512638 6 6
Cytec Industries Inc 8.89 0.58679868 7 7
Olin Corp 8.52 0.597056762 8 8
Minerals Technologies Inc 9.53 0.629042904 9 9
Sensient Technologies Corp 9.69 0.63960396 10 10
RPM International Inc. 10.63 0.701650165 11 11
Rock-Tenn 7.45 0.726829268 12 12
Scotts Co A 14.94 0.802794197 13 13
Cabot Corp 12.07 0.845830413 14 14
Greif Bros Corp A 9.4 0.864765409 15 15
Intrepid Potash Inc 16.82 0.903815153 16 16
Domtar Corp 13.08 0.951272727 17 17
Sonoco Products Co 10.82 1.055609756 18 18
AptarGroup Inc 11.58 1.065317387 19 19
Silgan Holdings 12.76 1.173873045 20 20
Packaging Corp of America 12.43 1.212682927 21 21
Reliance Steel & Aluminum 8.61 1.38647343 22 22
Albemarle Corp 21.16 1.39669967 23 23
Worthington Industries Inc 8.91 1.434782609 24 24
Steel Dynamics Inc 9.08 1.46215781 25 25
Carpenter Technology Corp 10.72 1.726247987 26 26
NewMarket Corp 28.48 1.879867987 27 27
Note:
Current holdings