materials av~d methodsshodhganga.inflibnet.ac.in/bitstream/10603/70/22/09_chapter2.pdf · 2.1...
TRANSCRIPT

CHAPTER
2 Materials a v ~ d Methods
2.1 Materials used
2.1.1 Styrene-butadiene rubber
C t y r e n e Butadiene Rubber (SBR) marketed under the trade name
J s y n a p r e n e (SBR-1502) was obtained from Synthetics and Chemicals Ltd.,
Bareilley, situated at the state of Uttar Pradesh. 'l'he rubber used for the
present study was the technically specified form of the rubber. It is a
copolymer of styrene and butadiene, manufactured by cold emulsion
polymerisation system using fatty acid and rosin soap emulsifier. It is a
non-staining and non-discolouring cold SBR grade. l h e rubber from the
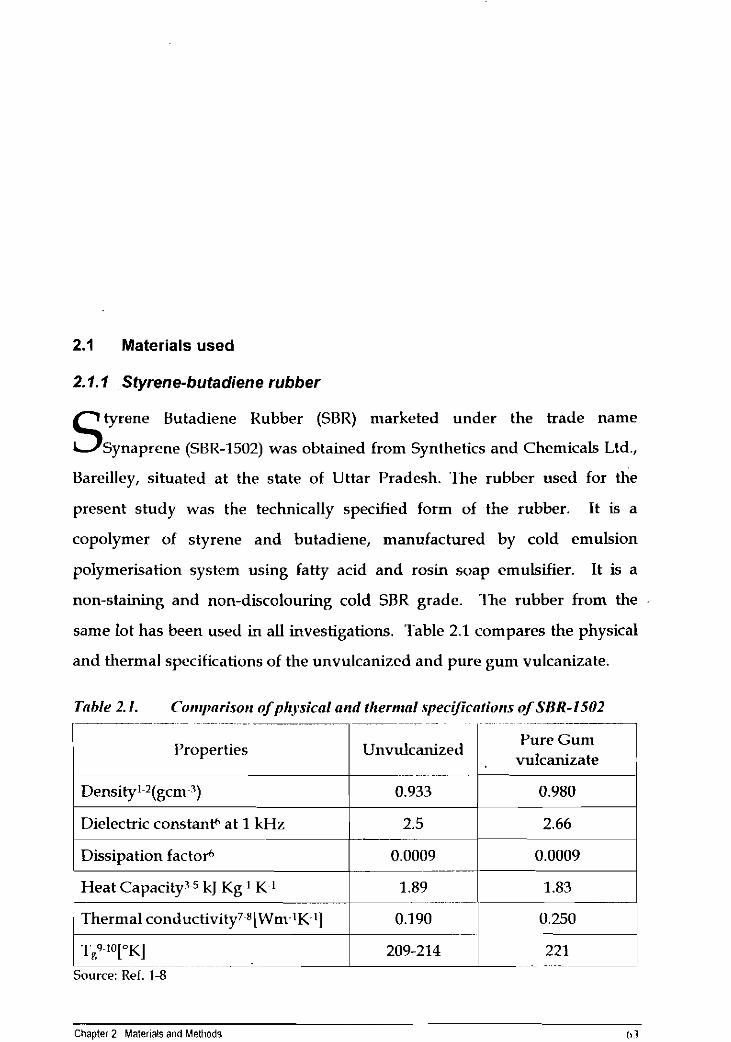
same lot has been used in all investigations. Table 2.1 compares the physical
and thermal specifications of the unvulcanized and pure gum vulcanizate.
Table 2.1. Cor~rpnrisor~ ofp11.ysicaI arid thermal spec~~cnfic~rrs of SBR-1502 - ~ ..~ .~ ~
1 -~ ~~~
IJure G u n ~ Properties Unvulcanized
vulcanizate
1 Dissipation factot* 1 0.0009 1 0.0009 1
Density1-2(gcm~3)
Dielectric constanth at 1 kHz
1 TR 1°I.KI Source: Ref. 1-8
0.933
2.5
Heat Capacity35 kJ Kg 1 K 1
1 Thermal cortductivity7 "[Wm 1K '1
Chapter 2 Materials and Methods I t 7
0.980
2.66
1.89 - --
0.190
1.83
0.250
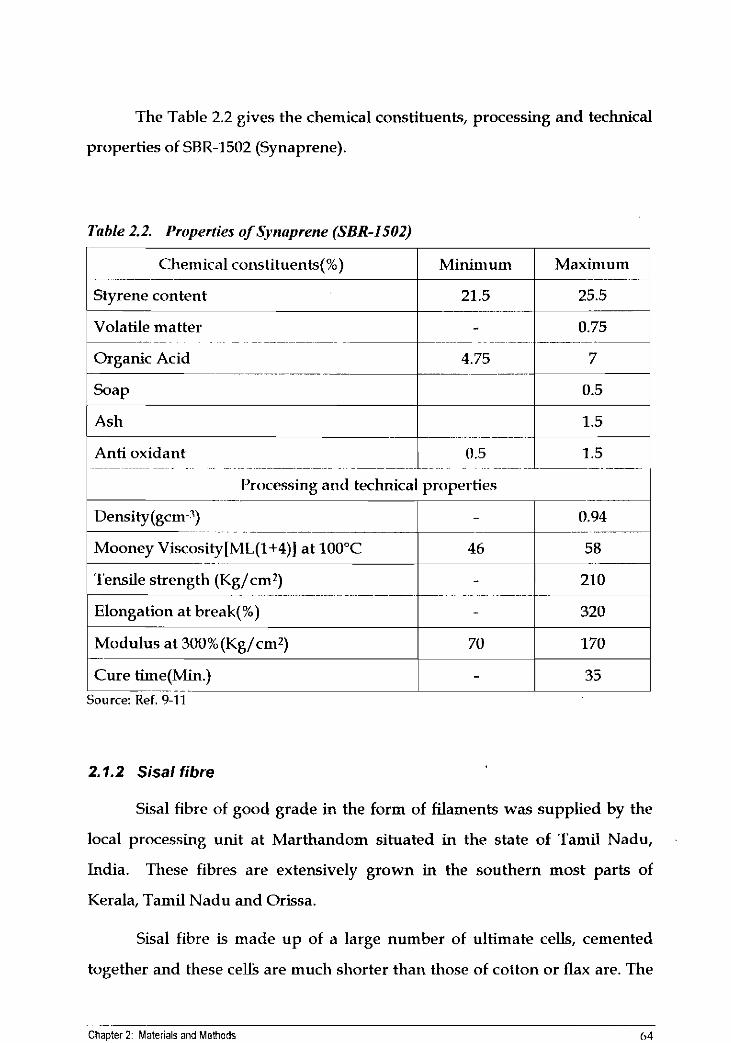
The Table 2.2 gives the chemical constituents, processing and technical
properties of SRR-1502 (Synaprene).
Table 2.2. Properties of Synaprene (SBR-1502)
1 Chemical cor~stituents(%) I Minimum I Maximum 1 1 Styrene content 1 21.5 1 25.5 1
1 Ash I I 1.5 1 Anti oxidant
- -~ - -~ - . .
I'rocessing and technical properties
- - - ~ ~ - ~~. ~. . ~ .~ ~- - . ... - -
Mooney Viscosity[ML(1+4)] at 100°C 46 58
Tensile strength (Kg/cm*)
Elongation at break(%)
1 Modulus at 300%(Kg/cm2) I 70 1 170 1 Cure time(Min.)
-.-- . - . - Source: Ref. 9-11
2.1.2 Sisal fibre
Sisal fibre of good grade in the form of filaments was supplied by the
local processing unit at Marthandom situated in the state of Tamil Nadu,
India. These fibres are extensively grown in the southern most parts of
Kerala, Tamil Nadu and Orissa.
Sisal fibre is made up of a large number of ultimate cells, cemented
together and these cells are much shorter than those of cotton or flax are. The
Chapter 2 Mater~als and Methods 64
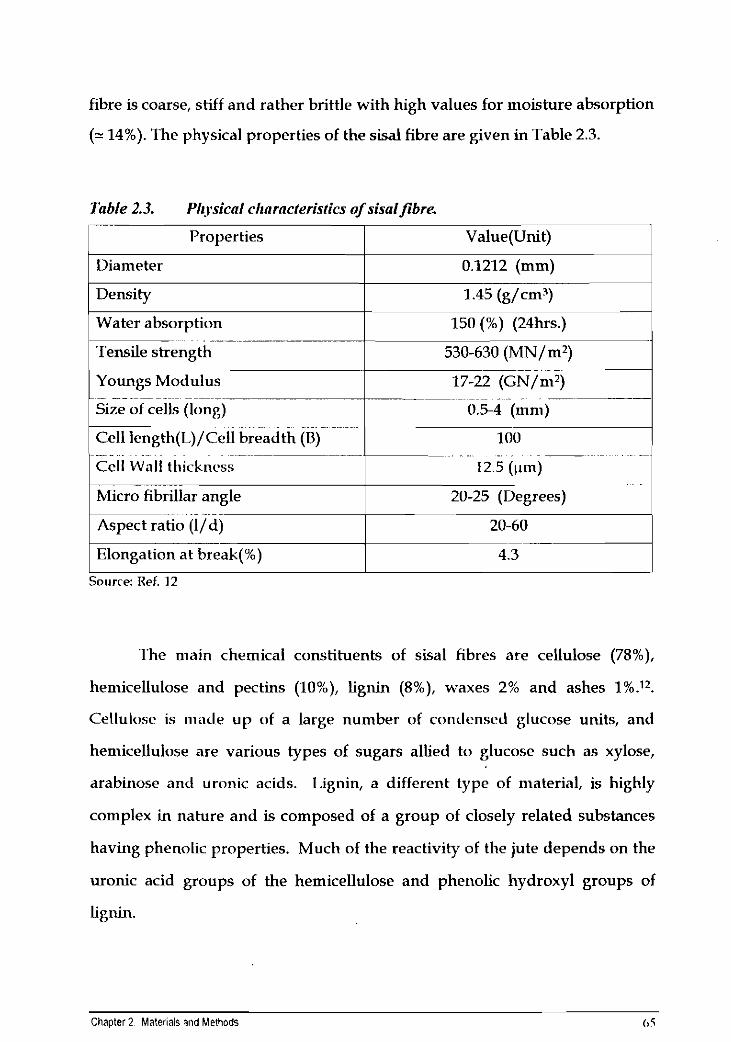
fibre is coarse, stiff and rather brittle with high values for moisture absorption
(- 14%). The physical properties of the sisal fibre are given in Table 2.3.
Table 2.3. Plt.ysicnl chnrncterisrics of sisaljibre
I Water absorption I 150 (%) (24hrs.) 1
r-- Properties
Diameter
Density
Value(Unit)
0.1212 (mm)
1.45 (g/cm3)
~ ..... ~~ .. . ~
Cell Wall ttiicknrss 12.5 (pm) ... .
Micro fibrillar angle 20-25 (Degrees)
~ . ~ . ~
Tensile strength
Youngs Modulus ~~ ~-
Size of cells (long) ~ ~ ~
Cell length(L)/Cell breadth (8)
Source: Ref. 12
-- - . . 17-22 (GN/m2) p-~-~~ ---- ~ . .
0.5-4 (mni)
The main chemical constituents of sisal fibres are cellulose (78%),
hen~icellulose and pectins (lo%), lignin (8%), waxes 2% and ashes 1%.12.
Cellulose is matlr up of a large number of conclensrcl glucose units, and
hemicellulose are various types of sugars allied to glucose such as xylose,
arabinose and uronic acids. Lignin, a different type of material, is highly
complex in nature and is composed of a group of closely related substances
having phenolic properties. Much of the reactivity of the jute depends on the
uronic acid groups of the hemicellulose and phenolic hydroxyl groups of
lignin.
Chapter 2 Mater~als and Memods 0 5
2.1.3 Rubber chemicals
Crosslinking agent-sulphur (p = 2.05), accelerator-CBS (p = 1.30),
antioxidant-'I'DQ (p = 1.08) were of commercial grade obtained from the
Alkali and Chemicals Corporation of India Ltd., Rishra.
2.1.4 Special chen~icals
Resorcinol (p = 2.36) and hexamethylene tetramine (p = 1.33) were of
chemically pure grade supplied by E.Merck (A.G) M&B, U. K. respectively.
Precipitated silica (Vulcasil-S) (p = 1.95) was supplied by Bata India Ltd.,
Calcutta, India.
2.1.5 Other chemicals
Zinc oxide (p = 5.5) and stearic acid (p= 0.92) were of chemically pure
grade.
2.1.6 Solvents
Benzene, toluene, xylene used were of analytical grade.
2.2 Surface modification of fibres
2.2.1 Pre-treatment of fibres
The treatment of fibres enhances the interfacial adhesion between the
fibre and the rubber matrix and it reduces the fibre-fibre hydrogen bonding
by sufficient wetting. Interface is a region of at least several molecular layers
thick whose properties are intermediary between the fibre and matrix phases
because of the peculiar restrictions in its molecular motion in this zone.
Matrix molecules may be anchored to the fibre surface by chemical reaction or
Chapter 2 Materials and Methods 66
absorption, which determines the extent of interfacial adhesion. The interface
may be composed of an additional constituent that is added to the composite
as a bonding agent or as an interlayer between the two components of the
composite. The interfacial adhesion can be improved by two Cvays. This is
done by the formation of an interlayer pre-treatment or chemical modification
of the fibre surface and the incorporation of a bonding agent.
Here we have included pre-treatments like, hydration, salt water,
benzene-alcohol mixture, SBl7 solution and PSMA coating to enhance the
interfacial interaction.
Secondly, the surface modification of the fibres can be done with
chemical treatments following chemical reactions without destroying the
fibrous nature. ?he different surface modifications carried out in our present
work include mercerisation, acetylation, benzoylation, peroxide treatment,
and permanganate treatment.
Lastly, the incorporation of a bonding system during the mixing
process was also adopted.
(a) Water treatment
Short sisal fibres were immersed in water at 25'C for 1 hour. After
that, these fibres were washed several times with water in order to remove
the easily extractable impurities from the surface of the fibres. ?he fibres
were dried in an air oven at 70°C for two days and kept in polythene bags to
prevent the moisture absorption.
(b) Benzene-alcohol mixture
'I'he alkali treated fibres were refluxed with 1:l benzene-alcohol
mixture for 1 hour by using fractional distillation in soxhlet apparatus. 'I'he
resulting fibres were taken and air-dried and used for compounding.
Chapter 2. Mater~ais and Methods 67
(c) Salt water treatment
A 10% solution of NaCl is prepared and the untreated fibres were
soaked in the salt water for 1 hour. These fibres were taken out and dried in
air oven.
(d) SBR solution lreall~lent
The raw rubber solution (1%) is prepared by boiling SBR in toluene.
The alkali treated fibres were soaked in the resulting rubber solution and is
kept for 30 minutes. Then these fibres were taken out, air-dried and kept in
polythene bags.
(e) PS-MA coating
A 5% solution of polystyrene-maleic anhydride copolymer is prepared
and the untreated fibres were refluxed for 1 hour. 'l'he resulting mixture was
decanted to take out fibres and they were dried.
2.2.2 Methods of chemical modification
(a) Mercerisation
Untrmtcd short fibres of length 6 nlm were imn~ersed in 18% solution
of caustic soda at 28°C for 1 hour. These fibres were washed several times
with cold water and finally with acidified water (ElCl 0.1N). These fibres
were dried in an air oven and then soaked in glacial acetic acid for 1 hour at
the same temperature.
(b) Acetylation
Acetylated fibre was prepared from the chopped raw sisal fibre as per
the methods reported by Chand et al.17. The fibre was first immersed in 18%
Chaoter 2 Mater~als and Methods 68
aqueous NaOH solution at 35°C for one hour, washed with water several
times and then drird. The fibres were soaked in glacial acetic acid for one
hour, decanted and then soaked in acetic anhydride containing two drops of
Con. I12S04 for 5 minutes. The fibres were filtered through a Buchnor
funnel, washed with water and then dried in an oven at 70°C for 24 hours.
(c) Benzoylation
Untreated fibres were soaked in 18% NaOH solution for */2 hour,
filtered and washed with water. Then it was suspended in 10% NaOH
solution and agitated with 50 ml benzoyl chloride. The mixture was kept for
15 minutes, filtered, washed thoroughly with water and dried between filter
paper. These fibres were then soaked in ethanol for 1 hour to remove the
u ~ e a c t e d benzoyl chloride and was finally washed with water and dried in
the air oven at 70°C.
(d) Benzoyl peroxide treatment
The alkali treated fibres (20 g) were soaked with 6% solution of benzoyl
peroxide in acetone for 30 minutes. The solution was decanted and the fibres
were air-dried.
(e) Per~nanganate treatment
The alkali treated fibres (20 g) were soaked with KMnOa solution in
acetone for 1 minute. This was then decanted and the fibres were dried in air.
2.2.3 Incorporation of dry bonding system
A two component dry bonding system consisting of hexamethylene
tetramine and resorcinol are used as the bonding agent. The resorcinol was
Chapter 2: Mater~als and Melhods (19
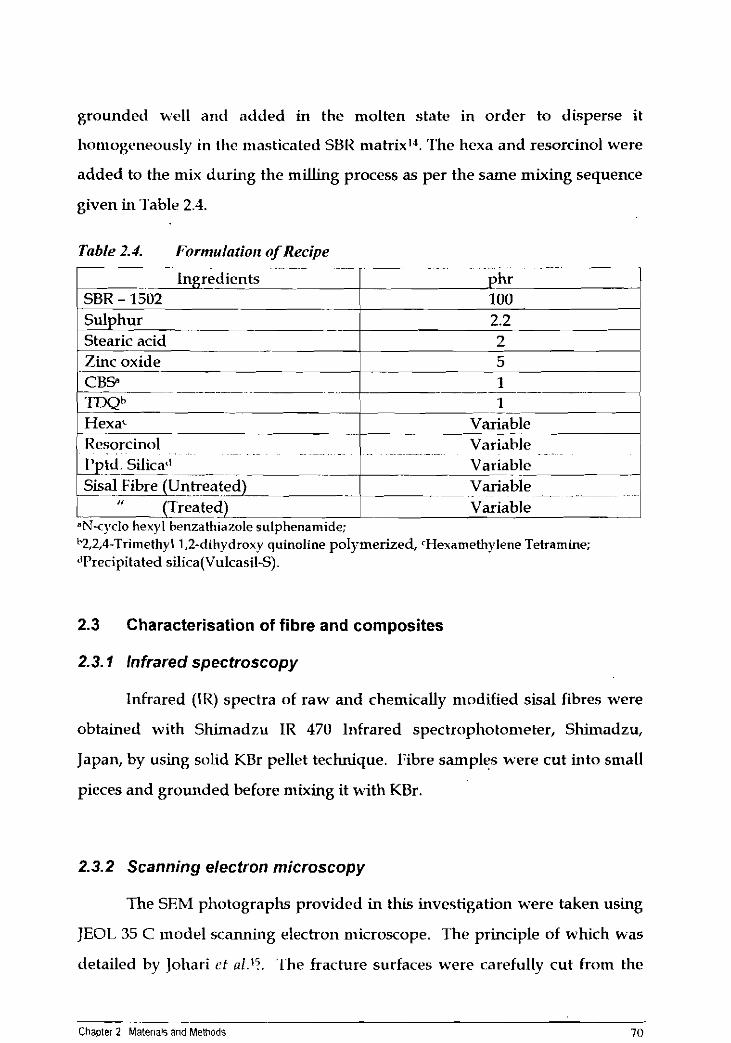
grounded well and added in the molten state in order to disperse it
homogeneously in the masticated SBIZ matrix'J. ?'he hexa and resorcinol were
added to the mix during the milling process as per the same mixing sequence
given in Table 2.4.
Table 2.1. Formulariorl of Recipe ~ ~ . ~ - ~ - ~ ~
Ingredients phr
.&
100
. .~ ~~~ . .- ~ .~ ~ ... ~~
Variable Variable . -- 1 Variable ~ ~ ~ -- ~ ~ ~
Variable 'N-cyclo hexyl benzathiazole sulphenamide; ",2,4-Trimethyl 1,2-dihydroxy quinoline polymerized, <Hexamethylene Teh.amine; dPrecipitated silica(Vulcasil-S).
2.3 Characterisation of fibre and composites
2.3.1 Infrared spectroscopy
Infrared (I[<) spectra of raw and chemically modified sisal fibres were
obtained with Shinladzu IR 470 lnfrared spectrophoton~eter, Shimadzu,
Japan, by using solid KBr pellet technique. Fibre samples were cut into small
pieces and grounded before mixing it with KBr.
2.3.2 Scanning electron microscopy
The SElvl photographs provided in this investigation were taken using
JEOL 35 C model scanning electron microscope. The principle of which was
detailed by Johari r t n1.15. 'lhe fracture surfaces were carefully cut from the
Chapter 2 Malerlals and Methods 70
failed test specimens without touching the surface and were sputter coated
with gold within 24 hours. ' f ie fractured speci~nens and the gold-coated
samples were stored in a dessicator till the SEM observations were made.Ih
2.3.3 Optical microscopy
An optical stereo microscope was used for calculating fibre length
distribution in SBR matrix and also for observing the die swell behaviour of
extrudates and restricted equilibrium swelling behaviour of sisal fibre
reinforced composites.
2.4 Preparation of composites
2.4.1 Fibre preparation
l'he raw sisal fibres were chopped to different lengths viz., 2, 6 and
10 mm and washed with water to remove the undesirable materials. Then
these fibres were dried in an air oven at 70°C for 5 h. and it was then kept in
polythene bags to prevent moisture absorption before mixing.
2.4.2 Compounding
Mixes were prepared on a laboratory size two roll-mixing mill (300 x
150 mm) at a friction ratio of 1:1.25 in the case of ,SBR. SBR was first
masticated to attain plasticity by careful control of temperature, nip gap, time
of mastication and by uniform cutting operation. The compounding
ingredients were added in the following order as per ASI'M designation
D15-62T, cross-linking agent, activators, silica, accelerators and antioxidants.
Before the addition of fibres, the batch was tliorougldy cooled. In the case of
sisal-SBR compounds, in order to ensure better dispersion, sisal fibre was
mixed at the end of the sequence with the rubber compound after the
Chapter 2. Matertals and Methods 71
addition of all ingredients. Stearic acid was mixed in its molten state after the
addition of cross-linking agent.
After the complete mixing, the stock was sheeted out and passed
through the tight nip six times endwise and finally sheeted out at tight nip
gap to ensure maximum fibre orientation in the grain direction'7. The
compounded stock was kept overnight before vulcanization. ?he total time
of mixing and roll temperature (70-80°C) were kept constant throughout the
study. When sulphur was incorporated at the initial time of mixing, the
temperature of the mix was kept at 35 - 40°C since it is the cross-linking agent
used in the system.
All ingredients were added in the masterbatch form. The quantity of
ingredients in phr (parts per hundred rubber) and the sequence of addition of
ingredients are given in Table 2.4.
2.4.3 Vulcanization
Vulcanization was carried out in an electrically heated press having
(30 x 30) cm platens at 150°C and at a pressure of 45 Kg/cm? on the mould at
respective optimum cure times as obtained from the Monsanto Rheometer
R-100. Moulds were cooled quickly in water at the end of curing cycle and
stored in a cold and dark place for 24 hours and were used for subsequent
physical tests and chemical analysis. For thicker sanlples having thickness
more than 6mrn(like heat build-up, compression set and abrasion) additional
time based on the sample thickness were used to obtain satisfactory
mouldings.
In order to preparc samplcs with fibres oriented longitudinally, the
compounded sheet was folded along the grain direction and placed in the
mould. Similarlv, for samples w+th fibres oriented transversely, the sheet was
folded across the grain direction.
Chapter 2 Mater~als and MeLhods 72
2.4.4 Fibre breakage and fibre length distribution
Shear forces occurred during milling operations have oriented most of
the fibres along the grain direction, but this also caused fibre breakage. In
order to study the extent of fibre breakage, the fibres were extracted from the
green compound by dissolving the rubber compound in toluene and their
length and diameter were measured by using a travelling microscope. 'I'he
distribution of fibre lengths in the mixes is calculated based on 100 fibres from
the chopped raw fibres before mixing and after extraction from the milled
compound.
The distribution of fibre lengths can be represented in terms of
moments of the distributionlR~'9.
The number and weight average fibre lengths can be defined as
where L, is the number average fibre length, i,, the weight average fibre
length, and Ni, the number of fibres having length Li. ?he value of L,/L,,, the
polydispersity index, can be taken as a measure of fibre length distribution. -
The values of L,, L, and L,/ in are calculated based on 100 fibres for the
chopped sisal fibres and fibres extracted from the mix.
2.4.5 Time of optimum cure
Optimuni cure times at 150°C were detrrmined with the help of
Monsanto Ilheometer (11-100). 'l'he optimum cure time corresponds to the
time to achieve 909'0 (tw) of the cure calculated from the formula,
Chapter 2: Materials and Methods 73
where MH and ML are the maximum and minimum torques respectively
expressed in dNm.
2.5 Analysis of composite properties
'I'he mechanical properties of the untreated, treated and bonding agent
incorporated short sisal fibre reinforced SBR composites were evaluated here.
2.5.1 Physical and mechanical analysis
At least 4 specimens per sample were tested for each property and the
mean of these values was reported. Except hardness and resilience, the tests
were carried out both along and across the grain direction. The fibre
orientation was maximum along the grain direction. In the case of hardness
and resilience, the direction of fibre alignment is normal to the direction of
application of the load.
(a) Green strength
Green strength was determined by using a method developed by
Foldi.20. The green strength of the uncured 2mm thick composites, i.e., tensile
properties of uncured 'green' samples were measured in Zwick Tensile
Testing Machine at a strain rate of 50 cm/min. 'Ihe surface tack was
eliminated by 'surface precuring' (pressing the sample at 120°C for two
minutes between two sheets of aluminium film in an electrically heated
hydraulic press). For practical reasons 'green strength' was defined as stress
at the yield poult.
(b) Mill shrinkage
The mill shrinkage was determined by ASTM D 1917-891' method. The
compounded stock was milled for 1 min. The mill roll was opened slowly
Chapter 2: Materials and Methods 74
and evenly until the band has just disappeared. 'I'he three specimens of
approximately 2 cm. width, one from the centre and one half way between
the centre and each edge were cut while mill was running. Care was taken
not to stretch the sample. Four specimens were placed on a smooth, well-
dusted surface with the inside or smooth surface down. The specimens were
then placed in oven at 100°C for an hour. Final length was measured after
cooling at 25°C for an hour.
The mill shrinkage, reported in percentage was calculated according to
the following equation:
- C - L Shrinkage (%) - - x 1 0 0
"
where, C, the c i~~cun~fe re~~ce of the mill rolls (47.88 c ~ n ) and I., the average
length of three specimens.
(d) Fibre orientation
Fibre orientation was evaluated from the scanning electron
microscopic technique. The photographs of the fractured ends clearly
identified the fibre orientation in the composite whether it is longitudinal or
transverse.
(e) Tensile strength and elongation at break
In this investigation, these tests were carried out according to ASTM
Designation 0 412-51'1' using dumbbell specimens. All the above tests were
carried out at 26 k 2°C. Samples were punched from vulcanized sheets both
along and across the grain direction using a dumbbell die (C-type). The
thickness of the narrow portion was measured by bench thickness gauge.
Two marks were made, one inch apart, in the middle of the narrow portion.
The sample was held tight by the two grips in a 'Zwick (1475)' Universal
'resting Machine, the upper grip of which being fixed. 'I'he rate of separation
of the power-actuated grip was 50cms per minute. The load at break was
read from the dial. The elongation at break was measured with the help of a
scale. From the recorded loads, the stress was calculated on the basis of
original cross-sectional area.
The tensile strength is reported in MPa. (Conversion factor: 1 MIJa =
10.197 Kgf/cm* = 1 N/mm2 = 1 M N/m2 and the Elongation at break (%) is
reported in percentage.
Stress-strain curves were obtained using Zwick-1475 (UTM) at a
crosshead speed of 500 nini/min.
(f) Tear resistance
The tear strength was calculated as per the ASIM method D 624 - 48.
The test pieces were cut from the vulcanized sheets both along and across the
grain direction unnicked at 90° angle. The test was carried out on a 'Zwick-
1475' (UTM). 'I'he speed of extension was 50cnis per minute and the
temperature was kept 26 f 2°C. 'The tear strength can also be calculated
according to the following equation:
Ultimate Load (N) Tear Strength (kN/rn) = -- P 5 )
'1 hickness (nin~)
The tear strength has been reported in kN/m. ' (Conversion factor:
Ilkg/cm = 0.98 kN/m).
(g) Hardness
Shore A type Durometer was eniployed to find out the hardness of the
vulcanizates. The instrument uses a calibrated spring to provide the indenting
force. The load inlposed by the spring varies with indentation. Readings
-- Chapter 2: Mater~ais and Methods 76
were taken after 15seconds of the indentation when firm contact has been
established with thc specinlens. 'lhc method employed is the same as that in
ASTM D 676 - 52 T. In this case, the direction of application of load is normal
to the fibre orientation.
(h) Rebound resilience
Dunlop Tripsometer (BS 903, Pt.22,1950) was used to measure rebound
resilience. The sample was held in position by suction. It was conditioned by
striking with the indentor six times. The temperature of the specimen holder
and sample was kept constant at 35'C. Rebound resilience was calculated as
follows:
1 - Cos 0 2 Rebound resilience (%) = x 100
where 02 and 01 are the final and initial rebound angles respectively. 81 was
fixed at 45' in all tests.
2.5.2 Melt flow studies
The rheological studies of untreated and treated short sisal fibre
reinforced SBR conlposites were carried out using an Instron Capillary
Rheometer Model 32112'. It is an extrusion barrel assembly, consisting of a
hardened steel barrel enclosed in an aluminium jacket to which electrical
heating elements are clamped. The system has a tungsten carbide capillary
inserted in the bottom end. A plunger is driven into this barrel at a constant
speed and the force needed to drive the plunger is measured and registered
on the front panel of the rheometer; or recorded on a chart recorder, which is
an optional accessory. 'l'he barrel heating elements are supplied with A/c
mains through thyristors. 'lhe temperature control is achieved by comparing
the barrel temperature virith that set on digital thumbwheels, the difference
.- Chapter 2 Mater~als and Memads 77
level being used to create pulse trains which trigger the thyristors to reduce
the error. A capillary of l /d ratio 20 and an angle of entry 90" were used in all
experiments. All studies were done in the shear range of 3.68 - 1226.9 Sec-',
due to the instrument limitations.
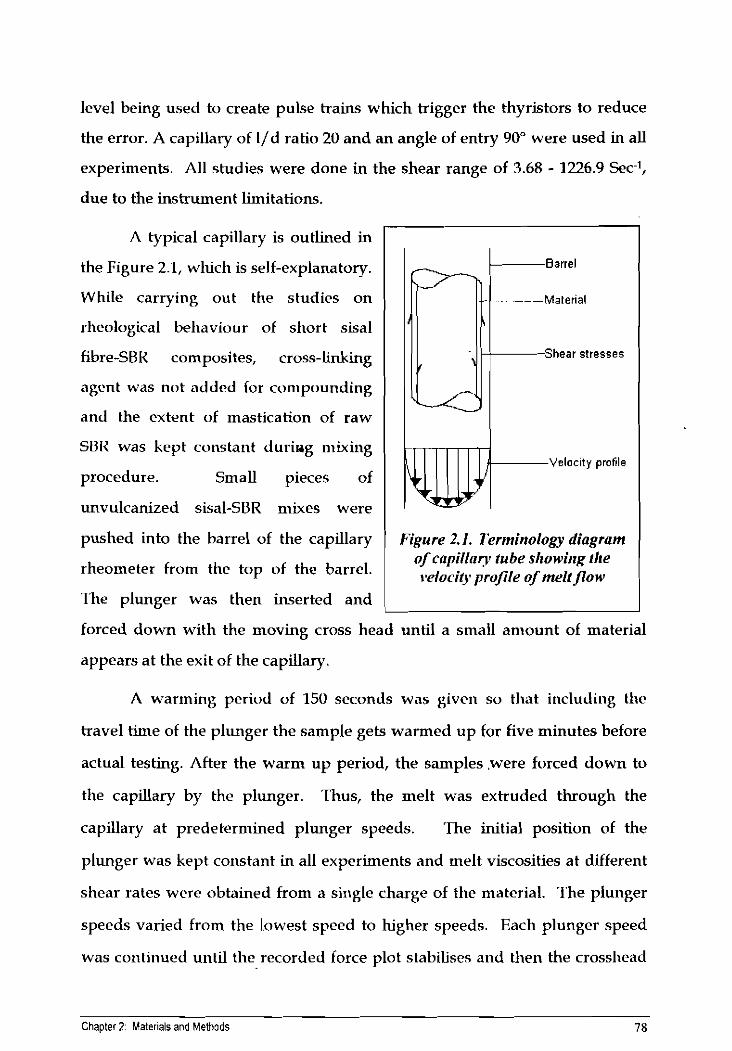
A typical capillary is outlined in
the Figure 2.1, wluch is self-explanatory.
While carrying out the studies on
rheological bel~aviour of short sisal
fibre-SBR composites, cross-linking
agent was not added for compounding
and the extent of mastication of raw
SUR was kept constant durisg mixing
procedure. Small pieces of
unvulcanized sisal-SBR mixes were
Barrel
Material
Shear stresses
pushed into the
rheo~neter from
The plunger was then inserted and ( I forced down with the moving cross head until a small amount of material
appears at the exit of the capillary.
barrel of the capillary
the top of the barrel.
A warming period of 150 scconds was given so that including the
travel time of the plunger the sample gets warmed up for five minutes before
Figure 2.1. Terminology diagrnm of capillary tube sltowirz~ rlte t*elocity proJile of melt pow
actual testing. After the warm up period, the samples .were forced down to
the capillary by the plunger. Thus, the melt was extruded through the
capillary at predetermined plunger speeds. The initial position of the
plunger was kept constant in all experiments and melt viscosities at different
shear rates were obtained from a single charge of the material. l'he plunger
speeds varied from the lowest speed to higher speeds. Each plunger speed
was continued until the recorded force plot stabilises and then the crosshead
Chapter 2: Mater~als and Methods 78
was stepped to the next speeds. Six speeds, generally 0.06, 0.2, 0.6, 2, 6 and
20 cni/min rcspcctively, of the crosshead were repeated and it was observed
in almost all the cases that reproducibility is acceptable.
The rheological analysis was done at different temperatures such as 90,
100, 110, 120 and 130°C. The temperature controllers were arranged to
maintain a gradation in barrel temperature, the highest being the lower zone
where the capillary was placed. The difference between the successive
temperature zones in the barrel was kept at 5OC, i.e., for a test temperature of
90°C, the middle zone was kept at 85OC and the upper zone at 85°C. The
temperature of the lower zone is reported. The temperature inside the barrel
and capillary was varied between 90 - 130°C, with an accuracy of 1°C. The
experiments were carried out at six different shear rates.
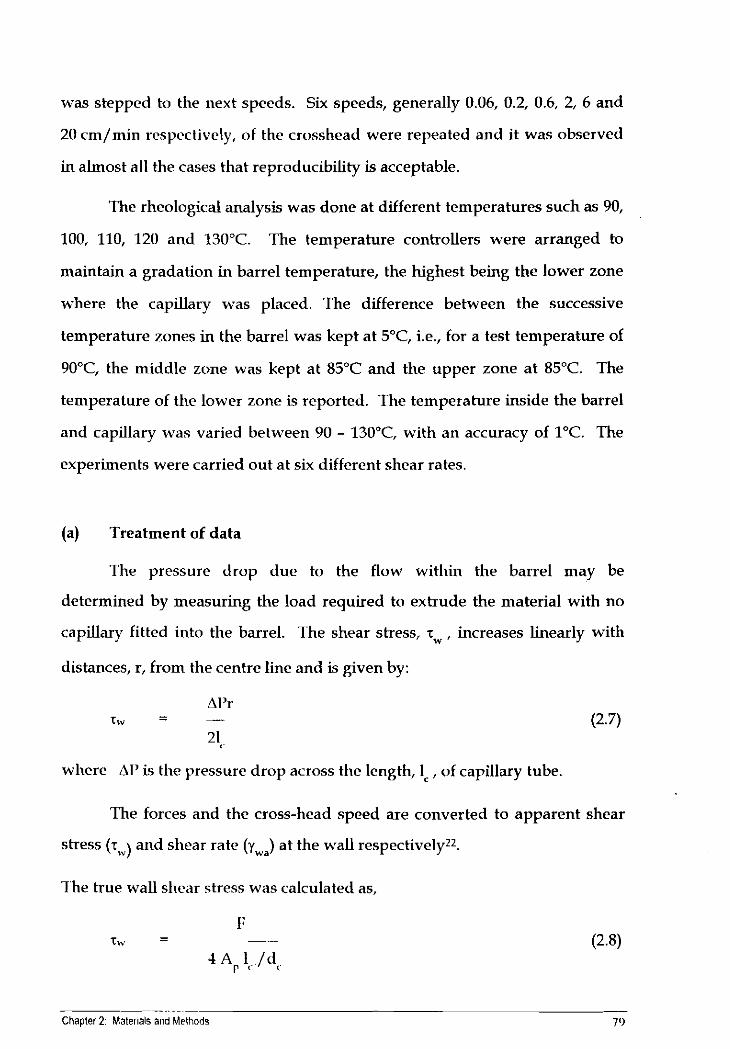
(a) Treatment of data
The pressure drop due to the flow within the barrel may be
determined by measuring the load required to extrude the material with no
capillary fitted into the barrel. The shear stress, T ~ , increases linearly with
distances, r, from the centre line and is given by:
where A P is the pressure drop across the length, I= , of capillary tube.
I h e forces and the cross-head speed are converted to apparent shear
stress (rw) and shear rate (ywa) at the wall respectively22.
The true wall shear stress was calculated as,
- -. . . - - Chapter 2 Mater~als and Mettrods 7')
where F is the force on the plunger (N), A cross sectional area of the P
plunger (mm2), and lc(mmj and dc(mrn) the length and diameter of the
capillary respectively.
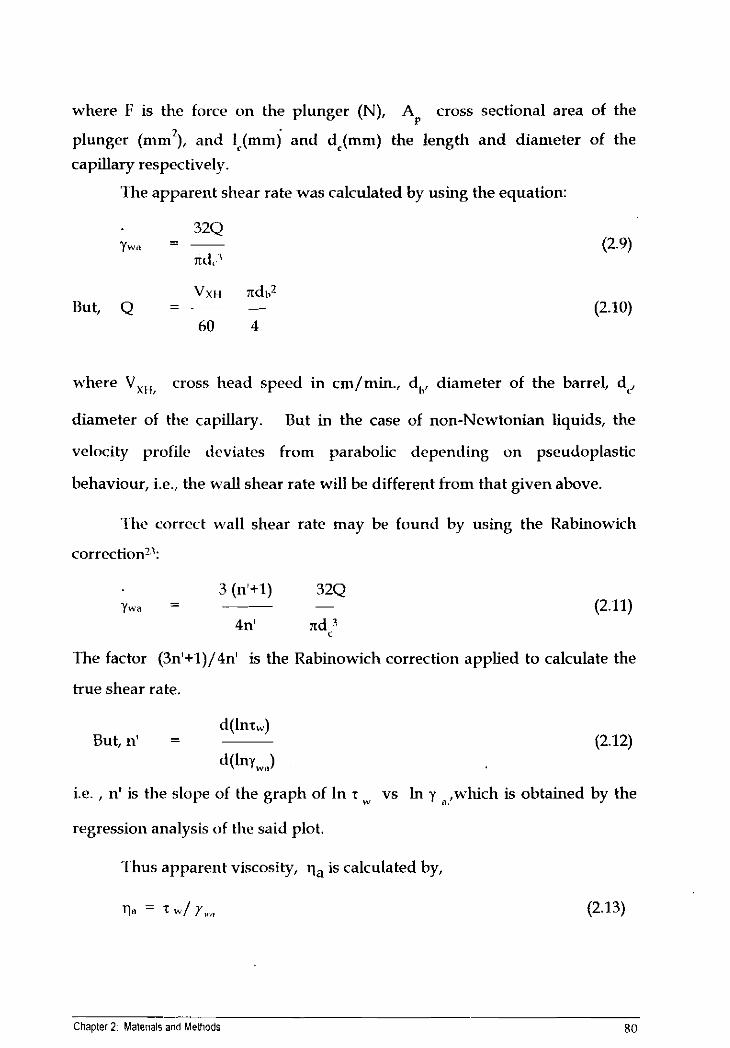
?'he apparent shear rate was calculated by using the equation:
VXH xdh2 But, Q = -- -
60 4
where V,,, cross head speed in cm/min., dl,, diameter of the barrel, d,,
diameter of the capillary. But in the case of non-Newtonian liquids, the
velocity profile deviates from parabolic depending on pseudoplastic
behaviour, i.e., the wall shear rate will be different from that given above.
-['he correct wall shear rate may be fclund by using the Rabinowicli
correction":
The factor (3n'+1)/4n1 is the Rabinowich correction applied to calculate the
true shear rate.
d(lnr,,,) But, n' =
d(lny,,.,,l
i.e. , n' is the slope of the graph of In r vs in y n!which is obtained by the
regression analysis of the said plot.
.l'hus apparent viscosity, qa is calculated by,
Chapter 2. Mater~als and Methods 80
(b) Die swell and extrudate morphology
'She extrudates were collected on a glass plate as they emerge from the
capillary die, care being taken not to stretch them. The extrudate diameter
was measured at different times and it was noticed that there was no further
change in the diameter after 24 hours. Thus all the samples were kept for 24
hours to attain equilibrium before final readings were recorded, using a
travelling microscope. The surface morphology of the extrudates obtained
after the capillary extrusion was analysed under optical and SEM techniques.
2.5.3 Diffusion and transport phenomena
The vulcanized sisal-SBR composite samples were cut circularly
(diameter = 1.94 cm) for swelling measurements. ?he thickness of the
composite was measured using a micrometer screw gauge. Ury weights of
the cut samples were taken before immersion in the liquid contained in
airtight weighing bottles. The samples were removed from the bottles at
periodic intervals, the wet surface was quickly dried using a piece of blotting
paper and weighed immediately in airtight weighing bottles. During swelling
any change in the diameter and thickness of the san~yle .was determined by
means of vernier callipers and a micrometer, respectively.
The uptake of the liquid by the polymer during swelling was expressed
as moles of liquid sorbed by lOOg of the polymer. This method was found to
be more convenient for comparison of sorption data and was adopted by
earlier researchers" 25.
Chapter 2 Mater~ais and Methods 81
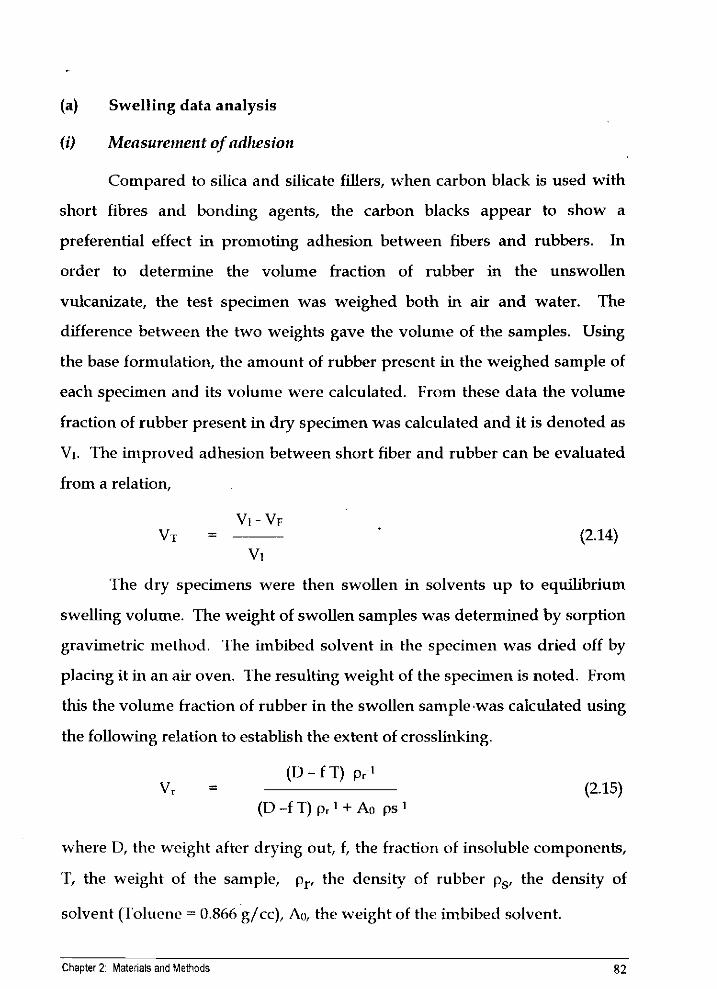
(a) Swelling data analysis
(i) Mensureinerzt of adhesion
Compared to silica and silicate fillers, when carbon black is used with
short fibres and bonding agents, the carbon blacks appear to show a
preferential effect in promoting adhesion between fibers and rubbers. In
order to determine the volume fraction of rubber in the unswollen
vulcanizate, the test specimen was weighed both in air and water. The
difference between the two weights gave the volunle of the samples. Using
the base formulation, the amount of rubber present in the weighed sample of
each specimen and its volume were calculated. From these data the volume
fraction of rubber present in dry specimen was calculated and it is denoted as
VI. The improved adhesion between short fiber and rubber can be evaluated
from a relation,
The dry specimens were then swollen in solvents up to equilibrium
swelling volume. The weight of swollen samples was determined by sorption
gravimetric method. 'l'he imbibed solvent in the specimen was dried off by
placing it in an air oven. The resulting weight of the specimen is noted. From
this the volume fraction of rubber in the swollen sample.was calculated using
the following relation to establish the extent of crosslinking,
- (D-fT) p,~' Vc -
(D-fT)pr l+Ao ps'
where D, the weight after drying out, f, the fraction of insoluble components,
'I; the weight of the sample, pr, the density of rubber ps, the density of
solvent (I'oluerie = 0.866 g/cc), Ao, the weight of the imbibed solvent.
Chapter 2: Materials and Methods 82
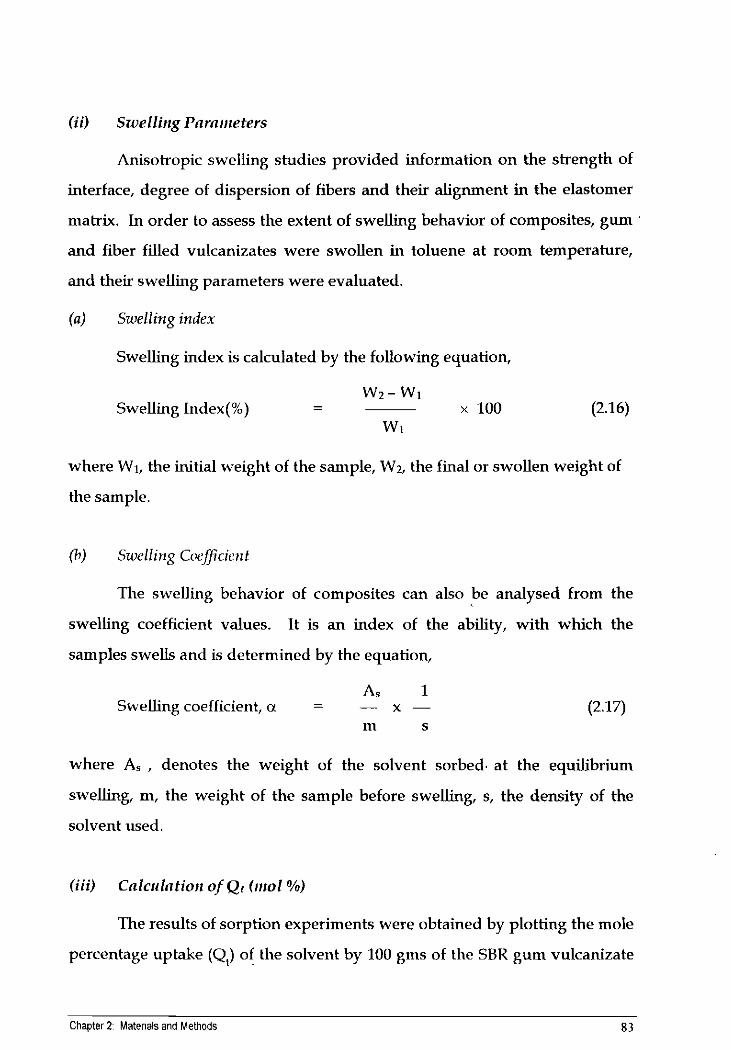
Anisotropic swelling studies provided information on the strength of
interface, degree of dispersion of fibers and their alignment in the elastomer
matrix. In order to assess the extent of swelling behavior of composites, gum
and fiber filled vulcanizates were swollen in toluene at room temperature,
and their swelling parameters were evaluated.
(a) Su~ell ing index
Swelling index is calculated by the following equation,
- - w2-w1
Swelling Index(%) x 100 (2.16) W I
where W1, the initial weight of the sample, W2, the final or swollen weight of
the sample.
(b) Swell ir~g Coefficient
The swelling behavior of composites can also be analysed from the
swelling coefficient values. It is an index of the ability, with which the
samples swells and is determined by the equation,
As 1 Swelling coefficient, a = - x -
m s
where A, , denotes the weight of the solvent sorbed at the equilibrium
swelling, m, the weight of the sample before swelling, s, the density of the
solvent used.
The results of sorption experiments were obtained by plotting the mole
percentage uptake (Q,) of the solvent by 100 gms of the SHlZ gum vulcanizate
Chapter 2 Mater~als and Methods 83
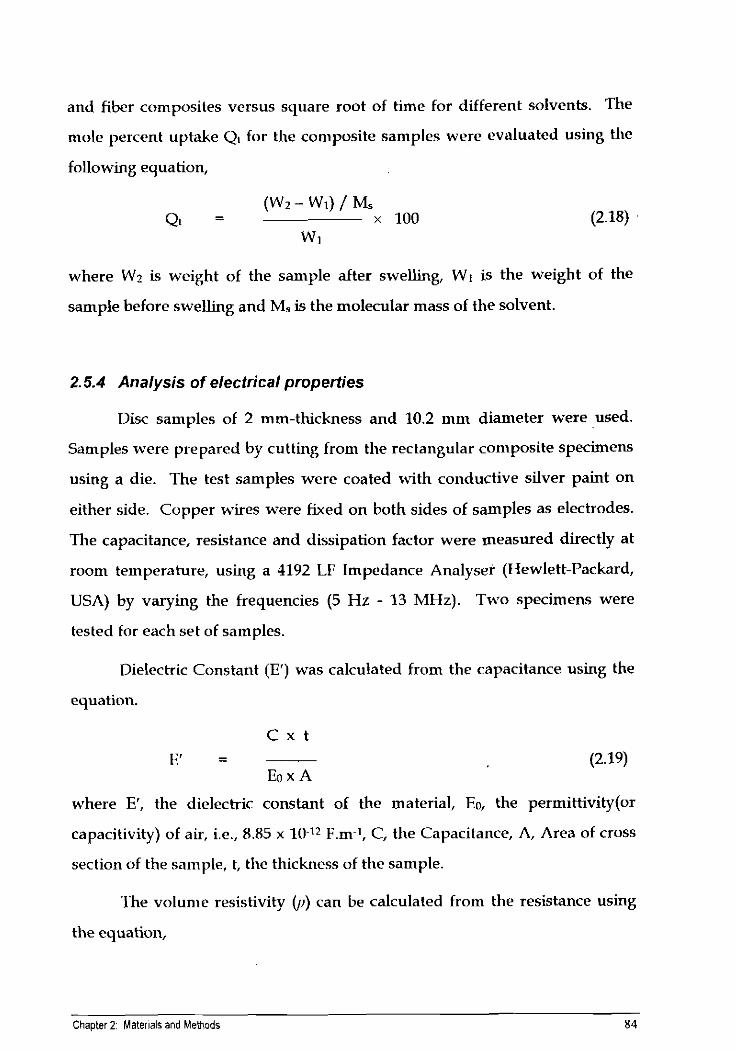
and fiber composites versus square root of time for different solvents. The
mole percent uptake Qt for the composite samples were evaluated using the
following equation,
where W2 is weight of the sample after swelling, W1 is the weight of the
sample before swelling and M, is the molecular mass of the solvent.
2.5.4 Analysis of electrical properties
Disc samples of 2 mm-thickness and 10.2 mm diameter were used.
Samples were prepared by cutting from the rectangular composite specimens
using a die. The test samples were coated with conductive silver paint on
either side. Copper wires were fixed on both sides of samples as electrodes.
The capacitance, resistance and dissipation factor were measured directly at
room temperature, using a 4192 LF Impedance Analyser (Hewlett-Packard,
USA) by varying the frequencies (5 Hz - 13 MHz). Two specimens were
tested for each set of samples.
Dielectric Constant (El) was calculated from the capacitance using the
equation.
C x t
where E', the dielectric constant of the material, Ea the permittivity(or
capacitivity) of air, i.e., 8.85 x 10⁻¹² F.m-1, C, the Capacitance, A, Area of cross
section of the sample, t, the thickness of the sample.
The volunie resistivity (p) can be calculated from the resistance using
the equation,
Chapter 2: Mater~als and Methods 84
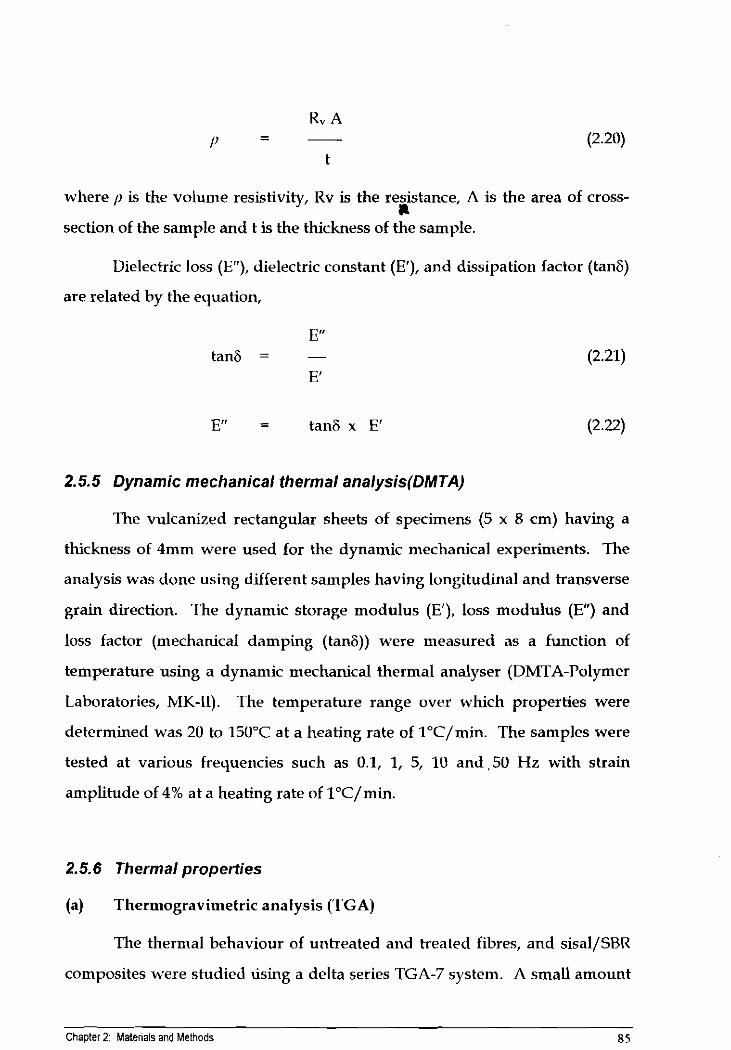
where 1) is the volume resistivity, Rv is the resistance, A is the area of cross- 8
section of the sample and t is the thickness of the sample.
Dielectric loss (E"), dielectric constant (E'), and dissipation factor (tan6)
are related by the equation,
2.5.5 Dynamic mechanical thermal analysis(0MTA)
The vulcanized rectangular sheets of specimens (5 x 8 cm) having a
thickness of 4mm were used for the dynamic mechanical experiments. The
analysis was done using different saniples having longitudinal and transverse
grain direction. l h e dynamic storage modulus (E'), loss modulus (E") and
loss factor (mechanical damping (tan6)) were measured as a function of
temperature using a dynamic mechanical thermal analyser (DMTA-Polymer
Laboratories, MK-11). The temperature range over which properties were
determined was 20 to 150°C at a heating rate of l0C/min. The samples were
tested at various frequencies such as 0.1, 1, 5, 10 and.50 Hz with strain
amplitude of 4% at a heating rate of l0C/min.
2.5.6 Thermal properties
(a) Thermogravimetric analysis (TGA)
The thermal behaviour of untreated and heated fibres, and sisal/SBR
composites were studied using a delta series TGA-7 system. A small amount
Chapter 2: Materials and Methods 85
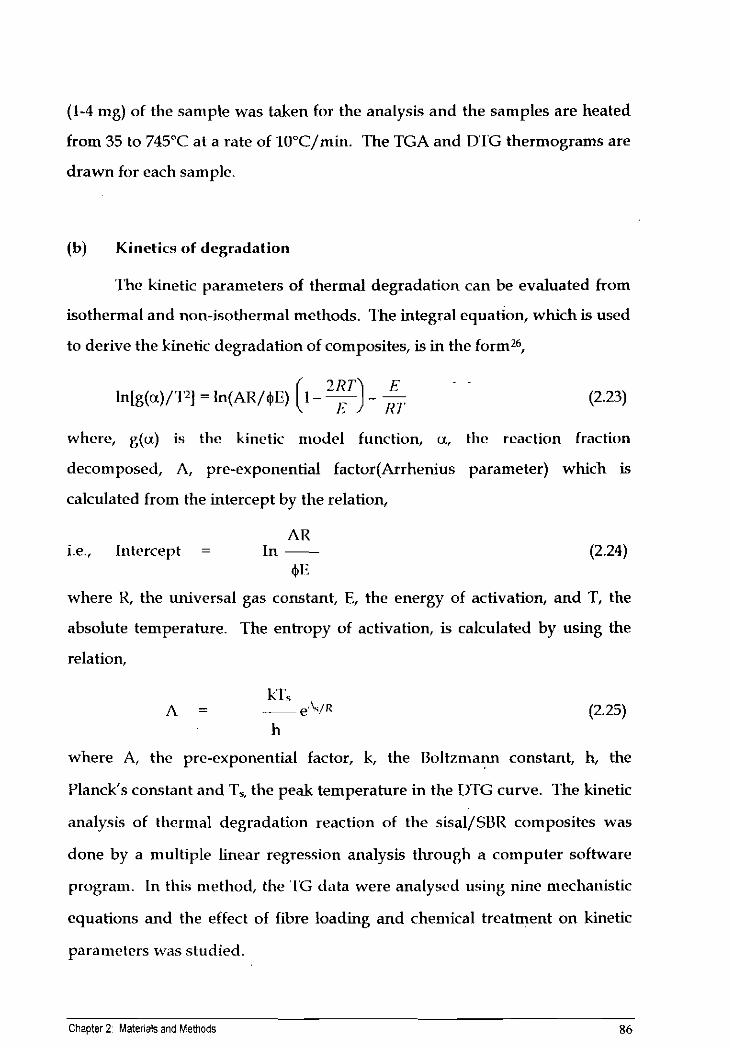
(1-4 mg) of the sample was taken for the analysis and the samples are heated
from 35 to 745°C at a rate of 1O0C/min. The TGA and D'I'G thermograms are
drawn for each sample.
(b) Kinetics of degradation
'l'he kinetic parameters of thermal degradation can be evaluated from
isothermal and non-isothermal methods. The integral equation, which is used
to derive the kinetic degradation of composites, is in the form26,
where, g(u) is the kinetic model function, u, the reaction fraction
decomposed, A, pre-exponential factor(Arrhenius parameter) which is
calculated from the intercept by the relation,
AR i.e., Intercept = In -
$1:
where R, the universal gas constant, E, the energy of activation, and T, the
absolute temperature. The entropy of activation, is calculated by using the
relation,
where A, the pre-exponential factor, k, the Uoltzmann constant, h, the
Planck's constant and T , the peak temperahue in the WTG curve. The kinetic
analysis of thermal degradation reaction of the sisal/SUli composites was
done by a multiple linear regression analysis through a computer software
program. In this method, the 'L'G data were analysrd using nine mechanistic
equations and the effect of fibre loading and chemical treatment on kinetic
parameters was studied.
Chapter 2 Materials and Methods 86
(c) Differential scanning calorimetric analysis
The thermal behaviour of sisal/SBR composites was measured using a
mettler differential scanning calorimeter. The samples were inserted into the
apparatus at room temperature and immediately heated to 200°C and kept
for 1 min. at this temperature in order to remove volatile impurities. The
samples are fkst cooled to -80°C using liquid nitrogen and the scan was made
from -80 to 100°C at a heating rate of 10°C min' in helium atmosphere. For
the determination of T, (glass transition temperature), two tangents are
drawn at the baselines of the DSC curve and the perpendicular bisector gives
the T, of the sample.
References
I.. A. Wo(,d, 'I'lr~/srtnl Clrerrrrstr~/ nfsyrrflrefrt, rr1lih.r.5' Cliapter 10 in G. S. Whitby (Ed. ) "Syrrllrrfrc ~ l r h k s " , John Wiley, Inc., New York (1954).
N. Uekkedal~l, 1:. 1. Rolli, NtrlI. Rrir. Sltf., 10, l(1948).
I<. L3. Rands, Jr., W. J. Perguson, J. L Prather, /. Rr.s. Nntl. Brrr. Std., 33, RP 1595 (1944).
W. 11. Hamill, B. A. Mrowca, R. L. Anthony, lrrd. Errg. Cl~~rrr., 38, 106 (1946).
W. H. Hamill, B. A. Mrowca, R. L. Anthony, Krrbbrr ('IIPIII. 7Pcht1ol., 19, 622 (1946).
A. T. Mc plierson, Rlrbt~rr (:lrerrr. 7erhrrol. (Iiuhher reviews) 36, 1230 (1963).
A. 17. Payne, J. R. Scott, 'Engg. Desigrr ri~itlt RribbeJ- Interscience Publishers, New York, 1900.
H. Schdhig, firtfscl~lrk Gurrrrrri, 16, 84 (1963).
L. A. Wood, R. L Rotli, Proc. 4th Rubber Technol. Cod., London, 1962, p 328, Inslitulion of the R u \ > b r Industry, 1.ondon (1963).
L. rZ. Wood iu~d l i . L Rotli, Rrrlrli~~r. Clrc.rrr. 'lic.lrrrol., 36, 611 (1963).
F. \V. 1%arlow, 'Rrrblitsr C ~ r ~ r ~ ~ i i ~ r r ~ ~ / ~ ~ r ~ - P r ~ r r ~ - ~ ~ i l ~ ~ , Mrrttsri~rIs iirrri 7?thtrii{rri8s', 2'1.' Ildn., hIarcr.1 Dckkrr, Inc., New YorL 1993, Ch. 3, p 29.
B. C. Barkakatty, I. Appl. Polyrrr. Sci., 20,2921 (19763.
N . Chand, S. Varma and A. C. Khazanchi, 1. Mi1fl.r. S L ~ . Lztf., 8, 1307 (1989).
D. U. Llunrlom, Hi-Sil Bulletin No. 35, Chemical Division, PPG Industries Inc., Pittsburgh (July 1967).
Chapter 2 : Materials and Methods 87
0. Johari and A. V. Samudra, 'Cltnrnctcrizntiorr of Solid srtrfiw', F. F . Kane and G. B. Larrabe, Eds., Plenum Press, New York. 1974, Cli. 5.
S. K. De and B. K. Dhindaw, j. Scnrrning Elrctrorr Mirros., 3, 973 (1982),
H. hlorawetz, M~rcrortrolea~les itr solrctiorr, 2n4ed. Interscience, New York (1975) 11. 49.
L. Czar11rkr.i anti J . I,. White, 1. Ap1'1. I'ol~yrrr. Sri., 25, 127 (1980).
A. P. Foldi, Rlrbber Clferrr. Tecl~rrol., 49, 379 (1976).
Working Rlatu~ual for Instron Capillary Rheometer, Moriel3211.
J. A. Brydson, 'Floor propcrtie of polynrer r~rclts', 2nd Ed., George Godwin, London (1981).
B. Rahinowitsch, E. Eisenchitz and K. Weissenberg, Mitt . Dt. Mnter. Prr$ Arrst., 9, 91 (1929).
S. t3. I Inrgopad and T. h,l. Aminnhhavi, I. AppI Polllrtr. St.;., 42, 2329 (1991)
U. S. Aithal and T. M. Aminahhavi, j. Cltorr. Edrt., 67 (I), 82 (1990).
A. W. Coals and 1. P. Redfern, Nntuw, 210,68 (1964)
Chapter 2 Mater~als and Methods 88