marketing audit - municipal securities … place marketing audit 2 on marketing principles,...
TRANSCRIPT


MARKETING AUDIT
for
Plymouth Place, La Grange Park, Illinois
September 22, 2011

i
Plymouth PlaceMarketing Audit
Table of Contents
Part 1 - Introduction
Engagement......................................................................................................................................1
Sponsor and Background Information .............................................................................................2
About the Marketing Audit..............................................................................................................3
Retirement DYNAMICS, Inc. On-site Visit....................................................................................4
Part 2 - Summary
Executive Summary .........................................................................................................................5
Conclusions......................................................................................................................................7
Part 3 - The Marketing Audit
Issues, Challenges and Recommendations ......................................................................................8
Plymouth Place Marketing Audit 1
Marketing Audit
Plymouth PlaceLa Grange Park, Illinois
PART 1 - INTRODUCTION
I. Engagement
Retirement DYNAMICS, Inc. of Charlotte, North Carolina (“Retirement DYNAMICS,” or “RD”), was retained by Plymouth Place of La Grange Park, Illinois (” the “Corporation,” the “Community,” or “PLP”) to conduct a Marketing Analysis (“Report”) of key components of the marketing and sales program at Plymouth Place located at 315 North La Grange Road, La Grange Park, IL 60526. Plymouth Place is a not-for-profit Continuing Care Retirement Community (“CCRC”) and Retirement DYNAMICS, Inc. (“RD”) is an independent consulting firm that provides sales and marketing consulting services, research and strategic advice for non-profit retirement communities.
Plymouth Place requested that RD perform this Audit due to its failure to meet MarketingCovenants for the Community. Information obtained from PLP included project configuration, site design, floor plans, pricing, marketing plan and budget, as well as sales data. RD also met with current residents, PLP board members, management, sales staff, and the Community’s current sales and marketing consulting company, Greystoneof Irving, TX. Data analyzed in this document is based on PLP activity reports through July 31, 2011.
The Marketing Audit focuses on the sales and promotional portions of PLP’s marketing program for independent living (“IL”) as well as its overall product, program and pricing as compared to identified competitors. Due to the frequency of similar reviews RD was requested to rely on competitive information from similar PLP engagements. The Marketing Audit may also address some aspects of operations and administration that relate to the retirement community’s potential marketing and sales success.
RD has no interest adverse to the Community or Board, a debtor or the management of PLP, and has no interest in any other related consulting, building and/or management companies other than consulting agreements with similar retirement communities. RD believes it can give objective, professional advice and helpful recommendations founded

Plymouth Place Marketing Audit 2
on marketing principles, strategies, and tactics, which have worked successfully in other retirement communities throughout the United States.
II. Sponsor and Background Information
Plymouth Place is a continuing care retirement community that opened in October 2007. The Community consists of 182 apartments and 56 cottage homes, 52 Assisted Living Apartments, 26 memory care Assisted Living apartments and 86 Nursing care beds. Common areas and ancillary facilities include but are not limited to a wellness center, a fitness center, a library, a sundries shop, an indoor swimming pool, dining venues, and a chapel. The residency contract is a Type A Lifecare arrangement with a 90% entrancefee refund and a monthly fee that includes unlimited care in assisted living and skilled nursing (based on a weighted average of the monthly service fees), a meal plan, housekeeping, utilities, interior and exterior maintenance, water and sewer service, and emergency call monitoring.
The Community is located within walking distance of main street La Grange Park which provides convenient access to shopping, restaurants, social and cultural amenities as well as access to the train into Chicago. PLP is situated in a Primary Market Area (“PMA”) with both established and new competition under construction and limited pool of age and income qualified prospects from which to draw; while Plymouth Place enjoyed an initial robust fill-up, the subsequent move-in momentum has not met financing covenants, thus requiring mandatory marketing audits three times over the past two years. Occupancy as of July 31, 2011 stood at 138, or 76% with the marketing plan goal of 148 or 81%.
Marketing staff consists of a director of sales, two full time sales counselors, a health services sales counselor, and a marketing assistant. One of the sales counselors submitted her resignation for personal reasons during the course of the delivery of this report. The director of sales has been with the community for over nine years and has extensive knowledge of the industry, the community and the history of Plymouth Place.
Plymouth Place has failed to meet occupancy covenants for the second quarter in 2011which was established at 164 in its financing documents. As of July 31, 2011, the IL portion of Plymouth Place is 76% sold and occupied (138 units). From January 1 through July 31, 2011 PLP achieved 14 new IL sales (10% deposits) and 14 move-ins. This move-in velocity is the chief indicator of the continued difficulty. 14 new move-ins over the course of seven months equates to a rate of 2 gross move-ins per month for the entire marketing department, or .66 move-ins per counselor per month. When attrition is considered, total net move-ins for Independent Living during this period is plus six (+6) , or (.86) move-ins per month Occupancy from January 1 through July 31, 2011 rose by a net of six units yet achieved eight (8) below the projected net increase of 14 move-ins.

Plymouth Place Marketing Audit 3
III. About the Marketing Analysis
This Marketing Analysis focuses on the sales and promotional portions of PLP’smarketing program for independent living (“IL”) as well as its overall product, program,and pricing as compared to identified competitors. The healthcare occupancy was reported to be robust with more demand than supply.
The retirement industry is in a transitional period. The market for full-service retirement communities is now focusing on the “Silent Generation,” rather than the “G.I.Generation” that communities have served for nearly two decades. There are definite differences between the generations both in expectations as well as raw numbers. The younger “G.I.s” are often similar to “Silents” in many ways, the G.I. Generation (born 1901 -1924, 56.6 million) is most likely to dress for dinner, accept standardization within residence styles and services, and trust in authority and community management. Silents(born 1925-1945, 52.5 million or 7.2% fewer births) seek more flexibility in dining times, dining venues and dress. Influential adult children are commonly “Baby Boomers” (born 1946-1960, 78.2 million or 49% greater births) who desire fewer rules and regulations. Successful retirement communities have changed their programs, product and marketing materials to match the new customer as well as their influences. PLP’s product has elements that successfully satisfy all three generations. The challenge for PLP, and all senior housing providers, is to fill and maintain a high level of occupancy during thisperiod of declining markets and to remain viable until the population of adults over age 75 begins to increase again sometime around 2020.
Source: Retirement DYNAMICS, Inc. Jeff House, Director of Market Research

Plymouth Place Marketing Audit 4
This study addresses the activities and plans to create interest in and awareness of PLP as well as the sales process itself, which converts that interest to commitments. The Marketing Audit also addresses some aspects of operations and administration that indirectly relate to the retirement community’s marketing and sales success. The following items were reviewed in order to complete this Marketing Audit, although only items with issues to address are discussed in this report.
Review of the Product
Pricing
Location and Market Area
Lead Tracking and Sales Activity
Marketing Procedures
Review of the Marketing Plan and Budget
Review of Advertising
Review of Marketing Collateral Materials
Special Events and Cultivation Meetings or Seminars
IV. Retirement DYNAMICS, Inc. On-Site Visit
Components of the site visit from August 3 – 5, 2011 included:
Tours of the community and sales office;
Interviews with Greystone consultant Laureen McGuire, Plymouth Place marketing and key management staff, select Board members, and residents;
Gathering of marketing materials such as brochures, floor plans, advertisements and direct mail pieces;
Gathering of residency agreements, application forms, offering statement, marketing plan and budget; and
Gathering of statistical data for sales, REPS lead tracking system, and marketing activity.

Plymouth Place Marketing Audit 5
PART 2 - SUMMARYI. Executive Summary:
Plymouth Place has not met its occupancy covenants for the past four quarters, missingfulfillment of its targets by 10 units as of July 31, 2011. Plymouth Place opened in the fall of 2007 and showed initial strong move-ins which exceeded early targets having achieved 75 occupied residences (41%) as of January 2008. However, opening is one of the most vulnerable times for 10% deposit cancellations, and the opening of Plymouth Place’s expansion occurred at the time the U.S. economy slowed, making it especially susceptible to those cancellations. As 2008 unfolded and the U.S. economy slowed Plymouth Place experienced a significant slowdown in new move-ins. From January 2008 through December 2008 the community achieved only 18 net move-ins. As the realities of the economy and new real estate market conditions took hold, PLP experienced occupancy gains in 2009 of 32 net move-ins, bringing them to 65% occupied. 2010 reversed course with only 14 net move-ins causing PLP to fall below the bond covenant targets. As of July 31, 2011 PLP remains below occupancy covenants with 138 out of 182 units occupied (76%). Of additional concern for PLP is the repayment of the short-term C bonds coming due on September 15, 2012. PLP is seeking perspective and recommendations that will positively affect not just occupancy but net revenue at a rate that will allow them to successfully repay their bonds.
PLP’s sales difficulties can be attributed to a multitude of factors, among them high fees, lack of entrance fee refund options that would offer a lower price point, internal product and pricing competition, unfocused product positioning, underfunded marketing efforts, and a difficult real estate market related to the economy.
The Community’s physical location within La Grange Park is very favorable as it offers a large 21 acre site within walk able distance to the quaint downtown of La Grange Park as well as easy access to daily commuter train service to the city of Chicago. Data supplied by Plymouth Place demonstrates that eighty percent of residents originate from a few zip codes surrounding La Grange Park.
The high cost of Plymouth Place’s 90% refund plan relative to the average sale price of homes in the PMA is likely the largest factor in poor move-in velocity. Like many communities throughout the country, Plymouth Place’s entrance fees were computedduring a fervent real estate market, and while that market has since retreated and continues to decline while entrance fees have continued to increase. Ultimately, high price points in conjunction with a difficult real estate market adversely affect the sales velocity. Plymouth Place lacks lower-priced contract options and alternate refunds below 90%, which several competitors offer.

Plymouth Place Marketing Audit 6
The residences at Plymouth Place are spacious and of good design, although there is achallenge created by poor views from certain residences and certain locations of apartments having unusual configurations. The apartment building offers proximity to healthcare and most of the community amenities are within a single building allowing for access to all areas of the community, including under building parking during the harsh Chicago winters.
Of major concern is the number of average move-ins per month. Should move-ins continue at the rate generated in the first half of 2011, Plymouth Place will not reach either its occupancy or revenue targets. In order to be in compliance with occupancy covenants and concurrently generate the necessary revenue to repay the C-bonds, the community should pursue all available avenues to increase move-ins, including offering an alternate Type C Fee-for-Service agreement with lower price points, finding partners to assist prospects with loans to pay entrance fees until their homes sell, and workingwith lenders to revise sales and occupancy covenants. A continued gross move-in pace of 2.0 per month, with average attrition of 1.0 per month will make attainment of PLP’s goals impossible if no changes are made.
A 3% - 5% conversion rate of leads to sales has been the industry benchmark for a number of years, but RD and other firms have found that the economic downturn has adversely affected conversion rates in most areas of the country, and it is not uncommon to encounter rates between 2%-3% in communities with significant market challenges. Plymouth Place is generating adequate leads for a community at this stage of fill-up;however a declining conversion rate of leads to move-ins indicates that the quality of the leads may be degrading. The average length of time from initial inquiry to move-in is lengthening, and slightly fewer leads are being generated and it appears that those that are do not have the desire or ability to qualify for the remaining available residences.
Plymouth Place’s community positioning statement is unclear, is not compelling and is difficult to understand in that it is so short lived. . The 2011 marketing plan outlines PLP’s positioning as the newest non-profit CCRC in the area. However in a matter of months that will no longer be true as Park Place of Elmhurst plans to open in early 2012. PLP needs to identify a positioning and value proposition unique to the community.Current marketing materials do not specifically communicate what is unique about Plymouth Place. Glynn Devins has developed comprehensive marketing plans with input from Greystone, but needs to produce better creative concepts and a clearer more unique message than it has up to this point in order to differentiate Plymouth Place from its competitors. This is not solely RD’s perspective, interviews with constituents made of management, staff, residents and board all stressed this as one of the key issues that canand should be addressed.

Plymouth Place Marketing Audit 7
The amount of funding for the marketing budget is unclear as the information provided by Greystone is in conflict with the financial statements. Regardless of which figures are the more accurate, both show a significant decline in investments for marketing over the past four years. In 2009 the marketing budget was reported as $974,957 and in 2010 itwas reported as $899,900 ($445,001 in the financial statement.) This decline in funding corresponds to a decline in the number of move-ins achieved. Assuring the marketing budget remains sufficiently funded for its needs will be a critical factor in PLP’s ability to achieve its goals.
In general, staff, residents, and board members are very happy with their community but expressed concerns to RD about its success. Plymouth Place’s high price and positioning were common concerns among all these groups.
II. CONCLUSIONS
The community’s redevelopment was planned prior to major economic upheaval in the U.S. and given the still problematical real estate market; RD believes there are continued challenges ahead for fill-up of Plymouth Place. New product offerings in the way of a Fee-for-Service contract, pricing adjustments to counter the impact of recent price increases, development and implementation of a clearer positioning message unique to PLP and adequate funding for marketing efforts are all avenues that should be pursued in the effort to increase the pace of move-ins and generate adequate revenue.
Foremost, the Plymouth Place pricing program needs adjustment in order to better match the economic reality of the existing real estate market. Implementation of a Fee-for-Service, type C contract option, to lower the initial entrance fee price point would significantly improve the sales pace. Eliminating internal competition from the cottage product, replacing the departing sales counselor, and creating a desirable path to financing for prospects while they sell their homes will likely create the greatest improvement to move-ins. However, changes implemented today require a minimum of 90-120 days to have any effect on actual move-ins; therefore it will be crucial to implement any of these recommendations as quickly as possible in order for the changes to have effect in the shortest amount of time.

Plymouth Place Marketing Audit 8
PART III – THE MARKETING ANALYSIS
ISSUES, CHALLENGES AND RECOMMENDATIONS
I. The cottages are currently priced in such a way that it is likely dissuading some prospects from selecting an apartment.
o In addition to the 182 new independent living apartments, Plymouth Place has 56 older cottages located at the rear of the property. PLP has strategically limited marketing of the cottage product in part to drive prospects to the apartments and also because of the current poor condition of the available cottage residences. The renovations required to bring the cottages up to the standard of the apartments are extensive and very costly which significantly reduces the potential revenue that could be created for the community.
o The cottages are offered under both a 0% Refundable and 90% Refundable type “C” Fee-for-Service agreements providing lower cost of entry as well as an unbundled service package that provides significantly lower on-going monthly costs. The difference in entrance fees between the smallest two bedroom one bathroom cottage and a comparable Shipton model apartment is $215,105. There is also a $1,543 per month difference on the monthly fee in favor of the cottages. The difference in entrance fees between a two or three bedroom cottage and an Essex apartment is $320,228, and a $2,720 per month difference on the monthly fee. Due to declines in prospects’ home values over the past three years as well as financial uncertainties in today’s economic environment, a more affordable option may have greater appeal even without a refund or the Lifecare benefit.Despite the appeal of these offerings the sales of the cottages have remained very low in part because of the product and likely in part to the fact that they are not publicly offered but rather shown if prospects request to see them.
o It is understandable that the financial partners of the community would like to see revenue production from the cottage portion of Plymouth Place. It is a different time from when the plan to allow attrition to permit complete redevelopment was put into effect. The challenge is how best to create revenue from those cottages while not negatively affecting the sale of apartments. A higher price for the cottages will likely have three main effects: even fewer cottage sales, corresponding higher margins after CAPEX investments for those sales (RD believes these first two will offset each other), and potentially more inquiries and apartment sales.
Recommendations:
Offer both Fee-for-Service and Lifecare agreements for first generation apartments as well as cottages or,
Increase the pricing of the cottages including repricing for a full Lifecare, 90% refundable entrance fee that is more in line with the current remaining 1st generation apartment inventory.
Increase the entrance fees by roughly $100 - $125K (roughly the cost of adding Lifecare) and monthly fees by $1,500 to $2,000 (possibly by including the utilities

Plymouth Place Marketing Audit 9
and meals.) This will serve to present the cottages as less of a financial advantage than the apartments and also will generate higher revenue for the community.
Limit the number of cottages that can be offered. There are too many cottages to present for sale (32.) Despite the fact there is a logical reason for this large an inventory, it could be perceived by prospects as a sign of instability.
Determine which cottages are the most marketable and can be renovated at the least expense and thereby create the fastest sales, renovations and revenue additions.
Discontinue the 0% refundable and potentially discontinue the fee for service optionfor cottages.
Publicly market them on the web, within the context of current direct mail campaigns as another mention and in collaterals.
RD does not suggest any separate cottage marketing campaigns at this time
II. Median Entrance Fees for remaining inventory are higher than the average home sale prices in the primary market area.
o The majority of the current availability falls within three styles of apartment; the Shipton, Essex, and Stafford. These styles make up 28, or 80% of the available residences at PLP. The median EF for available residences is $588,335. The median MF is $3,861. In order for prospects to qualify for the available inventory they would normally need minimum assets of $1,176,670 and a minimum annual income equal to 1.5 times the monthly service fee or $69,498 for a single occupant. The average sales price of homes in the PMA from April through June 2011 was $575,695, or 2% lower than the median EF of available apartments. Average home sale prices in the PMA have declined 11% from $646,222 in 2009. In the context of the current volatility and the likelihood that these homes will need to be priced aggressively in order to sell in a timely manner it appears that the Entrance Fees for PLP are part of the reason for the declining sales volume.
o In addition to the decline in real estate values over the past 3 years, economic fluctuationshave affected prospects’ annual incomes due to declines in their income generating investments. Even with many investments recouping some of their losses over the past 2 years, prospective residents are concerned about the stability of their incomes and are sensitive to rising monthly fees. Many seniors are finding their incomes are not keeping pace with the annual increases in monthly fees and are seeking ways to lower their monthly obligations in order to protect their income and assets over a longer period of time.
o The majority of prospects considering a move to an entrance fee model CCRC will use the proceeds from the sale of their current home to pay the entrance fee upon move-in. While historic perspectives are contrary to the current reality it is more and more rare forprospects to pay an entrance fee higher than what they will net from the sale of their home. With median EF above the average home sale price in the PMA, PLP has a limited population of potential residents within its primary market.

Plymouth Place Marketing Audit 10
2009 2010 2011 (6-mo.) 2nd Qtr. 2011# Homes sold 777 831 517 322Avg. Sales Price $646,222 $624,823 $583,575 $575,695Net to Seller* $581,600 $562,340 $525,217 $518,125# Days on Market
233 201 209 183
*Assume real estate commission of 6% and repairs or improvements of 4%
o The current cottage offering allows for prospects to purchase Lifecare for $60K per person. If those same rates were applied to the 1st Gen Apartments the EF could be lowered by up to $120K per residence which would make it much more likely that a couple with a home value closer to the PMA home values would choose Plymouth Place. It is also likely that they would be able to then be sold Lifecare as an additional service. This change would also carry a more clear message and understanding of the value of Lifecare.
Recommendations:
Offer a Fee-for-Service option for first generation apartments using the current cottage pricing as the model for the pricing of this option. Currently the cottage Fee-for-Service entrance fees are between $60,000 and $120,000 lower than the Lifecare option. This option would serve to expand the market of prospects that can comfortably choose one of these remaining residences. From conversations with Greystone and the marketing team the remaining residences have remained a challenge even during the pre-sale, pre-recession environment.
Offer an Entrance Fee option with a lower refund that also reduces the monthly fee obligation.
III. There is no additional entrance fee for a second resident in an apartment.
o RD is uncertain of the actuarial basis of the financial model whereby a single person and a couple pay the same for Lifecare coverage despite the fact that the additional risk another person’s long term care costs as well as the longer life expectancy for a couple that will delay the eventual resale of that residence. By considering the additional cost of Lifecare for the second person PLP could allow for a lowering of the EF for a single person. RD would not recommend the corresponding option of raising the total EF for couples.
o Although second person entrance fees are not universal among competitors in the market area, Fairview Village (now d.b.a. Oak Trace) and Villa St. Benedict were charging a second person entrance fee. Fairview Village’s second person fees ranged from $21,800to $26,300. Villa St. Benedict’s second person fees range from $10,000 to $16,500.
o The lack of a second person fee in the apartments for Lifecare, especially alongside cottage residences having the choice to purchase the Lifecare option for a single person or couple, raises the question in prospects’ minds that single residents are paying the same cost as for two without getting the same benefits.

Plymouth Place Marketing Audit 11
Recommendations:
Evaluate the revenue implications of lowering the entrance fee by the equivalent single person cottage Lifecare fee for single occupants in the remaining first generation apartments.
IV. Sales momentum seems to have slowed following the July 15, 2011 price increase.
o Plymouth Place implemented an increase in entrance fees on August 1, 2010 of between .33% and 14.05% for the apartment residences. The sales team reported an uptick in sales and move-in activity as a result of this increase as prospects took advantage of locking in those price savings.
o Of particular note is the 14.05% increase for the Shipton two-bedroom, two bath apartment. The entrance fee went from $420,000 in January 2010 to $479,000 in January 2011. Although some increase differences between unit types in order to bring prices into better alignment is understandable, this particular increase may have had a negative impact on an already widely available residence.
o Plymouth Place implemented a 4.5% increase in entrance fees which took effect on July 15, 2011. When added to the August 2010 increase, entrance fees for the available inventory have been increased from 5.07% to 16.69% since January 2010. In contrast to the additional sales and move-ins that resulted from the price increase in 2010 the sales team reports a noticeable slowing of new 10% deposits leading up to and immediately following this most recent increase.
o This latest increase further exacerbated the fact that entrance fees were already approaching the ceiling of average home sale prices in the PMA. This may also lead to the perception in prospects’ minds that the community is out of touch with what is happening in their world where their home values have declined 11% over the past 2 years.
Recommendations:
Immediately allow the sales team to offer a discount of 5% off the entrance fee as an incentive. This would have the effect of rolling back the entrance fees to July 2010 pricing.
Continue offering the 50/50, 40/60, and 30/70 deferred entrance fee programs. Work with a local bank or other financial partner to provide bridge loans for the entrance fee. PLP can offer to carry the interest on the loan for the first six months to a yearwhen the balance of the entrance fee is due as an incentive.
Continue to implement a discount of ladder incentives: Occupancy in 30 days results in a 10% discount Occupancy in 60 days results in a 8% discount Occupancy in 90 days results in a 5% discount
Plymouth Place Marketing Audit 12
V. Prospects that are seriously interested cannot sell their homes or they languish on the market.
o Real estate values have not rebounded and prospects are cash-conscious. Even though PLP’s entrance fees are highly refundable, many prospects are thinking in catastrophic, “what if the U.S. has another crash” terms, so they wish to limit their financial exposure.
o Prospects’ homes that are not priced aggressively can languish on the market for an extensive period of time.
o Many clients are unwilling to enter into a residency agreement with PLP unless their current residences have sold, for fear of being financially stretched.
o Some clients will not sell their current residences, particularly in a difficult market, without an organized program that helps manage their risk.
o In many respects these prospects and depositors will need to lower the asking price of their homes in order for the home to sell… a reality for many markets whether traditional real estate or senior living.
Recommendations:
Explore a relationship with Elderlife Financial Services or a similar group Capital Access Partners, which both offer financing options to prospects moving to CCRCs. Track the success of PLP’s new relationship with this group. As a new incentive, PLP should offer to pay interest on loans through this group for a period between six months and one year so that clients have minimal carrying charges while marketing their homes.
Establishing the value of the community to the individual client through sales skills in conjunction with offering appropriate incentives can convert some hesitant prospects to depositors.
Develop and implement a formal, branded “Home Selling Assistance” program to assist prospects with the details of readying a home for sale, right sizing, selecting a Realtor and executing a move to PLP. Use current incentive program to encourage prospects to utilize these services by tying these incentives to the use of the PLPprograms and providers.
Not all prospects truly mean that they cannot sell the home; this is sometimes a stall tactic meaning, “It’s not a good time to sell my home. I do not intend to put in on the market now.” The sales counselors must use appropriate questioning skills to determine the difference between a true “condition” of being unable to sell the home as opposed to a tactic to stall for time.
It is worth considering an incentive that ties a reduction in the Entrance Fee to a similar reduction in the asking price of the depositor’s home as an alternate to the ladder benefits.
VI. PLP’s positioning in the marketplace is unclear.
o The 2011 marketing plan outlines PLP’s positioning as the newest non-profit CCRC in the area. However in a matter of months that will no longer be true as Park Place of Elmhurst plans to open in early 2012. PLP needs to identify a positioning and value proposition unique to the community.

Plymouth Place Marketing Audit 13
o The current marketing materials do not convey the unique strengths of the community but rather offer characteristics that are similar to nearby and national competitors. PLP is competing for prospects from several borderline zip codes with Park Place of Elmhurst and other competitors and has unique and distinguishing characteristics that should be the key message to get those people to visit and judge for themselves.
o PLP is in an upper price range that must attract affluent prospects, and PLP competes with a new community, Park Place in nearby Elmhurst. Park Place is planned to open in January 2012. Park Place is similar, if not slightly higher in price than PLP and competes for similar prospects in a portion of the PMA. It is likely that Park Place will have similar challenges to other communities in the Chicagoland and national markets when it opens. Many of RD’s recommendations are crafted out of a sense of urgency to increase sales and occupancy for PLP before Park Place of Elmhurst is forced to respond to their own challenges. The cottage offering and the potential Fee-for-Service offering are unique and as such should be strongly considered.
o Given that Plymouth Place’s move-ins occurred during the height of the U.S. economic crisis, the fill-up timeline has been protracted. As a market area becomes generally aware of a new community over a long period of time, new lead generation commonly decreases. During July through December, 2010, PLP generated an average of 114 leads per month. During January through July, 2011, PLP generated an average of 108 new leads per month. In RD’s experience, a new community must generate 75-100 new leads per month during presales and early fill-up marketing. It is encouraging that lead generation has remained high through the volatility of the past few years. This is a likely indicator of continued interest in the product.
o Despite the level of lead generation remaining high, the decline in the conversion of leads to move-ins is a result of multiple key factors. As lead generation efforts expand further away from the community conversion of leads to sales takes longer and ratios of leads to sales decline. Competition increases as there are more choices for prospects to consider that may be closer to their current home. Although the quantity of leads has remained relatively constant, as the entrance and monthly fees of available residences has increased, the number of leads that would qualify for those residences has likely declined.
Recommendations:
Establish a unique positioning to strengthen Plymouth Place’s brand in the market will assist in differentiating the community from other competition. Plymouth Place has an enviable 65 year history setting it apart from newer
competition. With current volatility and uncertainty in the economy & housing markets Plymouth Place can present its stability and strength as an appealing choice for seniors. This unique message should be included in all collateral, advertising and marketing materials.
Plymouth Place’s location and its proximity to public transportation into the city and the walk able distance to the charming downtown of La Grange Park has not been emphasized sufficiently to entice more prospects from the borderline zip codes to visit and consider PLP.

Plymouth Place Marketing Audit 14
Conduct a Community positioning initiative based on PLP’s unique features and benefits to use in ads, direct mail and other promotional pieces. Some limited suggestions include: Stress 65 years of service in the community New community with 65 years experience in senior living and care In-town but still green Underground parking Within walking distance to La Grange Park shopping, medical services, and train
service to downtown Chicago Hospital less than a mile away Highly rated health care center Spectacular fitness and aquatics program Affordable luxury retirement High end product Locally sponsored with board members in the community Cottages
Since PLP is not the only start up community in the country affected by a difficult real estate market, PR efforts should include a positive spin on how well the community has done to achieve its opening and operating milestones.
Target the new testimonial advertisements around four potential messages:1. Affordable luxury: I was not sure I could afford to live here…now I don’t know
how I could have afforded not to move to PLP2. Adult Child and Parent: We are both thrilled to have found a home that lets us
share our lives and enjoy our time and our family. 3. Sell Now: We are so happy we moved to PLP and sold our house after
moving…our realtor said it helped the sale and after 29 years we still made a nice profit.
4. The full continuum of care is the real reason we moved. We love PLP and the food and company are better than we could have expected but the real reason we moved is we want to maintain our choice and independence and give the ones we love the same freedom we enjoy.
VII. Greystone serves in a leadership and advisory capacity and should provide as much time on-site as possible.
o Greystone is responsible for Plymouth Place sales and for managing the relationship with Glynn/Devins and their responsibility for marketing and lead generation.
o During the research and write up of the audit, the strongest sales counselor tendered her resignation for personal reasons. This will create a gap in the sales pipeline unless a strong replacement is put in place quickly.
Recommendations:
Recruit, hire, and train a third sales counselor as quickly as possible. There is always lag time between a new counselor’s start date and when they have cultivated strong enough relationships with clients to begin to see sales success.
Potentially bring in a sales specialist to augment the staff to get to 90% occupancy.

Plymouth Place Marketing Audit 15
VIII. Sales and marketing data indicate strenuous efforts at lead generation and sales activity but poor move-in velocity for two consecutive years.
PLP utilizes the REPS lead management system. Sales and marketing data used for this analysis has been collected from REPS and spreadsheets provided by PLP.
o Thirteen new move-ins over seven months of 2010 (June – December 2010) equates to a rate of 1.9 gross move-ins per month for the entire marketing department, or 0.95 move-ins per counselor, per month. When attrition is considered, total net move-ins during this period are positive 1.3. During the first six months of 2011 (January 1 – July 31) gross move-ins averaged 2.0 per month. However attrition increased by 100% resulting in a net gain of only 0.7 per month.
o Given the nature of a CCRC, move-outs increase as the community ages. Therefore, move-outs will increase incrementally from this point forward.
o Of major concern is the number of average move-ins per month is not significantly exceeding attrition. As second generation apartments are sold refunds of entry fees will reduce revenue available for paying down the C bonds. Given the bond repayment of roughly $15 million due date of September 15, 2012, PLP will need 25.5 net move-ins with median entrance fees of $588,335 between September 1, 2011 and September 15, 2012 in order to achieve its revenue goal. If move-ins continue at the January 1 – June 30, 2011 rate of 2.0 and attrition stays the same or increases, PLP will need approximately 37.5 gross move-ins, or 3.1 move-ins per month, an increase of 1.1 per month over the current pace. The continued gross sales pace of 2.0 per month will make attainment of that goal impossible if changes are not made to the community’s pricing structure. To generate an increase of sales velocity of 56% every possible effort must be made and it must be completed quickly to have an effect in this fiscal year.
o Plymouth Place generated 768 new leads from June 1 – December 31, 2010 and 682 new leads during January 1 – June 30, 2011. This equates to a gross conversion rate of new leads-to-move-ins of 2%. Prior to the economic downturn in 2008 CCRCs could expect a conversion rate of leads to move-ins of between 3 – 5%. RD has seen conversion rates decline on the whole over the past three years and have been typically averaging 2 – 3%. Although PLP is on the low end of conversions, this is typical of other communities’recent experience.
o As a whole, marketing staff averaged the following activities for the six (6) months of 2011: 8.8 call-outs per day, 5.6 private appointments prior to deposit per week, an 11.7% lead to appointment rate, and a 3.4% rate of appointments to 10% deposits. Industry benchmarks vary by project, but are often in the range of 12-15 call outs per day, 3-5 appointments per week, a lead to appointment rate of 20%-30%, and an appointment to deposit rate of 10% - 20%
o Leads created from imports from surveys, referrals, signage/drive-by, internet, and direct mail, in this order, were the top lead generators. Community Networking, referrals, signage/drive-by, and imported from surveys, in this order, converted the highest number of leads to gross move-ins. In RD’s and most other firm’s experience, referrals are the main lead generators for most CCRC’s so it is not a surprise to see them on the high end of Plymouth Place’s list.

Plymouth Place Marketing Audit 16
Recommendations:
Sales counselors should increase call-outs to an average of 10-15 calls per day. Once past the initial marketing phase, media placement typically generates fewer new
leads but remains necessary to maintain project credibility and market presence, so one of the major functions of advertisements changes from lead generation to continued marketplace awareness.
Plymouth Place has an excellent location fronting a main thoroughfare through La Grange Park and has benefitted from the daily traffic that passes in front of its main entrance. Explore ways to enhance visibility & positioning through temporary signage at the main entrance.
Direct mail has generated a smaller proportion of leads and move-ins than RD typically sees in similar communities. This may be due in part to the positioning and messaging not connecting to the reader RD suggests incorporating new positioning and value messaging into new direct mail campaigns.
Charts detailing sales and marketing data are shown on the following pages. The first table, listing new sales and move-outs, considers the sales gain after subtracting move-outs.
New Sales and Move-outs
Date RangeTotal Months
New Sales
Avg. sales per mo.
Move-ins
Avg. move-ins per mo.
Move-outs
Avg. Move-outs per mo.
Avg. net gain per mo.
6/1/10 -12/31/10 7 21 3.0 13 1.9 4 0.6 1.31/1/11 -6/30/11 6 13 2.2 12 2.0 8 1.3 .7
Year Jan 1 Feb Mar Apr May Jun Jul Aug Sep Oct NovDec31 Mo.Avg.
2008Actual 68 76 82 81 83 84 82 82 82 84 85 86 1.5
Budget 29 46 54 62 69 76 83 90 95 101 107 113 7.0
2009Actual 86 90 95 98 97 99 108 109 112 111 114 118 2.67
Budget 113 92 94 96 98 100 102 104 106 108 110 112 -0.08
2010Actual 118 120 119 124 123 122 125 130 131 132 131 132 1.17
Budget 112 118 120 122 124 126 128 130 132 134 136 138 2.17
2011Actual 132 133 132 133 134 136 138 140 1.0
Budget 138 138 140 142 144 146 148 150 1.51.64 Avg. since 1/2008
1.10 Avg. since 1/2010

Plymouth Place Marketing Audit 17
The table below considers the conversion rates of new leads to sales, and move-ins
New Sales Conversion to 10% Deposits and Move-ins
New Leads Conversion to Sales
Date RangeTotal Months
New Leads
Gross Sales
Gross Move-ins
Conversion of leads to sales
Conversion of leads to move-ins
6/1/10 -12/31/10 7 768 21 13 3% 2%1/1/11 -6/30/11 6 682 13 12 2% 2%
The table below outlines the sales staff activity and results for January 1 – June 30, 2011.
Sales Activity
Date Range# Months Call-outs
Avg. Calls per day all sales staff
Presentations
Avg. Presentations per week Sales
Avg. Sales per mo.
% of Leads to presentations
% Presentations to Sales
June - December 2010 7 3386 25.7 559 23.3 22 3.7 16.5% 3.9%January - June 2011 6 3483 26.4 408 17.0 14 2.3 11.7% 3.4%
Sources of Leads and Conversions to Sales – All Years Combined
Category # Leads Gross SalesConversion
%Gross
Move-insConversion
%Advertising - Directory Listings 15 0 0.0% 0 0.0%Advertising - Magazine 54 1 1.9% 1 1.9%Advertising - Newspaper 227 25 11.0% 8 3.5%Advertising - Yellow Pages 82 3 3.7% 3 3.7%Community Networking 250 16 6.4% 15 6.0%Direct Mail 601 23 3.8% 18 3.0%Direct Mail -Newsletters 114 7 6.1% 3 2.6%Direct Mail - Surveys 282 0 0.0% 0 0.0%Imported from Surveys 3540 219 6.2% 141 4.0%Events - New Prospects/leads 730 24 3.3% 7 1.0%Events - Depositors 3 0 0.0% 0 0.0%Events - Seminars 140 5 3.6% 5 3.6%Internet 1006 25 2.5% 19 1.9%

Plymouth Place Marketing Audit 18
Referrals 1573 128 8.1% 88 5.6%Signage/Drive-by 1312 79 6.0% 57 4.3%Telemarketing 32 0 0.0% 0 0.0%Total 9961 555 5.6% 365 3.7%
IX. The marketing plan and marketing budget seems to be underfunded.
o PLP’s fiscal year runs from January 1 through December 31. PLY and Greystoneprovided information on marketing budgets, and cost per lead for years 2008, 2009, 2010, and 2011. The cost per lead has significantly exceeded industry benchmarks for an urban area over the past four years ranging from $701 in 2008 to a high of $1,379 in 2009 and $806 in 2008. The cost per lead for the first six months of 2011 was $806 per lead. The industry benchmark for cost per lead depending on the type of market, urban vs. suburban or rural, ranges from $350 - $500 per lead. The cost per lead for 2011 is above the high end of that benchmark.
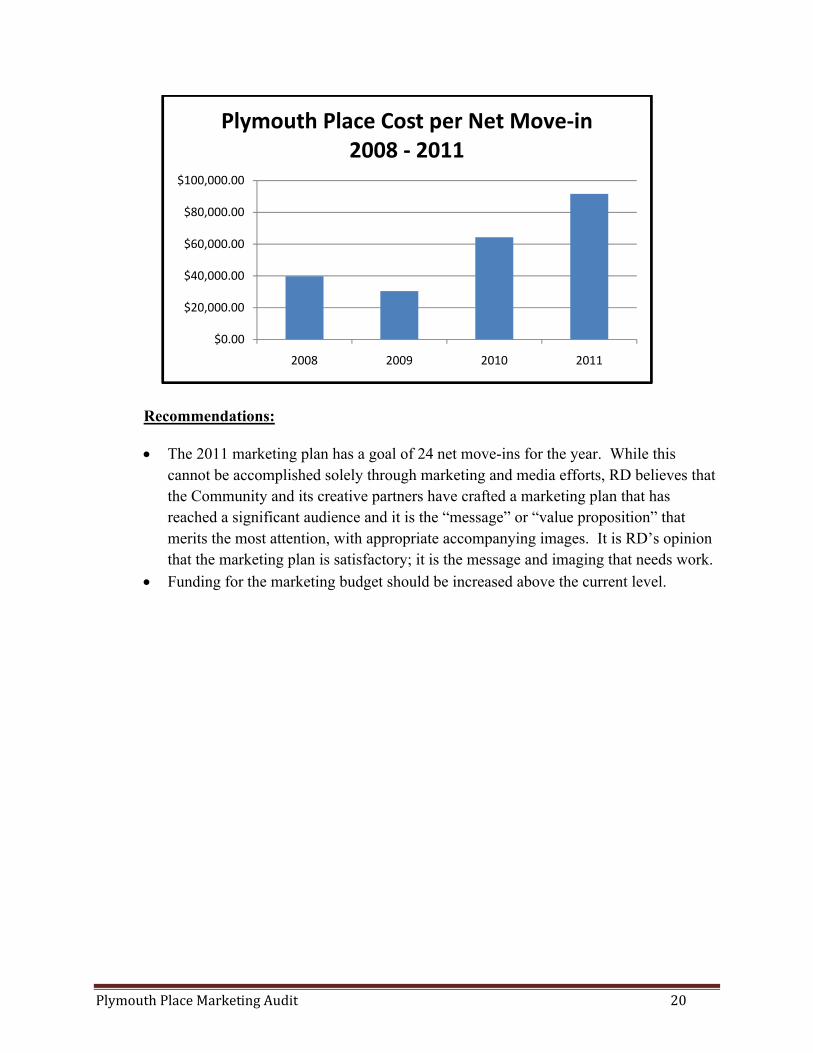
o The cost per net move-ins for 2008 through 2011 ranged from $30,467 to $91,606. In 2008 the median cost per gross move-in as reported in the New Community Database, Ziegler Capital Markets, was $24,047. PLP’s cost per sale has been significantly higher than what would be expected.
o The tables below illustrate: marketing budget for the years 2006 through 2011, move-ins for the years 2008 through 2011, and the cost per move-in for 2008 through 2011. PLP opened and began move-ins in October 2007. Of note are the findings for 2009, where the number of net move-ins was at the highest point of 32, the marketing budget was $974,957, the cost per lead was $1,379, and the cost per net move-in was $30,467. This would indicate that the level of spending seems to have a direct relationship to the rate of move-in success.
YearMarketing budget
Net move-ins
Cost per net move-in
2006 $805,9702007 $521,3522008 $716,515 18 $39,806.392009 $974,957 32 $30,467.412010 $899,900 14 $64,278.57
2011YTD $549,633 6 $91,606.00

Plymouth Place Marketing Audit 19
$0
$200,000
$400,000
$600,000
$800,000
$1,000,000
$1,200,000
2006 2007 2008 2009 2010 2011
Plymouth Place Marketing Budget2006 - 2011
0
5
10
15
20
25
30
35
2006 2007 2008 2009 2010 2011
Plymouth Place Net Move-ins2008 - 2011
Plymouth Place Marketing Audit 20
Recommendations:
The 2011 marketing plan has a goal of 24 net move-ins for the year. While this cannot be accomplished solely through marketing and media efforts, RD believes that the Community and its creative partners have crafted a marketing plan that has reached a significant audience and it is the “message” or “value proposition” that merits the most attention, with appropriate accompanying images. It is RD’s opinion that the marketing plan is satisfactory; it is the message and imaging that needs work.
Funding for the marketing budget should be increased above the current level.
$0.00
$20,000.00
$40,000.00
$60,000.00
$80,000.00
$100,000.00
2008 2009 2010 2011
Plymouth Place Cost per Net Move-in2008 - 2011

Plymouth Place Marketing Audit 21
Blended Marketing Suggestions for Plymouth Place
9/8/11
Rank Recommendation
Estimates of Potential Monthly Net Sales Gains
Comments
1 Offer a C Contract for Healthcare services for apartments that includes an Entrance Fee reduction of at least $60K per residence.
.5 The current cottage offering allows for prospects to purchase Lifecare for $60K per person. If those same rates were applied to the 1st Gen Apartments the EF could be lowered by up to $120K per residence which would make it much more likely that a couple with a home value closer to the PMA home values would choose Plymouth Place. It is also likely that many would choose to buy Lifecare. It can be an opportunity to strengthen the message and an understanding of the value of Lifecare. This offering should be made while continuing the current ladder discount program or the bridge loan.
2 Offer a lower refund on the entrance fee to allow for a corresponding reduction in the monthly service fee.
.4 Reduce the Entrance Fee Refund to 70% from 90% and lower the Monthly Service Fee by 20%. This would allow those with lower incomes to be able to afford Plymouth Place’s remaining residences.
3 Allow the sales team to discount to 2009-10 Lifecare EF levels to incent 1st Gen apartment sales. (5+%).
.3 The sales momentum appears to have changed significantly after the recent price increase. Unfortunately this price increase did not generate a bump in the volume of sales prior to it taking effect as the last one did. By allowing the sales team to have this option to use as an incentive the sales will increase. This would be a private offering.
4 Change the current cottage pricing and offering in three ways:
1. Raise EF and MSF to be more in line with 1st Gen Apartments.
2. Discontinue the offer of Lifecare as an open ended offer.
3. Choose a selection of Cottages to sell and refrain from showing or listing the remaining inventory for sale.
.2 The current cottage offering is priced in a way that it may dissuade some prospects from buying an Apartment. The margins after the CAPEX expenditures appear to be too low to merit the additional internal competition. The offer for Lifecare at $60K per person that is perceived to be available at any point after move-in has already been discontinued. If Plymouth Place is willing to offer a fee for service or unbundled offering it should be on the 1st Gen Apartments not on the Cottages in order to push demand to those residences. The estimated total number of cottages available is 30 and this glut of residences while explainable maybe a red flag for prospects. By limiting the offering of the cottages the new sales can provide market differentiation, inventory and potentially provide cash for the bottom line while preserving parts of the cottage area for future development. RD also suggests publicly sharing the cottage offering.
5 Consider retaining a bridge or specialty loan partner to provide capital to provide loans to incoming residents against their home equity or other assets.
.2 Two firms, Capital Access Partners and Elderlife Financial Services have been successfully partnering with CCRC’s to provide bridge financing for incoming residents. These programs would benefit Plymouth Place by speeding the receipt of entrance fee revenue upon move-in as opposed to the current deferred entrance fee time frame. As an incentive to use the program Plymouth Place should consider paying interest and set-up costs for residents until the loan is repaid or for up to 12-months. This offering should be created to be the preferred alternative to the current deferred entrance fee plan.
6 Develop and implement a formal, branded “Home Selling Assistance” program to assist prospects with the details of
.1 Plymouth Place currently has an informal network of realtors, movers, and move managers that incoming residents are referred to. Making the program more formal and band it with collateral materials, formal relationships with the providers

Plymouth Place Marketing Audit 22
Rank Recommendation
Estimates of Potential Monthly Net Sales Gains
Comments
readying a home for sale, right sizing, selecting a Realtor and executing a move to P.P. Use current incentive program to encourage prospects to utilize these services. Tie any incentives into the use of the Plymouth Place system to sell homes.
would further encourage use of these resources in supporting prospects’ decision to move to Plymouth Place and in expediting the time frame with which entrance fees are received.
7 Refine positioning in collateral and marketing and advertising materials so that the unique strengths and key differentiators of Plymouth Place are key part of the primary marketing message.
.1 Establishing a unique positioning to strengthen Plymouth Place’s brand in the market will assist in differentiating the community from other competition. Plymouth Place has an enviable 65 year history setting it apart from newer competition. With current volatility and uncertainty in the economy & housing markets Plymouth Place can present its stability and strength as an appealing choice for seniors. Plymouth Place’s location should be emphasized to entice more of those borderline zip prospects to visit and judge for themselves. These unique messages should be included in all collateral, advertising and marketing materials.
8 Adjust the sales team’s commission incentives so that the highest incentives are paid on bulk of the remaining1st generation inventory.
.05 Currently the sale team is incentivized to move people in quickly. Since the 1st Generation Entrance Fees provide the greatest benefit to paying off the short term debt we suggest adding a $500 bonus for those sales to focus the sales. team’s effort on that part of the remaining inventory.
Notes to the above:
1. The Fee for Service offering can be modeled on the Cottage fee for service offering which provides $60K per person for Lifecare coverage. If the reduction for a couple of $120K is too high $60K is permissible and will benefit sales but should also be changed for the cottage offering.
a. It may be appropriate to offer a larger EF reduction for the Fee for Service agreement with a corresponding lower refundability of the Fee for Service Entrance Feeb. 2nd Generation sales are almost all owed refunds and as such the offering for 2nd generation sales for a fee for service agreement will need to be adjusted to be in line with the refund owed plus 10% of that repayment.c. The Fee for Service offer is not intended to be offered with the 2009-2010 pricing offer suggested in suggestion #3.
2. Suggestion #2 above should be exclusive of suggestions #1 and #3 but can be offered with the deferred Entrance Fee incentive or the equity line offer suggested in suggestion #5. a. In most cases this offer would not be available for 2nd generation sales.
3. Private offering means that these discounts should not be publicly communicated in marketing materials but rather offered by the marketing team to hot prospects for which they may make a difference. RD believes that a public offering of these types of discounts could lead to prospects questioning the financial stability of Plymouth Place, especially in light of the recent bankruptcies in the Chicago market.
4. All incentives should be offered for a limited time or for a limited number but should be arranged so that the pace of sales can achieve a sustained gross rate of 3 or more per month. Once the pace of sales and move-ins meets that goal for a quarter of more PP can begin to phase them out.
5. RD has communicated with Greystone’s team and the Plymouth Place team to offer the blended opinions offered above. The only area where we had a difference of opinions was in the results that could be created by suggestion #4. RD believes that changing the cottage offering and publicly communicating the availability of the cottages will increase traffic and results.
6. Greystone is actively calculating the financial impact of the lower entrance fees and higher pace of sales projected above as compared to the current pace of sales and higher entrance fee revenues. a. RD believes that these incentives will speed Plymouth Place’s ability to repay the short term debt on the community despite the lower Entrance Fees received on each residence. The goal of these suggestions is to
increase the pace of gross sales from 2 per month to 3 per month thereby increasing the EF revenue to pay down that debt.