market view april 2016
TRANSCRIPT

Market View Year 2015, January – April 2016

Copyright © 2015 Information Resources, Inc. (IRI). Confidential and Proprietary. 2
Value Sales Trend: Super/Hyper Markets FMCG Metrics
Super/Hyper Markets (including Key Retailers, smaller Retailers and Sklavenitis real data)
Channels
Greece Mainland
Crete Areas
YR 2015 vs YR 2014
Jan-Apr 2016 vs Jan-Apr 2015 Periods
Study ID
Copyright © 2016 Information Resources, Inc. (IRI). This publication contains IRI confidential information. Unless otherwise expressly permitted in writing, this information should not be released or disclosed to other third parties.

Copyright © 2015 Information Resources, Inc. (IRI). Confidential and Proprietary. 3
Stores with large selling spaces (over 2500 sqm) and even broader range of products
Hypermarket
Self-service retail stores with a central check-out area and at least 2 cash registers, offering a large variety of groceries as well as consumer durables and goods
Supermarket
Self-service retail stores carrying mainly groceries in limited range with emphasis on own label products and low prices
Discounters
Channels definitions

Copyright © 2015 Information Resources, Inc. (IRI). Confidential and Proprietary. 4
Greece economy
RETAIL TURNOVER INDEX (w.o AUTOMOTIVE FUEL)
INFLATION RATE TREND UNEMPLOYMENT
-4 .9%
-7.1%
-5.3%
-1.8%
-0.2%
-6.4%
2010 2011 2012 2013 2014 2015
GDP
4.7%
3.3%
-0.9%-1.3%
-1.7%
1.5%
2010 2011 2012 2013 2014 2015
14.8%
21.0%
27.5% 26.5%25.0%
26.9%
2010 2011 2012 2013 2014 2015
-1.2%
-7.2%
-8.6%
-1.0% -1.0%
-11.3%
2010 2011 2012 2013 2014
Jan/Oct
'15 vs.
Jan/Oct
'14
Source: ELSTAT Feb 2016 (latest available period/provisional data)

Copyright © 2015 Information Resources, Inc. (IRI). Confidential and Proprietary. 5
HM/SM VALUE SALES TREND
YR 2013YR 2014
YR 2015
YR 2013 YR 2014 YR 2015
-1.4%
-2.1%
Source: IRI InfoScan, HM/SM (including Key Retailers, smaller Retailers and Sklavenitis data)
In 2015 the negative sales trend is deccelarating compared to the previous years

Copyright © 2015 Information Resources, Inc. (IRI). Confidential and Proprietary. 6
HM/SM VALUE SALES TREND
YTD 2014 YTD 2015YTD 2016
YTD 2014 YTD 2015 YTD 2016
-1.1%
-5.7%
Overall sales in YTD are declining
Source: IRI InfoScan, HM/SM (including Key Retailers, smaller Retailers and Sklavenitis data), YTD: Jan-Apr 2016

Copyright © 2015 Information Resources, Inc. (IRI). Confidential and Proprietary. 7
TRENDS PER SHOP TYPE - YTD
Medium sized Super Markets (400-1000 sq.m.) manage to reverse the negative trend in YTD
0-400 sqm
2500+ sqm
400-1000 sqm
1000-2500 sqm
• % Value Contribution: 13,3%
• Value sales trend: -17,7%
• % Value Contribution: 9,1%
• Value sales trend: -23,9%
• % Value Contribution: 44,4%
• Value sales trend: -1,6%
• % Value Contribution: 33,2%
• Value sales trend: 1,3%
Source: IRI InfoScan, HM/SM (including Key Retailers, smaller Retailers and Sklavenitis data), YTD: Jan-Apr 2016

Copyright © 2015 Information Resources, Inc. (IRI). Confidential and Proprietary. 8
LIDL VALUE SALES TREND
YTD 2014 YTD 2015YTD 2016
Column 2YTD 2014 YTD 2015 YTD 2016
1.2%
9.0%
Lidl sales are increasing in YTD
Source: IRI Lidl estimation, YTD: Jan-Apr 2016
Copyright © 2015 Information Resources, Inc. (IRI). Confidential and Proprietary. 9
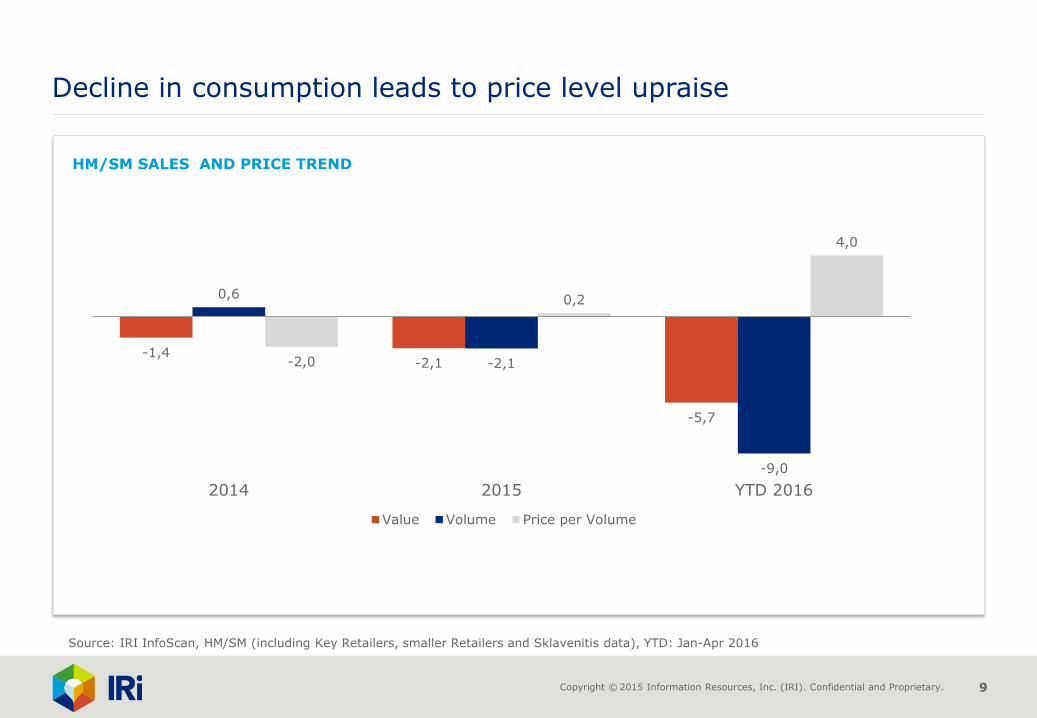
HM/SM SALES AND PRICE TREND
Decline in consumption leads to price level upraise
Source: IRI InfoScan, HM/SM (including Key Retailers, smaller Retailers and Sklavenitis data), YTD: Jan-Apr 2016
-1,4 -2,1
-5,7
0,6
-2,1
-9,0
-2,0
0,2
4,0
2014 2015 YTD 2016
Value Volume Price per Volume

Copyright © 2015 Information Resources, Inc. (IRI). Confidential and Proprietary. 10
HM/SM VALUE SALES TREND BY MONTH
-0,4%
-3,7%
-0,6%
-7,7%
-1,4%
-2,9%
-6,9% -6,6%
-4,1%
-2,4% -3,1%
-2,6%
-4,2%
3,0%
-2,7%
-4,8%
4,1%
1,5% 1,5%
-3,3%
-3,1% -3,4% -2,7%
-2,5%
2,3%
-4,4%
3,1%
-6,3%
-0,1%
5,5%
-8,3%
-0,5%
-2,6%
-3,9% -3,6%
-7,5%
-6,0%
-8,3% -8,8%
2,0%
Source: IRI InfoScan, HM/SM (including Key Retailers, smaller Retailers and Sklavenitis data)
April was the first month with a positive growth sign after the referendum due to Easter period

Copyright © 2015 Information Resources, Inc. (IRI). Confidential and Proprietary. 11
HM/SM UNIT SALES TREND BY MONTH
1,9%
0,8%
3,2%
-2,5%
-0,6% 0,0%
-5,6% -6,0%
-2,3% -2,7%
-1,8% -1,6%
-3,1% -2,5%
-3,2%
0,3%
-2,6%
1,5%
3,2%
-7,2% -5,5% -5,4% -6,4% -8,5%
2,0%
-5,0%
1,4%
-7,6%
-0,8%
4,8%
-9,3%
-3,8%
-6,7%
-9,5% -7,8%
-11,6% -11,2%
-11,7%
-13,5%
-0,9%
Source: IRI InfoScan, HM/SM (including Key Retailers, smaller Retailers and Sklavenitis data)
Despite Easter period, April is slightly negative in unit sales

Copyright © 2015 Information Resources, Inc. (IRI). Confidential and Proprietary. 12
HM/SM VALUE SALES TREND 2015
-2,0%
-2,4%
-2,1%
FOOD
HBA
HOUSEHOLD
YTD
-6,1%
-4,2%
-3,2%
FOOD
HBA
HOUSEHOLD
Source: IRI InfoScan, HM/SM (including Key Retailers, smaller Retailers and Sklavenitis data), YTD: Jan-Apr 2016
All segments mark negative trends in YTD

Copyright © 2015 Information Resources, Inc. (IRI). Confidential and Proprietary. 13
HM/SM UNIT SALES TREND 2015
-4,4%
-3,9%
-2,4%
FOOD
HBA
HOUSEHOLD
YTD
-10,6%
-4,6%
-6,8%
FOOD
HBA
HOUSEHOLD
Source: IRI InfoScan, HM/SM (including Key Retailers, smaller Retailers and Sklavenitis data), YTD: Jan-Apr 2016
Food categories are driving the loss in unit sales
Copyright © 2015 Information Resources, Inc. (IRI). Confidential and Proprietary. 14
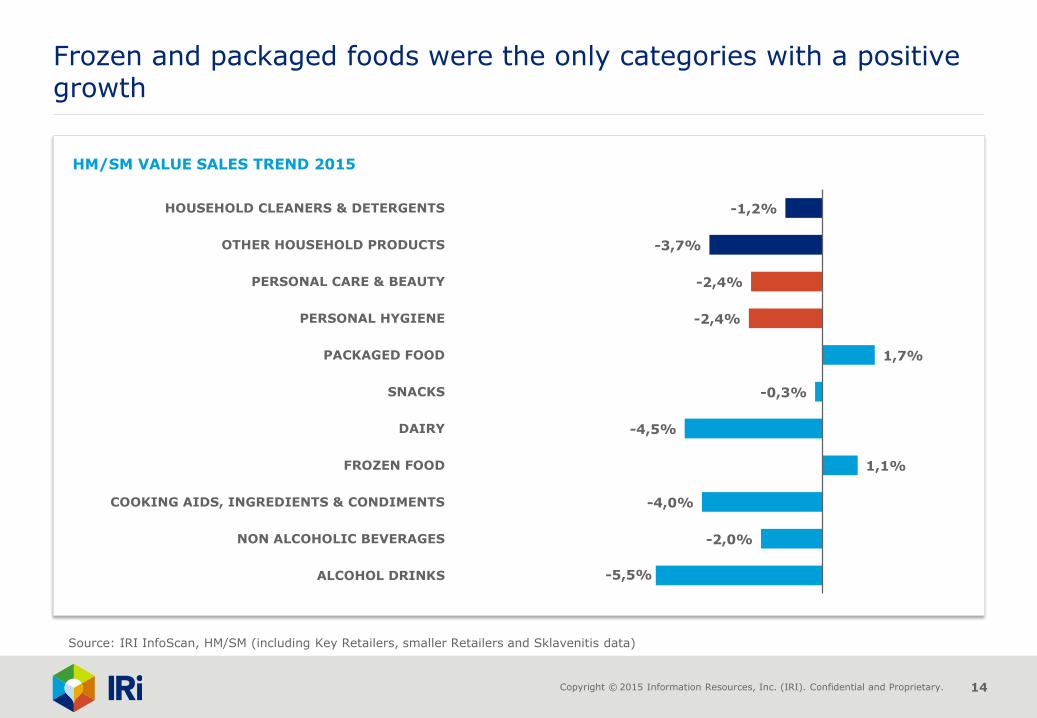
Source: IRI InfoScan, HM/SM (including Key Retailers, smaller Retailers and Sklavenitis data)
Frozen and packaged foods were the only categories with a positive growth
HM/SM VALUE SALES TREND 2015
-1,2%
-3,7%
-2,4%
-2,4%
1,7%
-0,3%
-4,5%
1,1%
-4,0%
-2,0%
-5,5%
HOUSEHOLD CLEANERS & DETERGENTS
OTHER HOUSEHOLD PRODUCTS
PERSONAL CARE & BEAUTY
PERSONAL HYGIENE
PACKAGED FOOD
SNACKS
DAIRY
FROZEN FOOD
COOKING AIDS, INGREDIENTS & CONDIMENTS
NON ALCOHOLIC BEVERAGES
ALCOHOL DRINKS

Copyright © 2015 Information Resources, Inc. (IRI). Confidential and Proprietary. 15
Source: IRI InfoScan, HM/SM (including Key Retailers, smaller Retailers and Sklavenitis data)
Packaged foods were the only categories with a positive growth
HM/SM UNIT SALES TREND 2015
-2,6%
-2,2%
-3,0%
-4,8%
0,3%
-5,5%
-5,3%
-2,4%
-7,8%
-4,3%
-7,9%
HOUSEHOLD CLEANERS & DETERGENTS
OTHER HOUSEHOLD PRODUCTS
PERSONAL CARE & BEAUTY
PERSONAL HYGIENE
PACKAGED FOOD
SNACKS
DAIRY
FROZEN FOOD
COOKING AIDS, INGREDIENTS & CONDIMENTS
NON ALCOHOLIC BEVERAGES
ALCOHOL DRINKS

Copyright © 2015 Information Resources, Inc. (IRI). Confidential and Proprietary. 16
HM/SM VALUE SALES TREND YTD
-2,8%
-4,0%
-1,6%
-6,7%
-5,6%
-3,6%
-9,4%
-8,7%
-2,1%
-5,1%
-9,7%
HOUSEHOLD CLEANERS & DETERGENTS
OTHER HOUSEHOLD PRODUCTS
PERSONAL CARE & BEAUTY
PERSONAL HYGIENE
PACKAGED FOOD
SNACKS
DAIRY
FROZEN FOOD
COOKING AIDS, INGREDIENTS & CONDIMENTS
NON ALCOHOLIC BEVERAGES
ALCOHOL DRINKS
Source: IRI InfoScan, HM/SM (including Key Retailers, smaller Retailers and Sklavenitis), YTD: Jan-Apr 2016
All categories decrease in value during the first 4 months of 2016

Copyright © 2015 Information Resources, Inc. (IRI). Confidential and Proprietary. 17
HM/SM UNIT SALES TREND YTD
-3,8%
-9,7%
-0,5%
-8,6%
-10,0%
-12,0%
-11,3%
-16,2%
-10,3%
-7,3%
-12,1%
HOUSEHOLD CLEANERS & DETERGENTS
OTHER HOUSEHOLD PRODUCTS
PERSONAL CARE & BEAUTY
PERSONAL HYGIENE
PACKAGED FOOD
SNACKS
DAIRY
FROZEN FOOD
COOKING AIDS, INGREDIENTS & CONDIMENTS
NON ALCOHOLIC BEVERAGES
ALCOHOL DRINKS
Source: IRI InfoScan, HM/SM (including Key Retailers, smaller Retailers and Sklavenitis), YTD: Jan-Apr 2016
All categories decrease in units during the first 4 months of 2016

Copyright © 2015 Information Resources, Inc. (IRI). Confidential and Proprietary. 18
Source: IRI InfoScan, HM/SM (including Key Retailers, smaller Retailers and Sklavenitis), YTD: Jan-Apr 2016
Winning and losing categories in YTD
CATEGORIES WITH THE BIGGEST GROWTH IN VALUE
CATEGORIES WITH THE BIGGEST DECLINE IN VALUE
• Food supplements • Iron aids and water
• Insecticides • Olives
• Seasonal chocolates • Packaged sausages
• Female razors and blades • Baby colognes
• Baby food (jars, juices, biscuits) • Sun care products

19
Evolution of Private Labels IRI InfoScan

Copyright © 2015 Information Resources, Inc. (IRI). Confidential and Proprietary. 20
PL losing ground for the first time in 2015, marking the lowest share in YTD ’16 since 2012
PL IN SUPER/HYPER MARKETS, 2007-2016
Source: IRI InfoScan, HM/SM (including Key Retailers, smaller Retailers and Sklavenitis), YTD: Jan-Apr 2016 Figures in grey brackets, indicate PL‘s value growth vs YA
5,9% 7,3%
8,6%
11,9%
16,1% 17,8% 18,3% 19,0%
18,0% 16,9%
2007 2008 2009 2010 2011 2012 2013 2014 2015 YTD
7.4% 0.8% 2.3%
-7.0% -16.1%
34.5%
35.9%
19.1%
25.8%

21
Leading barcodes IRI InfoScan

Copyright © 2015 Information Resources, Inc. (IRI). Confidential and Proprietary. 22
No 3
• Καραμολέγκος σταρένιο φόρμα 680γρ
No 2
• Λουμίδης Παπαγάλος παραδοσιακός 200γρ
No 1 in unit
• Νερό Ζαγόρι 500ml
Leading barcodes for April ‘16 in terms of value and unit sales
No 3
• Νescafe classic 200γρ
No 2
• Νescafe classic 100γρ
No 1 in value
• Λουμίδης Παπαγάλος παραδοσιακός 200γρ
Top 3 barcodes contribute 0.88% of total FMCG value sales
Top 3 barcodes contribute 1.07% of total FMCG sales in units
Source: IRI InfoScan, HM/SM (including Key Retailers, smaller Retailers and Sklavenitis), YTD: Jan-Apr 2016

23
Top manufacturers’ performance IRI InfoScan

Copyright © 2015 Information Resources, Inc. (IRI). Confidential and Proprietary. 24
VALUE SALES TREND 2015 AND YTD
-5,7%
-2,4% -2,9%
-12,1%
-2,5%
-6,6% -7,2%
-15,7%
-4,1%
8,0%
11,1%
-0,8%
-7,6%
-0,5%
1,0%
-8,5%
-1,4% -0,3%
-7,4%
-14,6%
1,9%
-15,1%
-4,1% -6,2%
7,8% 9,4%
TO
TAL M
ARKET
UN
ILEVER
P&
G
DELTA-B
. STATH
IS
NESTLE-P
URIN
A
CCH
BC
FRIE
SLAN
D
OLYM
PO
S
MO
ND
ELEZ
PAPAD
OPO
ULO
U
MEG
A
CO
LG
ATE-P
ALM
OLIV
E
FAG
E
ELBIS
CO
SARAN
TIS
HEN
KEL
ATH
EN
EAN
RECKIT
MIN
ERVA
BO
LTO
N
ION
SCA
TASTY
PEPSIC
O
GIO
TIS
KARAM
OLEG
OS
YTD
-2,1% -2,4% -6,8% -3,6% -2,2% -2,0% -5,4% -0,5% -1,0% 4,3% 20,5% 1,1% -10,0% 4,8% -5,8% 1,8% 1,4% -3,8% -2,4% 7,3% 1,9% -17,1% -0,6% -12,0% 5,6% 6,4%
Key manufacturers
Figures in blue indicate the trend for 2015 Source: IRI InfoScan, Ranked based on value sales 2015, YTD: Jan-Apr 2016
General Mills 2015 vs 2014 +2.7% YTD Jan – Apr +3.5%

Copyright © 2015 Information Resources, Inc. (IRI). Confidential and Proprietary. 25
IRI CONTACTS
FOR MORE INFORMATION
Simos Triandafillakis
(+30) 2102787678
ABOUT IRI
IRI is a leader in delivering powerful market and
shopper information, predictive analysis and the
foresight that leads to action. We go beyond the
data to ignite extraordinary growth for our clients
in the CPG, retail and over-the-counter healthcare
industries by pinpointing what matters and
illuminating how it can impact their businesses
across sales and marketing. Move your business
forward at IRIworldwide.com and/or
IRIworldwide.gr
Greek Office
31 Spartis Street,
144 52 Metamorfosi, Athens, GR
(+30) 210 27 87 600
Copyright © 2016 Information Resources, Inc. (IRI). This publication contains IRI confidential information. Unless otherwise expressly permitted in writing, this information should not be released or disclosed to other third parties.