market study
DESCRIPTION
Feasibility part one. Helps Accounting StudentsTRANSCRIPT

Part 2 Market Study
I. INTRODUCTION
There are several things that must be considered in conducting a feasibility study. One
of the most important or the most essential element is the consideration of the demand and
supply of the business' products and services in the market. Other things such as competition,
target market, and market’s population size should also be considered. Truly, the success of the
business lies on how the market has been studied. Also, effective marketing of your products
and services will probably lead to success of the business. This can be done through
advertisements. Businesses may offer the best quality products or services in the world but
without proper marketing everything might fail. Better opportunities will come to those
businesses whose products and services were made known to potential customers.
This section may be carried out to help determine the feasibility of Rice in Roll in the
contemporary marketplace. It will help the analysts identify opportunities in the market and will
provide the necessary information about the prices, sizes, functions and features needed to
capture market share regardless of the booming demand of food industry in the present days as
well as its real-time supply.
II. OBJECTIVES
Analysis of the market study accompanies all data forecasts to illustrate how the market
responds to emerging industry trends. The objectives of this aspect are the following:
• To describe each service provided by the business,
• To determine prices for each product,
• To determine the procedure and process of each service,
• To determine production schedule,
• To identify the machines, machinery and equipment needed in processing the service,
1
Part 2 Market Study
• To determine the accessibility of location to the target market,
• To ensure the availability of utilities such as power supply, water, and telecommunication
for the business,
• To ensure the business is observing the proper waste disposal.
III. RESEARCH AND METHODOLOGY
The first step in order to start up a study is to gather or collect appropriate and sufficient
data or information. The analysts have gathered such information through the survey
questionnaires that have been given to the business’ potential customers and interviews to
some of its competitors. Market segmentation is also a part of the analyst’s methodologies. To
get the population size, we used the Sloven’s formula. Sloven’s formula is used to calculate an
appropriate sample size from a population.
A. Survey Questionnaire
A survey has been conducted by the analysts to have a further knowledge about
the potential customers’ needs and wants. The Sloven’s formula was used to get the sample
size of the target respondents. Six percent (6%) is the margin of error used. To determine the
sample size using Sloven’s Formula, the analysts carried out the population of Polytechnic
University of the Philippines – Taguig Branch. The total population is 2,481 which is also the
total market population used. The analysts have decided to segmentize the total sample
according to age from 18 years and above.
The number of respondents will be computed as follows;
Population Size : 2,481
2
Part 2 Market Study
Target Market Population Size : 2,481
Sloven’s Formula:
where:
N= Market Population sizee = Margin of error n= Sample size
Solution:
n=
n=
n=
n=
n= 251 respondents
The analysts conducted a survey to the students, faculty and staff of Polytechnic
University of the Philippines personallyto have a further knowledge about the potential
customers’ needs and wants.
B. Interview
3
25731+ (2573) (0.06)²
25731+ (2573) (0.0036)
2573 1+ 9.2628
2573 10.2628

Part 2 Market Study
The analysts have conducted interviews on nearby canteen, food stalls and other
similar business to determine average annual sales they gain in their business. The analysts
also asked questions to the interviewee to get some information that is necessary to the study.
C. Consultation
The analysts have conducted consultations regarding with unclear and additional
information necessary to the study are being discussed. It was also conducted to gain more
knowledge and to be informed about the different business requirements that the study need.
D. Gathering of Information through Books and Internet
With the help of the books and advance technology, we have conducted a
research to gather more information related to every aspect of the study. We have read several
books related to feasibility study and had a research through the internet which helped us
furnish every aspect of the research. We borrowed some studies related to our research from
the school library and from our professor. We also got information from our previous subjects
related in making a feasibility study and notes which helped us finish this aspect.
E. Market Segmentation
Every business uses some strategies to formulate, implement, and control
strategic marketing plans. One of these strategies mostly used is segmentation. Management
lends some of their time in segmentation strategies to effectively market their products and
services. Identifying, defining and targeting groups of high-potential prospective customers with
common characteristics and needs that distinguish them from other high-potential market
4
Part 2 Market Study
segments helped the researchers improve all aspects of the strategic marketing process,
including devising attractive marketing mix offerings, formulating segmentation and product
positioning strategies for efficiently reaching target markets, and controlling overall plan
effectiveness.
To help every business come up to selection of the most attractive markets and
products, effective and proper segmentation is needed. To be able to identify the specific type of
customers of Rice in Roll, the larger market may be divided into smaller target markets on the
basis of geographic, demographic, and psychographic as shown below:
Geographic:
Region: NCR
City: Taguig
Location: Lower Bicutan
Density of the Area: Urban
Population: Polytechnic University of the Philippines
Demographic:
Age: 16 and above
Gender: Male
Female
Occupation: Admin and Faculty
Staff
Students
Psychographic:
Nature/Personality: Love/Regularly eating rice and Filipino cuisines
5

Part 2 Market Study
F. Major Customers of the Services
Rice in Roll Filipino Fast Food Chain uses geographic, demographic,
psychographic and behavioral segmentation for the bases of their target market. Our target
market is composed of different individuals in Polytechnic University of the Philippines-Taguig
Branch.
1. Admin and Faculty
Both the full time and part time professors in PUPT were included in the
total target market population. These individuals usually go to the canteen during lunch break
or during snack time. Cleanliness in preparing the food should be the first thing to be
considered to make them try the products we are going to offer.
2. Staff
The school stuff will truly find our products as unique just like our other
target markets, this will lead them to try new products behind their limited time to find other
place to eat other than the canteen that have limited space for them to eat.
3. Students
Of course, students who form the largest group of individuals in the
university are the main target market of this feasibility study. Most of them do not have time to
prepare food in their homes to bring in the school that’s why they go to the canteen or
carinderias near the university. The students tend to have loads of works to do that they have
limited time to eat so it is more convenient for them to buy in our stall because the foods are
handy.
IV. DEMAND
6
Part 2 Market Study
Demand is an economic principle that describes a consumer's desire and willingness to
pay a price for a specific good or service. Holding all other factors constant, the price of a good
or service increases as its demand increases and vice versa. Demand should be determined to
know if the business’ products or services will be patronized in the market by the potential
customers. The success or failure of a business depends on the demand of the potential
customers. Demand analysis can be used. It is a marketing study used to determine what type
of customers are willing to buy a particular product and how many units they are likely to buy
and at what price range. This information is then used to plan advertising strategies, determine
selling cost and make product. Forecasting demand is a very important task not only in food
business but also in other type of industry. Knowledge of how demand will fluctuate enables the
supplier to keep the right amount of stock on hand. If demand is underestimated, sales can be
lost due to the lack of supply of goods. If demand is overestimated, the supplier is left with a
surplus that can also be a financial drain. Understanding demand makes a company more
competitive in the marketplace. Understanding demand and the ability to accurately predict it is
imperative for efficient manufacturers, suppliers, and retailers.
In conducting the above mentioned analysis of demand, the analysts must first find out
the population of the target market. For groundwork, we refer to the population given by the
head of the university’s registrar office.
A. Previous Population
The table presented below will be use by researchers to determine past
demand and supply.
Table 1: Previous Population Growth Rate
7

Part 2 Market Study
YEARTOTAL POPULATION
(Polytechnic University of the Philippines)
GROWTH RATE
Increase TARGET POPULATION
2010 2,495 2.24% 56 2,5512011 2,551 6.31% 161 2,7122012 2,712 (2.25%) (61) 2,6512013 2,651 (6.15%) (163) 2,4882014 2,488 3.42% 85 2,5732015 2,573 (5.25%) (135) 2,438
Table 1 shows population of Polytechnic University of the Philippines for
the past five years. The analyst gathered the information about the total population of
Polytechnic University of the Philippines-Taguig from 2010 to 2015 from the University’s
Registrar’s Office. They get the target population by adding total population to increase
in population.
B. Consumption for the Past Years
Determining and analyzing the past demand will help analyst in their future
decision about the business. To obtain the past demand for the past years, Frequency
of Availability (FOA) and Market Acceptability is necessary to determine. FOA is based
on the frequency of availing of the product/service by the respondent.
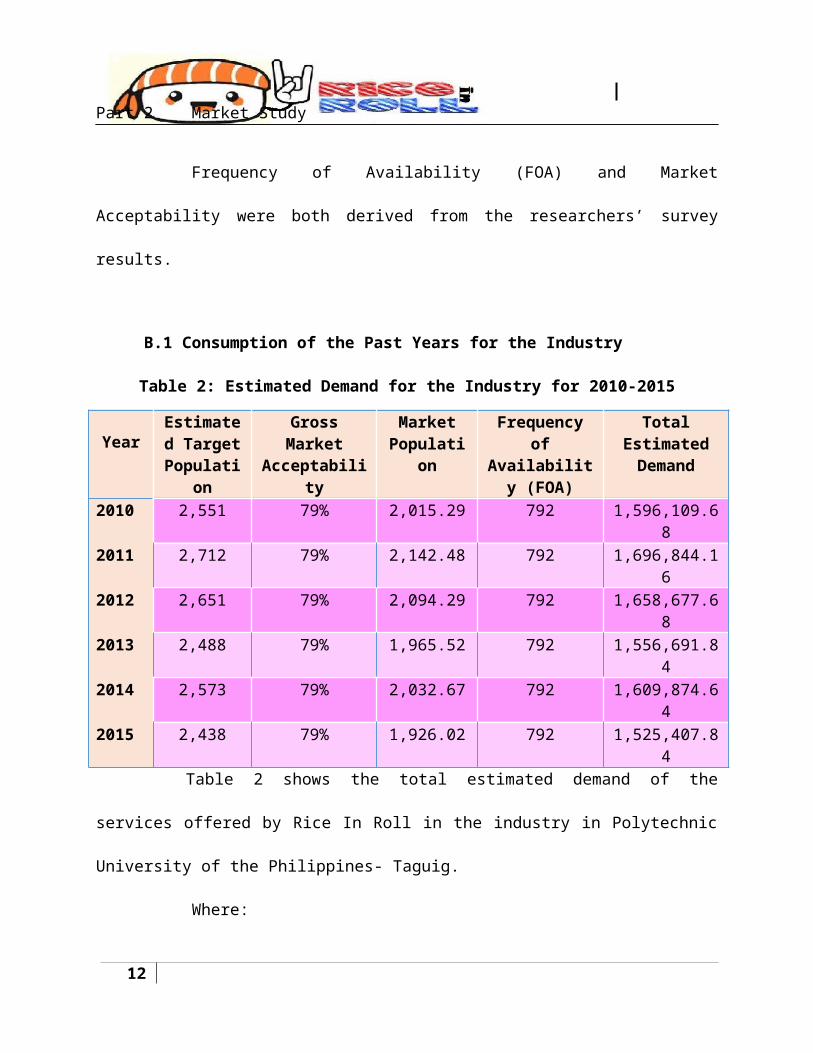
Frequency of Availability (FOA) and Market Acceptability were both
derived from the researchers’ survey results.
B.1 Consumption of the Past Years for the Industry
Table 2: Estimated Demand for the Industry for 2010-2015
YearEstimated
Target Population
Gross Market Acceptability
Market Population
Frequency of Availability
(FOA)
Total Estimated Demand
8

Part 2 Market Study
2010 2,551 79% 2,015.29 792 1,596,109.682011 2,712 79% 2,142.48 792 1,696,844.162012 2,651 79% 2,094.29 792 1,658,677.682013 2,488 79% 1,965.52 792 1,556,691.842014 2,573 79% 2,032.67 792 1,609,874.642015 2,438 79% 1,926.02 792 1,525,407.84 Table 2 shows the total estimated demand of the services offered by Rice
In Roll in the industry in Polytechnic University of the Philippines- Taguig.
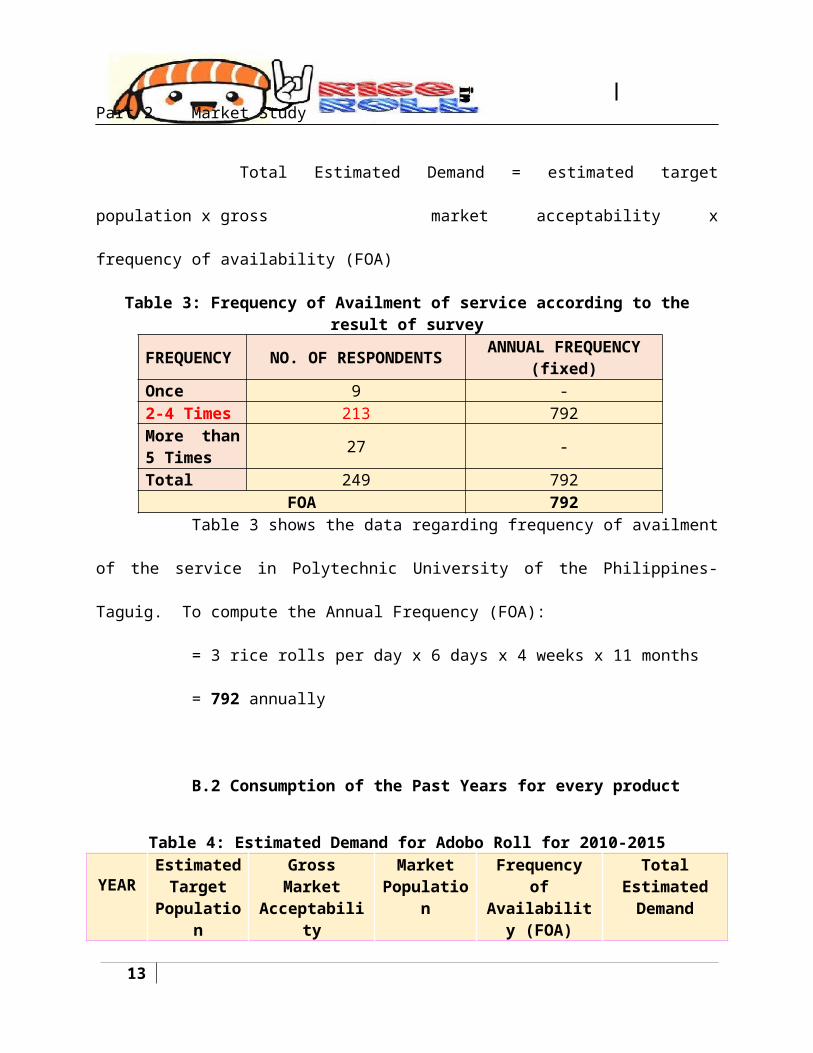
Where:
Total Estimated Demand = estimated target population x gross
market acceptability x frequency of availability (FOA)
Table 3: Frequency of Availment of service according to the result of surveyFREQUENCY
NO. OF RESPONDENTSANNUAL FREQUENCY
(fixed)Once 9 -2-4 Times 213 792More than 5 Times
27 -
Total 249 792FOA 792
Table 3 shows the data regarding frequency of availment of the service in
Polytechnic University of the Philippines- Taguig. To compute the Annual Frequency
(FOA):
= 3 rice rolls per day x 6 days x 4 weeks x 11 months
= 792 annually
B.2 Consumption of the Past Years for every product
Table 4: Estimated Demand for Adobo Roll for 2010-2015
9

Part 2 Market Study
YEAREstimated
Target Population
Gross Market Acceptability
Market Population
Frequency of Availability
(FOA)
Total Estimated Demand
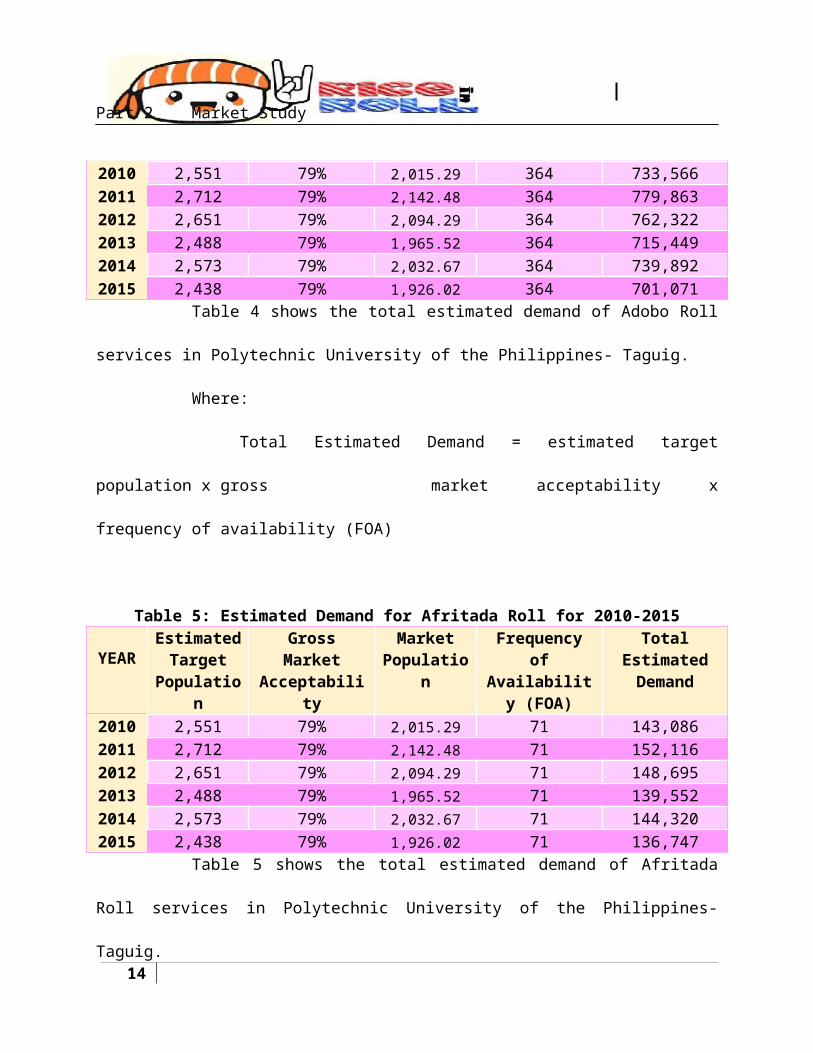
2010 2,551 79% 2,015.29 364 733,5662011 2,712 79% 2,142.48 364 779,8632012 2,651 79% 2,094.29 364 762,3222013 2,488 79% 1,965.52 364 715,4492014 2,573 79% 2,032.67 364 739,8922015 2,438 79% 1,926.02 364 701,071
Table 4 shows the total estimated demand of Adobo Roll services in
Polytechnic University of the Philippines- Taguig.
Where:
Total Estimated Demand = estimated target population x gross
market acceptability x frequency of availability (FOA)
Table 5: Estimated Demand for Afritada Roll for 2010-2015
YEAREstimated
Target Population
Gross Market Acceptability
Market Population
Frequency of Availability
(FOA)
Total Estimated Demand
2010 2,551 79% 2,015.29 71 143,0862011 2,712 79% 2,142.48 71 152,1162012 2,651 79% 2,094.29 71 148,6952013 2,488 79% 1,965.52 71 139,5522014 2,573 79% 2,032.67 71 144,3202015 2,438 79% 1,926.02 71 136,747
Table 5 shows the total estimated demand of Afritada Roll services in
Polytechnic University of the Philippines- Taguig.
Where:
Total Estimated Demand = estimated target population x gross
market acceptability x frequency of availability (FOA)
10

Part 2 Market Study
Table 6: Estimated Demand for Kaldereta Roll for 2010-2015
YEAREstimated
Target Population
Gross Market Acceptability
Market Population
Frequency of Availability
(FOA)
Total Estimated Demand
2010 2,551 79% 2,015.29 118 237,8042011 2,712 79% 2,142.48 118 252,8132012 2,651 79% 2,094.29 118 247,1262013 2,488 79% 1,965.52 118 231,9312014 2,573 79% 2,032.67 118 239,8552015 2,438 79% 1,926.02 118 227,270
Table 6 shows the total estimated demand of Kaldereta Roll services in
Polytechnic University of the Philippines- Taguig.
Where:
Total Estimated Demand = estimated target population x gross
market acceptability x frequency of availability (FOA)
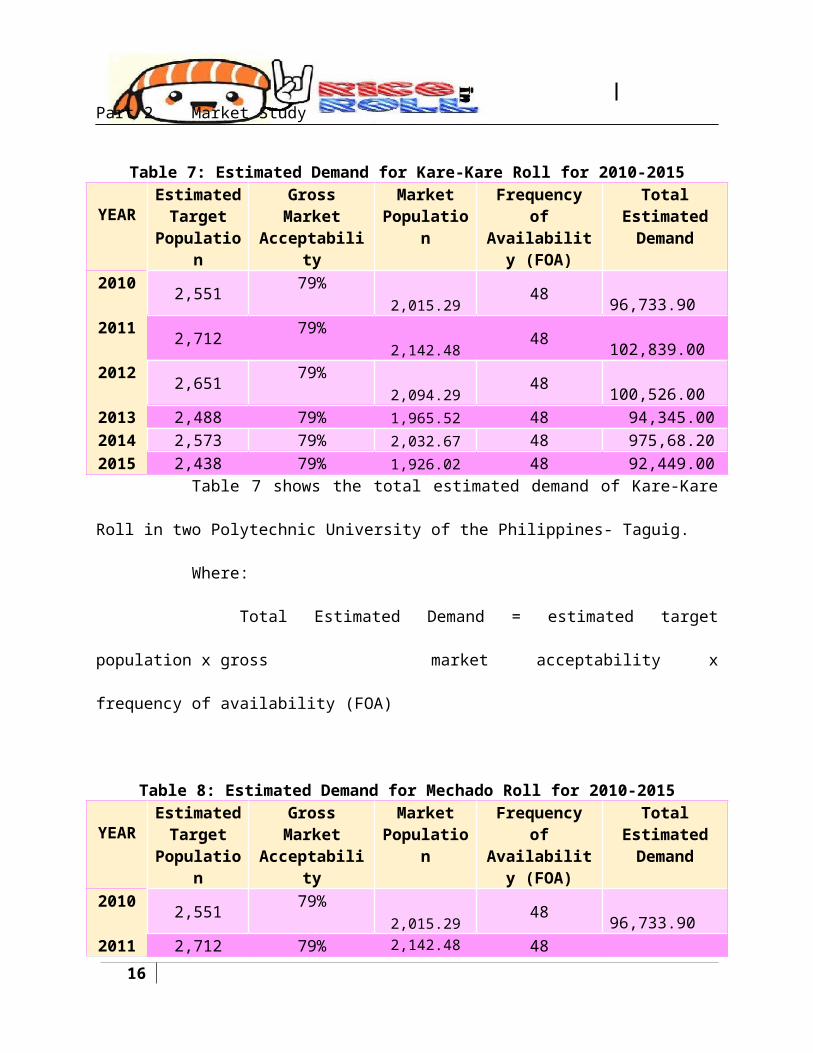
Table 7: Estimated Demand for Kare-Kare Roll for 2010-2015
YEAREstimated
Target Population
Gross Market Acceptability
Market Population
Frequency of Availability
(FOA)
Total Estimated Demand
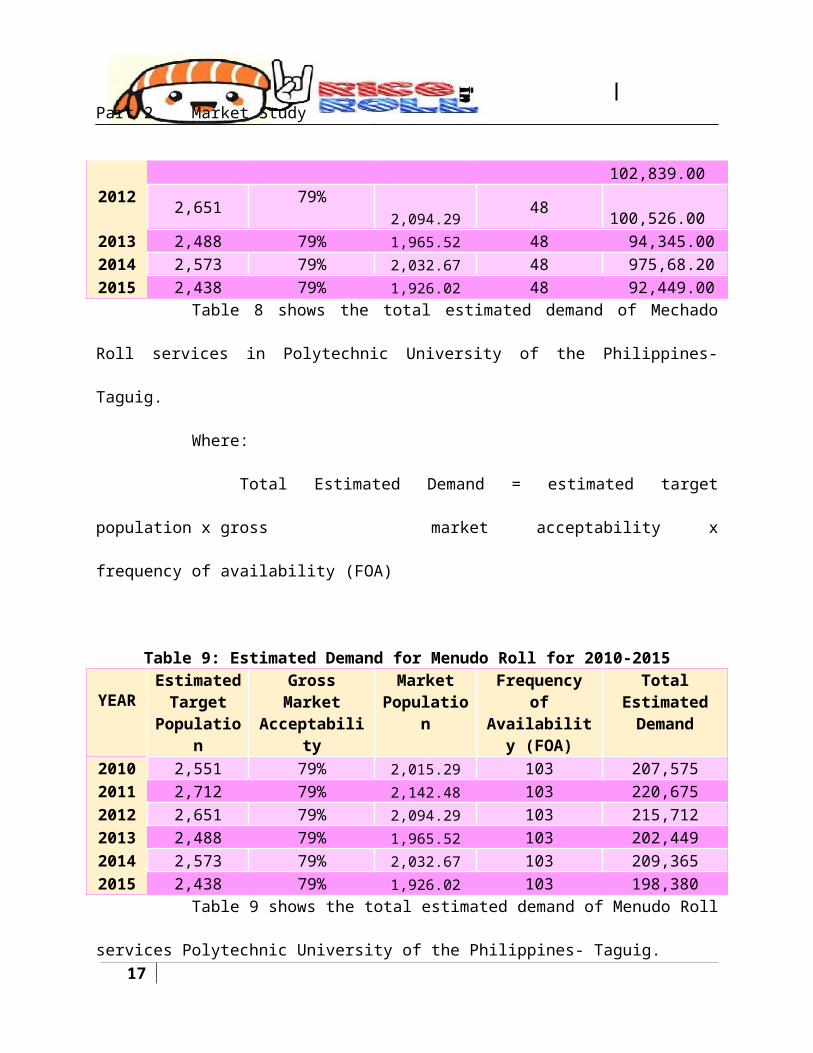
2010 2,551 79% 2,015.29 48 96,733.902011 2,712 79% 2,142.48 48 102,839.002012 2,651 79% 2,094.29 48 100,526.002013 2,488 79% 1,965.52 48 94,345.002014 2,573 79% 2,032.67 48 975,68.202015 2,438 79% 1,926.02 48 92,449.00
Table 7 shows the total estimated demand of Kare-Kare Roll in two
Polytechnic University of the Philippines- Taguig.
Where:
Total Estimated Demand = estimated target population x gross
market acceptability x frequency of availability (FOA)
11
Part 2 Market Study
Table 8: Estimated Demand for Mechado Roll for 2010-2015
YEAREstimated
Target Population
Gross Market Acceptability
Market Population
Frequency of Availability
(FOA)
Total Estimated Demand
2010 2,551 79% 2,015.29 48 96,733.902011 2,712 79% 2,142.48 48 102,839.002012 2,651 79% 2,094.29 48 100,526.002013 2,488 79% 1,965.52 48 94,345.002014 2,573 79% 2,032.67 48 975,68.202015 2,438 79% 1,926.02 48 92,449.00
Table 8 shows the total estimated demand of Mechado Roll services in
Polytechnic University of the Philippines- Taguig.
Where:
Total Estimated Demand = estimated target population x gross
market acceptability x frequency of availability (FOA)
Table 9: Estimated Demand for Menudo Roll for 2010-2015
YEAREstimated
Target Population
Gross Market Acceptability
Market Population
Frequency of Availability
(FOA)
Total Estimated Demand
2010 2,551 79% 2,015.29 103 207,5752011 2,712 79% 2,142.48 103 220,6752012 2,651 79% 2,094.29 103 215,7122013 2,488 79% 1,965.52 103 202,4492014 2,573 79% 2,032.67 103 209,3652015 2,438 79% 1,926.02 103 198,380
Table 9 shows the total estimated demand of Menudo Roll services
Polytechnic University of the Philippines- Taguig.
Where:
Total Estimated Demand = estimated target population x gross
market acceptability x frequency of availability (FOA)
12
Part 2 Market Study
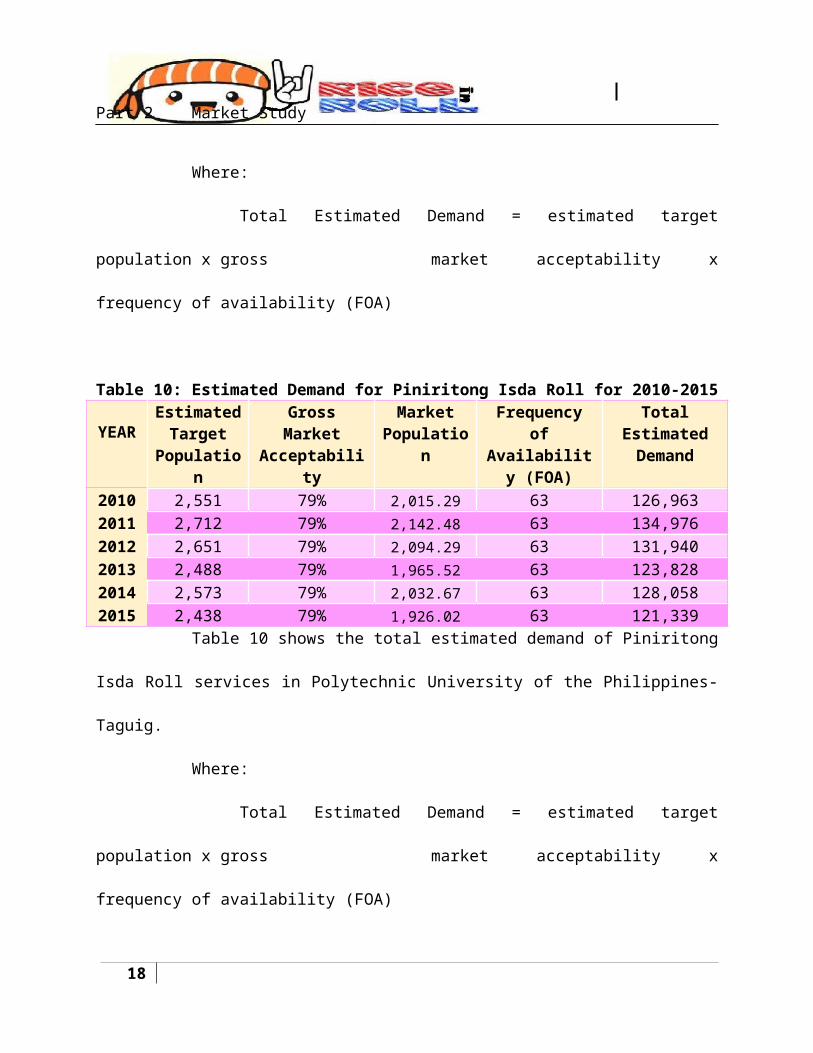
Table 10: Estimated Demand for Piniritong Isda Roll for 2010-2015
YEAREstimated
Target Population
Gross Market Acceptability
Market Population
Frequency of Availability
(FOA)
Total Estimated Demand
2010 2,551 79% 2,015.29 63 126,9632011 2,712 79% 2,142.48 63 134,9762012 2,651 79% 2,094.29 63 131,9402013 2,488 79% 1,965.52 63 123,8282014 2,573 79% 2,032.67 63 128,0582015 2,438 79% 1,926.02 63 121,339
Table 10 shows the total estimated demand of Piniritong Isda Roll
services in Polytechnic University of the Philippines- Taguig.
Where:
Total Estimated Demand = estimated target population x gross
market acceptability x frequency of availability (FOA)
Table 11: Estimated Demand for Pochero Roll for 2010-2015
YEAREstimated
Target Population
Gross Market Acceptability
Market Population
Frequency of Availability
(FOA)
Total Estimated Demand
2010 2,551 79% 2,015.29 24 48,367.002011 2,712 79% 2,142.48 24 51,419.502012 2,651 79% 2,094.29 24 50,263.002013 2,488 79% 1,965.52 24 47,172.502014 2,573 79% 2,032.67 24 48,784.102015 2,438 79% 1,926.02 24 46,224.50
Table 11 shows the total estimated demand of Pochero Roll services in
Polytechnic University of the Philippines- Taguig.
Where:
Total Estimated Demand = estimated target population x gross
market acceptability x frequency of availability (FOA)
13
Part 2 Market Study
Table 12: Estimated Demand for Silog Roll for 2010-2015
YEAREstimated
Target Population
Gross Market Acceptability
Market Population
Frequency of Availability
(FOA)
Total Estimated Demand
2010 2,551 79% 2,015.29 87 175,3302011 2,712 79% 2,142.48 87 186,3962012 2,651 79% 2,094.29 87 182,2032013 2,488 79% 1,965.52 87 171,0002014 2,573 79% 2,032.67 87 176,8422015 2,438 79% 1,926.02 87 167,564
Table 12 shows the total estimated demand of Silog Roll services in
Polytechnic University of the Philippines- Taguig.
Where:
Total Estimated Demand = estimated target population x gross
market acceptability x frequency of availability (FOA)
C. Projected Population
The table presented below will be use by researchers to determine future
demand and supply.
Table 13: Projected Population Growth Rate
YearTotal
Population(TP)Growth Rate(GR) TP X GR Target
Population
2016 2,438 (1.84%) (45) 2,3932017 2,393 3.34% 80 2,4732018 2,473 (2.22%) (55) 2,4182019 2,418 3.31% 80 2,4982020 2,498 3.40% 85 2,583
Table 13 shows population of Polytechnic University of the Philippines-
Taguig for the next five years. The analyst gathered the information about the projected
total population of Polytechnic University of the Philippines-Taguig for the year 2016 to
14

Part 2 Market Study
2020 from the University’s Registrar’s Office. They get the target population by adding
total population to increase in population. Based from the gathered information, the
analyst assume that the PUP Taguig will be accredited of the K-to-12 system, PUP-
Taguig will still accept new freshmen, so the population will be at ease and there will be
no greater decrease fluctuation of the population.
D. Projected Demand
The demand tells the ability or the willingness of the customers to buy the
product/services in a various quantity that will gave an idea if the business will become
profitable or not and will remain standing after years. It is an important factor in
determining the success of the business.
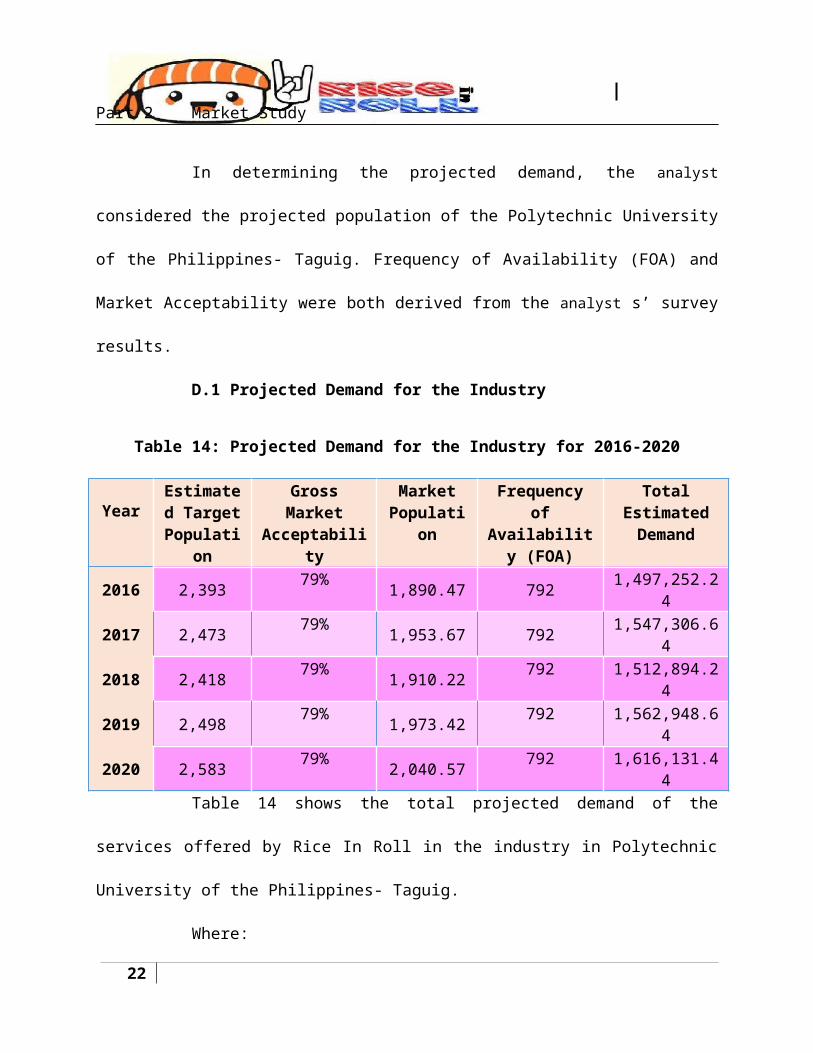
In determining the projected demand, the analyst considered the projected
population of the Polytechnic University of the Philippines- Taguig. Frequency of
Availability (FOA) and Market Acceptability were both derived from the analyst s’ survey
results.
D.1 Projected Demand for the Industry
Table 14: Projected Demand for the Industry for 2016-2020
YearEstimated
Target Population
Gross Market Acceptability
Market Population
Frequency of Availability
(FOA)
Total Estimated Demand
2016 2,393 79% 1,890.47 792 1,497,252.242017 2,473 79% 1,953.67 792 1,547,306.642018 2,418 79% 1,910.22 792 1,512,894.242019 2,498 79% 1,973.42 792 1,562,948.64
15
Part 2 Market Study
2020 2,583 79% 2,040.57 792 1,616,131.44Table 14 shows the total projected demand of the services offered by Rice
In Roll in the industry in Polytechnic University of the Philippines- Taguig.
Where:
Total Projected Demand = estimated target population x gross
market acceptability x frequency of availability (FOA)
D.2 Projected Demand for the Every Products for 2016-2020
Table 15: Projected Demand for Adobo Roll for 2016-2020
YEAREstimated
Target Population
Gross Market Acceptability
Market Population
Frequency of Availability
(FOA)
Projected Total Demand
2016 2,393 79% 1,890.47 364 688,1312017 2,473 79% 1,953.67 364 711,1362018 2,418 79% 1,910.22 364 695,3202019 2,498 79% 1,973.42 364 718,3252020 2,583 79% 2,040.57 364 742,767
Table 15 shows the total projected demand of Adobo Roll services in
Polytechnic University of the Philippines- Taguig.
Where:
Total Projected Demand = estimated target population x gross
market acceptability x frequency of availability (FOA)
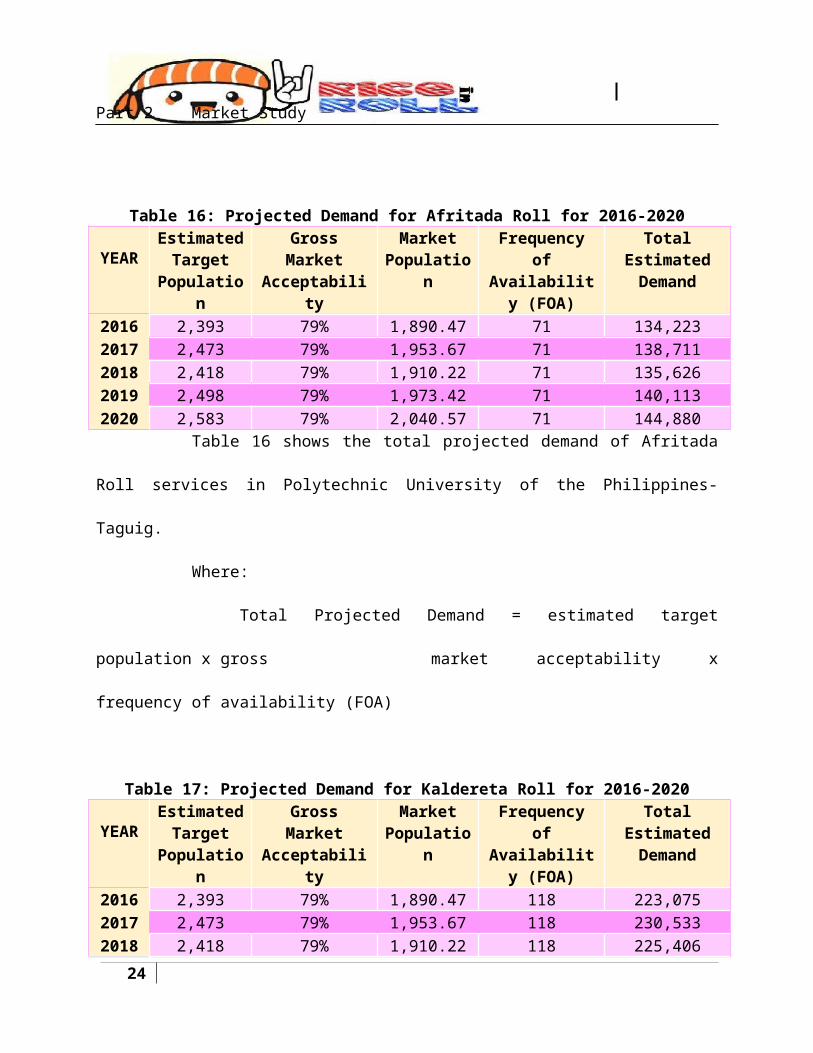
Table 16: Projected Demand for Afritada Roll for 2016-2020
YEAREstimated
Target Population
Gross Market Acceptability
Market Population
Frequency of Availability
(FOA)
Total Estimated Demand
16
Part 2 Market Study
2016 2,393 79% 1,890.47 71 134,2232017 2,473 79% 1,953.67 71 138,7112018 2,418 79% 1,910.22 71 135,6262019 2,498 79% 1,973.42 71 140,1132020 2,583 79% 2,040.57 71 144,880
Table 16 shows the total projected demand of Afritada Roll services in
Polytechnic University of the Philippines- Taguig.
Where:
Total Projected Demand = estimated target population x gross
market acceptability x frequency of availability (FOA)
Table 17: Projected Demand for Kaldereta Roll for 2016-2020
YEAREstimated
Target Population
Gross Market Acceptability
Market Population
Frequency of Availability
(FOA)
Total Estimated Demand
2016 2,393 79% 1,890.47 118 223,0752017 2,473 79% 1,953.67 118 230,5332018 2,418 79% 1,910.22 118 225,4062019 2,498 79% 1,973.42 118 232,8642020 2,583 79% 2,040.57 118 240,787
Table 17 shows the total projected demand of Kaldereta Roll services in
Polytechnic University of the Philippines- Taguig.
Where:
Total Projected Demand = estimated target population x gross
market acceptability x frequency of availability (FOA)
Table 18: Projected Demand for Kare-Kare Roll for 2016-2020
YEAREstimated
Target Population
Gross Market Acceptability
Market Population
Frequency of Availability
(FOA)
Total Estimated Demand
2016 2,393 79% 1,890.47 48 90,742.60
17
Part 2 Market Study
2017 2,473 79% 1,953.67 48 93,776.202018 2,418 79% 1,910.22 48 91,690.602019 2,498 79% 1,973.42 48 94,724.202020 2,583 79% 2,040.57 48 97,947.40
Table 18 shows the total projected demand of Kare-Kare Roll services in
Polytechnic University of the Philippines- Taguig.
Where:
Total Projected Demand = estimated target population x gross
market acceptability x frequency of availability (FOA)
Table 19: Projected Demand for Mechado Roll for 2016-2020
YEAREstimated
Target Population
Gross Market Acceptability
Market Population
Frequency of Availability
(FOA)
Total Estimated Demand
2016 2,393 79% 1,890.47 48 90,742.602017 2,473 79% 1,953.67 48 93,776.202018 2,418 79% 1,910.22 48 91,690.602019 2,498 79% 1,973.42 48 94,724.202020 2,583 79% 2,040.57 48 97,947.40
Table 19 shows the total projected demand of Mechado Roll services in
Polytechnic University of the Philippines- Taguig.
Where:
Total Projected Demand = estimated target population x gross
market acceptability x frequency of availability (FOA)
Table 20: Projected Demand for Menudo Roll for 2016-2020
YEAREstimated
Target Population
Gross Market Acceptability
Market Population
Frequency of Availability
(FOA)
Total Estimated Demand
18

Part 2 Market Study
2016 2,393 79% 1,890.47 103 194,7182017 2,473 79% 1,953.67 103 201,2282018 2,418 79% 1,910.22 103 196,7532019 2,498 79% 1,973.42 103 203,2622020 2,583 79% 2,040.57 103 210,179
Table 20 shows the total projected demand of Menudo Roll services in
Polytechnic University of the Philippines- Taguig.
Where:
Total Projected Demand = estimated target population x gross
market acceptability x frequency of availability (FOA)
Table 21: Projected Demand for Piniritong Isda Roll for 2016-2020
YEAREstimated
Target Population
Gross Market Acceptability
Market Population
Frequency of Availability
(FOA)
Total Estimated Demand
2016 2,393 79% 1,890.47 63 119,1002017 2,473 79% 1,953.67 63 123,0812018 2,418 79% 1,910.22 63 120,3442019 2,498 79% 1,973.42 63 124,3252020 2,583 79% 2,040.57 63 128,556
Table 21 shows the total projected demand of Piniritong Isda Roll services
in Polytechnic University of the Philippines- Taguig.
Where:
Total Projected Demand = estimated target population x gross
market acceptability x frequency of availability (FOA)
Table 22: Projected Demand for Pochero Roll for 2016-2020
19

Part 2 Market Study
YEAREstimated
Target Population
Gross Market Acceptability
Market Population
Frequency of Availability
(FOA)
Total Estimated Demand
2016 2,393 79% 1,890.47 24 45,371.302017 2,473 79% 1,953.67 24 46,888.102018 2,418 79% 1,910.22 24 45,845.302019 2,498 79% 1,973.42 24 47,362.102020 2,583 79% 2,040.57 24 48,973.70
Table 22 shows the total projected demand of Adobo Roll services in
Polytechnic University of the Philippines- Taguig.
Where:
Total Projected Demand = estimated target population x gross
market acceptability x frequency of availability (FOA)
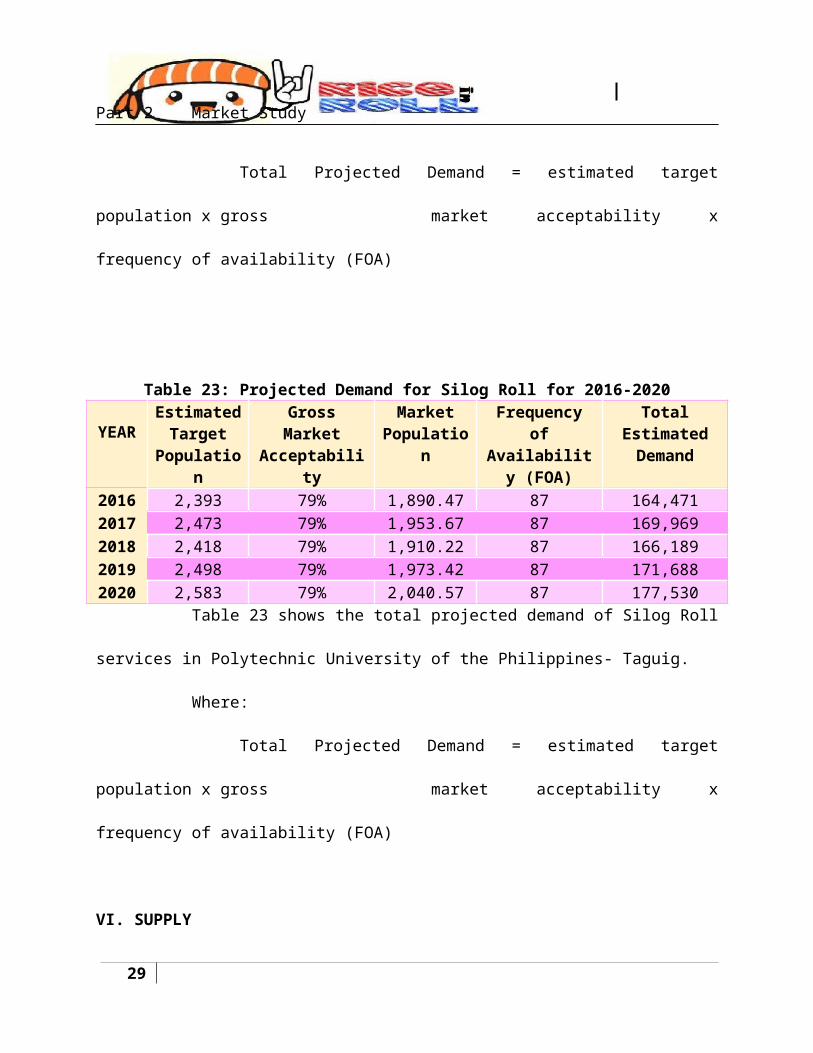
Table 23: Projected Demand for Silog Roll for 2016-2020
YEAREstimated
Target Population
Gross Market Acceptability
Market Population
Frequency of Availability
(FOA)
Total Estimated Demand
2016 2,393 79% 1,890.47 87 164,4712017 2,473 79% 1,953.67 87 169,9692018 2,418 79% 1,910.22 87 166,1892019 2,498 79% 1,973.42 87 171,6882020 2,583 79% 2,040.57 87 177,530
Table 23 shows the total projected demand of Silog Roll services in
Polytechnic University of the Philippines- Taguig.
Where:
Total Projected Demand = estimated target population x gross
market acceptability x frequency of availability (FOA)
20

Part 2 Market Study
VI. SUPPLY
Supply the total amount of a specific good or service that is available to
consumers. This relates closely to the demand for a good or service at a specific price;
all else being equal, the supply provided by producers will rise if the price rises because
all firms look to maximize profits. If people demand a good and are willing to pay more
for it, producers will add to the supply.
As the supply increases, the price will fall given the same level of demand. It is
affected by: (1) Good's own price: The basic supply relationship is between the price of
a good and the quantity supplied. Although there is "Law of Supply", generally, the
relationship is positive, meaning that an increase in price will induce an increase in the
quantity supplied (2) Prices of related goods: For purposes of supply analysis related
goods refer to goods from which inputs are derived to be used in the production of the
primary good. (3) Conditions of production: The most significant factor here is the state
of technology. If there is a technological advancement in one good's production, the
supply increases. (4) Expectations: Sellers' are concerning future market conditions can
directly affect supply. If the seller believes that the demand for his product will sharply
increase in the foreseeable future the firm owner may immediately increase production
in anticipation of future price increases. (5) Price of inputs: Inputs include land, labor,
energy and raw materials. If the price of inputs increases the supply curve will shift left
as sellers are less willing or able to sell goods at any given price. (6) Number of
suppliers: The market supply curve is the horizontal summation of the individual supply
curves. As more firms enter the industry the market supply curve will shift out driving
21
Part 2 Market Study
down prices. (7) Government policies and regulations: Government intervention can
have a significant effect on supply. Government intervention can take many forms
including environmental and health regulations, hour and wage laws, taxes, electrical
and natural gas rates and zoning and land use regulations.
.
A. Supply for the Past Years
The supply for the past years wrap up how much supply the existing direct
and indirect competitors produced for the past five (5)years with increasing and
decreasing demand.
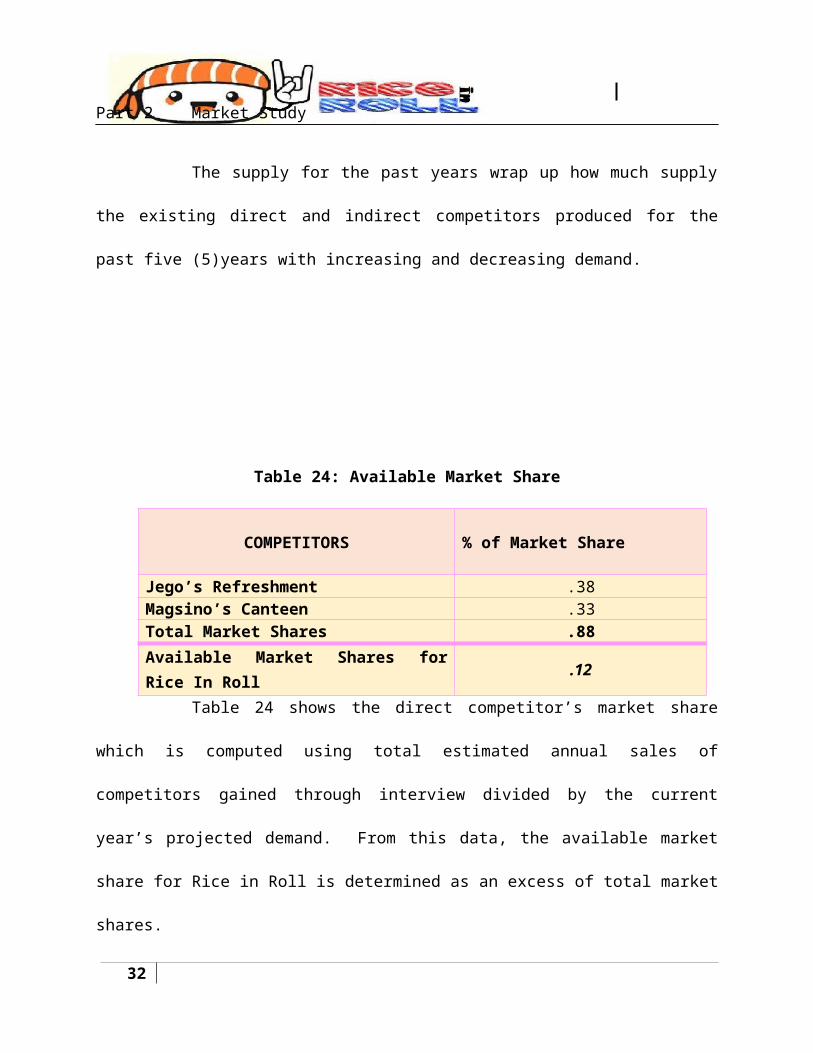
Table 24: Available Market Share
COMPETITORS % of Market Share
Jego’s Refreshment .38Magsino’s Canteen .33Total Market Shares .88
Available Market Shares for Rice In Roll .12Table 24 shows the direct competitor’s market share which is computed
using total estimated annual sales of competitors gained through interview divided by
the current year’s projected demand. From this data, the available market share for
Rice in Roll is determined as an excess of total market shares.
22

Part 2 Market Study
Table 25: Estimated Past Supply for the Industry for 2010-2015
YearTotal Estimated
DemandContribution of
Competitors (88%)Total Estimated Supply
2010 1,596,109.68 1,404,577 1,404,5772011 1,696,844.16 1,493,223 1,493,2232012 1,658,677.68 1,459,636 1,459,6362013 1,556,691.84 1,369,889 1,369,8892014 1,609,874.64 1,416,690 1,416,6902015 1,511,017.20 1,329,695 1,329,695
Table 25 shows the total estimated past supply of Rice in Roll services in
the industry.
Where:
Total Estimated Supply = Total Estimated Demand x
% Contribution of Competitors
Table 26: Estimated Past Supply for the Adobo Roll for 2010-2015
YEARTotal Estimated
DemandContribution of
Competitors (88%)Total Estimated
Supply
2010 733,566 645,537.69 645,537.692011 779,863 686,279.19 686,279.192012 762,322 670,842.97 670,842.972013 715,449 629,595.37 629,595.372014 739,892 651,104.85 651,104.852015 701,071 616,942.73 616,942.73
Table 26 shows the total estimated past supply of Adobo Roll service in
Polytechnic University of the Philippines- Taguig.
Where:
23
Part 2 Market Study
Total Estimated Supply = Total Estimated Demand x
% Contribution of Competitors
Table 27: Estimated Past Supply for the Afritada Roll for 2010-2015
YEARTotal Estimated
DemandContribution of
Competitors (88%)Total Estimated
Supply
2010 143,086 125,915.32 125,915.322011 152,116 133,862.15 133,862.152012 148,695 130,851.24 130,851.242013 139,552 122,805.69 122,805.692014 144,320 127,001.22 127,001.222015 136,747 120,337.73 120,337.73
Table 27 shows the total estimated past supply of Afritada Roll service in
Polytechnic University of the Philippines- Taguig.
Where:
Total Estimated Supply = Total Estimated Demand x
% Contribution of Competitors
Table 28: Estimated Past Supply for the Kaldereta Roll for 2010-2015
YEARTotal Estimated
DemandContribution of
Competitors (88%)Total Estimated
Supply
2010 237,804 209,267.71 209,267.712011 252,813 222,475.12 222,475.122012 247,126 217,471.07 217,471.072013 231,931 204,099.60 204,099.602014 239,855 211,072.45 211,072.452015 227,270 199,997.92 199,997.92
Table 28 shows the total estimated past supply of Kaldereta Roll service in
Polytechnic University of the Philippines- Taguig.
Where:
24

Part 2 Market Study
Total Estimated Supply = Total Estimated Demand x
% Contribution of Competitors
Table 29: Estimated Past Supply for the Kare-Kare for 2010-2015
YEARTotal Estimated
DemandContribution of
Competitors (88%)Total Estimated
Supply
2010 96,733.90 85,125.85 85,125.852011 102,839.00 90,498.36 90,498.362012 100,526.00 88,462.81 88,462.812013 94,345.00 83,023.56 83,023.562014 97,568.20 85,859.98 85,859.982015 92,449.00 81,355.08 81,355.08
Table 29 shows the total estimated past supply of Kare-Kare Roll service
in Polytechnic University of the Philippines- Taguig.
Where:
Total Estimated Supply = Total Estimated Demand x
% Contribution of Competitors
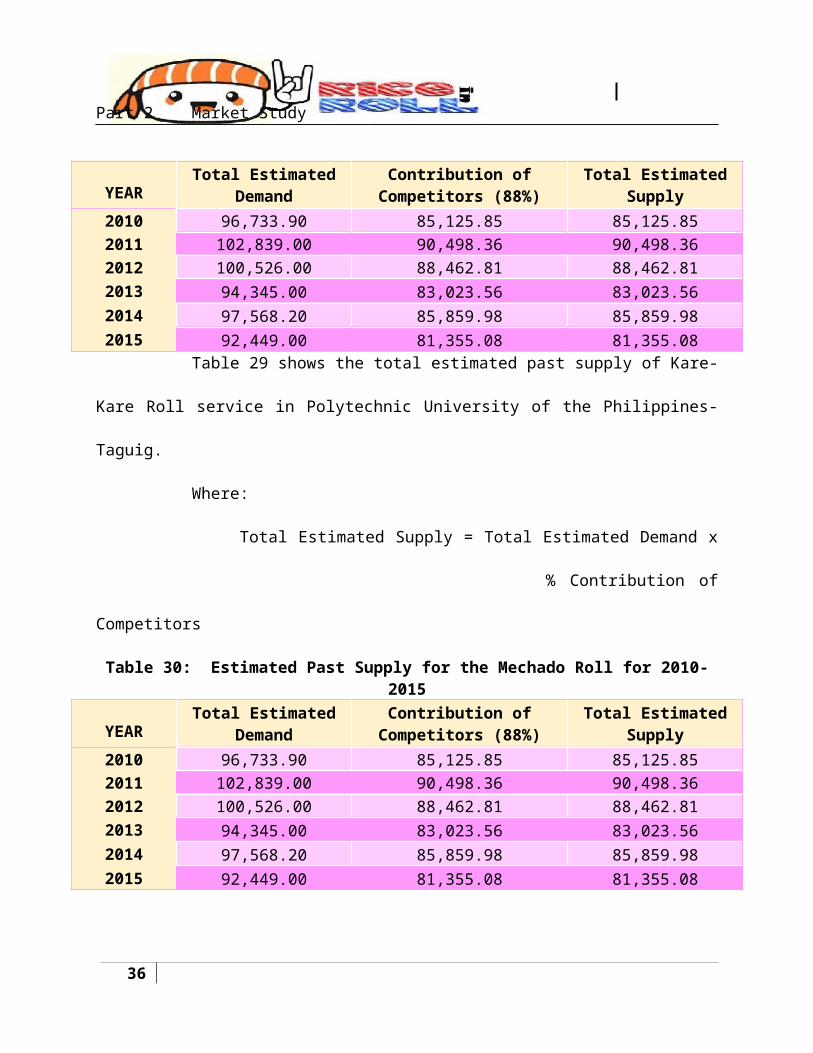
Table 30: Estimated Past Supply for the Mechado Roll for 2010-2015
YEARTotal Estimated
DemandContribution of
Competitors (88%)Total Estimated
Supply
2010 96,733.90 85,125.85 85,125.852011 102,839.00 90,498.36 90,498.362012 100,526.00 88,462.81 88,462.812013 94,345.00 83,023.56 83,023.562014 97,568.20 85,859.98 85,859.982015 92,449.00 81,355.08 81,355.08
Table 30 shows the total estimated past supply of Mechado Roll service in
Polytechnic University of the Philippines- Taguig.
Where:
25

Part 2 Market Study
Total Estimated Supply = Total Estimated Demand x
% Contribution of Competitors
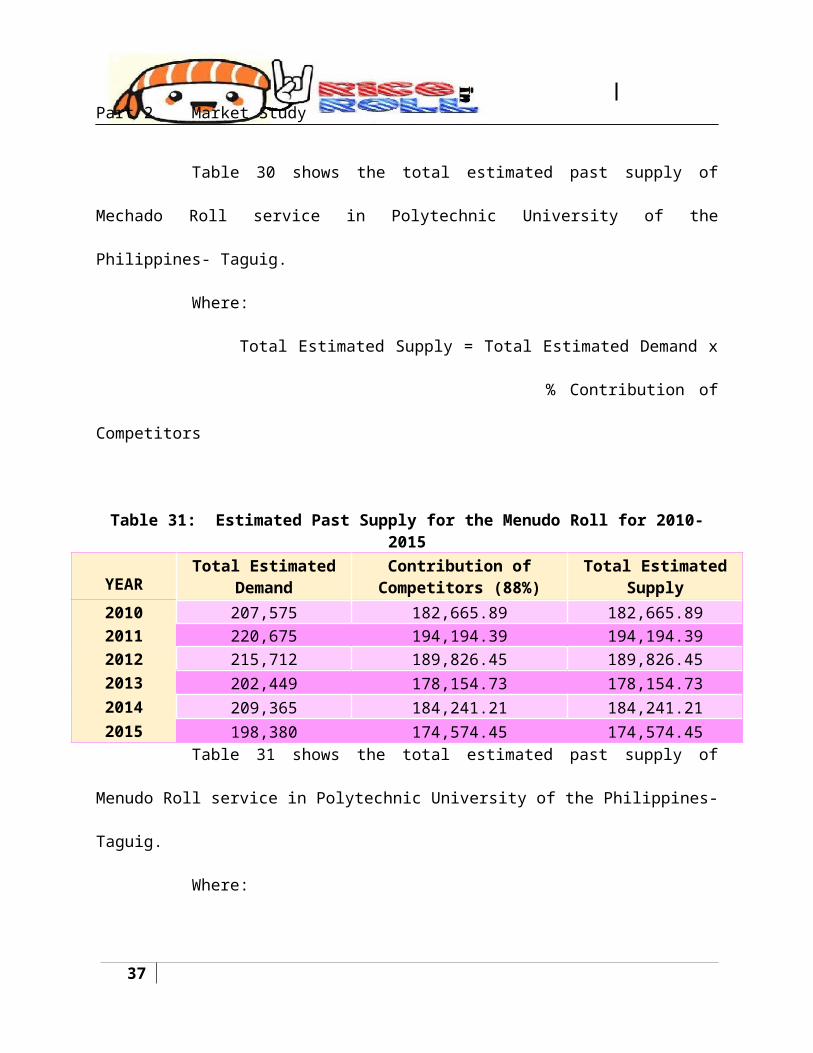
Table 31: Estimated Past Supply for the Menudo Roll for 2010-2015
YEARTotal Estimated
DemandContribution of
Competitors (88%)Total Estimated
Supply
2010 207,575 182,665.89 182,665.892011 220,675 194,194.39 194,194.392012 215,712 189,826.45 189,826.452013 202,449 178,154.73 178,154.732014 209,365 184,241.21 184,241.212015 198,380 174,574.45 174,574.45
Table 31 shows the total estimated past supply of Menudo Roll service in
Polytechnic University of the Philippines- Taguig.
Where:
Total Estimated Supply = Total Estimated Demand x
% Contribution of Competitors
Table 32: Estimated Past Supply for the Piniritong Isda Roll for 2010-2015
YEARTotal Estimated
DemandContribution of
Competitors (88%)Total Estimated
Supply
2010 126,963 111,727.678 111,727.6782011 134,976 118,779.09 118,779.092012 131,940 116,107.44 116,107.442013 123,828 108,968.43 108,968.432014 128,058 112,691.22 112,691.222015 121,339 106,778.55 106,778.55
Table 32 shows the total estimated past supply of Piniritong Isda Roll
service in Polytechnic University of the Philippines- Taguig.
Where:
26

Part 2 Market Study
Total Estimated Supply = Total Estimated Demand x
% Contribution of Competitors
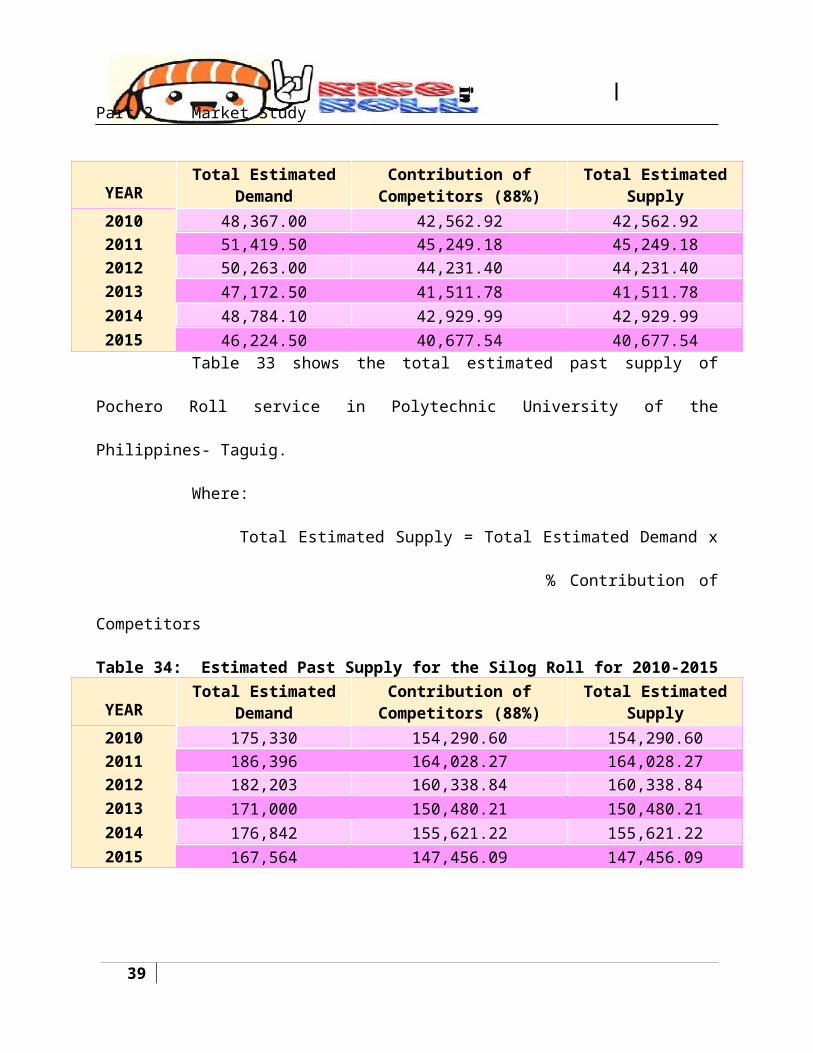
Table 33: Estimated Past Supply for the Pochero Roll for 2010-2015
YEARTotal Estimated
DemandContribution of
Competitors (88%)Total Estimated
Supply
2010 48,367.00 42,562.92 42,562.922011 51,419.50 45,249.18 45,249.182012 50,263.00 44,231.40 44,231.402013 47,172.50 41,511.78 41,511.782014 48,784.10 42,929.99 42,929.992015 46,224.50 40,677.54 40,677.54
Table 33 shows the total estimated past supply of Pochero Roll service in
Polytechnic University of the Philippines- Taguig.
Where:
Total Estimated Supply = Total Estimated Demand x
% Contribution of Competitors
Table 34: Estimated Past Supply for the Silog Roll for 2010-2015
YEARTotal Estimated
DemandContribution of
Competitors (88%)Total Estimated
Supply
2010 175,330 154,290.60 154,290.602011 186,396 164,028.27 164,028.272012 182,203 160,338.84 160,338.842013 171,000 150,480.21 150,480.212014 176,842 155,621.22 155,621.222015 167,564 147,456.09 147,456.09
Table 34 shows the total estimated past supply of Silog Roll service in
Polytechnic University of the Philippines- Taguig.
Where:
27

Part 2 Market Study
Total Estimated Supply = Total Estimated Demand x
% Contribution of Competitors
B. Projected Supply
The projected supply shows how much supply the existing direct
competitors can produce for the next five (5) years with the increasing and decreasing
demand.
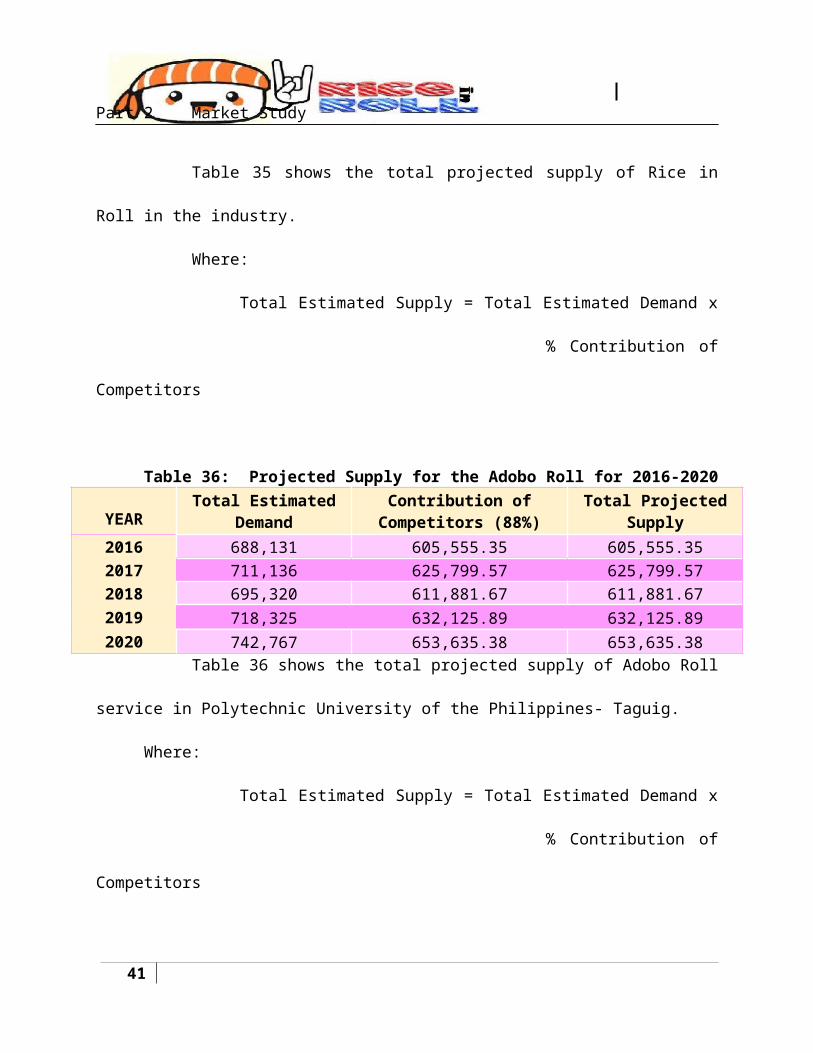
Table 35: Projected Supply for the Industry for 2016-2020
YearTotal Estimated
DemandContribution of
Competitors (88%)Total Projected Supply
2016 1,497,252.24 1,317,582 1,317,5822017 1,547,306.64 1,361,630 1,361,6302018 1,512,894.24 1,331,347 1,331,3472019 1,562,948.64 1,375,395 1,375,3952020 1,616,131.44 1,422,196 1,422,196
Table 35 shows the total projected supply of Rice in Roll in the industry.
Where:
Total Estimated Supply = Total Estimated Demand x
% Contribution of Competitors
Table 36: Projected Supply for the Adobo Roll for 2016-2020
YEARTotal Estimated
DemandContribution of
Competitors (88%)Total Projected
Supply
2016 688,131 605,555.35 605,555.352017 711,136 625,799.57 625,799.572018 695,320 611,881.67 611,881.672019 718,325 632,125.89 632,125.89
28
Part 2 Market Study
2020 742,767 653,635.38 653,635.38Table 36 shows the total projected supply of Adobo Roll service in
Polytechnic University of the Philippines- Taguig.
Where:
Total Estimated Supply = Total Estimated Demand x
% Contribution of Competitors
Table 37: Projected Supply for the Afritada Roll for 2016-2020
YEARTotal Estimated
DemandContribution of
Competitors (88%)Total Projected
Supply
2016 134,223 118,116.57 118,116.572017 138,711 122,065.30 122,065.302018 135,626 119,350.55 119,350.552019 140,113 123,299.28 123,299.282020 144,880 127,494.81 127,494.81
Table 37 shows the total projected supply of Afritada Roll service in
Polytechnic University of the Philippines- Taguig.
Where:
Total Estimated Supply = Total Estimated Demand x
% Contribution of Competitors
Table 38: Projected Supply for the Kaldereta Roll for 2016-2020
YEARTotal Estimated
DemandContribution of
Competitors (88%)Total Projected
Supply
2016 223,075 196,306.40 196,306.402017 230,533 202,869.09 202,869.092018 225,406 198,357.24 198,357.242019 232,864 204,919.93 204,919.93
29

Part 2 Market Study
2020 240,787 211,892.79 211,892.79Table 38 shows the total projected supply of Kaldereta Roll service in
Polytechnic University of the Philippines- Taguig.
Where:
Total Estimated Supply = Total Estimated Demand x
% Contribution of Competitors
Table 39: Projected Supply for the Kare-Kare Roll for 2016-2020
YEARTotal Estimated
DemandContribution of
Competitors (88%)Total Projected
Supply
2016 90,742.60 79,853.45 79,853.452017 93,776.20 82,523.02 82,523.022018 91,690.60 80,687.69 80,687.692019 94,724.20 83,357.26 83,357.262020 97,947.40 86,193.68 86,193.68
Table 39 shows the total projected supply of Kare-Kare Roll service in
Polytechnic University of the Philippines- Taguig.
Where:
Total Estimated Supply = Total Estimated Demand x
% Contribution of Competitors
Table 40: Projected Supply for the Mechado Roll for 2016-2020
YEARTotal Estimated
DemandContribution of
Competitors (88%)Total Projected
Supply
2016 90,742.6 79,853.45 79,853.452017 93,776.2 82,523.02 82,523.022018 91,690.6 80,687.69 80,687.692019 94,724.2 83,357.26 83,357.26
30

Part 2 Market Study
2020 97,947.4 86,193.68 86,193.68Table 40 shows the total projected supply of Mechado Roll service in
Polytechnic University of the Philippines- Taguig.
Where:
Total Estimated Supply = Total Estimated Demand x
% Contribution of Competitors
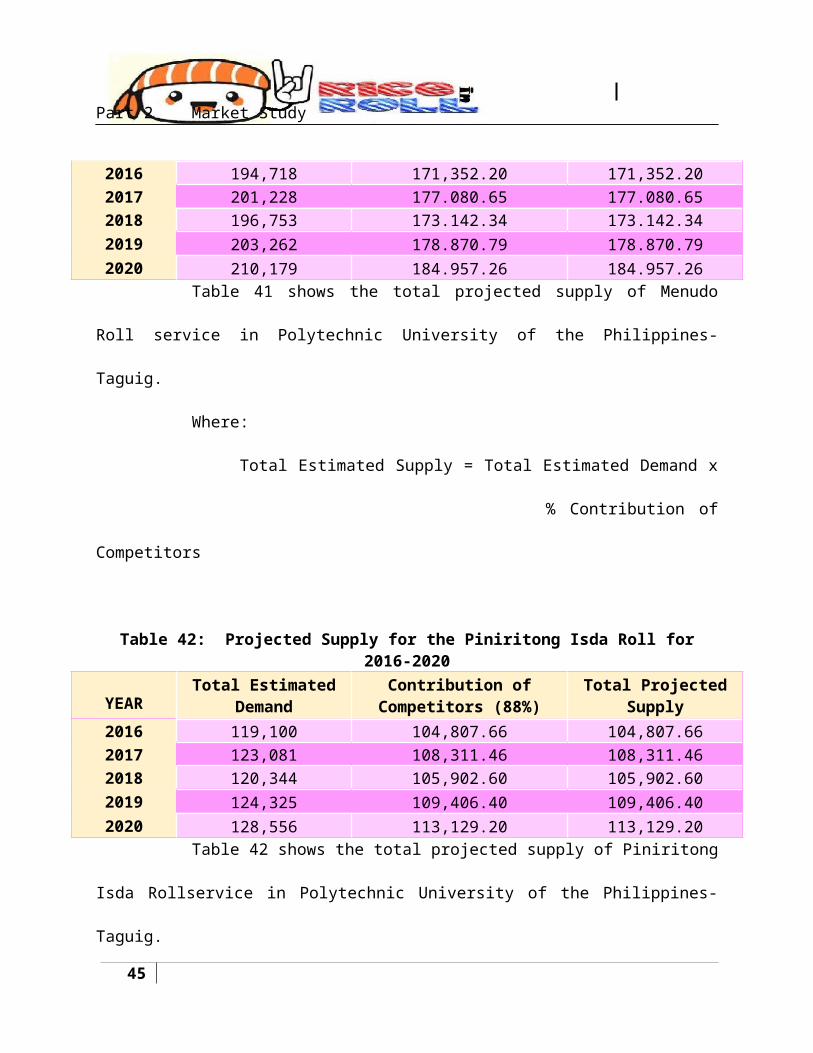
Table 41: Projected Supply for the Menudo Roll for 2016-2020
YEARTotal Estimated
DemandContribution of
Competitors (88%)Total Projected
Supply
2016 194,718 171,352.20 171,352.202017 201,228 177.080.65 177.080.652018 196,753 173.142.34 173.142.342019 203,262 178.870.79 178.870.792020 210,179 184.957.26 184.957.26
Table 41 shows the total projected supply of Menudo Roll service in
Polytechnic University of the Philippines- Taguig.
Where:
Total Estimated Supply = Total Estimated Demand x
% Contribution of Competitors
Table 42: Projected Supply for the Piniritong Isda Roll for 2016-2020
YEARTotal Estimated
DemandContribution of
Competitors (88%)Total Projected
Supply
2016 119,100 104,807.66 104,807.662017 123,081 108,311.46 108,311.462018 120,344 105,902.60 105,902.602019 124,325 109,406.40 109,406.40
31
Part 2 Market Study
2020 128,556 113,129.20 113,129.20Table 42 shows the total projected supply of Piniritong Isda Rollservice in
Polytechnic University of the Philippines- Taguig.
Where:
Total Estimated Supply = Total Estimated Demand x
% Contribution of Competitors
Table 43: Projected Supply for the Pochero Roll for 2016-2020
YEARTotal Estimated
DemandContribution of
Competitors (88%)Total Projected
Supply
2016 45,371.30 39,926.73 39,926.732017 46,888.10 41,261.51 41,261.512018 45,845.30 40,343.85 40,343.852019 47,362.10 41,678.63 41,678.632020 48,973.70 43,096.84 43,096.84
Table 43 shows the total projected supply of Pochero Roll service in
Polytechnic University of the Philippines- Taguig.
Where:
Total Estimated Supply = Total Estimated Demand x
% Contribution of Competitors
Table 44: Projected Supply for the Silog Roll for 2016-2020
YEARTotal Estimated
DemandContribution of
Competitors (88%)Total Projected
Supply
2016 164,471 144,734.38 144,734.382017 169,969 149,572.98 149,572.982018 166,189 146,246.44 146,246.442019 171,688 151,085.04 151,085.04
32

Part 2 Market Study
2020 177,530 156,226.04 156,226.04Table 44 shows the total projected supply of Silog Roll service in
Polytechnic University of the Philippines- Taguig.
Where:
Total Estimated Supply = Total Estimated Demand x
% Contribution of Competitors
VII. Demand and Supply Analysis
Demand analysis is used to find out the customer demand for a product or
service in a particular market. It can tell whether a substantial demand exists for the
product/service and given the other information like number of competitors, size of
competitors, industry growth etc. it helps to decide if the company could enter the
market and generate enough returns to sustain and advance its business. Supply
analysis is a system of input and output equations used to determine supply responses
to changing circumstances by producers (including households). It takes into account
changes in both output supply and input/factor demand. It is central to policy decisions
in that it helps us understand the impact that alternative policy packages may have on
the producers themselves. The demand and supply analysis determines if the supply
satisfies the demand of a certain good or service and if there are demands that are still
unsatisfied especially in the projections. The gap between demand and supply will show
if there is still a place of opportunity for new upcoming business ventures in the market.
33

Part 2 Market Study
As shown in the tables below, a massive portion of demand is still left unsatisfied.
The gap is the overall demand which is the available market share that is still
unsupplied as well.
Table 45: Demand and Supply Analysis for Adobo RollYEAR Projected Demand Projected Supply Unsatisfied Demand Gap2016 688,131 605,555.35 82,575.732017 711,136 625,799.57 85,336.312018 695,320 611,881.67 83,438.412019 718,325 632,125.89 86,198.992020 742,767 653,635.38 89,132.10
Table 45 shows the unsatisfied demand gap between the projected demand and
supply of Adobo Roll.
Table 46: Demand and Supply Analysis for Afritada RollYEAR Projected Demand Projected Supply Unsatisfied Demand Gap2016 134,223 118,116.57 16,106.802017 138,711 122,065.3 16,645.272018 135,626 119,350.55 16,275.072019 140,113 123,299.28 16,813.542020 144,880 127,494.81 17,385.66
Table 46 shows the unsatisfied demand gap between the projected demand and
supply of Afritada Roll.
Table 47: Demand and Supply Analysis for Kaldereta RollYEAR Projected Demand Projected Supply Unsatisfied Demand Gap2016 223,075 196,306.40 26,769.062017 230,533 202,869.09 27,663.972018 225,406 198,3,57.24 27,048.722019 232,864 204,919.93 27,943.672020 240,787 211,892.79 28,894.47
34

Part 2 Market Study
Table 47 shows the unsatisfied demand gap between the projected demand and
supply of Kaldereta Roll.
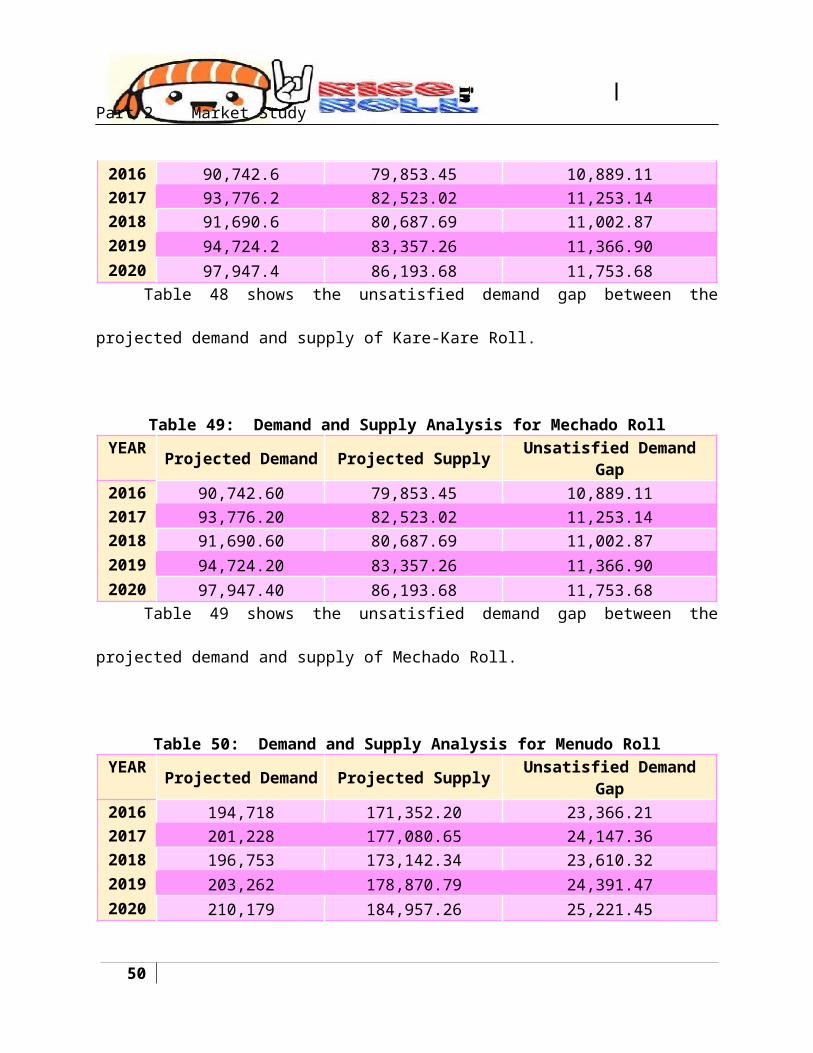
Table 48: Demand and Supply Analysis for Kare-Kare RollYEAR Projected Demand Projected Supply Unsatisfied Demand Gap2016 90,742.6 79,853.45 10,889.112017 93,776.2 82,523.02 11,253.142018 91,690.6 80,687.69 11,002.872019 94,724.2 83,357.26 11,366.902020 97,947.4 86,193.68 11,753.68
Table 48 shows the unsatisfied demand gap between the projected demand and
supply of Kare-Kare Roll.
Table 49: Demand and Supply Analysis for Mechado RollYEAR Projected Demand Projected Supply Unsatisfied Demand Gap2016 90,742.60 79,853.45 10,889.112017 93,776.20 82,523.02 11,253.142018 91,690.60 80,687.69 11,002.872019 94,724.20 83,357.26 11,366.902020 97,947.40 86,193.68 11,753.68
Table 49 shows the unsatisfied demand gap between the projected demand and
supply of Mechado Roll.
Table 50: Demand and Supply Analysis for Menudo RollYEAR Projected Demand Projected Supply Unsatisfied Demand Gap2016 194,718 171,352.20 23,366.212017 201,228 177,080.65 24,147.362018 196,753 173,142.34 23,610.322019 203,262 178,870.79 24,391.472020 210,179 184,957.26 25,221.45
35
Part 2 Market Study
Table 50 shows the unsatisfied demand gap between the projected demand and
supply of Menudo Roll.
Table 51: Demand and Supply Analysis for Piniritong Isda RollYEAR Projected Demand Projected Supply Unsatisfied Demand Gap2016 119,100 104,807.66 14,291.952017 123,081 108,311.46 14,769.752018 120,344 105,902.60 14,441.262019 124,325 109,406.40 14,919.062020 128,556 113,129.20 15,426.71
Table 51 shows the unsatisfied demand gap between the projected demand and
supply of Piniritong Isda Roll.
Table 52: Demand and Supply Analysis for Pochero RollYEAR Projected Demand Projected Supply Unsatisfied Demand Gap2016 45,371.30 39,926.73 5,444.562017 46,888.10 41,261.51 5,626.572018 45,845.30 40,343.85 5,501.432019 47,362.10 41,678.63 5,683.452020 48,973.70 43,096.84 5,876.84
Table 52 shows the unsatisfied demand gap between the projected demand and
supply of Pochero Roll.
Table 53: Demand and Supply Analysis for Silog RollYEAR Projected Demand Projected Supply Unsatisfied Demand Gap2016 164,471 144,734.38 19,736.512017 169,969 149,572.98 20,396.312018 166,189 146,246.44 19,942.702019 171,688 151,085.04 20,602.502020 177,530 156,226.04 21,303.55
36
Part 2 Market Study
Table 53 shows the unsatisfied demand gap between the projected demand and
supply of Silog Roll.
Table 54: Demand and Supply Analysis for the Industry
Year Projected Demand Projected Supply Unsatisfied Demand Gap2016 1,497,252.24 1,317,582 179,670.272017 1,547,306.64 1,361,630 185,676.802018 1,512,894.24 1,331,347 181,547.312019 1,562,948.64 1,375,395 187,553.842020 1,616,131.44 1,422,196 193,935.77
Table 54 shows the unsatisfied demand gap between the projected demand and
supply of Rice in Roll in the Industry.
VII. Market Share
Out of total purchases of a customer of a product or service, what percentage
goes to a company defines its market share. Increases and decreases of the business’
market share is what investors carefully look at. It can be used as their basis as to the
relative competitiveness of the company's products or services. There are various types
of market share. Market shares can be value or volume. Value market share is based
on the total share of a company out of total segment sales. Volumes refer to the actual
numbers of units that a company sells out of total units sold in the market. The value-
volume market share equation is not usually linear: a unit may have high value and low
numbers, which means that value market share may be high, but volumes share may
be low. Market share is a measure of the consumers' preference for a product over
other similar products. A higher market share usually means greater sales, lesser effort
37

Part 2 Market Study
to sell more and a strong barrier to entry for other competitors. A higher market share
also means that if the market expands, the leader gains more than the others. By the
same token, a market leader - as defined by its market share - also has to expand the
market, for its own growth.
The analysts established their proposed minimum production volume to each of
their service on the first year of operation based on the capacity of the store against the
projected demand, the Unsatisfied Demand Gap in the Demand and Supply Analysis for
the industry (See table 54).
They assumed that there will be a 4% annual increase in their volume.
To get the market share:
Market Share = Annual Sales Volume
Projected Demand
Table 55: Market Share of Rice in Roll in the Industry
YEAR Projected Demand Annual sales Volume Market Share2016 1,497,252.24 179,670.27 12.00%2017 1,547,306.64 186,857.08 12.08%2018 1,512,894.24 194,331.36 12.85%2019 1,562,948.64 202,104.62 12.93%2020 1,616,131.44 210,188.80 13.01%
The table 55 shows that the business can capture an average of 12.57% of the
total market share of the Rice in Roll in the industry.
Table 56: Market Share of Rice in Roll in Adobo RollYEAR Projected Demand Annual sales Volume Market Share2016 688,131.08 68,274.70 9.92%
2017 711,135.88 71,005.69 9.98%
2018 695,320.08 73,845.92 10.62%
38
Part 2 Market Study
2019 718,324.88 76,799.75 10.69%
2020 742,767.48 79,971.74 10.75%The table 56 shows that the business can capture an average of 10.39% of the
total market share of the Adobo Roll.
Table 57: Market Share of Rice in Roll in Afritada RollYEAR Projected Demand Annual sales Volume Market Share2016 134,223.37 14,373.62 10.71%2017 138,710.57 14,948.57 10.78%2018 135,625.62 15,546.51 11.46%2019 140,112.82 16,168.37 11.54%2020 144,880.47 16,815.10 11.61%
The table 57 shows that the business can capture an average of 11.22% of the
total market share of the Afritada Roll.
Table 58: Market Share of Rice in Roll in Kaldereta RollYEAR Projected Demand Annual sales Volume Market Share2016 223,075.46 23,357.13 10.47%2017 230,533.06 24,291.42 10.54%2018 225,405.96 25,263.08 11.21%2019 232,863.56 26,273.60 11.28%2020 240,787.26 27,324.54 11.35%
The table 58 shows that the business can capture an average of 10.97% of the
total market share of the Kaldereta Roll.
Table 59: Market Share of Rice in Roll in Kare-Kare RollYEAR Projected Demand Annual sales Volume Market Share2016 90,742.56 8,983.51 9.90%2017 93,776.16 9,342.85 9.96%2018 91,690.56 9,716.57 10.60%
39

Part 2 Market Study
2019 94,724.16 10,105.24 10.67%2020 97,947.36 10,509.44 10.73%
The table 59 shows that the business can capture an average of 10.37% of the
total market share of the Kare-Kare Roll.
Table 60: Market Share of Rice in Roll in Mechado RollYEAR Projected Demand Annual sales Volume Market Share2016 90,742.56 8,983.51 9.90%2017 93,776.16 9,342.85 9.96%2018 91,690.56 9,716.57 10.60%2019 94,724.16 10,105.24 10.67%2020 97,947.36 10,509.44 10.73%
The table 60 shows that the business can capture an average of 10.37% of the
total market share of the Mechado Roll.
Table 61: Market Share of Rice in Roll in Menudo RollYEAR Projected Demand Annual sales Volume Market Share2016 194,718.41 19,763.73 10.15%2017 201,228.01 20,554.28 10.21%2018 196,752.66 21,376.45 10.86%2019 203,262.26 22,231.51 10.94%2020 210,178.71 23,120.77 11.00%
The table 61 shows that the business can capture an average of 10.63% of the
total market share of the Menudo Roll.
Table 62: Market Share of Rice in Roll in Piniritong Isda Roll
YEAR Projected Demand Annual sales Volume Market Share2016 119,099.61 12,576.92 10.56%2017 123,081.21 13,080.00 10.63%2018 120,343.86 13,603.20 11.30%
40
Part 2 Market Study
2019 124,325.46 14,147.32 11.38%2020 128,555.91 14,713.22 11.44%
The table 62 shows that the business can capture an average of 11.26% of the
total market share of the Piniritong Isda Roll.
Table 63: Market Share of Rice in Roll in Pochero Roll
YEAR Projected Demand Annual sales Volume Market Share2016 45,371.28 5,390.11 11.88%2017 46,888.08 5,605.71 11.96%2018 45,845.28 5,829.94 12.72%2019 47,362.08 6,063.14 12.80%2020 48,973.68 6,305.66 12.88%
The table 63 shows that the business can capture an average of 12.45% of the
total market share of the Pochero Roll.
Table 64: Market Share of Rice in Roll in Silog RollYEAR Projected Demand Annual sales Volume Market Share2016 164,470.89 17,967.03 10.92%2017 169,969.29 18,685.71 10.99%2018 166,189.14 19,433.14 11.69%2019 171,687.54 20,210.46 11.77%2020 177,529.59 21,018.88 11.84%
The table 64 shows that the business can capture an average of 11.44% of the
total market share of the Silog Roll.
IX. Projected Sales
To compute for the projected sales of Rice in Roll, the researchers multiply the
selling price of each service to its proposed sales volume. Total projected demand,
41

Part 2 Market Study
market share of its service and the capacity of the business are considered in
determining the proposed sales volume.
The projected sales presents below with proposed 4% annual increase in their
sales volume. Each service is assumed to increase by Php 2.00 every two (2) years due
to inflation and other increase in expenses.
Rice in Roll (whole)
Year Sales Volume Price Projected Sales VAT (12%) Net Sales
2016179,670.27
20.003,593,405.38
431,208.64 3,162,196.73
2017186,857.08
20.003,737,141.59
448,457.00 3,288,684.60
2018194,331.36
22.004,275,289.98
513,034.80 3,762,255.18
2019202,104.62
22.004,446,301.58
533,556.19 3,912,745.39
2020210,188.80
24.005,044,531.25
605,343.75 4,439,187.50
Adobo RollYear Sales Volume Price Projected Sales VAT (12%) Net Sales
2016 68,274.70 20.001,365,494.04
163,859.29 1,201,634.76
2017 71,005.69 20.001,420,133.80
170,413.66 1,249,700.15
2018 73,845.92 22.001,624,610.19
194,953.22 1,429,656.97
2019 76,799.75 22.001,689,594.60
202,751.35 1,486,843.25
2020 79,971.74 24.001,916,921.87
230,030.62 1,686.891.25
42

Part 2 Market Study
Afritada RollYear Sales Volume Price Projected Sales VAT (12%) Net Sales2016 14,373.62 20.00 287,472.43 34,496.69 252,975.742017 14,948.57 20.00 298,971.33 35,876.56 263,094.772018 15,546.51 22.00 342,023.20 41,042.78 300,980.412019 16,168.37 22.00 355,704.13 42,684.50 313,019.632020 16,815.10 24.00 403,562.50 48,427.50 355,135.00
Kaldereta RollYear Sales Volume Price Projected Sales VAT (12%) Net Sales2016 23,357.13 20.00 467,142.70 56,057.12 411,085.582017 24,291.42 20.00 485,828.40 58,299.41 427,529.002018 25,263.08 22.00 555,787.70 66,694.52 489,093.172019 26,273.60 22.00 578,019.20 69,362.30 508,656.902020 27,324.54 24.00 655,789.06 78,694.69 577,094.37
Kare-Kare RollYear Sales Volume Price Projected Sales VAT (12%) Net Sales2016 8,983.51 20.00 179,670.27 21,560.43 158,109.842017 9,342.85 20.00 186,857.08 22,422.85 164,434.232018 9,716.57 22.00 213,764.50 25,651.74 188,112.762019 10,105.24 22.00 222,315.08 26,677.81 195,637.272020 10,509.44 24.00 252,226.56 30,267.19 221,959.37
Mechado RollYear Sales Volume Price Projected Sales VAT (12%) Net Sales2016 8,983.51 20.00 179,670.27 21,560.43 158,109.84
43

Part 2 Market Study
2017 9,342.85 20.00 186,857.08 22,422.85 164,434.232018 9,716.57 22.00 213,764.50 25,651.74 188,112.762019 10,105.24 22.00 222,315.08 26,677.81 195,637.272020 10,509.44 24.00 252,226.56 30,267.19 221,959.37
Menudo RollYear Sales Volume Price Projected Sales VAT (12%) Net Sales2016 19,763.73 20.00 395,274.59 47,432.95 347,841.642017 20,554.28 20.00 411,085.58 49,330.27 361,755.312018 21,376.45 22.00 470,281.90 56,433.83 413,848.072019 22,231.51 22.00 489,093.17 58,691.18 430,402.002020 23,120.77 24.00 554,898.44 66,587.81 488,310.62
Piniritong Isda RollYear Sales Volume Price Projected Sales VAT (12%) Net Sales2016 12,576.92 20.00 251,538.38 30,184.61 221,353.772017 13,080.00 20.00 261,599.91 31,391.99 230,207.922018 13,603.20 22.00 299,270.30 35,912.44 263,357.862019 14,147.32 22.00 311,241.11 37,348.93 273,892.182020 14,713.22 24.00 353,117.19 42,374.06 310,743.12
Pochero RollYear Sales Volume Price Projected Sales VAT (12%) Net Sales2016 5,390.11 20.00 107,802.16 12,936.26 94,865.902017 5,605.71 20.00 112,114.25 13,453.71 98,660.542018 5,829.94 22.00 128,258.70 15,391.04 112,867.662019 6,063.14 22.00 133,389.05 16,006.69 117,382.362020 6,305.66 24.00 151,335.94 18,160.31 133,175.62
Silog Roll
44
Part 2 Market Study
Year Sales Volume Price Projected Sales VAT (12%) Net Sales2016 17,967.03 20.00 359,340.54 43,120.86 316,219.672017 18,685.71 20.00 373,714.14 44,845.70 328,868.462018 19,433.17 22.00 427,529.00 51,303.48 376,225.522019 20,210.46 22.00 444,630.16 53,355.62 391,274.542020 21,018.88 24.00 504,453.13 60,534.37 443,918.75
X. Marketing Program and Strategies
To achieve a sustainable competitive advantage and increase sales, programs or
strategies should be implemented. Marketing strategy must be used to achieve those
objectives. It includes all basic, short-term, and long-term activities in the field of marketing that
deal with the analysis of the strategic initial situation of a company and the formulation,
evaluation and selection of market-oriented strategies and therefore contributes to the goals of
the company and its marketing objectives. It will help the business communicate its products or
services to its potential customers.
A. Product Strategy
Based on the responses from our survey; Adobo Roll (38%), Afritada Roll
(8%), Kaldereta Roll (13%), Kare-Kare Roll (5%), Mechado Roll (5%), Menudo Roll
(11%), Piniritong Isda Roll (7%), Pochero Roll (3%) and Silog Roll (10%) are the
services that we will provide to our customer. We also consider the responses from the
survey that tells about the top most food quality that attract more customers.
Affordability and Deliciousness are what they are looking for which the analyst
considers most, they will offer every roll for only PHP. 20.00 and make sure that the rice
rolls are delicious.
45

Part 2 Market Study
B. Place Strategy
Rice in Roll is located at Polytechnic University of The Philippines - Taguig
Branch at General Santos Avenue Lower Bicutan, Taguig City. We noticed that the
students of the university tend to go outside the school premises just to buy food for
lunch because the canteen or the other food stalls are not enough to cater all of them or
maybe they just want to try something new. So here we are offering them something
great in taste and budget friendly.
46

Part 2 Market Study
Location Map of Rice in Roll
C. Pricing Strategy
Based on the survey conducted, 66% of the respondents have P10-P50
budget for lunch. Based from this result, we have been able to set the minimum price to
our customers but we have also considered other factors like competitors price of one
rice meal and the cost that we will incur in preparing the product. So, we used cost plus
strategy to set the price of our service. The computation would be:
Product Cost + Operating Cost+ VAT + Mark Up = Selling Price
Products/Services Price
Adobo Roll Php. 20.00
47

Part 2 Market Study
Afritada Roll Php. 20.00
Kaldereta Roll Php. 20.00
Kare-Kare Roll Php. 20.00
Mechado Roll Php. 20.00
Menudo Roll Php. 20.00
Piniritong Isda Roll Php. 20.00
Pochero Roll Php. 20.00
Silog Roll Php. 20.00
D. Promotion Strategy
Tarpaulin
The tarpaulin will be place in our store. It can able to call the
attention of the customers because the information is provided as well. The color and
design will surely catch the attention of our customers. One tarpaulin will be use with a
size of 4ft. x 5ft. with the price of P200.00.
48

Part 2 Market Study
Sample Design of our Tarpaulin
Flyers
Flyers will be used to designate the information to a wide range of
target customer from the Polytechnic University of the Philippines-Taguig. The food stall
will produce 300 flyers at the opening of the store. These flyers will only be distributed in
the first 2 months because of the small population of the market. Flyers will be
given until it will get its loyal customers
49
Rice Rolls
Part 2 Market Study
The computation would be:
No. of Pcs. X Unit Price
300 X P0.50 = Php.150.00
Sample design of flyers
Social Media
For small businesses, Social media represents an opportunity to
increase their reach. With unsurpassed audience reach and strong targeting options,
social media such as Facebook and Twitter is a great choice for businesses hoping to
maximize brand exposure. The service’s extensively customizable targeting functionality
50
Rice in Roll

Part 2 Market Study
enables advertisers to tailor their messaging to highly specific demographics of their
target market to increase awareness without incurring any cost at all.
Facebook Page
51

Part 2 Market Study
Twitter Page
52