march 2019 report on peel newcomers - marco campana
TRANSCRIPT
Meryam Ahsan. Roots and Wings. 2014. Mixed media (graphite drawing on canson, acrylic sheet, acrylic paint), 8.5” x 11”.
March 2019
Report on Peel NewcomersPeel Newcomer Strategy Group
A project of

Writers
Rodel Imbarlina-Ramos, Director, Peel Newcomer Strategy Group
Trisha Scantlebury, Research & Policy Specialist, Peel Newcomer Strategy Group
Acknowledgements
We recognize a number of research and community stakeholders who contributed content, insights and advice to
this report:
• Peel Data Centre, Region of Peel: Ron Jaros, Manager; and Kevin Farrugia, Advisor
• Peel-Halton Workforce Development Group: Shalini Da Cunha, Executive Director
• Region of Peel: Sonia Pace, Director, Community Partnerships
• Regional Diversity Roundtable: Varsha Naik, Executive Director; and Nafeesa Jalal, Project Coordinator
• United Way of Greater Toronto: Pedro Barata, Senior Vice President, Community Impact & Strategy, Ruth
Crammond, Vice President, Community Investment & Development; Michelynn Laflèche, Vice President,
Strategy, Research and Policy; Mihaela Dinca-Panaitescu, Manager, Research, Public Policy and Evaluation;
and Laura McDonough, Senior Manager, Research, Public Policy & Evaluation
• University of Western Ontario: Dr. Michael Haan, Associate Professor, Canada Research Chair in Migration
and Ethnic Relations, Director of the Statistics Canada Research Data Centre at Western and Director of
the Collaborative Graduate Program in Migration and Ethnic Relations; and Tina Luu Ly, Ph.D. Student,
Department of Sociology
Funding
Funding for the IMDB/Longitudinal Immigration Database study and the informal settlement study cited in this
report as well as the production and release of this document was provided by the Region of Peel.
Data disclaimer
Access to data from the IMDB/Longitudinal Immigration Database was provided by Statistics Canada’s Research
Data Centre at the University of Western Ontario. This research was supported by funds to the Canadian Research
Data Centre Network (CRDCN) from the Social Sciences and Humanities Research Council (SSHRC), the Canadian
Institute for Health Research (CIHR), the Canadian Foundation for Innovation (CFI), and Statistics Canada. Although
the research and analysis are based on data from Statistics Canada, the opinions expressed do not represent the
views of Statistics Canada.
Links
The PDF version of this report contains weblinks to external source material. These links were current at time of
writing. PNSG is neither responsible for the future integrity of these links, nor for the content that these websites
contain.
Cover art
“Roots and Wings” comes from a 2014 series by Meryam Ahsan. The artist continues to maintain a long fascination
with trees, based on themes inspired by family heirlooms, as well as butterflies, specifically their capacity for
metamorphosis and migration. Born to Pakistani parents and after spending her childhood in the UAE, Meryam is
establishing new roots in Peel, both as a local artist and volunteer at the Art Gallery of Mississauga.
Peel Newcomer Strategy Group
Peel Newcomer Strategy Group (PNSG) is the local immigration partnership for Peel Region, serving the City of Brampton, the Town of Caledon and the City of Mississauga. As a community collaborative, PNSG engages local service providers and stakeholders to optimize and coordinate services that facilitate newcomer settlement and integration – through partnerships, research, community-based knowledge sharing and strategic planning.
PNSG is a project of the United Way of Greater Toronto (UWGT) and funded by Immigration, Refugees & Citizenship Canada (IRCC), the Region of Peel and UWGT.
Glossary
Introduction
Key findings
By the numbers
1. The flows of immigrants into and out of Peel are dynamic
2. While some economic outcomes for newcomers in Peel show promise, there are important disparities still to address
3. Newcomers require more effective formal and informal settlement supports
Conclusions and Recommendations
References and additional resources
Contents
1
2
5
7
17
21
34
42
44
Glossary1
Emigrant An immigrant who lived in Peel and is now residing outside of Peel.
GTA “Greater Toronto Area,” which includes the Regional Municipality of Halton, Peel Region, the City of Toronto, the Regional Municipality of York and the Regional Municipality of Durham.
IMDB or Longitudinal Immigration Database A Statistics Canada product that combines immigrant landing information with Canada Revenue Agency tax-filer data, providing insights about immigrants’ mobility and labour market participation.
Immigrant A person born outside of Canada who is a permanent resident.
Newcomer Any permanent foreign-born resident who arrived in Canada at any time over the past five years. This report focuses on the most recent census period (2011-2016), so the term generally refers to immigrants who settled in Canada during this timeframe.
Primary migrant An immigrant who settles directly in Peel after arriving in Canada.
Secondary migrant An immigrant who arrived to Canada and initially settled outside of Peel, but is now residing in Peel.
2
Peel is a large and vibrant regional municipality comprising Brampton, Caledon and Mississauga. A major settlement destination for newcomers to Canada, Peel is also an immigrant-majority population. According to 2016 census data, immigrants account for 51.5 percent of Peel’s population of 1.37 million residents. Among them, 94,105 are newcomers who arrived to Canada during the 2011-2016 census period. This means that over this five-year period, Peel welcomed an average of 18,821 newcomers annually.
Peel stakeholders are keenly aware of the newcomer and immigrant composition of the population. Many service-providing organizations participate on community committees that feature frequent discussions about issues facing our newcomer population as well as our collective ability to address these issues. This discourse is vital given that the needs of newcomers can be numerous and complex, requiring the expertise and participation of multiple service-providing organizations to support newcomers effectively and holistically.
While Canadians tend to have a positive view overall towards immigrants, recent media attention has tended to focus on narrow aspects of a much broader immigration program aimed at driving population and labour force growth amid a persistently low national birth rate and impending baby-boomer retirements. This may be contributing to an increasingly, but disproportionately, contentious discourse about immigrants.
We believe that discussions about the settlement and integration of newcomers should be grounded in qualitative and quantitative evidence to guide policy decisions and service design. Canada’s federal government plans to boost the volume of immigrant admissions to Canada in the coming years, and this will have an impact in Peel. In 2016, Canada admitted 296,346 permanent residents, and Peel settled about 6.4 percent of this total. If this proportion holds, by 2021 when the annual admission level is expected to rise to 350,000, Peel can expect to settle about 22,200 newcomers each year, or about 3,500 more than it did in 2016.
Introduction
3 How can this report help? In 2018, PNSG conducted two community consultations with local stakeholders, as well as an online survey of local settlement service providers. We also commissioned two pieces of research: a longitudinal immigration database study examining the inward and outward flows of Peel immigrants and their participation in the labour market; and a novel study of informal (i.e., non-service provider) settlement supports. Collectively, the data, insights and recommendations gathered across these sources contribute to an updated and multi-faceted picture of newcomers in Peel.
This report is the compilation of this data-gathering. It paints a broad picture of newcomer settlement in Peel and suggests how these findings should influence local settlement and integration efforts for greater efficacy and impact.
It also surfaces insights and questions at an interesting time in our immigration discourse, not the least of which: Are we having the right conversations about newcomers and immigrants?
4We hope this report will
• Strengthen the ability of local stakeholders to address current issues facing newcomers and immigrants in their planning
• Inform policy and program development, as well as new research opportunities
• Promote more effective coordination among local stakeholders to address newcomers’ settlement priorities
• Paint a wider picture of newcomer settlement and integration from the lens of formal and informal systems, which can drive a more cohesive way to engage all newcomers in Peel
• Promote a more evidence-based discussion about newcomers and immigrants
5
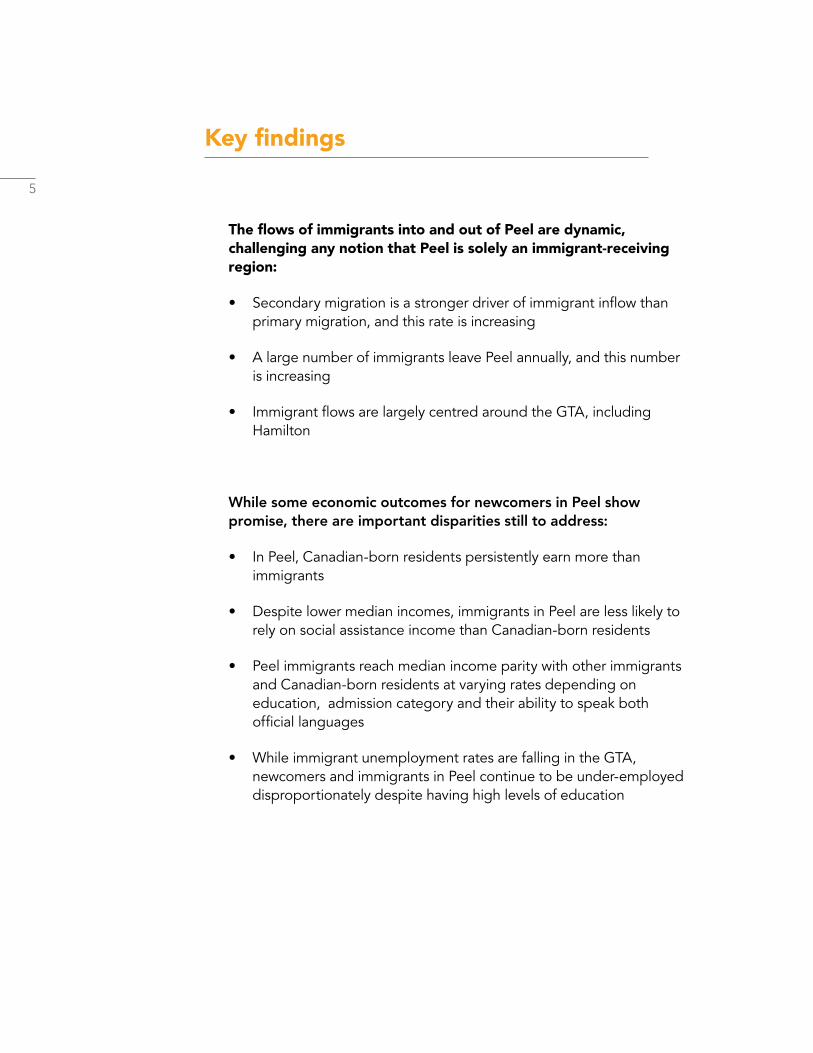
The flows of immigrants into and out of Peel are dynamic, challenging any notion that Peel is solely an immigrant-receiving region:
• Secondary migration is a stronger driver of immigrant inflow than primary migration, and this rate is increasing
• A large number of immigrants leave Peel annually, and this number is increasing
• Immigrant flows are largely centred around the GTA, including Hamilton
While some economic outcomes for newcomers in Peel show promise, there are important disparities still to address:
• In Peel, Canadian-born residents persistently earn more than immigrants
• Despite lower median incomes, immigrants in Peel are less likely to rely on social assistance income than Canadian-born residents
• Peel immigrants reach median income parity with other immigrants and Canadian-born residents at varying rates depending on education, admission category and their ability to speak both official languages
• While immigrant unemployment rates are falling in the GTA, newcomers and immigrants in Peel continue to be under-employed disproportionately despite having high levels of education
Key findings

6
Newcomers require more effective formal and informal settlement supports:
• Formal settlement services need to evolve to better address a wider spectrum of newcomer priorities.
• Service providers can benefit from increased support to facilitate cross-sector partnerships, service navigation and client referrals, as well as the ability to measure impact.
• While a majority of newcomers rely on informal supports to facilitate their integration into the community, many newcomers recommend the assistance of formal, government-sponsored settlement services.
7
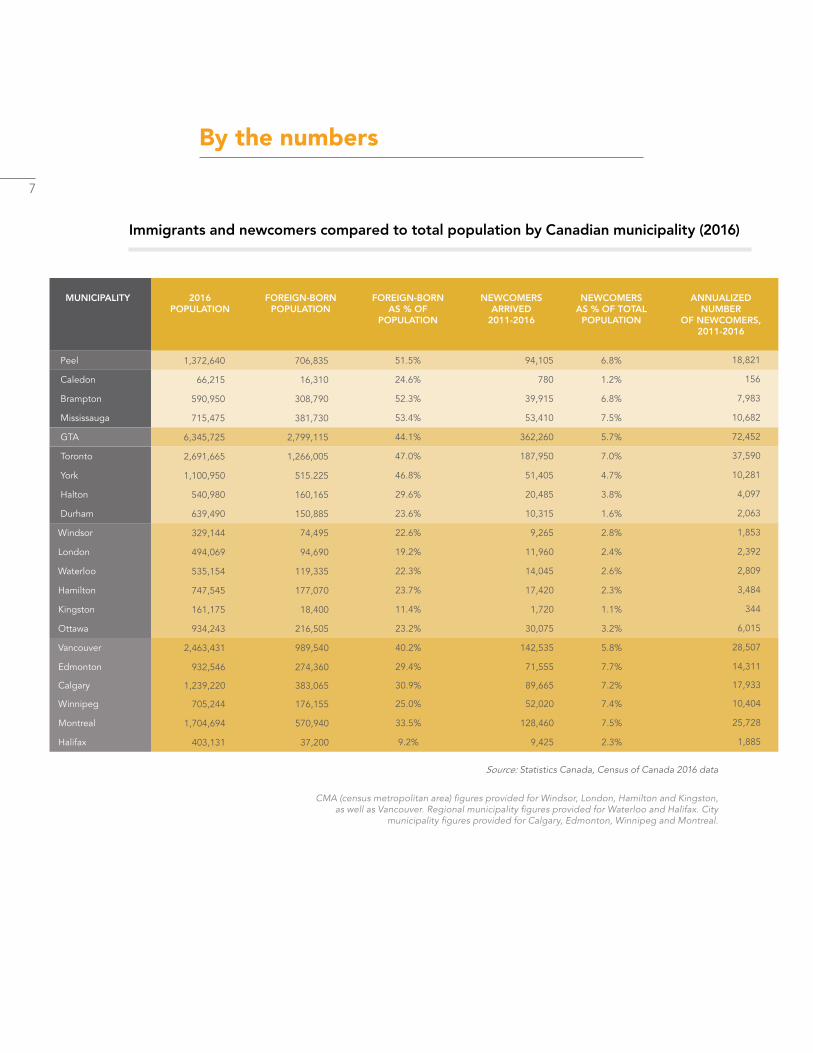
Source: Statistics Canada, Census of Canada 2016 data
CMA (census metropolitan area) figures provided for Windsor, London, Hamilton and Kingston, as well as Vancouver. Regional municipality figures provided for Waterloo and Halifax. City
municipality figures provided for Calgary, Edmonton, Winnipeg and Montreal.
By the numbers
Immigrants and newcomers compared to total population by Canadian municipality (2016)
MUNICIPALITY 2016 POPULATION
FOREIGN-BORN POPULATION
FOREIGN-BORN AS % OF
POPULATION
NEWCOMERS ARRIVED
2011-2016
NEWCOMERS AS % OF TOTAL
POPULATION
ANNUALIZED NUMBER
OF NEWCOMERS, 2011-2016
Peel 1,372,640 706,835 51.5% 94,105 6.8% 18,821
Caledon 66,215 16,310 24.6% 780 1.2% 156
Brampton 590,950 308,790 52.3% 39,915 6.8% 7,983
Mississauga 715,475 381,730 53.4% 53,410 7.5% 10,682
GTA 6,345,725 2,799,115 44.1% 362,260 5.7% 72,452
Toronto 2,691,665 1,266,005 47.0% 187,950 7.0% 37,590
York 1,100,950 515.225 46.8% 51,405 4.7% 10,281
Halton 540,980 160,165 29.6% 20,485 3.8% 4,097
Durham 639,490 150,885 23.6% 10,315 1.6% 2,063
Windsor 329,144 74,495 22.6% 9,265 2.8% 1,853
London 494,069 94,690 19.2% 11,960 2.4% 2,392
Waterloo 535,154 119,335 22.3% 14,045 2.6% 2,809
Hamilton 747,545 177,070 23.7% 17,420 2.3% 3,484
Kingston 161,175 18,400 11.4% 1,720 1.1% 344
Ottawa 934,243 216,505 23.2% 30,075 3.2% 6,015
Vancouver 2,463,431 989,540 40.2% 142,535 5.8% 28,507
Edmonton 932,546 274,360 29.4% 71,555 7.7% 14,311
Calgary 1,239,220 383,065 30.9% 89,665 7.2% 17,933
Winnipeg 705,244 176,155 25.0% 52,020 7.4% 10,404
Montreal 1,704,694 570,940 33.5% 128,460 7.5% 25,728
Halifax 403,131 37,200 9.2% 9,425 2.3% 1,885
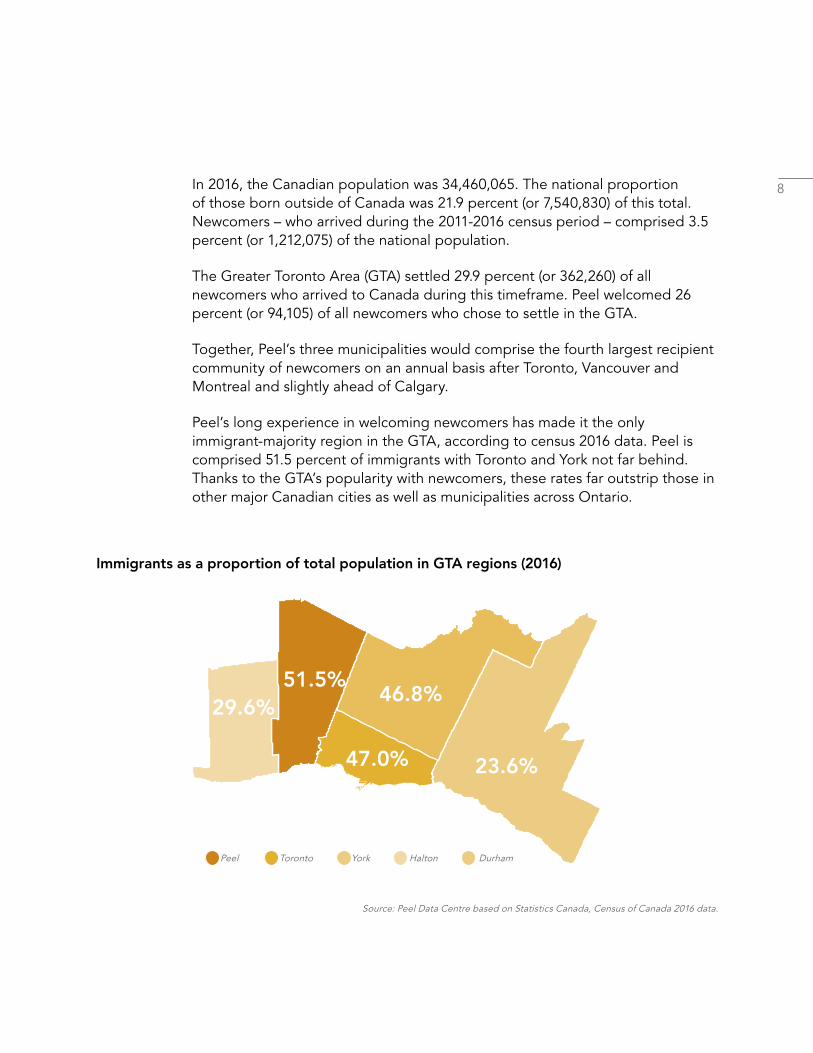
8In 2016, the Canadian population was 34,460,065. The national proportion of those born outside of Canada was 21.9 percent (or 7,540,830) of this total. Newcomers – who arrived during the 2011-2016 census period – comprised 3.5 percent (or 1,212,075) of the national population.
The Greater Toronto Area (GTA) settled 29.9 percent (or 362,260) of all newcomers who arrived to Canada during this timeframe. Peel welcomed 26 percent (or 94,105) of all newcomers who chose to settle in the GTA.
Together, Peel’s three municipalities would comprise the fourth largest recipient community of newcomers on an annual basis after Toronto, Vancouver and Montreal and slightly ahead of Calgary.
Peel’s long experience in welcoming newcomers has made it the only immigrant-majority region in the GTA, according to census 2016 data. Peel is comprised 51.5 percent of immigrants with Toronto and York not far behind. Thanks to the GTA’s popularity with newcomers, these rates far outstrip those in other major Canadian cities as well as municipalities across Ontario.
Immigrants as a proportion of total population in GTA regions (2016)
Source: Peel Data Centre based on Statistics Canada, Census of Canada 2016 data.
29.6%51.5%
47.0%
46.8%
23.6%
Peel Toronto York Halton Durham
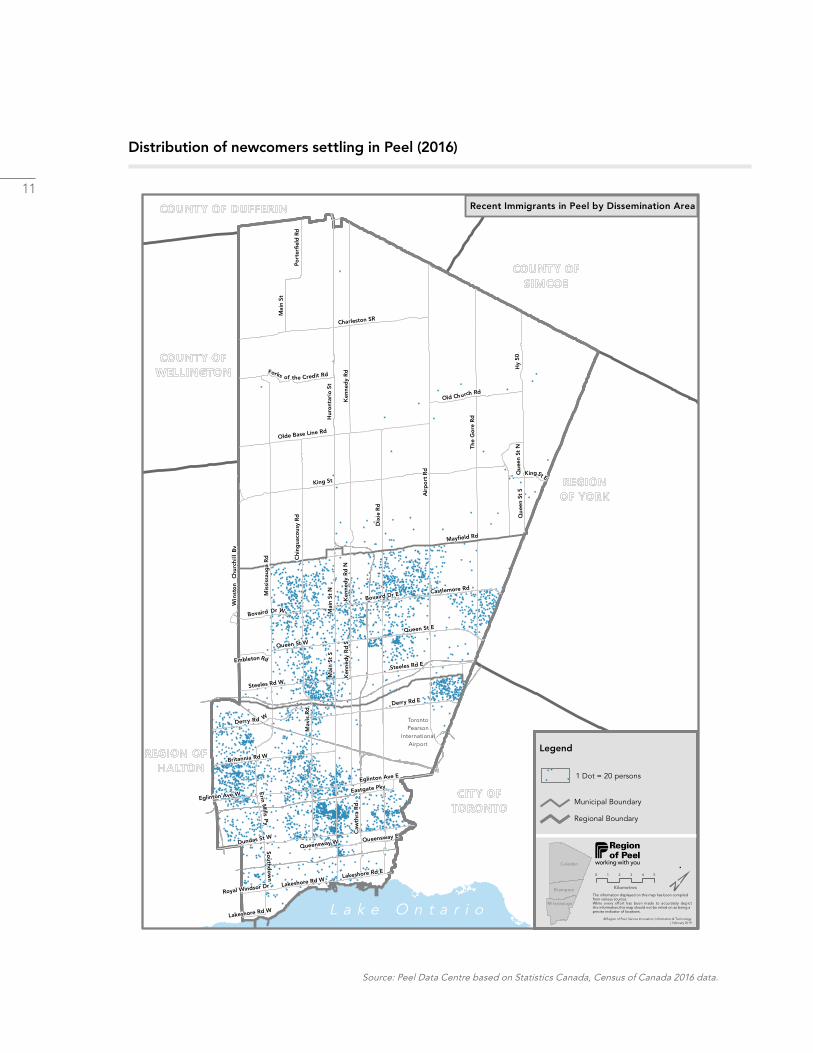
9 Most of Peel’s newcomer population is centred in its urban municipalities: Brampton and Mississauga. Peel welcomes more than 50 newcomers on a daily basis – about 29 to Mississauga and 22 to Brampton.
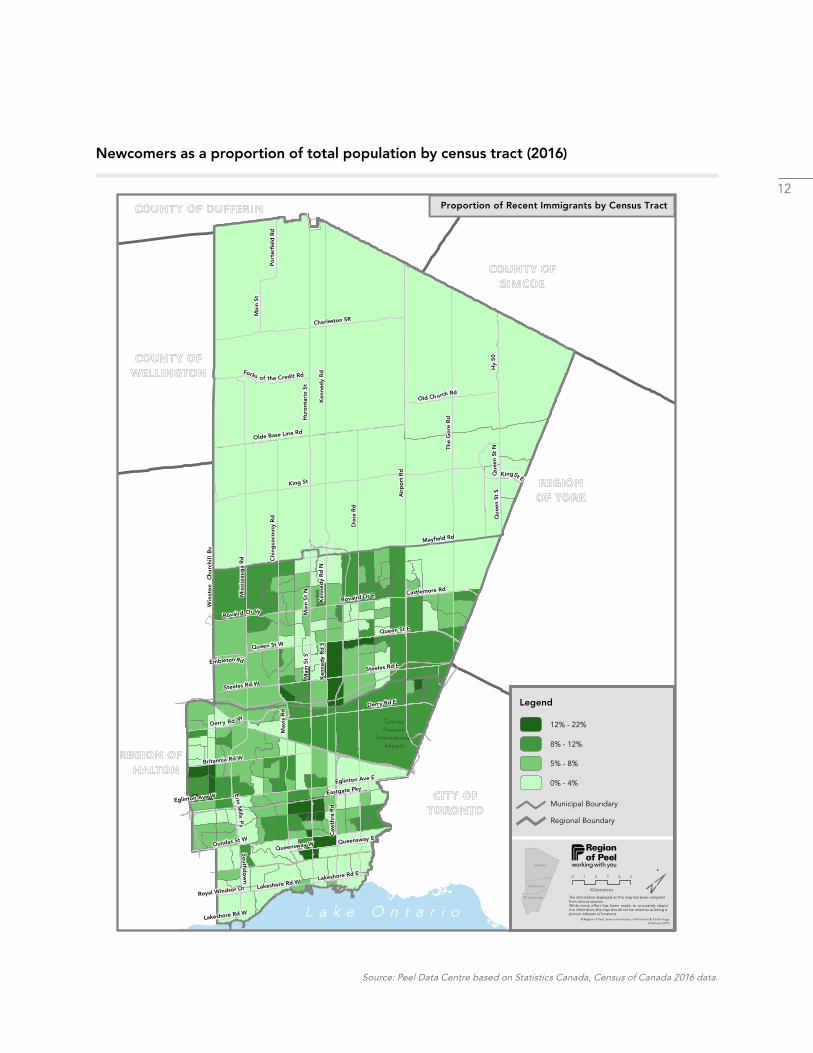
Page 11 features a density distribution of Peel newcomers during the 2011-2016 census period with each dot representing 20 individuals. Page 12 organizes this distribution according to census tract. Both show that notable concentrations of newcomer settlement occur in:
• Southwest Brampton
• The Bramalea City Centre corridor in Brampton
• Churchill Meadows in Mississauga
• Malton in Mississauga
• Mississauga City Centre/Square One in Mississauga
• Cooksville in Mississauga
While each regional and local municipality in the GTA showed population increases in the five-year periods leading up to 2011 and 2016 (see Change in proportion of newcomer population by GTA municipality), Brampton and Caledon showed considerably higher rates of total population growth, while Mississauga’s population grew more modestly.
Fewer newcomers settled in Peel during the 2011-2016 census period than in 2006-2011, and newcomers comprised a smaller proportion of the total population. Among Peel’s three municipalities, Caledon was the exception; it welcomed more newcomers in 2011-2016 than it did in 2006-2011.
10
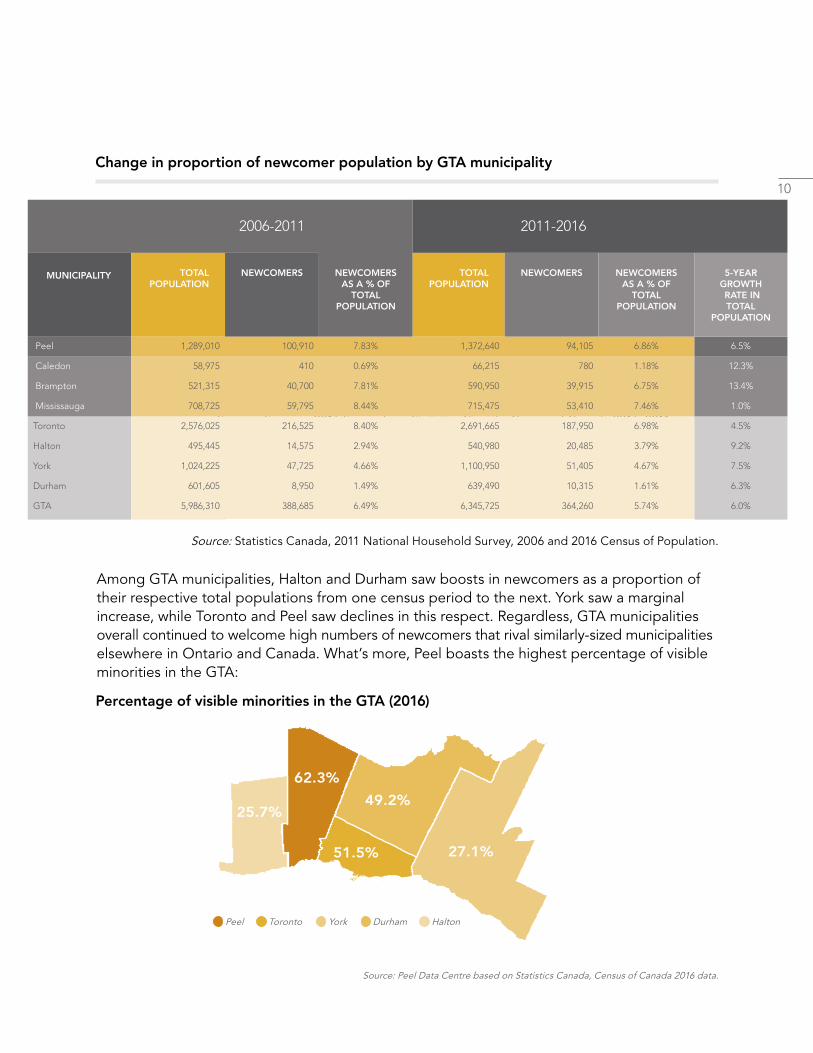
Change in proportion of newcomer population by GTA municipality
Among GTA municipalities, Halton and Durham saw boosts in newcomers as a proportion of their respective total populations from one census period to the next. York saw a marginal increase, while Toronto and Peel saw declines in this respect. Regardless, GTA municipalities overall continued to welcome high numbers of newcomers that rival similarly-sized municipalities elsewhere in Ontario and Canada. What’s more, Peel boasts the highest percentage of visible minorities in the GTA:
Sources: Sources: 2016 figures from Statistics Canada, Census of Canada 2016; 2011 figures from Peel Data Centre 2011 NHS Bulletin - Immigration & Citizenship.
Percentage of visible minorities in the GTA (2016)
Source: Peel Data Centre based on Statistics Canada, Census of Canada 2016 data.
Source: Statistics Canada, 2011 National Household Survey, 2006 and 2016 Census of Population.
2006-2011 2011-2016
MUNICIPALITY TOTAL POPULATION
NEWCOMERS NEWCOMERS AS A % OF
TOTAL POPULATION
TOTAL POPULATION
NEWCOMERS NEWCOMERS AS A % OF
TOTAL POPULATION
5-YEAR GROWTH RATE IN TOTAL
POPULATION
Peel 1,289,010 100,910 7.83% 1,372,640 94,105 6.86% 6.5%
Caledon 58,975 410 0.69% 66,215 780 1.18% 12.3%
Brampton 521,315 40,700 7.81% 590,950 39,915 6.75% 13.4%
Mississauga 708,725 59,795 8.44% 715,475 53,410 7.46% 1.0%
Toronto 2,576,025 216,525 8.40% 2,691,665 187,950 6.98% 4.5%
Halton 495,445 14,575 2.94% 540,980 20,485 3.79% 9.2%
York 1,024,225 47,725 4.66% 1,100,950 51,405 4.67% 7.5%
Durham 601,605 8,950 1.49% 639,490 10,315 1.61% 6.3%
GTA 5,986,310 388,685 6.49% 6,345,725 364,260 5.74% 6.0%
62.3%
51.5% 27.1%
49.2%25.7%
Peel Toronto York Halton Durham
11
Distribution of newcomers settling in Peel (2016)
Source: Peel Data Centre based on Statistics Canada, Census of Canada 2016 data.
TorontoPearson
InternationalAirport
L a k e O n t a r i o
Lakeshore Rd E
Lakeshore Rd W
Queensway W
Eglinton Ave W
Mai
n St
NMis
siss
aug
a R
d
Qu
een
St N
Ken
ned
y R
d
Mai
n St
S
Eglinton Ave E
Mav
is R
d
Ken
ned
y R
d N
Dundas St W
Chi
ngua
cous
y R
d
Royal Windsor Dr Lakeshore Rd W
Castlemore Rd
Southd
ow
n
Eastgate Pky
Hur
ont
ario
St
Steeles Rd W
Bovaird Dr E
Bovaird Dr W
Queensway E
Qu
een
St S
Derry Rd W
Queen St E
Derry Rd E
Queen St W
Mai
n St
Steeles Rd E
Olde Base Line Rd
KingSt E
EmbletonRd
Britannia Rd W
King St
Hy
50
Forks of the Credit Rd
Old Church Rd
Charleston SR
Caw
thra
Rd
The
Go
re R
d
Ken
nedy
Rd
S
Erin
Mills
Py
Dix
ie R
d
Air
po
rt R
d
Win
sto
nC
hu
rch
ill
Bv
Caledon
Brampton
Mississauga
The information displayed on this map has been compiledfrom various sources.While every effort has been made to accurately depictthe information,this map should not be relied on as being aprecise indicator of locations.
© Region of Peel, Service Innovation, Information & Technology | February 2019.
0 1 2 3 4 5
Kilometres
Recent Immigrants in Peel by Dissemination Area
Municipal Boundary
Regional Boundary
Legend
1 Dot = 20 persons
12
Newcomers as a proportion of total population by census tract (2016)
Source: Peel Data Centre based on Statistics Canada, Census of Canada 2016 data.
TorontoPearson
InternationalAirport
L a k e O n t a r i o
Lakeshore Rd E
Lakeshore Rd W
Queensway W
Eglinton Ave W
Mai
n St
NMis
siss
aug
a R
d
Qu
een
St N
Ken
ned
y R
d
Mai
n St
S
Eglinton Ave E
Mav
is R
d
Ken
ned
y R
d N
Dundas St W
Chi
ngua
cous
y R
d
Royal Windsor Dr Lakeshore Rd W
Castlemore Rd
Southd
ow
n
Eastgate Pky
Hur
ont
ario
St
Steeles Rd W
Bovaird Dr E
Bovaird Dr W
Queensway E
Qu
een
St S
Derry Rd W
Queen St E
Derry Rd E
Queen St W
Mai
n St
Steeles Rd E
Olde Base Line Rd
KingSt E
EmbletonRd
Britannia Rd W
King St
Hy
50
Forks of the Credit Rd
Old Church Rd
Charleston SR
Caw
thra
Rd
The
Go
re R
d
Ken
nedy
Rd
S
Erin
Mills
Py
Dix
ie R
d
Air
po
rt R
d
Win
sto
nC
hu
rch
ill
Bv
Cal edon
Br am pton
Mi ssi ssau ga The information displayed on this map has been compiledfrom various sources.While every effort has been made to accurately depictthe information,this map should not be relied on as being aprecise indicator of locations.
© Region of Peel, Service Innovation, Information & Technology | February 2019.
0 1 2 3 4 5
Kilometres
Proportion of Recent Immigrants by Census Tract
Municipal Boundary
Regional Boundary
Legend
12% - 22%
8% - 12%
5% - 8%
0% - 4%
13
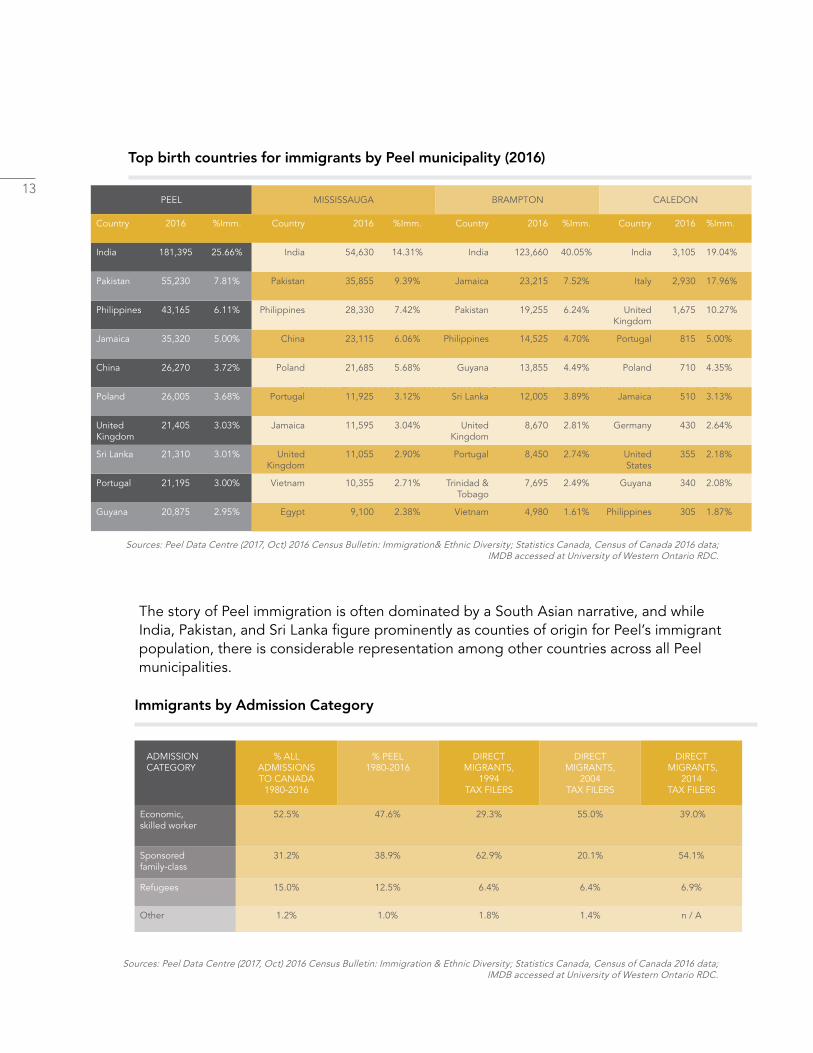
Top birth countries for immigrants by Peel municipality (2016)
Source: Peel Data Centre based on Statistics Canada, Census of Canada 2016 data.
The story of Peel immigration is often dominated by a South Asian narrative, and while India, Pakistan, and Sri Lanka figure prominently as counties of origin for Peel’s immigrant population, there is considerable representation among other countries across all Peel municipalities.
Immigrants by Admission Category
Sources: Peel Data Centre (2017, Oct) 2016 Census Bulletin: Immigration & Ethnic Diversity; Statistics Canada, Census of Canada 2016 data; IMDB accessed at University of Western Ontario RDC.
Sources: Peel Data Centre (2017, Oct) 2016 Census Bulletin: Immigration& Ethnic Diversity; Statistics Canada, Census of Canada 2016 data; IMDB accessed at University of Western Ontario RDC.
PEEL MISSISSAUGA BRAMPTON CALEDON
Country 2016 %Imm. Country 2016 %Imm. Country 2016 %Imm. Country 2016 %Imm.
India 181,395 25.66% India 54,630 14.31% India 123,660 40.05% India 3,105 19.04%
Pakistan 55,230 7.81% Pakistan 35,855 9.39% Jamaica 23,215 7.52% Italy 2,930 17.96%
Philippines 43,165 6.11% Philippines 28,330 7.42% Pakistan 19,255 6.24% United Kingdom
1,675 10.27%
Jamaica 35,320 5.00% China 23,115 6.06% Philippines 14,525 4.70% Portugal 815 5.00%
China 26,270 3.72% Poland 21,685 5.68% Guyana 13,855 4.49% Poland 710 4.35%
Poland 26,005 3.68% Portugal 11,925 3.12% Sri Lanka 12,005 3.89% Jamaica 510 3.13%
United Kingdom
21,405 3.03% Jamaica 11,595 3.04% United Kingdom
8,670 2.81% Germany 430 2.64%
Sri Lanka 21,310 3.01% United Kingdom
11,055 2.90% Portugal 8,450 2.74% United States
355 2.18%
Portugal 21,195 3.00% Vietnam 10,355 2.71% Trinidad & Tobago
7,695 2.49% Guyana 340 2.08%
Guyana 20,875 2.95% Egypt 9,100 2.38% Vietnam 4,980 1.61% Philippines 305 1.87%
ADMISSION CATEGORY
% ALL ADMISSIONS TO CANADA
1980-2016
% PEEL 1980-2016
DIRECTMIGRANTS,
1994 TAX FILERS
DIRECT MIGRANTS,
2004 TAX FILERS
DIRECT MIGRANTS,
2014 TAX FILERS
Economic, skilled worker
52.5% 47.6% 29.3% 55.0% 39.0%
Sponsored family-class
31.2% 38.9% 62.9% 20.1% 54.1%
Refugees 15.0% 12.5% 6.4% 6.4% 6.9%
Other 1.2% 1.0% 1.8% 1.4% n / A
14
Top birth countries for immigrants by Peel municipality (2016)
Canada maintains a largely economic-oriented immigration program, with more than 50 percent of newcomers admitted between 1980 and 2016 under the skilled-worker stream. A smaller proportion was admitted under the sponsored family-class stream (31 percent) and fewer still comprised of refugees (15 percent).
Over this same time period, Peel settled slightly lower proportions of skilled-workers (47.6 percent) and refugees (12.5 percent) while welcoming a larger proportion of sponsored family-class immigrants (38.9 percent). Given the human-capital basis of Canada’s immigration program that emphasizes education, skills and work experience (as well as age and language), this higher rate of family reunification in Peel may enhance the retention of both economic and family-class newcomers settling in the region.
When we look at tax-filer data of primary migrants settling in Peel (i.e., filing their first tax return in Peel after arriving in Canada), we see even broader variations. For example, refugees accounted for fewer first-time tax-filers than the Peel or national proportions in 1994, 2004 and 2014. In addition, the relative proportion of economic and family-class migrant categories appears to flip when comparing 1994, 2004 and 2014 direct migration and tax-filer data, demonstrating considerable variability in the character of the newest foreign arrivals in Peel from one year to another.
15
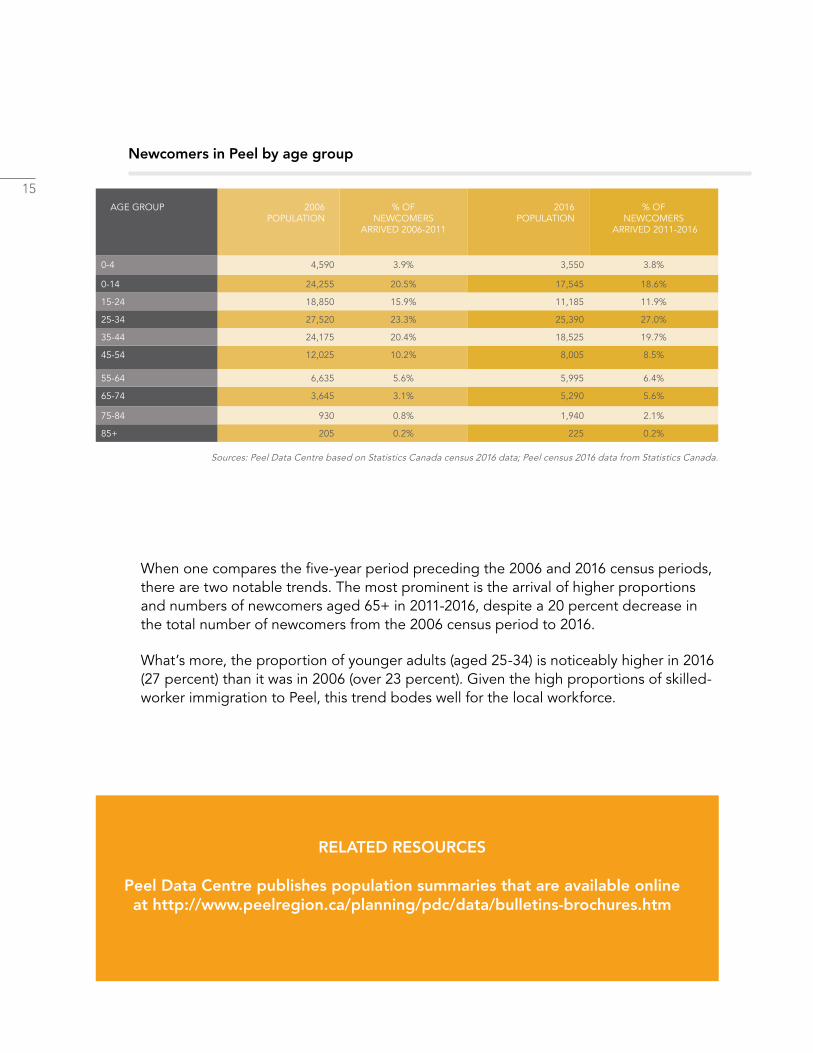
Newcomers in Peel by age group
Sources: Peel Data Centre based on Statistics Canada census 2016 data; Peel census 2016 data from Statistics Canada.
When one compares the five-year period preceding the 2006 and 2016 census periods, there are two notable trends. The most prominent is the arrival of higher proportions and numbers of newcomers aged 65+ in 2011-2016, despite a 20 percent decrease in the total number of newcomers from the 2006 census period to 2016.
What’s more, the proportion of younger adults (aged 25-34) is noticeably higher in 2016 (27 percent) than it was in 2006 (over 23 percent). Given the high proportions of skilled-worker immigration to Peel, this trend bodes well for the local workforce.
AGE GROUP 2006 POPULATION
% OF NEWCOMERS
ARRIVED 2006-2011
2016 POPULATION
% OF NEWCOMERS
ARRIVED 2011-2016
0-4 4,590 3.9% 3,550 3.8%
0-14 24,255 20.5% 17,545 18.6%
15-24 18,850 15.9% 11,185 11.9%
25-34 27,520 23.3% 25,390 27.0%
35-44 24,175 20.4% 18,525 19.7%
45-54 12,025 10.2% 8,005 8.5%
55-64 6,635 5.6% 5,995 6.4%
65-74 3,645 3.1% 5,290 5.6%
75-84 930 0.8% 1,940 2.1%
85+ 205 0.2% 225 0.2%
RELATED RESOURCES
Peel Data Centre publishes population summaries that are available online at http://www.peelregion.ca/planning/pdc/data/bulletins-brochures.htm
16
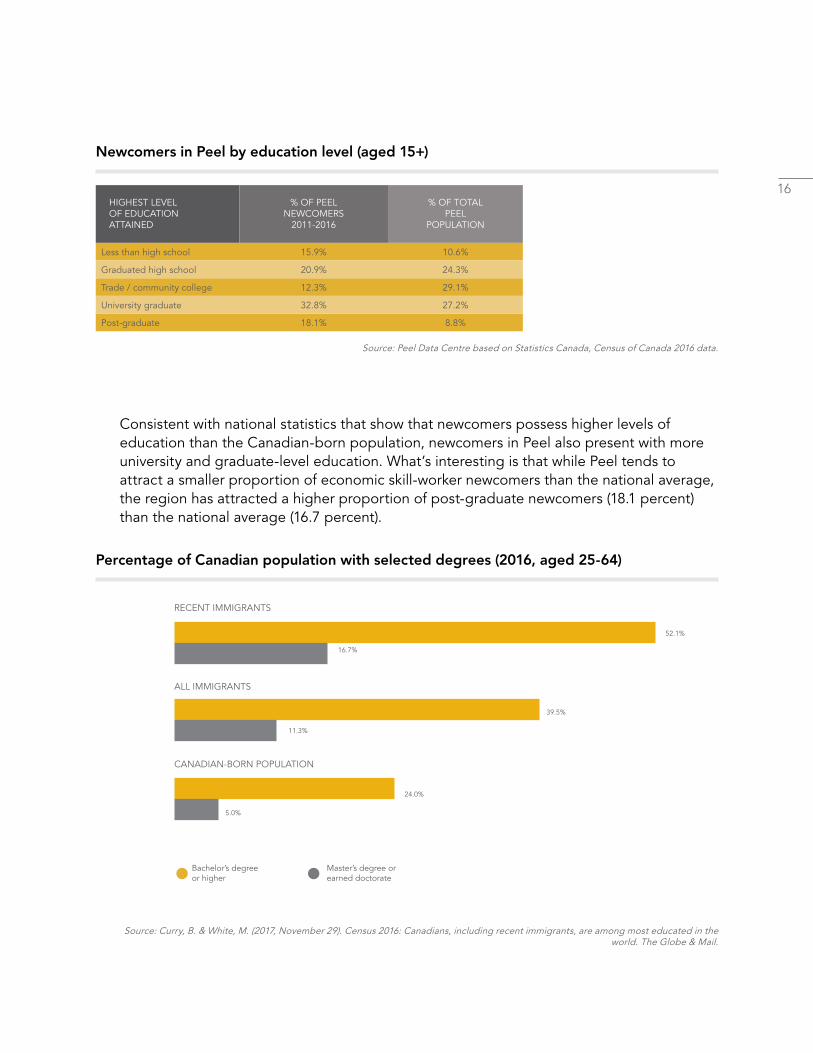
Newcomers in Peel by education level (aged 15+)
Percentage of Canadian population with selected degrees (2016, aged 25-64)
Source: Peel Data Centre based on Statistics Canada, Census of Canada 2016 data.
Consistent with national statistics that show that newcomers possess higher levels of education than the Canadian-born population, newcomers in Peel also present with more university and graduate-level education. What’s interesting is that while Peel tends to attract a smaller proportion of economic skill-worker newcomers than the national average, the region has attracted a higher proportion of post-graduate newcomers (18.1 percent) than the national average (16.7 percent).
Source: Curry, B. & White, M. (2017, November 29). Census 2016: Canadians, including recent immigrants, are among most educated in the world. The Globe & Mail.
HIGHEST LEVEL OF EDUCATION ATTAINED
% OF PEEL NEWCOMERS
2011-2016
% OF TOTAL PEEL
POPULATION
Less than high school 15.9% 10.6%
Graduated high school 20.9% 24.3%
Trade / community college 12.3% 29.1%
University graduate 32.8% 27.2%
Post-graduate 18.1% 8.8%
52.1%
16.7%
39.5%
11.3%
24.0%
5.0%
Bachelor’s degreeor higher
Master’s degree orearned doctorate
RECENT IMMIGRANTS
ALL IMMIGRANTS
CANADIAN-BORN POPULATION
17
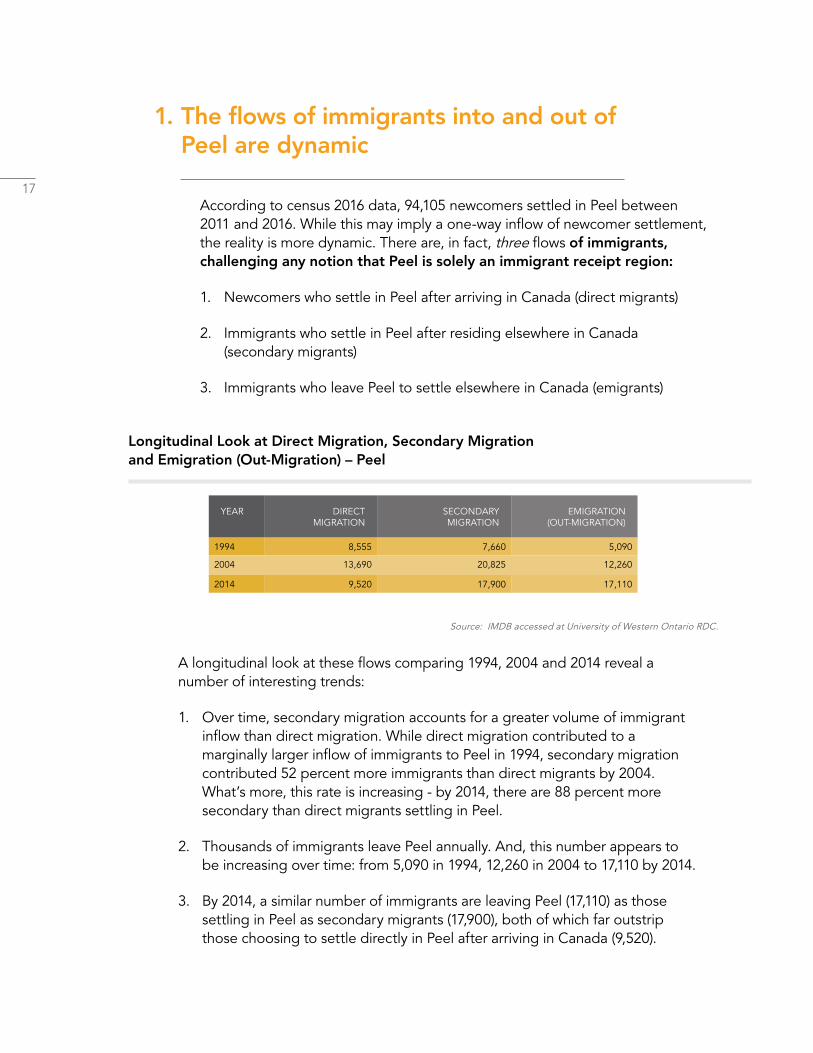
1. The flows of immigrants into and out of Peel are dynamic
According to census 2016 data, 94,105 newcomers settled in Peel between 2011 and 2016. While this may imply a one-way inflow of newcomer settlement, the reality is more dynamic. There are, in fact, three flows of immigrants, challenging any notion that Peel is solely an immigrant receipt region:
1. Newcomers who settle in Peel after arriving in Canada (direct migrants)
2. Immigrants who settle in Peel after residing elsewhere in Canada (secondary migrants)
3. Immigrants who leave Peel to settle elsewhere in Canada (emigrants)
Longitudinal Look at Direct Migration, Secondary Migration and Emigration (Out-Migration) – Peel
Source: IMDB accessed at University of Western Ontario RDC.
A longitudinal look at these flows comparing 1994, 2004 and 2014 reveal a number of interesting trends:
1. Over time, secondary migration accounts for a greater volume of immigrant inflow than direct migration. While direct migration contributed to a marginally larger inflow of immigrants to Peel in 1994, secondary migration contributed 52 percent more immigrants than direct migrants by 2004. What’s more, this rate is increasing - by 2014, there are 88 percent more secondary than direct migrants settling in Peel.
2. Thousands of immigrants leave Peel annually. And, this number appears to be increasing over time: from 5,090 in 1994, 12,260 in 2004 to 17,110 by 2014.
3. By 2014, a similar number of immigrants are leaving Peel (17,110) as those settling in Peel as secondary migrants (17,900), both of which far outstrip those choosing to settle directly in Peel after arriving in Canada (9,520).
YEAR DIRECT MIGRATION
SECONDARY MIGRATION
EMIGRATION (OUT-MIGRATION)
1994 8,555 7,660 5,090
2004 13,690 20,825 12,260
2014 9,520 17,900 17,110
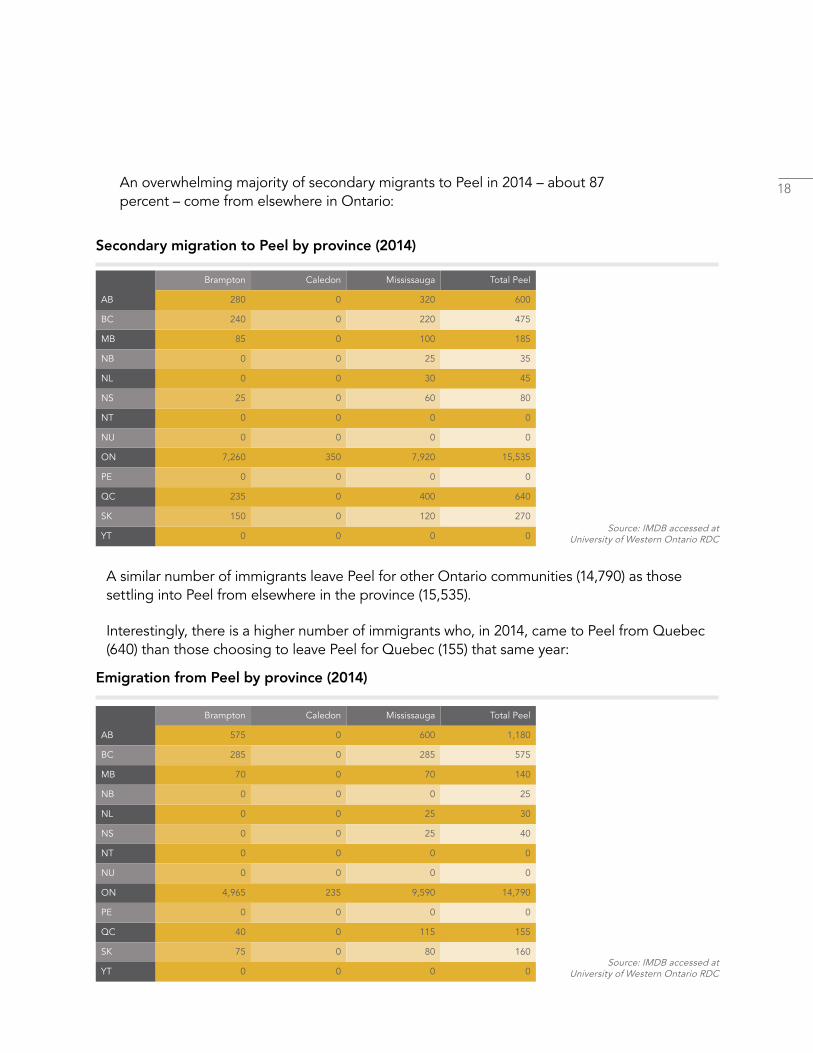
18An overwhelming majority of secondary migrants to Peel in 2014 – about 87 percent – come from elsewhere in Ontario:
Secondary migration to Peel by province (2014)
Source: IMDB accessed at University of Western Ontario RDC
Source: IMDB accessed at University of Western Ontario RDC
A similar number of immigrants leave Peel for other Ontario communities (14,790) as those settling into Peel from elsewhere in the province (15,535).
Interestingly, there is a higher number of immigrants who, in 2014, came to Peel from Quebec (640) than those choosing to leave Peel for Quebec (155) that same year:
Emigration from Peel by province (2014)
Brampton Caledon Mississauga Total Peel
AB 280 0 320 600
BC 240 0 220 475
MB 85 0 100 185
NB 0 0 25 35
NL 0 0 30 45
NS 25 0 60 80
NT 0 0 0 0
NU 0 0 0 0
ON 7,260 350 7,920 15,535
PE 0 0 0 0
QC 235 0 400 640
SK 150 0 120 270
YT 0 0 0 0
Brampton Caledon Mississauga Total Peel
AB 575 0 600 1,180
BC 285 0 285 575
MB 70 0 70 140
NB 0 0 0 25
NL 0 0 25 30
NS 0 0 25 40
NT 0 0 0 0
NU 0 0 0 0
ON 4,965 235 9,590 14,790
PE 0 0 0 0
QC 40 0 115 155
SK 75 0 80 160
YT 0 0 0 0
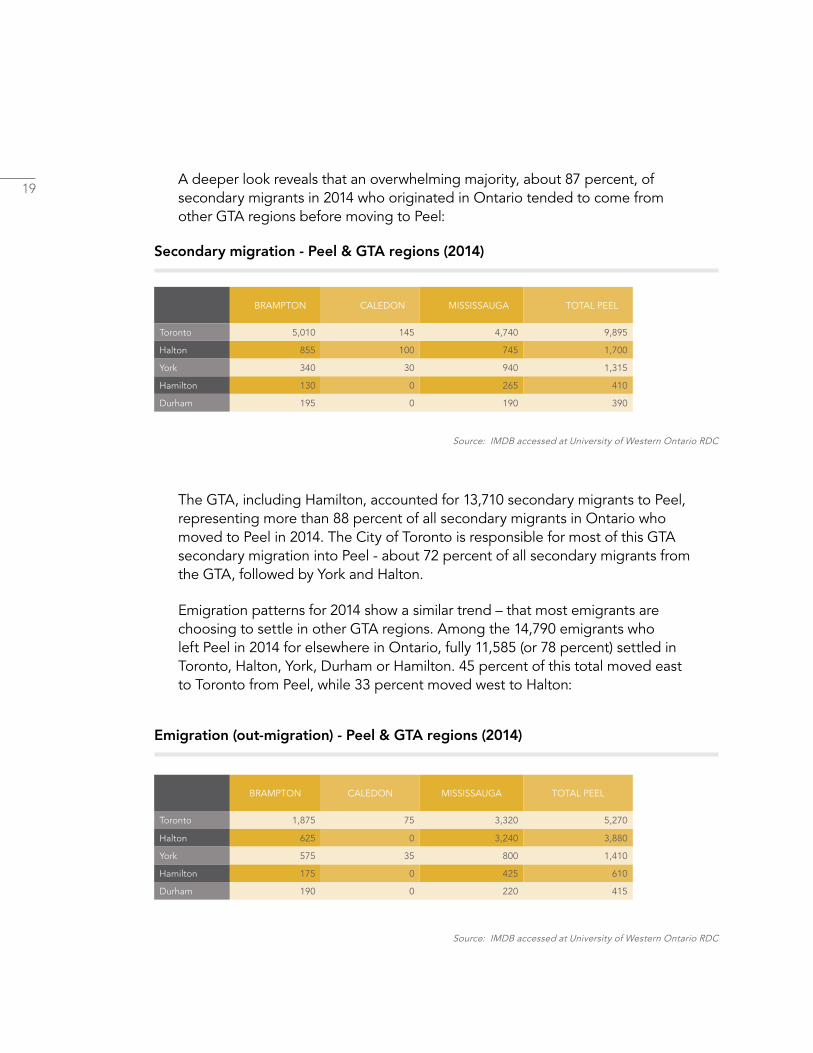
19A deeper look reveals that an overwhelming majority, about 87 percent, of secondary migrants in 2014 who originated in Ontario tended to come from other GTA regions before moving to Peel:
Secondary migration - Peel & GTA regions (2014)
Source: IMDB accessed at University of Western Ontario RDC
The GTA, including Hamilton, accounted for 13,710 secondary migrants to Peel, representing more than 88 percent of all secondary migrants in Ontario who moved to Peel in 2014. The City of Toronto is responsible for most of this GTA secondary migration into Peel - about 72 percent of all secondary migrants from the GTA, followed by York and Halton.
Emigration patterns for 2014 show a similar trend – that most emigrants are choosing to settle in other GTA regions. Among the 14,790 emigrants who left Peel in 2014 for elsewhere in Ontario, fully 11,585 (or 78 percent) settled in Toronto, Halton, York, Durham or Hamilton. 45 percent of this total moved east to Toronto from Peel, while 33 percent moved west to Halton:
Emigration (out-migration) - Peel & GTA regions (2014)
Source: IMDB accessed at University of Western Ontario RDC
BRAMPTON CALEDON MISSISSAUGA TOTAL PEEL
Toronto 1,875 75 3,320 5,270
Halton 625 0 3,240 3,880
York 575 35 800 1,410
Hamilton 175 0 425 610
Durham 190 0 220 415
BRAMPTON CALEDON MISSISSAUGA TOTAL PEEL
Toronto 5,010 145 4,740 9,895
Halton 855 100 745 1,700
York 340 30 940 1,315
Hamilton 130 0 265 410
Durham 195 0 190 390
20In 2014, the two-way transfer of immigrants across the GTA into and out of Peel translated into:
• A net increase of 4,625 immigrants from Toronto
• A net increase of 390 immigrants from York
• A net decrease of 2,565 immigrants to Halton
• A net decrease of 200 immigrants to Hamilton
• A marginal decrease of 25 immigrants to Durham
Notes
• The IMDB does not disaggregate the newcomer (who arrived within the past five years) component of secondary migration data. Secondary migration data tracks those who have a landing record and filed taxes in Canada outside of Peel before residing in Peel, but not the number of years they have been in Canada, nor the residency status they had when they first arrived in Canada.
• The study did not examine the reasons why direct and secondary migrants choose Peel, nor did it investigate the reasons why immigrants choose to leave Peel. This may inform future research opportunities.
21
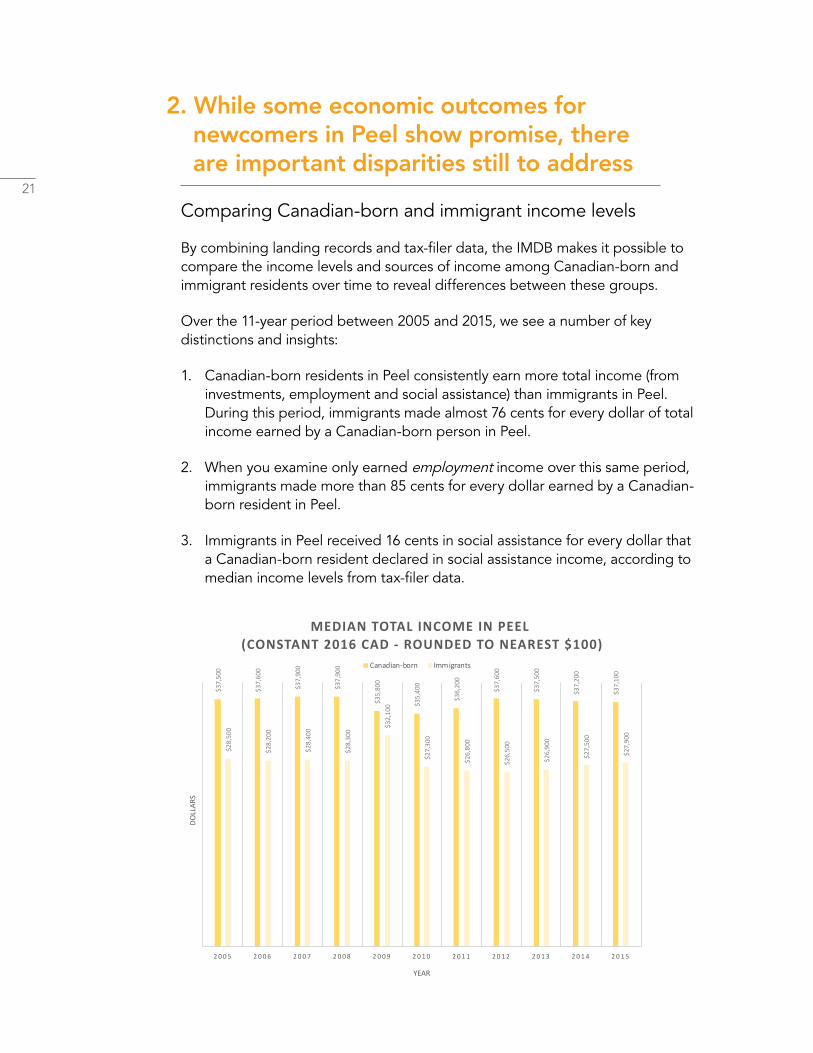
2. While some economic outcomes for newcomers in Peel show promise, there are important disparities still to address
Comparing Canadian-born and immigrant income levels
By combining landing records and tax-filer data, the IMDB makes it possible to compare the income levels and sources of income among Canadian-born and immigrant residents over time to reveal differences between these groups.
Over the 11-year period between 2005 and 2015, we see a number of key distinctions and insights:
1. Canadian-born residents in Peel consistently earn more total income (from investments, employment and social assistance) than immigrants in Peel. During this period, immigrants made almost 76 cents for every dollar of total income earned by a Canadian-born person in Peel.
2. When you examine only earned employment income over this same period, immigrants made more than 85 cents for every dollar earned by a Canadian-born resident in Peel.
3. Immigrants in Peel received 16 cents in social assistance for every dollar that a Canadian-born resident declared in social assistance income, according to median income levels from tax-filer data.
$37,
500
$37,
600
$37,
900
$37,
900
$35,
800
$35,
400
$36,
200
$37,
600
$37,
500
$37,
200
$37,
100
$28,
500
$28,
200
$28,
400
$28,
300
$32,
100
$27,
300
$26,
800
$26,
500
$26,
900
$27,
500
$27,
900
2 0 0 5 2 0 0 6 2 0 0 7 2 0 0 8 2 0 0 9 2 0 1 0 2 0 1 1 2 0 1 2 2 0 1 3 2 0 1 4 2 0 1 5
DOLL
ARS
YEAR
MEDIAN TOTAL INCOME IN PEEL(CONSTANT 2016 CAD - ROUNDED TO NEAREST $100)
Canadian-born Immigrants
22
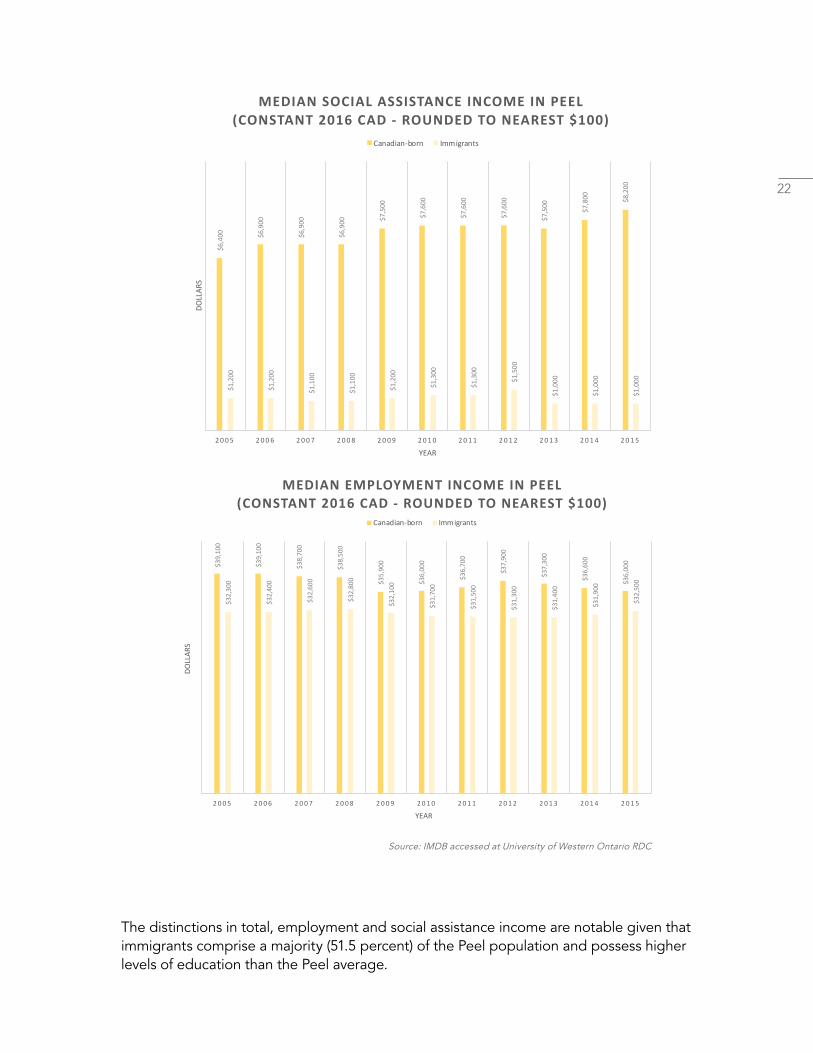
The distinctions in total, employment and social assistance income are notable given that immigrants comprise a majority (51.5 percent) of the Peel population and possess higher levels of education than the Peel average.
Source: IMDB accessed at University of Western Ontario RDC
$6,4
00
$6,9
00
$6,9
00
$6,9
00 $7
,500
$7,6
00
$7,6
00
$7,6
00
$7,5
00
$7,8
00
$8,2
00
$1,2
00
$1,2
00
$1,1
00
$1,1
00
$1,2
00
$1,3
00
$1,3
00
$1,5
00
$1,0
00
$1,0
00
$1,0
00
2 0 0 5 2 0 0 6 2 0 0 7 2 0 0 8 2 0 0 9 2 0 1 0 2 0 1 1 2 0 1 2 2 0 1 3 2 0 1 4 2 0 1 5
DOLL
ARS
YEAR
MEDIAN SOCIAL ASSISTANCE INCOME IN PEEL(CONSTANT 2016 CAD - ROUNDED TO NEAREST $100)
Canadian-born Immigrants
$39,
100
$39,
100
$38,
700
$38,
500
$35,
900
$36,
000
$36,
700
$37,
900
$37,
300
$36,
600
$36,
000
$32,
300
$32,
400
$32,
600
$32,
800
$32,
100
$31,
700
$31,
500
$31,
300
$31,
400
$31,
900
$32,
500
2 0 0 5 2 0 0 6 2 0 0 7 2 0 0 8 2 0 0 9 2 0 1 0 2 0 1 1 2 0 1 2 2 0 1 3 2 0 1 4 2 0 1 5
DOLL
ARS
YEAR
MEDIAN EMPLOYMENT INCOME IN PEEL(CONSTANT 2016 CAD - ROUNDED TO NEAREST $100)
Canadian-born Immigrants
23 Income parity
The process of social and economic integration for a newcomer takes time as one acclimates to their new community. One can expect a newcomer’s income to increase gradually as they integrate into our local society and workforce.
Median income data is useful in determining how long it takes a newcomer in Peel to achieve parity with other immigrants or Canadian-born residents as measures of economic integration.
The IMDB shows that newcomers to Peel reach median income parity at different rates depending on education, admission category and lanugage ability:
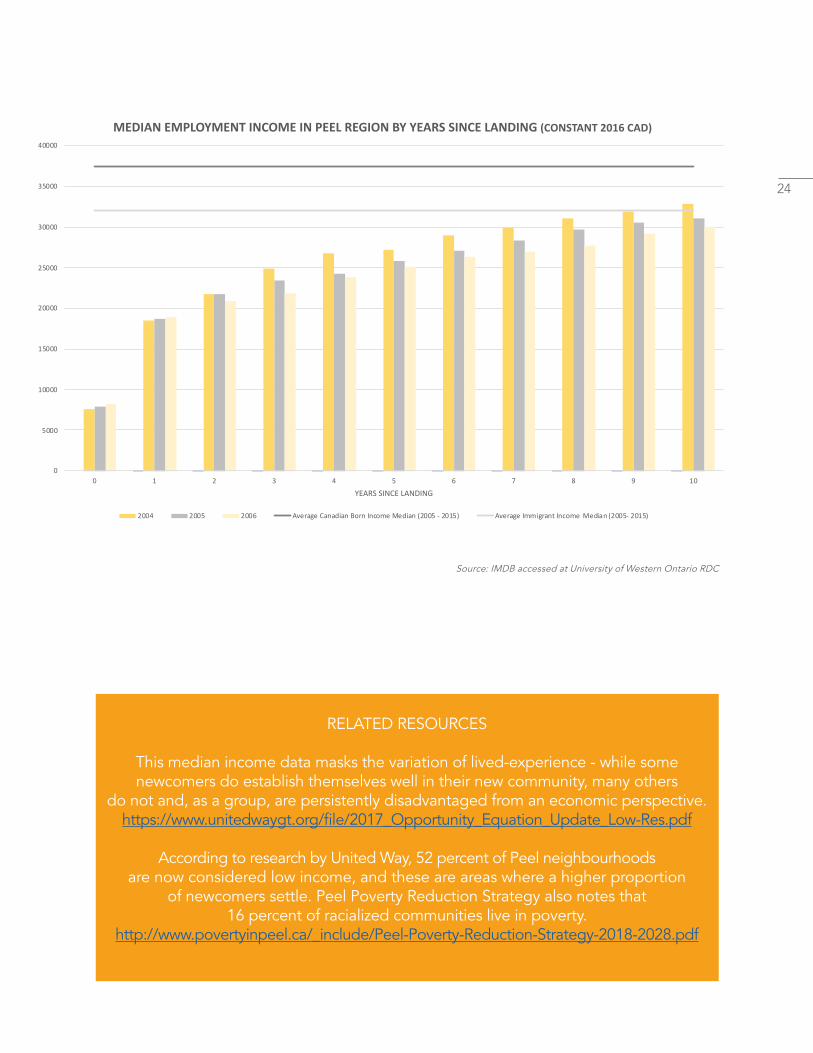
1. The average employment income median from 2005 to 2015 for Canadian-born residents in Peel is $37,436 and $32,045 for immigrants. If we use these as benchmarks and compare these against employment income medians for newcomers by year of landing, we see that:
• Newcomers who arrived to Canada in 2004, 2005 and 2006 gradually earn more employment income the longer they are in Canada.
• Newcomers who arrived to Canada in 2004 and settled in Peel achieve income parity with other immigrants ($32,045) by their tenth year in Canada (between years 9 and 10). However, those arriving in 2005 and 2006 do not achieve similar parity during this same amount of time, suggesting that it may take longer for relatively more recent newcomers to earn similar levels of income.
• Employment income medians for newcomers arriving in 2004, 2005 or 2006 do not reach parity with Canadian-born residents in Peel within 10-11 years.
24
Source: IMDB accessed at University of Western Ontario RDC
RELATED RESOURCES
This median income data masks the variation of lived-experience - while somenewcomers do establish themselves well in their new community, many others
do not and, as a group, are persistently disadvantaged from an economic perspective.https://www.unitedwaygt.org/file/2017_Opportunity_Equation_Update_Low-Res.pdf
According to research by United Way, 52 percent of Peel neighbourhoodsare now considered low income, and these are areas where a higher proportion
of newcomers settle. Peel Poverty Reduction Strategy also notes that 16 percent of racialized communities live in poverty.
http://www.povertyinpeel.ca/_include/Peel-Poverty-Reduction-Strategy-2018-2028.pdf
0
5000
10000
15000
20000
25000
30000
35000
40000
0 1 2 3 4 5 6 7 8 9 10
YEARS SINCE LANDING
MEDIAN EMPLOYMENT INCOME IN PEEL REGION BY YEARS SINCE LANDING (CONSTANT 2016 CAD)
2004 2005 2006 Average Canadian Born Income Median (2005 - 2015) Average Immigrant Income Median (2005- 2015)
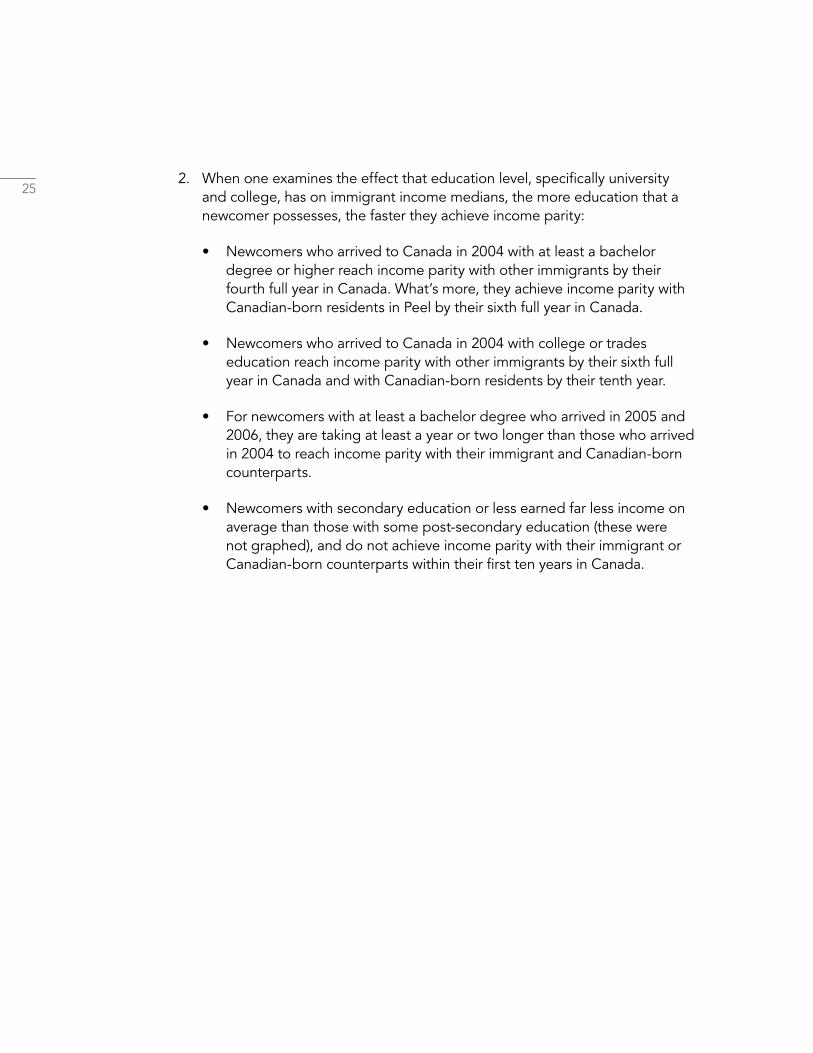
252. When one examines the effect that education level, specifically university
and college, has on immigrant income medians, the more education that a newcomer possesses, the faster they achieve income parity:
• Newcomers who arrived to Canada in 2004 with at least a bachelor degree or higher reach income parity with other immigrants by their fourth full year in Canada. What’s more, they achieve income parity with Canadian-born residents in Peel by their sixth full year in Canada.
• Newcomers who arrived to Canada in 2004 with college or trades education reach income parity with other immigrants by their sixth full year in Canada and with Canadian-born residents by their tenth year.
• For newcomers with at least a bachelor degree who arrived in 2005 and 2006, they are taking at least a year or two longer than those who arrived in 2004 to reach income parity with their immigrant and Canadian-born counterparts.
• Newcomers with secondary education or less earned far less income on average than those with some post-secondary education (these were not graphed), and do not achieve income parity with their immigrant or Canadian-born counterparts within their first ten years in Canada.
26
0
5000
10000
15000
20000
25000
30000
35000
40000
45000
50000
0 1 2 3 4 5 6 7 8 9 10
YEARS SINCE LANDING
MEDIAN EMPLOYMENT INCOME IN PEEL BY EDUCATION AND YEARS SINCE LANDING -BACHELOR DEGREE OR HIGHER (CONSTANT 2016 CAD)
2004 2005 2006 Canadian Born Median Immigrant Median
0
5000
10000
15000
20000
25000
30000
35000
40000
0 1 2 3 4 5 6 7 8 9 10
YEARS SINCE LANDING
MEDIAN EMPLOYMENT INCOME IN PEEL BY EDUCATION AND YEARS SINCE LANDING -COLLEGE/TRADES (CONSTANT 2016 CAD)
2004 2005 2006 Average Canadian Born Income Median (2005 - 2015) Average Immigrant Income Median (2005 - 2015)
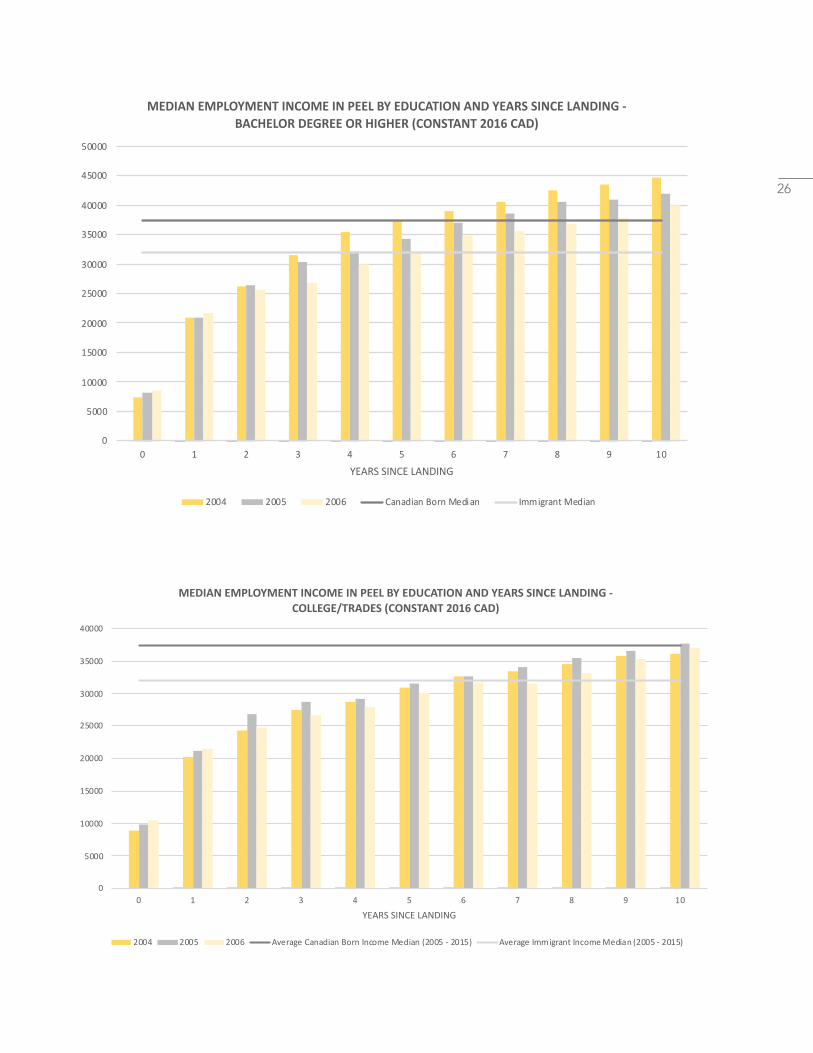
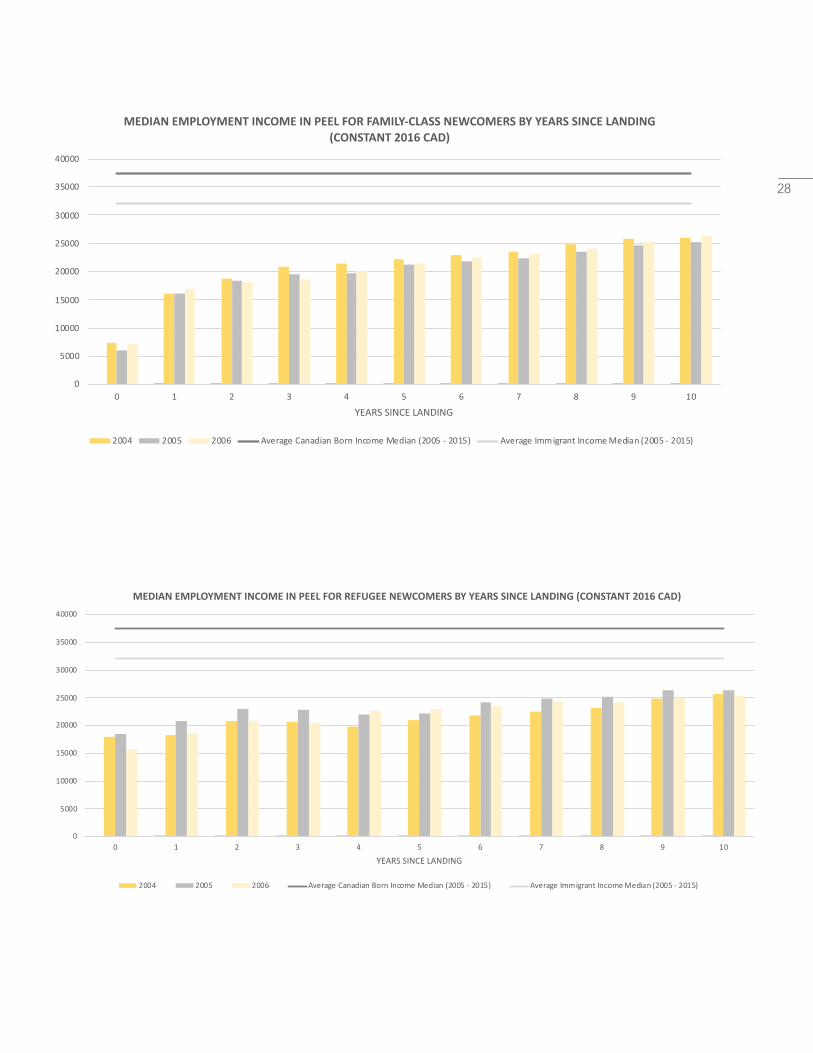
273. When admission category - skilled-workers, family-class or refugees - is
examined for its effect on immigrant income medians, skilled workers achieve income parity faster than other categories:
• Skilled workers who arrived to Canada in 2004 reach income parity with other immigrants by their fourth full year in Canada and with Canadian-born residents in Peel by their eighth full year in the country.
• Skilled workers who arrived in 2005 and 2006 take relatively longer – at least two years more – than those who arrived in 2004 to reach income parity with other immigrants or Canadian-born residents in Peel.
• Income medians for family-class and refugee newcomers are far lower than those of skilled workers. Neither family-class nor refugee newcomers who arrived in 2004, 2005 or 2006 reach income parity with other immigrants or Canadian-born residents within their first ten years in Canada.
0
5000
10000
15000
20000
25000
30000
35000
40000
45000
0 1 2 3 4 5 6 7 8 9 10
YEARS SINCE LANDING
MEDIAN EMPLOYMENT INCOME IN PEEL FOR SKILLED WORKER CLASS BY YEARS SINCE LANDING (CONSTANT 2016 CAD)
2004 2005 2006 Average Canadian Born Income Median (2005 - 2015) Average Immigrant Income Median (2005 - 2015)
28
0
5000
10000
15000
20000
25000
30000
35000
40000
0 1 2 3 4 5 6 7 8 9 10
YEARS SINCE LANDING
MEDIAN EMPLOYMENT INCOME IN PEEL FOR FAMILY-CLASS NEWCOMERS BY YEARS SINCE LANDING (CONSTANT 2016 CAD)
2004 2005 2006 Average Canadian Born Income Median (2005 - 2015) Average Immigrant Income Median (2005 - 2015)
0
5000
10000
15000
20000
25000
30000
35000
40000
0 1 2 3 4 5 6 7 8 9 10
YEARS SINCE LANDING
MEDIAN EMPLOYMENT INCOME IN PEEL FOR REFUGEE NEWCOMERS BY YEARS SINCE LANDING (CONSTANT 2016 CAD)
2004 2005 2006 Average Canadian Born Income Median (2005 - 2015) Average Immigrant Income Median (2005 - 2015)
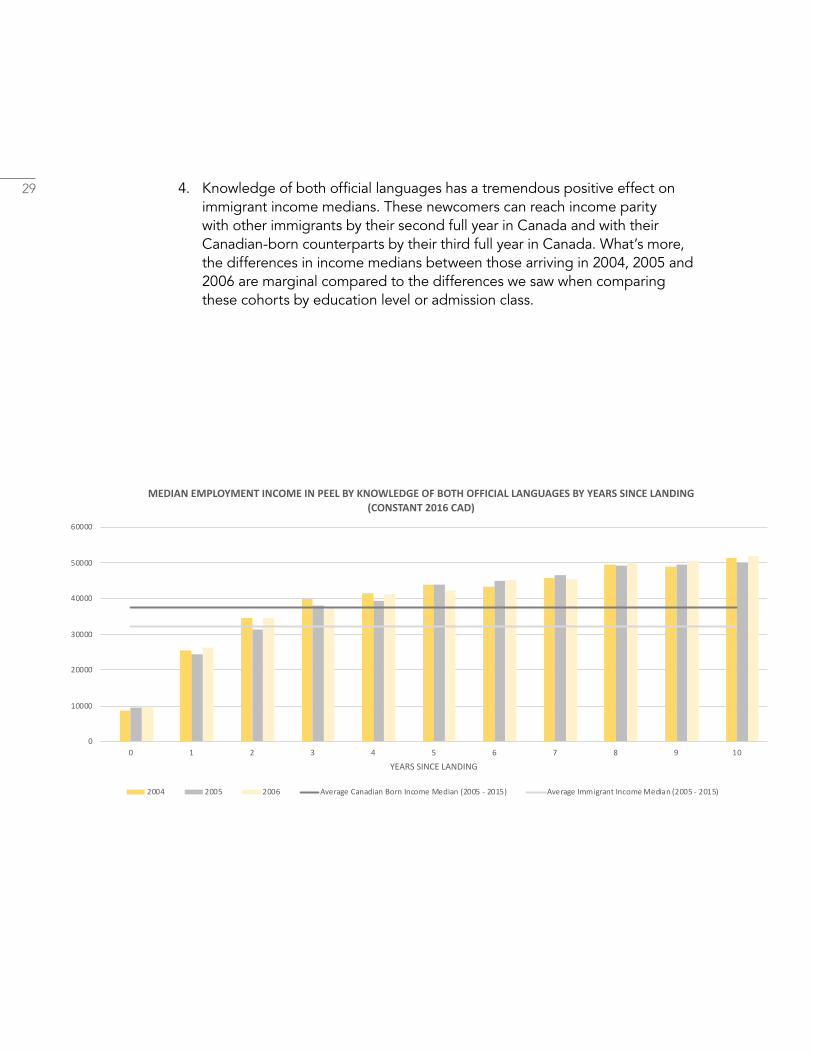
29 4. Knowledge of both official languages has a tremendous positive effect on immigrant income medians. These newcomers can reach income parity with other immigrants by their second full year in Canada and with their Canadian-born counterparts by their third full year in Canada. What’s more, the differences in income medians between those arriving in 2004, 2005 and 2006 are marginal compared to the differences we saw when comparing these cohorts by education level or admission class.
0
10000
20000
30000
40000
50000
60000
0 1 2 3 4 5 6 7 8 9 10
YEARS SINCE LANDING
MEDIAN EMPLOYMENT INCOME IN PEEL BY KNOWLEDGE OF BOTH OFFICIAL LANGUAGES BY YEARS SINCE LANDING (CONSTANT 2016 CAD)
2004 2005 2006 Average Canadian Born Income Median (2005 - 2015) Average Immigrant Income Median (2005 - 2015)
30
Perc
enta
ge
of T
otal
Cen
sus
Trac
ts in
the
Reg
ion
0%
30%
60%
10%
40%
70%
90%
20%
50%
80%
100%
1970 1980 1990 2000 2010 2015
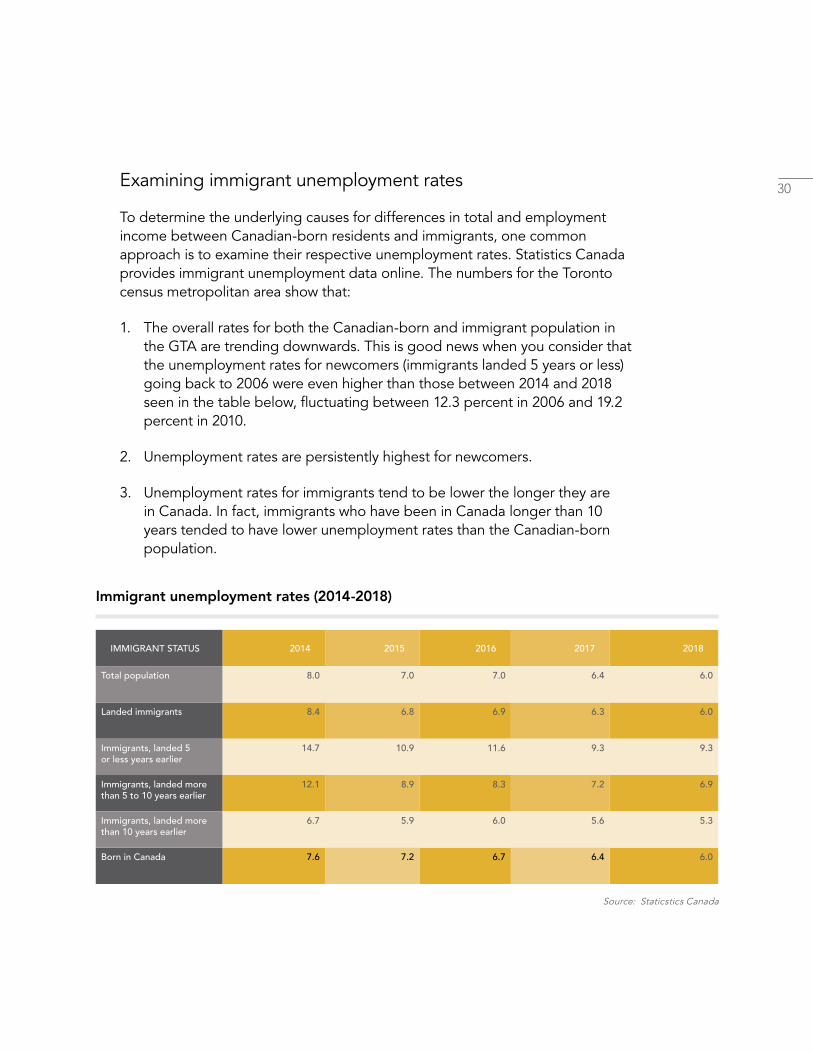
Examining immigrant unemployment rates
To determine the underlying causes for differences in total and employment income between Canadian-born residents and immigrants, one common approach is to examine their respective unemployment rates. Statistics Canada provides immigrant unemployment data online. The numbers for the Toronto census metropolitan area show that:
1. The overall rates for both the Canadian-born and immigrant population in the GTA are trending downwards. This is good news when you consider that the unemployment rates for newcomers (immigrants landed 5 years or less) going back to 2006 were even higher than those between 2014 and 2018 seen in the table below, fluctuating between 12.3 percent in 2006 and 19.2 percent in 2010.
2. Unemployment rates are persistently highest for newcomers.
3. Unemployment rates for immigrants tend to be lower the longer they are in Canada. In fact, immigrants who have been in Canada longer than 10 years tended to have lower unemployment rates than the Canadian-born population.
Source: Staticstics Canada
Immigrant unemployment rates (2014-2018)
IMMIGRANT STATUS 2014 2015 2016 2017 2018
Total population 8.0 7.0 7.0 6.4 6.0
Landed immigrants 8.4 6.8 6.9 6.3 6.0
Immigrants, landed 5or less years earlier
14.7 10.9 11.6 9.3 9.3
Immigrants, landed more than 5 to 10 years earlier
12.1 8.9 8.3 7.2 6.9
Immigrants, landed more than 10 years earlier
6.7 5.9 6.0 5.6 5.3
Born in Canada 7.6 7.2 6.7 6.4 6.0
31
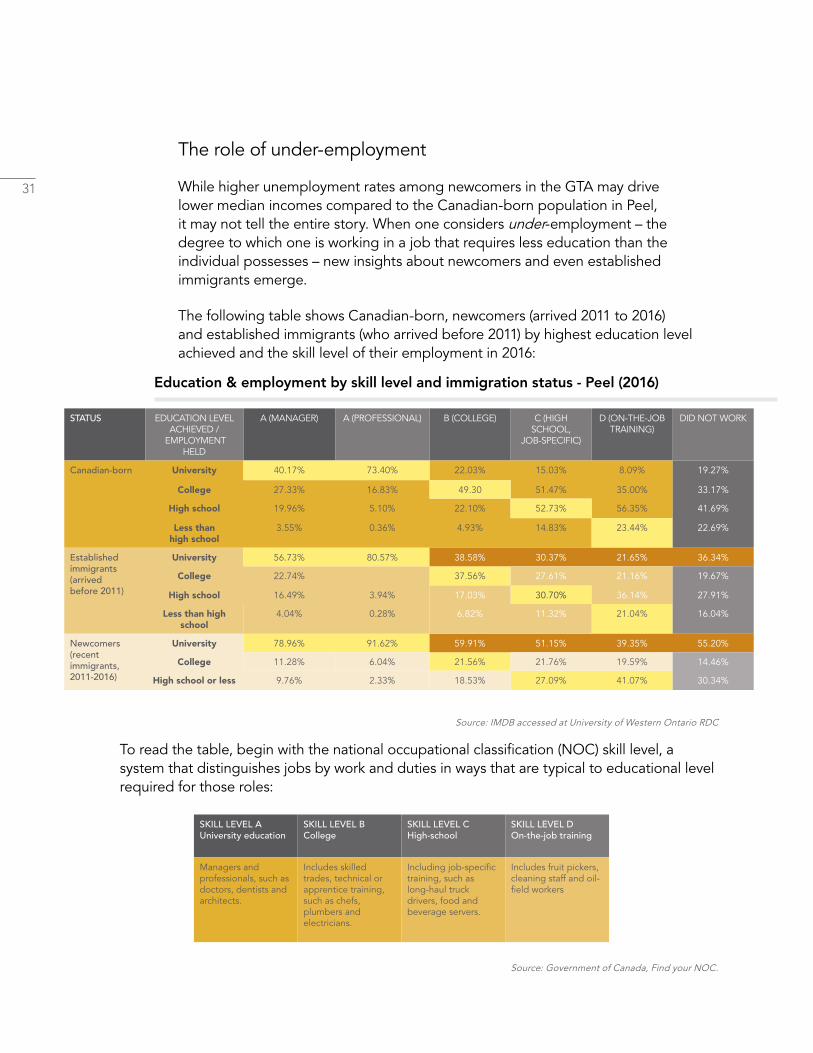
The role of under-employment
While higher unemployment rates among newcomers in the GTA may drive lower median incomes compared to the Canadian-born population in Peel, it may not tell the entire story. When one considers under-employment – the degree to which one is working in a job that requires less education than the individual possesses – new insights about newcomers and even established immigrants emerge.
The following table shows Canadian-born, newcomers (arrived 2011 to 2016) and established immigrants (who arrived before 2011) by highest education level achieved and the skill level of their employment in 2016:
Education & employment by skill level and immigration status - Peel (2016)
To read the table, begin with the national occupational classification (NOC) skill level, a system that distinguishes jobs by work and duties in ways that are typical to educational level required for those roles:
STATUS EDUCATION LEVEL ACHIEVED /
EMPLOYMENT HELD
A (MANAGER) A (PROFESSIONAL) B (COLLEGE) C (HIGH SCHOOL,
JOB-SPECIFIC)
D (ON-THE-JOB TRAINING)
DID NOT WORK
Canadian-born University 40.17% 73.40% 22.03% 15.03% 8.09% 19.27%
College 27.33% 16.83% 49.30 51.47% 35.00% 33.17%
High school 19.96% 5.10% 22.10% 52.73% 56.35% 41.69%
Less than high school
3.55% 0.36% 4.93% 14.83% 23.44% 22.69%
Established immigrants (arrived before 2011)
University 56.73% 80.57% 38.58% 30.37% 21.65% 36.34%
College 22.74% 15.21% 37.56% 27.61% 21.16% 19.67%
High school 16.49% 3.94% 17.03% 30.70% 36.14% 27.91%
Less than high school
4.04% 0.28% 6.82% 11.32% 21.04% 16.04%
Newcomers (recentimmigrants, 2011-2016)
University 78.96% 91.62% 59.91% 51.15% 39.35% 55.20%
College 11.28% 6.04% 21.56% 21.76% 19.59% 14.46%
High school or less 9.76% 2.33% 18.53% 27.09% 41.07% 30.34%
SKILL LEVEL AUniversity education
SKILL LEVEL BCollege
SKILL LEVEL CHigh-school
SKILL LEVEL D On-the-job training
Managers and professionals, such as doctors, dentists and architects.
Includes skilled trades, technical or apprentice training, such as chefs, plumbers and electricians.
Including job-specific training, such as long-haul truck drivers, food and beverage servers.
Includes fruit pickers, cleaning staff and oil-field workers
Source: IMDB accessed at University of Western Ontario RDC
Source: Government of Canada, Find your NOC.
32This indicates the skill level of the job that an individual holds, which suggests the education level required for the role. Then, match the skill level with an immigration status, whether Canadian-born, established immigrant or newcomer. Lastly, search for the highest education level achieved.
If the workforce was employed in jobs commensurate with the highest education level achieved, one would expect the lightly-coloured cells to feature the highest percentages (for example, college-educated individuals are employed in roles requiring college education). Throughout certain cells in the table, this is not the case. The darker-coloured cells indicate areas of concern regarding newcomers and established immigrants:
• There are high percentages of university-educated newcomers working in roles requiring less than university education. For example, almost 60 percent of those working in roles requiring only college education say they are newcomers with a university education. 51 percent in jobs requiring only high school say they, too, are newcomers with university-level education. Perhaps most concerning, 39 percent of those working in roles requiring on-the-job training say they are newcomers with university-level education.
• This under-employment trend carries over to established immigrants, too. Many established immigrants with university education are also working in roles that require less than university-level education; however, not to the same degree as newcomers.
• It is encouraging that about 79 percent of newcomers working as managers and almost 92 percent of newcomers working as professionals (skill level A) are employed in roles requiring university-level education. This indicates that these individuals are able to connect to employment commensurate with their education.
The persistent under-employment of newcomers, similarly to disproportionate rates of unemployment contributes to fewer opportunities to earn incomes commensurate with either their education or at levels comparable to Canadian-born residents in Peel, resulting in lower median incomes.
Notes
We have chosen to use immigrant income data from 2004, 2005 and 2006 since these provide a minimum of ten years of income tracking, a timeframe within which income parity may be achieved.
• Tracking immigrant income before 2004 might be useful in determining whether it is becoming more difficult for newcomers to Peel to achieve income parity. This may inform future research opportunities.
33
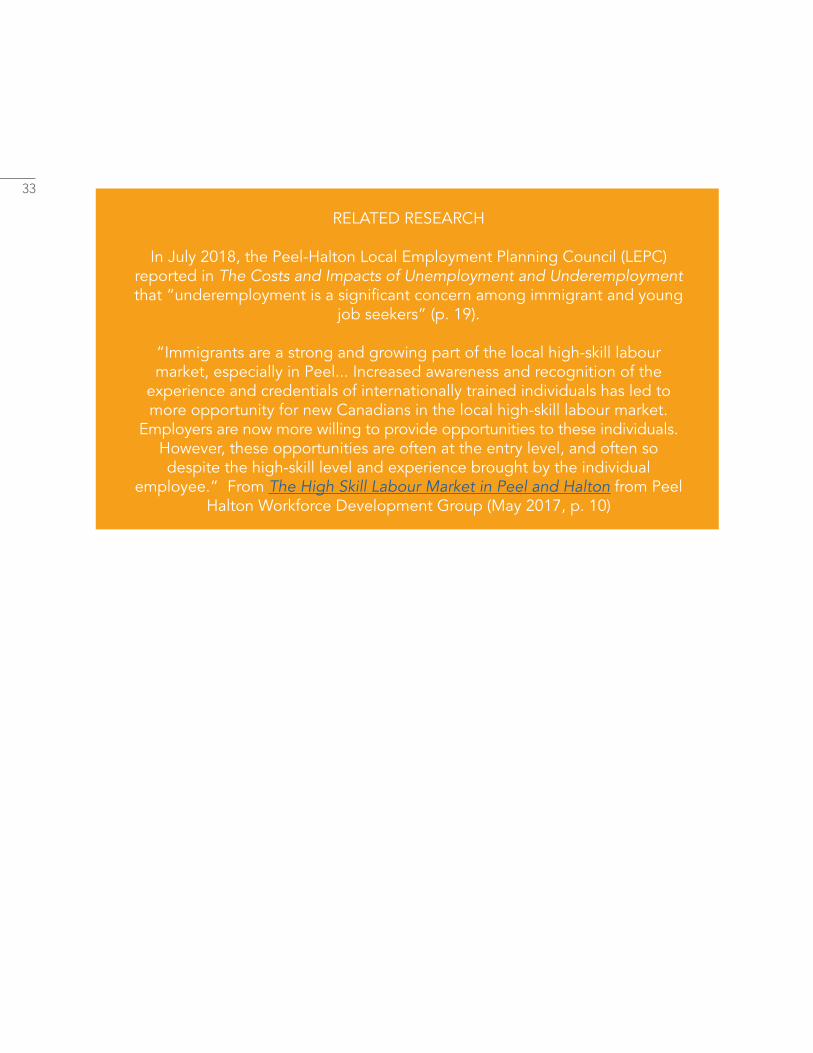
RELATED RESEARCH
In July 2018, the Peel-Halton Local Employment Planning Council (LEPC) reported in The Costs and Impacts of Unemployment and Underemployment that “underemployment is a significant concern among immigrant and young
job seekers” (p. 19).
“Immigrants are a strong and growing part of the local high-skill labour market, especially in Peel... Increased awareness and recognition of the
experience and credentials of internationally trained individuals has led to more opportunity for new Canadians in the local high-skill labour market.
Employers are now more willing to provide opportunities to these individuals. However, these opportunities are often at the entry level, and often so despite the high-skill level and experience brought by the individual
employee.” From The High Skill Labour Market in Peel and Halton from Peel Halton Workforce Development Group (May 2017, p. 10)
3. Newcomers require more effective formal and informal settlement supports
Formal settlement services need to evolve to better address a wider spectrum of newcomer priorities
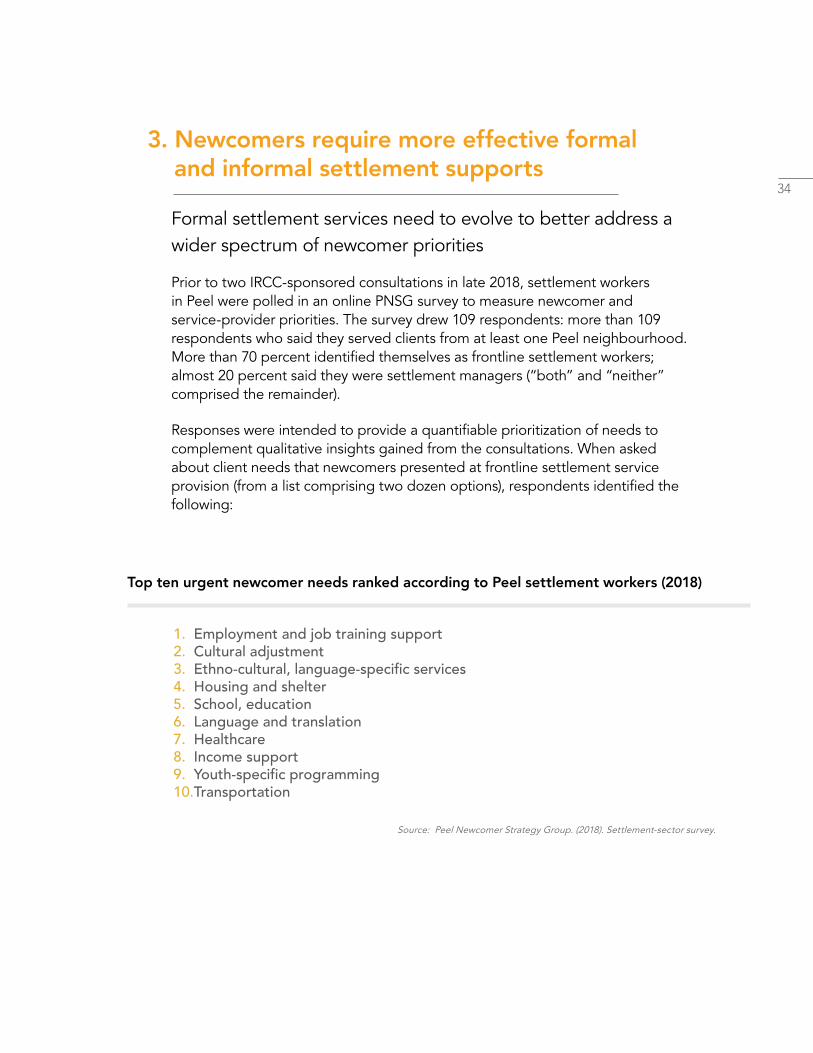
Prior to two IRCC-sponsored consultations in late 2018, settlement workers in Peel were polled in an online PNSG survey to measure newcomer and service-provider priorities. The survey drew 109 respondents: more than 109 respondents who said they served clients from at least one Peel neighbourhood. More than 70 percent identified themselves as frontline settlement workers; almost 20 percent said they were settlement managers (“both” and “neither” comprised the remainder).
Responses were intended to provide a quantifiable prioritization of needs to complement qualitative insights gained from the consultations. When asked about client needs that newcomers presented at frontline settlement service provision (from a list comprising two dozen options), respondents identified the following:
Top ten urgent newcomer needs ranked according to Peel settlement workers (2018)
Source: Peel Newcomer Strategy Group. (2018). Settlement-sector survey.
1. Employment and job training support2. Cultural adjustment3. Ethno-cultural, language-specific services4. Housing and shelter5. School, education6. Language and translation7. Healthcare8. Income support9. Youth-specific programming10.Transportation
34
35
Rank-ordered lists of priority newcomer needs have long been established in academic literature (e.g. Esses et al., 2010). PNSG’s online survey provided an opportunity to determine if there was anything unique about newcomers settling in Peel according to their settlement service providers. The list resulting from the survey is largely consistent with what we know already from existing research.
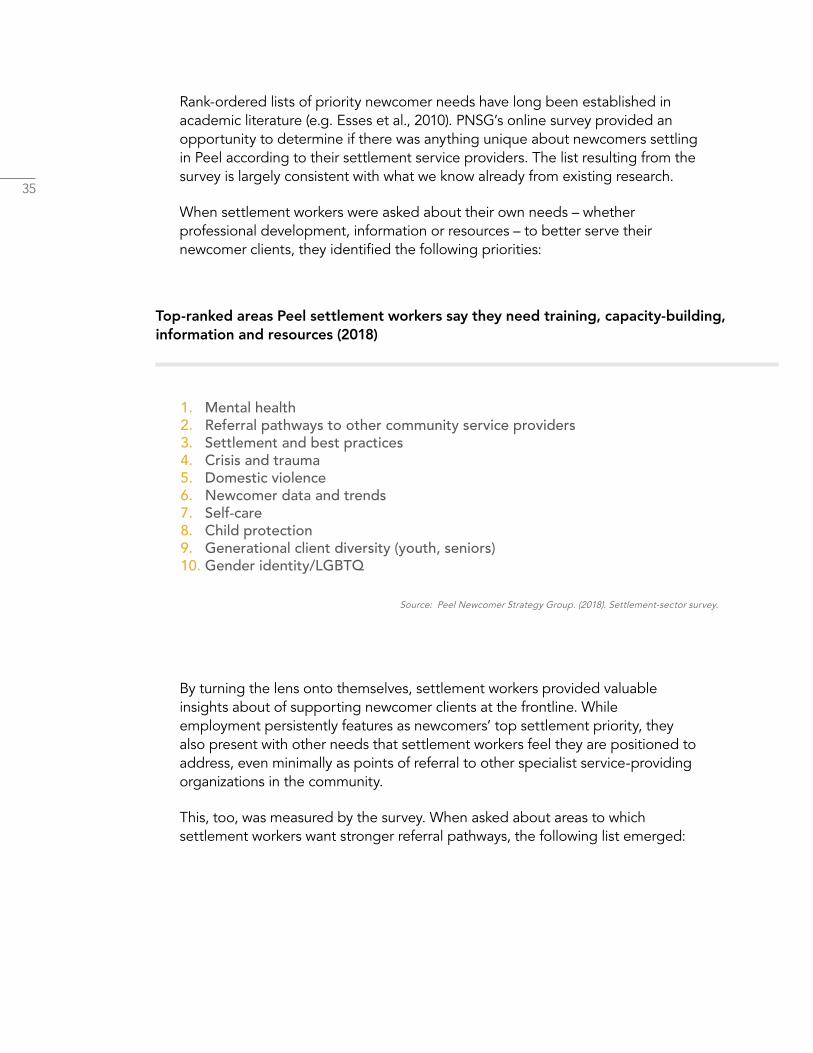
When settlement workers were asked about their own needs – whether professional development, information or resources – to better serve their newcomer clients, they identified the following priorities:
Top-ranked areas Peel settlement workers say they need training, capacity-building, information and resources (2018)
Source: Peel Newcomer Strategy Group. (2018). Settlement-sector survey.
By turning the lens onto themselves, settlement workers provided valuable insights about of supporting newcomer clients at the frontline. While employment persistently features as newcomers’ top settlement priority, they also present with other needs that settlement workers feel they are positioned to address, even minimally as points of referral to other specialist service-providing organizations in the community.
This, too, was measured by the survey. When asked about areas to which settlement workers want stronger referral pathways, the following list emerged:
1. Mental health2. Referral pathways to other community service providers3. Settlement and best practices4. Crisis and trauma5. Domestic violence6. Newcomer data and trends7. Self-care8. Child protection9. Generational client diversity (youth, seniors)10. Gender identity/LGBTQ
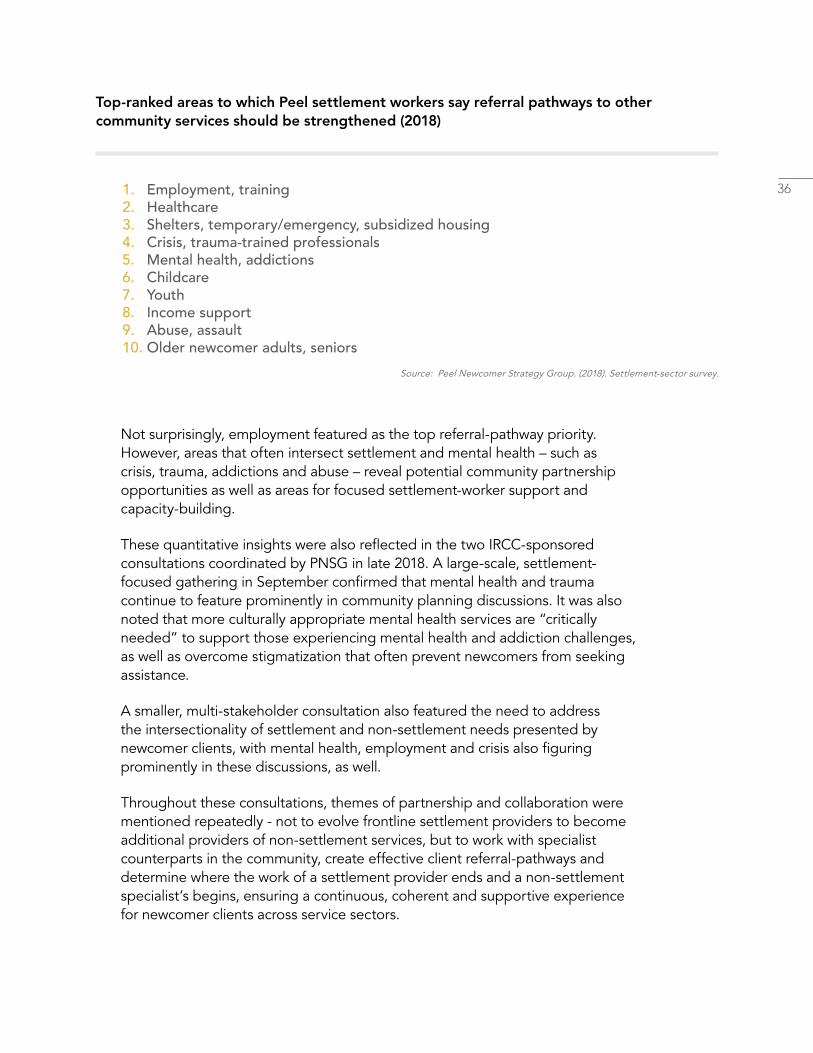
Top-ranked areas to which Peel settlement workers say referral pathways to other community services should be strengthened (2018)
Source: Peel Newcomer Strategy Group. (2018). Settlement-sector survey.
Not surprisingly, employment featured as the top referral-pathway priority. However, areas that often intersect settlement and mental health – such as crisis, trauma, addictions and abuse – reveal potential community partnership opportunities as well as areas for focused settlement-worker support and capacity-building.
These quantitative insights were also reflected in the two IRCC-sponsored consultations coordinated by PNSG in late 2018. A large-scale, settlement-focused gathering in September confirmed that mental health and trauma continue to feature prominently in community planning discussions. It was also noted that more culturally appropriate mental health services are “critically needed” to support those experiencing mental health and addiction challenges, as well as overcome stigmatization that often prevent newcomers from seeking assistance.
A smaller, multi-stakeholder consultation also featured the need to address the intersectionality of settlement and non-settlement needs presented by newcomer clients, with mental health, employment and crisis also figuring prominently in these discussions, as well.
Throughout these consultations, themes of partnership and collaboration were mentioned repeatedly - not to evolve frontline settlement providers to become additional providers of non-settlement services, but to work with specialist counterparts in the community, create effective client referral-pathways and determine where the work of a settlement provider ends and a non-settlement specialist’s begins, ensuring a continuous, coherent and supportive experience for newcomer clients across service sectors.
1. Employment, training2. Healthcare3. Shelters, temporary/emergency, subsidized housing4. Crisis, trauma-trained professionals5. Mental health, addictions6. Childcare7. Youth8. Income support9. Abuse, assault10. Older newcomer adults, seniors
36

37
IRCC Planning Day – September 14, 2018 – consultation findings
1. A more holistic approach to supporting newcomers’ employment needs by engaging multiple stakeholder groups and offering specialized employment-related training to specific newcomer segments.
2. More culturally appropriate mental health supports for those experiencing mental health and addiction challenges while reducing stigma attached to these issues.
3. System-level service navigation and coordination continue to be concerns as service providers are not fully aware of programs to which to refer clients.
4. Building the capacity and knowledge of settlement service providers through professional development, training and collaborative connections to enhance frontline settlement services.
More than 110 participants attended the settlement-focused IRCC Planning Day consultation at the Living Arts Centre, with representation from 45 organizations, including IRCC-funded agencies
across Peel and Halton, funders, education, workforce development, healthcare, as well as local Francophone and diversity stakeholders
38Service providers can benefit from increased support to facilitate cross-sector partnerships, service navigation and client referrals, as well as the ability to measure impact
Related, but separate, to this was the acknowledgment of limited capacity among settlement-sector workers to establish cross-sector partnerships and client referral-pathways. Not only did settlement professionals express that they had little experience and capacity to establish such partnerships, they acknowledged that learning, development, time and support from funders are required to achieve this. Stakeholders also expressed similar thoughts around funder expectations to measure impact, as well as the work of counterparts in other GTA regions that could serve as potential partnership opportunities or models.
Peel stakeholders saw the role of funders as identifying:
• Cross-sector partnership best practices, case studies and tools for Peel stakeholders to incorporate into their own partnership development
• Impact measurement methodologies valued by funders
• Non-settlement sectors that they (funders) felt were cross-sector partnership priority areas
• Partnership expectations and measures of success

39
IRCC Consultation – October 11, 2018 – consultation findings
1. More support to cultivate cross-sector partnerships - Stakeholders expressed that they would benefit from greater funder clarity on priority cross-sector collaborations to explore, access to best-practice models and the development of tools that guide partnership development.
2. More support to measure impact - Similarly, stakeholders shared that they have limited research and evaluation capacity and required support with funder-endorsed measurement frameworks and methodologies.
3. Stakeholders cited the need to design and offer more programs aimed at specific priority segments of the newcomer population, such as seniors and international students, among others, citing limited funding support and eligibility criteria.
4. Greater cultivation and embedding of the newcomer voice in service and program design has the potential to improve settlement planning.
Consultation participants included all levels of government, emerging settlement providers, education, children’s protection, settlement and service navigation stakeholders, as well as
newcomers themselves, who were featured in a lived-experience panel.
While a majority of newcomers rely on informal supports to facilitate their integration into the community, many newcomers recommend the assistance of formal, government-sponsored settlement services
According to IRCC (2017), 39 percent of adult newcomers who arrived in 2015 used at least one government-funded, settlement service by April 2017 (p. 3). This means that a majority of newcomers, nationally, are not supported by formal services that can enhance their settlement and integration.
PNSG commissioned Regional Diversity Roundtable (RDR) in 2018 to study how newcomers not accessing formal settlement services are integrating into Peel. Presumably, these newcomers are leveraging informal settlement supports, and the study identified the role that ethnic and religious institutions, cultural groups, as well as friends and family networks play in helping newcomers learn about local systems and the settlement process. While little literature exists in this respect, RDR examined the role of ethnic, online and social media in providing information to Peel newcomers and conducted an online survey and focus groups.
RDR found that:
• 80 percent agree that the majority of newcomers do not attend formal settlement services
• 53 percent believe that formal service organizations are not fully meeting a newcomer’s settlement-related needs because providers are “not informed and skilled sufficiently to understand [newcomers’] employment needs”
• Over 55 percent are familiar with newcomers accessing settlement supports in informal ways in the community
• Over 62 percent feel that newcomers are integrating faster today than in the past thanks to self-seeking abilities and social media support
• Many cited leveraging family and friend networks to gain employment; however, this employment is largely not aligned with their intended occupation
40
41 Despite these views, a majority of the study’s focus group participants said that they would recommend formal settlement services to newcomers “as some assistance can be received” and “because some help is better than no help” (p. 28).
“Overwhelmingly, participants have stated that successful settlement to them is concurrent with holding meaningful employment in their field of expertise”
Regional Diversity Roundtable, 2018
The study recommended that collaborations and partnerships be established between formal and informal settlement providers, supported by forums to share best practices and facilitate referrals between the two systems, as well greater awareness-building of the informal settlement landscape among policy-makers, funders and service providers.
Conclusions and Recommendations
Immigration is a defining feature of Peel, and it runs deeply in the region’s DNA. As Canadian communities continue to welcome large and increasing numbers of newcomers, many will look to Peel to leverage its experience and example integrating immigrants socially and economically.
What’s clear is that newcomers are integral to Peel’s – and the GTA’s – wellbeing and prosperity. Yet, while newcomers are working hard to build strong community roots and find appropriate employment, they also experience persistent challenges catching up to their Canadian-born and established immigrant neighbours despite high levels of education and skills. What’s more, this may be getting harder to overcome at a time when Peel expects to settle more newcomers than before.
Our research points to three crucial ingredients for effective settlement and integration of Peel newcomers:
A commitment to evidence-based policy and program design
• Service-providing organizations acknowledge that while they are doing the best they can to serve newcomer clients, they also recognize that they need support in specific areas to be more effective.
• A greater focus on newcomers’ employment needs, client referral-pathways to employment specialists and removing barriers to employment are required to accelerate newcomers’ economic integration – the key area underpinning successful immigrant integration overall.
• An increased emphasis on evidence can help focus service providers on effective partnerships and impact measurement strategies that matter. This can be achieved by working with funders more closely to identify cross-sector partnership priorities, clarify funder expectations, promote relevant case studies and best practices, as well as funder-accepted measurement frameworks that give service providers greater confidence and support in these areas.
• A deeper examination of the needs of specific newcomer segments is needed, such as seniors, youth, women, even refugee claimants and international students, not only to provide customized and more effective integration supports, but also strengthen pathways to permanent residency among groups not initially and traditionally supported by IRCC programming.
• Promoting a respectful, evidence-based dialogue about immigration – and holding all stakeholders to a high standard in this respect – is an important foundation in pursuing these strategies, as well as acknowledging the long-term lens required to support the multi-year nature of successful newcomer integration.
42
43
A deeper appreciation for the complexity of newcomers’ settlement experience
• Newcomers require strong investments in three basic pillars essential to successful settlement: access to good jobs; affordable housing; and health and social supports. To many newcomers in Peel, as the report suggests, all three are in short supply.
• Frontline settlement service providers face more than just questions about employment and housing from newcomers. Settlement professionals are also positioned to respond to a multiplicity and intersectionality of newcomer needs, including mental health, crisis and trauma as well as local healthcare. Enhancing our service environment for more effective system navigation and cross-sector referral pathways will ensure that service providers continue to specialize in their core areas of expertise while providing newcomers with access to a full spectrum of available community supports.
• Newcomers prefer the GTA, but they’re also mobile. This requires not just local – but also regional – stakeholders to think beyond traditional boundaries and champion greater inter-regional collaboration and information-sharing as a response to immigrant migration patterns and the assistance these individuals may require as they move from one GTA region to another.
Building bridges among formal and informal systems in the community to accelerate newcomer integration
• Ethno-cultural and faith institutions, friends and family networks, even social media, play an undeniably large role in newcomer settlement. However, the impact that these supports have, particularly on securing employment commensurate with one’s education, skills and work experience that is crucial to successful integration, could be enhanced if combined with the expertise of formal service providers.
• Formal service-providing organizations can establish better linkages with informal community-based supports not only to reflect more holistically of how settlement is facilitated in Peel, but also identify new collaborative opportunities to make supportive referrals and create a more cohesive community by bringing disparate systems together.
References and additional resources
Esses et al. (2010, March). Characteristics of a Welcoming Community. Retrieved from http://p2pcanada.ca/wp-
content/uploads/2011/09/Characteristics-of-a-Welcoming-Community-11.pdf
Curry, B. & White, M. (2017, November 29). Census 2016: Canadians, including recent immigrants, are among most
educated in the world. The Globe & Mail. Retrieved from https://www.theglobeandmail.com/news/national/
census-2016-education-labour-employment-mobility/article37122392/
Government of Canada. (2018, May 3). Find your NOC. Retrieved from https://www.canada.ca/en/immigration-
refugees-citizenship/services/immigrate-canada/express-entry/eligibility/find-national-occupation-code.html
Government of Canada. (2017, November). Evaluation of the Settlement Program. Retrieved from https://www.
canada.ca/en/immigration-refugees-citizenship/corporate/reports-statistics/evaluations/settlement-program.
html
Peel-Halton Local Employment Planning Council. (2018, July). The Costs and Impacts of Unemployment and
Underemployment in Peel and Halton. Peel Halton Workforce Development Group. Retrieved from https://www.
peelhaltonlepc.com/reports/workforce-characteristics-report-2018-eldyh
Peel-Halton Local Employment Planning Council. (2017, May). The High Skill Labour Market in Peel and
Halton. Peel Halton Workforce Development Group. Retrieved from https://static1.squarespace.com/
static/59d54ac1ccc5c5a938e27565/t/5af1d0dc70a6ade4606981a8/1525797088902/HSGJ+Report-Final+V4.pdf
Peel Poverty Reduction Strategy. 2018-2028 Peel Poverty Reduction Strategy: Community Action Plan. Retrieved
from http://www.povertyinpeel.ca/_include/Peel-Poverty-Reduction-Strategy-2018-2028.pdf
Peel Poverty Reduction Strategy. 2018-2028 Peel Poverty Reduction Strategy: Community Action Plan. Retrieved
from http://www.povertyinpeel.ca/_include/Peel-Poverty-Reduction-Strategy-2018-2028.pdf
Region of Peel. (2017, October). 2016 Census Bulletin - Immigration and Ethnic Diversity. Retrieved from https://www.
peelregion.ca/planning-maps/CensusBulletins/2016-immigration-ethnic-diversity.pdf
Statistics Canada. (2019, February 28). Census Profile, 2016 Census, Peel, Regional municipality [Census division].
Retrieved from https://www12.statcan.gc.ca/census-recensement/2016/dp-pd/prof/details/page
Statistics Canada. (2019, March 13). Labour force characteristics by immigrant status, annual [Geography: Toronto].
Retrieved from https://www150.statcan.gc.ca/t1/tbl1/en/tv.action?pid=1410008301
United Way of Greater Toronto. (2017, November). The Opportunity Equation in the Greater Toronto Area: An update
on neighbourhood income inequality and polarization. Retrieved from file: https://www.unitedwaygt.org/
file/2017_Opportunity_Equation_Update_Low-Res.pdf
44

peelnewcomer.org
Peel Newcomer Strategy Groupc/o United Way of Greater Toronto 90 Burnhamthorpe Road West, Suite 408, Mississauga, ON L5B 3C3 Tel 905 276 0008
Shh by Anran GuoAn immigrant from China who settled in Peel in 2014, Anran created “Shh,” an installation of shredded newsprint designed to block a hallway, requiring visitors to walk through it, changing the installation’s shape and often at-taching itself onto visitors. The shredding of newsprint represents unheard voices, and the installation serves as a metaphor for one’s feelings of marginalized interactions in a new community.