march 2010 forest service - u.s. government accountability
TRANSCRIPT

GAO United States Government Accountability Office
Report to Congressional Requesters
FOREST SERVICE March 2010
Information on Appeals, Objections, and Litigation Involving Fuel Reduction Activities, Fiscal Years 2006 through 2008
GAO-10-337

What GAO Found
United States Government Accountability Office
Why GAO Did This Study
HighlightsAccountability Integrity Reliability
March 2010 FOREST SERVICE
Information on Appeals, Objections, and Litigation Involving Fuel Reduction Activities, Fiscal Years 2006 through 2008 Highlights of GAO-10-337, a report to
congressional requesters
Increases in the number and intensity of wildland fires have led the Department of Agriculture’s Forest Service to place greater emphasis on thinning forests and rangelands to reduce the buildup of potentially hazardous vegetation that can fuel wildland fires. The public generally has an opportunity to challenge agency hazardous fuel reduction decisions with which it disagrees. Depending on the type of project being undertaken, the public can file a formal objection to a proposed decision, or can appeal a decision the agency has already made. Appeals and objections must be reviewed by the Forest Service within prescribed time frames. Final decisions may also generally be challenged in federal court. GAO was asked, among other things, to determine, for fiscal years 2006-2008, (1) the number of Forest Service fuel reduction decisions and the associated acreage; (2) the number of decisions subject to appeal and objection, the number appealed, objected to, and litigated, and the associated acreage; and (3) the outcomes of appeals, objections, and litigation, and the extent to which appeals and objections were processed within prescribed time frames. In doing so, GAO conducted a nationwide survey of forest managers and staff, interviewed officials in the Forest Service’s regional offices, and reviewed documentation to corroborate agency responses. GAO requested, but did not receive, comments from the Forest Service on a draft of this report.
Through a GAO-administered survey and interviews, Forest Service officials reported the following information: • In fiscal years 2006 through 2008, the Forest Service issued 1,415
decisions involving fuel reduction activities, covering 10.5 million acres. • Of this total, 1,191 decisions, covering about 9 million acres, were subject
to appeal and 217—about 18 percent—were appealed. Another 121 decisions, covering about 1.2 million acres, were subject to objection and 49—about 40 percent—were objected to. The remaining 103 decisions were exempt from both objection and appeal. Finally, 29 decisions—about 2 percent of all decisions—were litigated, involving about 124,000 acres.
• For 54 percent of the appeals filed, the Forest Service allowed the project
to proceed without changes; 7 percent required some changes before being implemented; and 8 percent were not allowed to be implemented. The remaining appeals were generally dismissed for procedural reasons or withdrawn before they could be resolved. Regarding objections, 37 percent of objections resulted in no change to a final decision; 35 percent resulted in a change to a final decision or additional analysis on the part of the Forest Service; and the remaining 28 percent were set aside from review for procedural reasons or addressed in some other way. And finally, of the 29 decisions that were litigated, lawsuits on 21 decisions have been resolved, and 8 are ongoing. Of the lawsuits that have been resolved, the parties settled 3 decisions, 8 were decided in favor of the plaintiffs, and 10 were decided in favor of the Forest Service. All appeals and objections were processed within prescribed time frames—generally, within 90 days of a decision (for appeals), or within 60 days of the legal notice of a proposed decision (for objections).
Summary of Appeals of and Objections to Forest Service Fuel Reduction Decisions and Associated Acreage, Fiscal Years 2006-2008
Subject
to appeal Subject to objection
Exempt from appeal and
objection Total Number of decisions 1,191 121 103 1,415 Number of decisions appealed or objected to 217 49 Not applicable 266 Percentage of decisions appealed or objected to 18 40 Not applicable 19 Acreage (in thousands) 9,143 1,215 188 10,545 Acreage appealed or objected to (in thousands) 839 225 Not applicable 1,064 Percentage of acreage appealed or objected to 9 19 Not applicable 10
Source: GAO analysis of survey results.
Note: Numbers may not total due to rounding. View GAO-10-337 or key components. For more information, contact Anu Mittal at (202) 512-3841 or [email protected].

Page i GAO-10-337 Forest Service
Contents
Letter 1
Results in Brief 4 Background 7 Number and Type of Decisions Involving Hazardous Fuel
Reduction Activities in Fiscal Years 2006 through 2008 and the Associated Acreage 13
Number of Decisions Involving Hazardous Fuel Reduction Activities That Were Subject to Appeal or Objection; Number of Decisions Appealed, Objected to, or Litigated; and Associated Acreage 14
Outcomes of Appeals, Objections, and Litigation of Decisions with Hazardous Fuel Reduction Activities; Associated Time Frames; and Identities of Appellants, Objectors, and Plaintiffs 18
Treatment Methods and Contract Types Associated with Fuel Reduction Decisions; the Number of Appeals, Objections, and Lawsuits by Treatment Method and Contract Type; and the Associated Acreage 23
Decisions Involving Fuel Reduction Activities in the Wildland-Urban Interface and Inventoried Roadless Areas; the Number of Appeals, Objections, and Lawsuits on Those Decisions; and the Associated Acreage 26
Concluding Observations 28 Agency Comments and Our Evaluation 29
Appendix I Objectives, Scope, and Methodology 30
Appendix II Number of Fuel Reduction Decisions and Associated
Acreage, by Forest Service Region 34
Appendix III Number of Appeals, Objections, and Lawsuits of Fuel
Reduction Decisions, by Forest Service Region 37
Appendix IV Appeal Outcomes for Fuel Reduction Decisions, by
Forest Service Region 41

Appendix V Litigation Outcomes for Fuel Reduction Decisions,
by Forest Service Region 44
Appendix VI List of Appellants, Objectors and Litigants, by
Forest Service Region 47
Appendix VII Fuel Reduction Treatment Methods and Number of
Appeals, Objections, and Lawsuits, by Forest
Service Region 53
Appendix VIII Contract Types and Number of Appeals, Objections,
and Lawsuits, by Forest Service Region 56
Appendix IX Fuel Reduction Decisions in the Wildland-Urban
Interface and Inventoried Roadless Areas, by Forest
Service Region 59
Appendix X Types of Categorical Exclusions Authorized by the
Forest Service and Represented in the GAO Survey 67
Appendix XI Major Litigation Affecting Appeal Procedures for
Categorical Exclusions 69
Appendix XII Survey Questions to National Forests 71
Appendix XIII GAO Contact and Staff Acknowledgments 91
Page ii GAO-10-337 Forest Service

Tables
Table 1: Traditional Project Appeals Process Compared with Healthy Forests Restoration Act Project Objection Process 12
Table 2: Forest Service Decisions with Fuel Reduction Activities and Acreage Affected, by Decision Type, Fiscal Years 2006 through 2008 13
Table 3: Forest Service Decisions with Hazardous Fuel Reduction Activities That Were Appealed, Objected to, Exempt, or Litigated, by Decision Type, and Associated Acreage, Fiscal Years 2006 through 2008 14
Table 4: Appeals, Objections, Exemptions, and Litigation Associated with Various Treatment Methods, and Associated Acreage, Fiscal Years 2006 through 2008 23
Table 5: Number and Percentage of Appeals, Objections, Exemptions, and Litigation Associated with Various Contracting Types, Fiscal Years 2006 through 2008 25
Table 6: Appeals, Objections, Exemptions, and Litigation of Decisions with Fuel Reduction Activities in the Wildland-Urban Interface and Inventoried Roadless Areas, and Associated Acreage, Fiscal Years 2006 through 2008 27
Table 7: Appellants and Number of Appeals Filed, by Forest Service Region, Fiscal Years 2006 through 2008 47
Table 8: Objectors and Number of Objections Filed, by Forest Service Region, Fiscal Years 2006 through 2008 50
Table 9: Plaintiffs and Number of Lawsuits Filed, by Forest Service Region, Fiscal Years 2006 through 2008 51
Table 10: Types of Categorical Exclusions Authorized for Use by the Forest Service and Represented in the GAO Survey 67
Table 11: A Chronology of Litigation Concerning Regulation Exempting Decisions That Have Been Categorically Excluded from Appeals 69
Table 12: A Chronology of Litigation Concerning the Validity of the Fuels CE 70
Figures
Figure 1: Lands Managed by the Forest Service, by Region 8 Figure 2: Number of Fuel Reduction Decisions and Associated
Acreage, by Forest Service Region 35
Page iii GAO-10-337 Forest Service

Figure 3: Number of Decisions Subject to Appeal and Objection, and the Number and Frequency of Appeals, Objections, Exemptions, and Litigation, by Forest Service Region 38
Figure 4: Outcomes of Appeals of Fuel Reduction Decisions, by Forest Service Region 42
Figure 5: Outcomes of Litigation of Fuel Reduction Decisions, by Forest Service Region 45
Figure 6: Number of Decisions Subject to Appeal and Objection, and the Number and Frequency of Appeals, Objections, Exemptions, and Litigation, by Treatment Method and Forest Service Region 54
Figure 7: Number of Decisions Subject to Appeal and Objection, and the Number and Frequency of Appeals, Objections, Exemptions, and Litigation, by Contract Type and Forest Service Region 57
Figure 8: Number of Fuel Reduction Decisions in the Wildland-urban Interface (WUI), and the Number and Frequency of Appeals, Objections, Exemptions, and Litigation, by Forest Service Region 60
Figure 9: Number of Fuel Reduction Decisions in Inventoried Roadless Areas (IRA), and the Number and Frequency of Appeals, Objections, Exemptions, and Litigation, by Forest Service Region 64
Page iv GAO-10-337 Forest Service

Abbreviations
CE categorical exclusion HFRA Healthy Forests Restoration Act IRA inventoried roadless area NEPA National Environmental Policy Act of 1969 PALS Planning, Appeals, and Litigation System RARE Roadless Area Review and Evaluation WUI wildland-urban interface
This is a work of the U.S. government and is not subject to copyright protection in the United States. The published product may be reproduced and distributed in its entirety without further permission from GAO. However, because this work may contain copyrighted images or other material, permission from the copyright holder may be necessary if you wish to reproduce this material separately.
Page v GAO-10-337 Forest Service

Page 1 GAO-10-337 Forest Service
United States Government Accountability Office
Washington, DC 20548
March 4, 2010
The Honorable Jeff Bingaman Chairman Committee on Energy and Natural Resources United States Senate
The Honorable Nick J. Rahall, II Chairman Committee on Natural Resources House of Representatives
Much attention has been paid in recent years to the condition of our nation’s forests, in large part because of increases in the number and intensity of wildland fires. In an effort to reduce the risk of fire, federal land management agencies—including the Forest Service in the Department of Agriculture—are placing greater emphasis on thinning forests and rangelands to help reduce the buildup of potentially hazardous fuels. The agencies have placed particular emphasis on fuel reduction in areas where human development meets or intermixes with undeveloped wildland, known as the wildland-urban interface.
Like many other land management activities, hazardous fuel reduction activities are typically subject to the National Environmental Policy Act of 1969 (NEPA).1 Under NEPA, federal agencies are to evaluate the likely environmental effects of proposed projects through an environmental assessment or, if projects are likely to significantly affect the environment, a more detailed environmental impact statement. If, however, the agency determines that activities of a proposed project fall within a category of activities the agency has already determined have no significant environmental impact—called a categorical exclusion—then the agency generally need not prepare an environmental assessment or environmental impact statement. The Forest Service then generally issues a final decision for each project in the form of a Record of Decision, a Decision Notice, or a Decision Memo, depending on whether the decision stems from an environmental impact statement, environmental assessment, or
1Pub. L. No. 91-190, 83 Stat. 852 (1970), as amended.

categorical exclusion, respectively.2 During the early planning stage of these environmental reviews, the public has opportunities to get involved by, for example, submitting written comments on the proposed project. Depending on the type of project, the public can generally challenge either the proposed action or the final decision by filing an objection or an appeal, respectively, with the Forest Service. These objections or appeals must be reviewed by the Forest Service within prescribed time frames. Final decisions may also generally be challenged in federal court.3
Much debate has focused on the extent and frequency of appeals and litigation of fuel reduction activities and their effect on agency activities. On the one hand, critics have asserted that such challenges to agency activities are stopping or unnecessarily slowing the decision-making processes of the Forest Service and its efforts to reduce fuels on federal lands. This opposition to fuel reduction activities is sometimes viewed as “frivolous” and alleged to be greatly increasing the costs of managing the national forests. Supporters of the administrative appeals process, on the other hand, have indicated that appeals have not been excessive or unwarranted and that few appeals are frivolous. Supporters further assert that Congress intended the federal land management process to include administrative reviews of agency decisions to (1) ensure public participation in the decision-making process and (2) ensure that agency managers adequately consider the various factors and policies affecting the environmental health of the nation’s lands.
In 2003, we issued a report on appeals and litigation of Forest Service fuel reduction projects during fiscal years 2001 and 2002.4 Since that time, however, the legal and procedural landscape has changed considerably. For example, at the time of our 2003 report, fuel reduction decisions stemming from categorical exclusions were generally not subject to appeal; however, as the result of subsequent litigation, the Forest Service
2For some categorical exclusions, decision memos are not required. For example, a decision memo is not required for repair and maintenance of Forest Service administrative sites, roads, and recreation sites.
3It is the position of the Department of Agriculture that any filing for federal judicial review of a decision subject to appeal is premature and inappropriate under 7 U.S.C. § 6912(e) unless the plaintiff has first sought to invoke and exhaust the appeal procedures. 36 C.F.R. § 215.21. See Forest Guardians v. U.S. Forest Service, 579 F.3d 1114, 1121-24 (10th Cir. 2009) (discussing exhaustion requirement).
4GAO, Forest Service: Information on Appeals and Litigation Involving Fuels Reduction
Activities, GAO-04-52 (Washington, D.C.: Oct. 24, 2003).
Page 2 GAO-10-337 Forest Service

was required to allow appeals of these types of decisions. In addition, since the time period covered by that report, the Forest Service has introduced new categorical exclusions, including one specific to fuel reduction. And finally, in 2003, the Healthy Forests Restoration Act (HFRA) exempted certain fuel reduction projects from appeal, instead subjecting them to objection before the decision is final.5
In the context of these legal and procedural changes, you asked us to gather and report data on appeals, objections, and litigation related to Forest Service fuel reduction activities. This report provides information on (1) the number and type of Forest Service decisions involving hazardous fuel reduction activities signed in fiscal years 2006 through 2008 and the acreage associated with those decisions; (2) the number of these decisions that were subject to the appeal or objection process; the number that were appealed, objected to, or litigated; and the acreage associated with those decisions; (3) the outcomes of these appeals, objections, and lawsuits, including whether they were processed within prescribed time frames, and the identities of the appellants, objectors, and plaintiffs; (4) the treatment methods and contract types associated with fuel reduction decisions, the associated acreage, and how frequently each treatment method and contract type was appealed, objected to, or litigated; and (5) the number of decisions involving hazardous fuel reduction activities in the wildland-urban interface6 and inventoried roadless areas,7 the associated acreage, and how frequently these decisions were appealed, objected to, or litigated. This letter provides national data on these issues, while appendixes II through IX provide information by Forest Service region. Appendixes X and XI provide more
5Pub. L. No. 108-148, Title I, § 105 (2003).
6It should be noted that the Forest Service does not use a single, specific definition of wildland-urban interface, and that different definitions can be used depending on the authority under which fuel reduction projects are carried out. GAO has previously recommended that the Forest Service develop a consistent, specific definition of the wildland-urban interface. See GAO, Wildland Fire Management: Additional Actions
Required to Better Identify and Prioritize Lands Needing Fuels Reduction, GAO-03-805 (Washington, D.C.; Aug. 15, 2003).
7In this report, we use the term “inventoried roadless areas” to describe undeveloped areas with few or no roads that are identified as such in the applicable forest’s Land and Resource Management Plan or in 2001 Inventoried Roadless Area maps. These areas may also be identified as such in the Forest Service’s Roadless Area Review and Evaluation (RARE) studies completed in the 1970s, excluding areas that have since been designated as part of the National Wilderness Preservation System by Congress.
Page 3 GAO-10-337 Forest Service

information on the nature and use of categorical exclusions related to fuel reduction decisions.
In conducting our review, we administered a Web-based survey to all 108 national forests that issued decisions that involved hazardous fuel reduction activities in fiscal years 2006 through 2008. The survey was used to gather information about each of the decisions, including the type of environmental analysis used, acres involved, treatment methods and contract types used, the extent to which the decisions included activities in the wildland-urban interface and inventoried roadless areas, and specific information about decisions subject to the predecisional objection process. We obtained a 100 percent response rate from the national forests. To gather specific details about appeals and litigation of decisions with hazardous fuel reduction activities, we conducted semistructured interviews with officials in each of the Forest Service’s nine regions. For both the Web-based survey and the semistructured interviews, to test the accuracy and reliability of the responses provided by officials, we verified the accuracy of a random sample of responses by comparing them with decision documents and found that the information was sufficiently reliable for our reporting purposes. Appendix I provides details on the scope and methodology of our review. Appendix XII includes a copy of the survey sent to national forests.
We conducted our work from October 2008 through February 2010, in accordance with all sections of GAO’s Quality Assurance Framework that are relevant to our objectives. The framework requires that we plan and perform the engagement to obtain sufficient and appropriate evidence to meet our stated objectives and to discuss any limitations in our work. We believe that the information and data obtained, and the analysis conducted, provide a reasonable basis for any findings and conclusions in this product.
In response to our survey and interviews, national forest and regional officials reported the following:
Results in Brief
• In fiscal years 2006 through 2008, 1,415 Forest Service land management decisions involved hazardous fuel reduction activities. These decisions involved 10.5 million acres. Of these decisions, 71––5 percent––were based on environmental impact statements, 433––31 percent––were based on environmental assessments, and 910––64 percent––were based on categorical exclusions. (The remaining decision was a continuation of a previously authorized project and, according to the respondent, did not
Page 4 GAO-10-337 Forest Service

require an environmental impact statement, environmental assessment, or categorical exclusion.) Decisions based on environmental assessments covered the greatest acreage in our review—over 6.3 million acres—representing 61 percent of all acres.
• Of the 1,415 decisions involving hazardous fuel reduction activities, 1,191 decisions, involving approximately 9 million acres, were subject to appeal, with 217—about 18 percent–– appealed. An additional 121 decisions, involving approximately 1.2 million acres, were subject to objection, with 49––40 percent––objected to. The remaining 103 decisions, involving approximately 188,000 acres, were exempt from appeal and objection. And finally, of the 1,415 total decisions, 29––about 2 percent of all decisions––were litigated, involving approximately 124,000 acres.
• The 217 decisions that were appealed received a total of 298 appeals.8 Of these, the Forest Service ruled against the appellant in 160 instances (about 54 percent of all appeals), meaning that the project could be implemented without changes, and in another 22 instances (7 percent) ruled that the project could be implemented with specific changes. In contrast, the agency reversed its initial decision (in whole or in part) in response to 24 appeals (8 percent). It dismissed 91 appeals (about 30 percent) for various reasons, including failure on the part of the appellant to meet procedural requirements, and instances in which the appellant withdrew the appeal or the Forest Service withdrew the decision before the appeal could be decided. According to regional officials, the outcome of 1 appeal could not be determined based on documentation in their files. Of the 101 objections filed on 49 proposed decisions, 38 objections resulted in no change to a final decision. Another 31 objections resulted in a change to a final decision. An additional 4 objections resulted in the forest having to conduct additional analysis, and 13 were addressed in some other way, such as the objector agreeing to withdraw the objection if the Forest Service agreed to make changes to the final decision. The remaining 15 objections were removed from administrative review for a variety of reasons (also known as “set aside” from review). According to time frame information provided by survey respondents, the Forest Service processed all appeals and objections within prescribed time frames. Finally, of the 29 decisions that were litigated, lawsuits on 21 decisions have been resolved; the parties settled 3 decisions, 8 were
8Because multiple appeals can be filed on a single decision, the number of appeals filed is greater than the number of decisions appealed. Similarly, proposed decisions can be the subject of multiple objections, and the number of objections filed is greater than the number of proposed decisions objected to.
Page 5 GAO-10-337 Forest Service

decided in favor of the plaintiffs, and 10 were decided in favor of the Forest Service. Most of the appellants, objectors, and plaintiffs were environmental organizations.
• With respect to treatment methods, prescribed burning—where fires are deliberately set by land managers to reduce the buildup of potentially hazardous fuel—was the treatment most frequently associated with fuel reduction decisions, and was included in 1,076 of the 1,415 decisions. Mechanical treatment—in which equipment such as chain saws, chippers, bulldozers, and mowers is used to cut vegetation—was included in 973 decisions; and commercial logging—where trees are harvested for commercial use such as lumber—was included in 661 decisions.9 Although decisions involving prescribed burning received the greatest number of challenges, decisions that used commercial logging were challenged at a higher rate than the other treatment methods, considering both appeals and objections. Regarding contract type, timber sale contracts were the most frequently used, and were included in 606 of the 1,415 decisions. Service contracts—where contractors are hired to perform specific tasks such as thinning—were included in 536 decisions, and stewardship contracts were included in 218 decisions.10 In addition to issuing contracts for the work, the Forest Service also issued forest products permits (for activities such as collecting firewood) in 236 decisions.11 Decisions that included commercial timber sale contracts were the most frequently appealed, objected to, and litigated. However the rate at which decisions were challenged was highest for decisions that included stewardship contracts.
• There were 954 decisions involving fuel reduction activities in the wildland-urban interface, involving about 4 million acres. Of these decisions, 140 were appealed, 45 were objected to, and 13 were litigated.
9Because each decision can be implemented using more than one treatment method, the sum of decisions by treatment method is greater than the total number of decisions.
10Stewardship contracts include those under which the agency uses the value of commercial products, such as timber, to offset the cost of services received, such as thinning, stream improvement, and other activities. For more information about stewardship contracting, see GAO, Federal Land Management: Additional Guidance on
Community Involvement Could Enhance Effectiveness of Stewardship Contracting, GAO-04-652 (Washington, D.C.: June 14, 2004), and Federal Land Management: Use of
Stewardship Contracting Is Increasing, but Agencies Could Benefit from Better Data and
Contracting Strategies, GAO-09-23 (Washington, D.C.: Nov. 13, 2008).
11Because each decision can be implemented using more than one contract type, the sum of decisions by contract type is greater than the total number of decisions.
Page 6 GAO-10-337 Forest Service
There were 169 decisions involving fuel reduction activities in inventoried roadless areas, involving about 750,000 roadless acres. Of these decisions, 26 were appealed, 11 were objected to, and 4 were litigated. These figures represent a similar rate of appeals for both types of decision, with about 18 to 19 percent of appealable decisions appealed; however, decisions involving inventoried roadless areas were objected to at a higher rate (50 percent) than those involving the wildland-urban interface (40 percent).
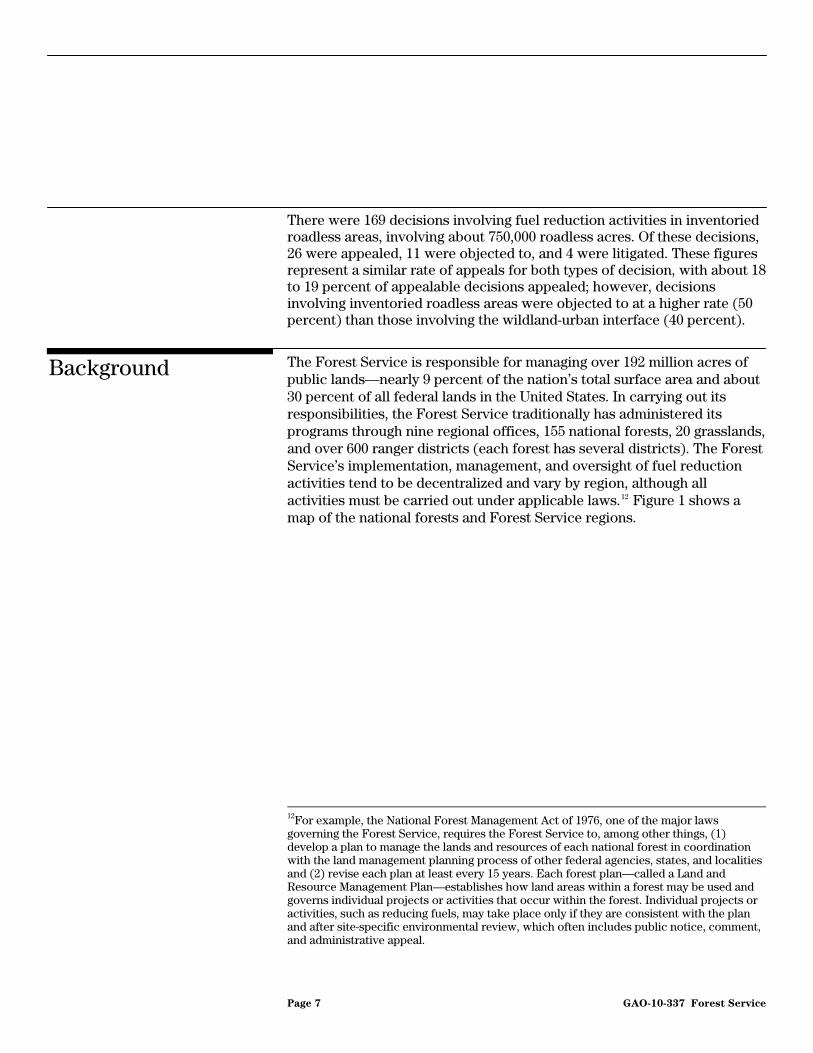
The Forest Service is responsible for managing over 192 million acres of public lands—nearly 9 percent of the nation’s total surface area and about 30 percent of all federal lands in the United States. In carrying out its responsibilities, the Forest Service traditionally has administered its programs through nine regional offices, 155 national forests, 20 grasslands, and over 600 ranger districts (each forest has several districts). The Forest Service’s implementation, management, and oversight of fuel reduction activities tend to be decentralized and vary by region, although all activities must be carried out under applicable laws.12 Figure 1 shows a map of the national forests and Forest Service regions.
Background
12For example, the National Forest Management Act of 1976, one of the major laws governing the Forest Service, requires the Forest Service to, among other things, (1) develop a plan to manage the lands and resources of each national forest in coordination with the land management planning process of other federal agencies, states, and localities and (2) revise each plan at least every 15 years. Each forest plan—called a Land and Resource Management Plan—establishes how land areas within a forest may be used and governs individual projects or activities that occur within the forest. Individual projects or activities, such as reducing fuels, may take place only if they are consistent with the plan and after site-specific environmental review, which often includes public notice, comment, and administrative appeal.
Page 7 GAO-10-337 Forest Service

Figure 1: Lands Managed by the Forest Service, by Region
Source: Forest Service.
Region 5Pacific Southwest
Region 6Pacific Northwest
Region 4Intermountain
Region 1Northern
Region 2Rocky Mountain Region 9
Eastern
Region 8Southern
Region 3Southwestern
Region 10Alaska Puerto Rico
Note: The Forest Service does not have a Region 7.
Forest Service projects intended to reduce fuels and restore or maintain desired vegetation conditions generally use prescribed burning, in which fires are deliberately set by land managers, and/or mechanical treatments, in which equipment such as chain saws, chippers, bulldozers, or mowers is used to cut vegetation. Such mechanical treatment may include logging to remove commercial timber. Other approaches include applying chemical herbicides, using grazing animals such as cattle and goats, and allowing the public to remove firewood by hand. To carry out its fuel reduction work, the Forest Service may use agency staff but more commonly contracts it out. The agency generally uses three types of contracts—
Page 8 GAO-10-337 Forest Service

timber sale contracts, service contracts, and stewardship contracts—to accomplish fuel reduction work. Timber sale contracts are awarded to individuals or companies to harvest and remove trees from federal lands under its jurisdiction. Service contracts are awarded to contractors to perform specific tasks, such as thinning trees or clearing underbrush. Stewardship contracts are generally awarded to contractors who perform both timber harvesting and service activities, and include contracts under which the agency uses the value of commercial products, such as timber, to offset the cost of services received, such as thinning, stream improvement, and other activities.
Controversy has surrounded the issue of fuel reduction for some time, particularly in areas where federal lands surround or are adjacent to human development and communities—the wildland-urban interface—and in inventoried roadless areas. Roadless areas have received special attention for decades, as some argue that these areas should be available for appropriate development and timber harvesting, while others believe that the areas should remain roadless to preserve the special values that their condition provides, such as clean water and undeveloped wildlife habitats.13
Forest Service hazardous fuel reduction activities are typically subject to one of two different internal administrative review processes, each of which has a specific procedure through which the public can challenge the agency’s decisions or proposed decisions to conduct the activities. Specifically:
• Postdecisional administrative appeals process. The Forest Service has provided an administrative appeals system for review of agency decisions, under certain circumstances, for over 100 years. Although the specific requirements of the appeals system have changed over the years, the Appeals Reform Act of 1993 established the appeals process pertinent to fiscal years 2006 through 2008––the time period covered by our review.14 When the Forest Service issues a public notice in a newspaper of record of a proposed action, the public has either 30 or 45 days to comment,
13Regulations governing roadless areas have been extensively litigated, and Congress is considering legislation addressing these areas. For a full discussion of these issues, see Congressional Research Service, National Forest System Roadless Area Initiatives, RL30647 (Washington, D.C.: October 9, 2008).
1416 U.S.C. § 1612 nt; see 36 C.F.R. part 215, Notice, Comment, and Appeal Procedures for National Forest System Projects.
Page 9 GAO-10-337 Forest Service

depending on the type of NEPA analysis document prepared. Once the agency issues a decision, the public has 45 days to file appeals; however, only those individuals who were involved in the public comment process through submission of written or oral comments or by otherwise notifying the Forest Service of their interest in the proposed action may file an appeal.15 Once the 45-day time frame for filing appeals has expired, the Forest Service must review all appeals and issue a response to each within an additional 45 days. Appeals can result in decisions being affirmed, in which case the Forest Service can proceed with the project as planned, or in decisions being reversed in whole or in part, in which case the agency may revise or even cancel the affected activities. The official (known as the Appeal Deciding Officer) who determines the outcome of the appeal must be, at least, the next higher level supervisor of the individual who made the original decision. There is no further administrative review of the Appeal Deciding Officer’s decision by any other Forest Service or Department of Agriculture official.
The types of decisions that can be appealed have changed since GAO last reported on this issue in 2003. In 2003, the Forest Service added several new categorical exclusions related to vegetation management (including one specific to hazardous fuel reduction) that it exempted from appeal. However, as the result of subsequent litigation challenging these exemptions, the Forest Service ultimately was required to allow the public to appeal many (though not all) of these decisions during fiscal years 2006 through 2008, the time period covered by our current review.16
• Predecisional administrative objection process. In 2003, HFRA required the Forest Service to establish an alternative process for authorizing certain hazardous fuel reduction projects, including an alternative predecisional objection process in lieu of the appeals process for certain
15The Forest Service appeals regulations contain a provision stating that only a person who files “substantive” comments may file an appeal. 36 C.F.R. § 215.13(a). A federal district court has held that this requirement is invalid under the Appeal Reform Act. Wilderness
Society v. Rey, D. Mont., Civ. No. 03-00119, April 24, 2006. The case is on appeal in the Ninth Circuit. See Wilderness Society v. Rey, 06-35565, filed June 23, 2006.
16See appendix XI for more information.
Page 10 GAO-10-337 Forest Service

projects.17 HFRA authorizes the public to file objections to a proposed project before the agency issues a final decision on the project, instead of the traditional appeals process where the administrative review occurs after the agency’s final decision has been made. According to the Forest Service, this objection process was intended to expedite the implementation of fuel reduction projects and to encourage early public input during the planning process. Only those parties who have previously submitted written comments specific to the proposed project may file objections. (The public has an opportunity to provide these written comments during scoping or other public comment periods.) The public must file objections with the reviewing officer—the next higher level supervisor of the person responsible for the proposed action—within 30 days following the publication date of the legal notice of the proposed environmental assessment or environmental impact statement. (Decisions that are subject to objection cannot use categorical exclusions as the basis for the decision.) If no objection is filed within the 30-day time period, the decision may be finalized on, but not before, the fifth business day following the end of the objection-filing period. If an objection is filed, the Forest Service must issue a written response to the objector addressing the objection within 30 days following the end of the objection-filing period. The reviewing officer may hold a meeting to discuss issues raised in the objection and any potential resolution. There are several ways the Forest Service addresses an objection. The objection can (1) be set aside from review, (2) be reviewed by the Forest Service resulting in a change to the final decision, (3) be reviewed by the Forest Service resulting in no change to the final decision, or (4) result in the reviewing officer directing the appropriate Forest Service official to complete additional analysis prior to issuing a final decision. An objection may be set aside from review for procedural reasons—if, for example, the objection is not received within the allowed 30-day time period, or the objecting individual or organization did not submit written comments during scoping or other
17The agency’s objection process appears at 36 C.F.R. part 218. Fuel reduction projects authorized under HFRA include those occurring on federal land in the following areas: the wildland-urban interface; certain municipal watersheds; areas where wind throw, blowdown, ice storm damage, or the existence or imminent risk of an insect or disease epidemic significantly threatens ecosystem components or resource values; and areas where wildland fire poses a threat to, and where the natural fire regimes are important for threatened and endangered species or their habitat. Actions implemented under HFRA are prohibited in wilderness areas, wilderness study areas, and federal lands where an act of Congress or presidential proclamation prohibits or restricts removal of vegetation.
Page 11 GAO-10-337 Forest Service

public comment opportunities.18 There is no further administrative review by any other Forest Service or Department of Agriculture official of the reviewing officer’s written response to an objection.
Table 1 compares the appeals and objection processes.
Table 1: Traditional Project Appeals Process Compared with Healthy Forests Restoration Act Project Objection Process
Appeals process Objection process
Authority for review process and corresponding regulation
Appeals Reform Act 36 C.F.R. part 215
Healthy Forests Restoration Act 36 C.F.R. part 218
Timing of process Appeal is filed after the project decision is made Objection filed before the project decision is made
Eligibility to appeal/object Those who were involved in the public comment process for the project through submission of written or oral comments or by otherwise notifying the Forest Service of their interest in the proposed action
Those who submitted specific written comments related to the project during the project comment period, the Draft Environmental Impact Statement comment period (if applicable), or any other public comment periods
Filing period 45 days after legal notice of the decision is published in newspaper of record
30 days after legal notice of the Environmental Assessment or Final Environmental Impact Statement published in newspaper of record
Response/resolution period Resolution of appeal within 45 days after end of appeal filing period
Response to objection within 30 days after end of objection filing period
Source: GAO summary of Forest Service information.
Some decisions, however, were subject to neither the appeal nor the objection process during the time of our review. As noted, the Forest Service was required to allow appeals of many fuel reduction decisions based on categorical exclusions, but was not required to allow appeals on all such decisions—meaning that certain decisions based on categorical exclusions remained exempt from appeal. These decisions were also exempt from the objection process because HFRA requires that fuel reduction decisions subject to objection use environmental assessments or environmental impact statements rather than categorical exclusions.
18Other reasons include the following: The decision is not subject to objection procedures; there is not enough information included in the objection for the reviewing officer to review; the objector withdraws the objection; an objector’s identity is not provided or cannot be determined from the signature or a reasonable means of contact is not provided; or the objection is illegible for any reason, including submissions in an electronic format different from that specified in the legal notice of the proposed decision.
Page 12 GAO-10-337 Forest Service

For fiscal years 2006 through 2008, national forest managers reported 1,415 decisions involving hazardous fuel reduction activities, affecting 10.5 million acres of national forest land.19 Most of these decisions were based on categorical exclusions, although decisions baseenvironmental assessments represented the most acreage of all decision types. Table 2 shows the number of decisions and associated acreage, by decision type.
d on
Number and Type of Decisions Involving Hazardous Fuel Reduction Activities in Fiscal Years 2006 through 2008 and the Associated Acreage
Table 2: Forest Service Decisions with Fuel Reduction Activities and Acreage Affected, by Decision Type, Fiscal Years 2006 through 2008
Decisions/acres Categorical exclusions
Environmental assessments
Environmental impact statements Other Total
Number of decisions 910 433 71 1a 1,415
Percentage of total decisions 64 31 5 <1 100
Number of acres (in thousands) 3,559 6,397 586 3 10,545
Percentage of total acres 34 61 6 0 100
Source: GAO analysis of survey results.
Note: Numbers may not total because of rounding. Acreage data are not complete because some respondents did not report this information. In addition, depending on the status of the projects, some respondents reported the number of acres they planned to treat, while others reported the actual number of treated acres. aIn one case, the survey respondent indicated that the decision was a continuation of a previously authorized project. According to this respondent, chapter 18 of the Forest Service Handbook allows such a decision to be made without the use of a categorical exclusion, environmental assessment, or environmental impact statement.
Appendix II provides greater detail on the number of decisions and associated acreage for each Forest Service region.
19The Forest Service does not have a uniform definition of a hazardous fuel reduction activity, and many agency projects may involve fuel reduction activities that provide an ancillary benefit to a project conducted for another purpose—potentially affecting the information that forest managers reported to us. See appendix I for more information about our data collection methodology.
Page 13 GAO-10-337 Forest Service

Of the 1,415 decisions in our review, 1,191—about 84 percent—were subject to the appeals process. In contrast, only 121 decisions—8.5 percent—were subject to the objection process. However, the rate at which decisions subject to the objection process were challenged was higher than for decisions under the appeals process. Specifically, 40 percent of decisions subject to objection were objected to, compared with the 18 percent appeal rate for decisions subject to appeal. Table 3 shows, for all decisions covered by our review for fiscal years 2006 through 2008, the number of appeals, objections, and litigation associated with each decision type.
Number of Decisions Involving Hazardous Fuel Reduction Activities That Were Subject to Appeal or Objection; Number of Decisions Appealed, Objected to, or Litigated; and Associated Acreage
Table 3: Forest Service Decisions with Hazardous Fuel Reduction Activities That Were Appealed, Objected to, Exempt, or Litigated, by Decision Type, and Associated Acreage, Fiscal Years 2006 through 2008
(Acres in thousands)
Decisions/acres Categorical exclusions
Environmental assessments
Environmental impact statements Othera Total
Total number of decisions 910 433 71 1 1,415
Total acreage 3,559 6,397 586 3 10,545
Decisions subject to appeal
Number of decisions subject to appealb 808 321 62 0 1,191
Number of decisions appealed 80 90 47 0 217c
Percentage of appealable decisions appealed 10 28 76 n/a 18
Acreage subject to appeal 3,375 5,285 483 0 9,143
Acreage appealed 116 429 294 0 839
Percentage of appealable acreage appealed 3 8 61 n/a 9
Decisions subject to objectiond
Number of decisions subject to objection process n/a 112 9 0 121
Number of decisions objected to n/a 43 6 0 49e
Percentage of decisions objected to n/a 38 67 0 40
Acreage subject to objection n/a 1,112 103 0 1,215
Acreage objected to n/a 184 41 0 225
Percentage of acreage objected to n/a 17 40 0 19
Page 14 GAO-10-337 Forest Service

(Acres in thousands)
Decisions/acres Categorical exclusions
Environmental assessments
Environmental impact statements Othera Total
Exempt decisions
Number of decisions exempt from appeal and objection 102 0 0 1 103
Percentage of all decisions exempt from appeal and objection 11 0 0 100 7
Acreage exempt from appeal and objection 185 0 0 3 188
Percentage of all acreage exempt from appeal and objection 5 0 0 100 2
Litigation
Number of decisions litigated 4 14 11 0 29
Percentage of all decisions litigated <1 3 15 n/a 2
Acreage litigated 2 70 52 0 124
Percentage of acreage litigated <1 1 9 n/a 1
Source: GAO analysis of survey results.
Notes: n/a = not applicable. Numbers may not total because of rounding. Acreage data are not complete because some respondents did not report this information. In addition, depending on the status of the projects, some respondents reported the number of acres they planned to treat, while others reported the actual number of treated acres. aIn one case, the survey respondent indicated that the decision was a continuation of a previously authorized project. According to this respondent, Chapter 18 of the Forest Service Handbook allows such a decision to be made without the use of a categorical exclusion, environmental assessment, or environmental impact statement. bOne project in our study was authorized under HFRA and involved a fuel reduction activity, but did not qualify as an “authorized hazardous fuel reduction project” under HFRA and therefore was not subject to the objection process. According to the survey respondent for this decision, it implemented HFRA provisions related to insect and disease infestation, and was subject to the notice, comment, and appeals process found in 36 C.F.R. part 215 because it included a timber sale activity. As a result, it is included in our count of decisions subject to appeal. cThese 217 decisions received a total of 298 appeals. The greatest number of appeals on a single decision was 9. dOnly authorized hazardous fuel reduction projects under HFRA that are analyzed in an Environmental Assessment or Environmental Impact Statement are subject to the predecisional objection process. eThese 49 decisions received a total of 101 objections. The greatest number of objections to a single decision was 22.
Appendix III provides greater detail on the number of appeals, objections, and litigation for each Forest Service region.
In addition to the introduction of the objection process, our survey data reflect two important changes that have occurred since our 2003 report: (1) the extent to which activities associated with categorical
Page 15 GAO-10-337 Forest Service

exclusions are subject to the appeals process and (2) the decrease in the use of the categorical exclusion for hazardous fuel reduction to authorize hazardous fuel reduction activities. Specifically:
• Extent to which categorical exclusions were subject to appeal. At the time of our 2003 report, decisions using categorical exclusions were generally not subject to appeal, and in that report we noted that 99 percent of fuel reduction decisions using categorical exclusions in fiscal years 2001 and 2002 were exempt from appeal. Also in 2003, the Forest Service introduced several new categorical exclusions that were exempt from appeal, including one categorical exclusion specific to fuel reduction activities. Beginning later that year, however, the agency’s ability to exempt decisions using categorical exclusions from appeal was challenged in court.20 As a result of this litigation, the Forest Service was required to allow the public to appeal decisions containing any of 11 types of categorically excluded activities, including fuel reduction—and thus, most fuel reduction decisions in our survey that were made using categorical exclusions were appealable by the public. Specifically, 89 percent of the categorical exclusions identified in our survey were subject to appeal in fiscal years 2006 through 2008, in contrast to the 1 percent that were subject to appeal during our 2003 review. The remaining 11 percent of categorical exclusions in our current review—a total of 103 decisions—were identified by survey respondents as exempt from appeal because they did not contain the activities covered by the litigation. Subsequently, in 2009 the U.S. Supreme Court overturned the lower court’s ruling on procedural grounds, allowing the Forest Service to utilize the provisions of its regulations that exempt categorically excluded decisions from appeal.21 Appendix X contains data on the type and frequency of the categorical exclusions represented in our survey.
• Decrease in the use of the categorical exclusion for hazardous fuel
reduction. Although Forest Service regulations contain a specific categorical exclusion under which hazardous fuel reduction activities can be authorized, this was not the most commonly reported categorical exclusion in our survey of decisions involving hazardous fuel reduction activities. Instead, the most commonly reported categorical exclusion was
20See appendix XI for a summary of the major litigation affecting the exemptions for categorical exclusions.
21The Forest Service is considering amending this regulation in light of the litigation that challenged it, the agency’s experience in implementing it, and possible changes in policy direction.
Page 16 GAO-10-337 Forest Service

one intended for timber stand and/or wildlife habitat improvement. Our survey data show that the total number of decisions authorized under the categorical exclusion for hazardous fuel reduction decreased greatly over the period covered by our survey, while at the same time, the use of the categorical exclusion for timber stand and/or wildlife habitat improvement increased. Specifically, use of the categorical exclusion for hazardous fuel reduction decreased from 214 in fiscal year 2006 to 28 in fiscal year 2008, while the use of the categorical exclusion for timber stand and/or wildlife habitat improvement increased from 145 in fiscal year 2006 to 167 in fiscal year 2008.
This decrease in the use of the categorical exclusion for hazardous fuel reduction may have resulted in large part from the chief of the Forest Service’s response to a court order in 2007. In this response the chief directed that no new decisions should be made under the categorical exclusion for hazardous fuel reduction after December 2007. Furthermore, he directed that no additional contracts be initiated to implement projects authorized under this authority—meaning that projects that were not under way did not start, even if a final decision had already been issued. Under the chief’s direction, projects that were near completion could proceed. Of the 379 decisions in our survey originally authorized under the categorical exclusion for hazardous fuel reduction, respondents reported that 207—or about 55 percent—were affected by the chief’s directive. Although we did not systematically gather information on what happened to projects subject to the court decision, respondents indicated that they took a variety of approaches, including the following:
• using a different categorical exclusion, such as the categorical exclusion for timber stand and/or wildlife habitat improvement, to authorize the project;
• preparing an environmental assessment subject to the appeals process;
• stopping or slowing project implementation; and
• preparing an environmental assessment subject to the predecisional objection process, under HFRA.
Additionally, the rate at which decisions were litigated was about the same—2 percent—for decisions that were subject to the Forest Service’s traditional appeals process as for decisions authorized under HFRA—even though the agency’s expectation was that HFRA would reduce the likelihood of litigation. Of the 29 litigated decisions in our study, 26 had
Page 17 GAO-10-337 Forest Service

been subject to appeal, representing 2 percent of the 1,191 decisions subject to appeal; the remaining 3 litigated decisions had been subject to objection, likewise representing 2 percent of the 121 decisions subject to objection.
In fiscal years 2006 through 2008, of the 298 appeals filed, the Forest Service upheld its earlier decision in the majority of the cases without requiring any changes to the decision. Of the 101 objections submitted, the outcome was more evenly divided between those objections resulting in a change to the decision and those that did not. According to time frame information provided by survey respondents, all appeals and objections were processed within the prescribed time frames. For litigated decisions resolved at the time of our review, the Forest Service prevailed slightly more often than the plaintiffs.
Outcomes of Appeals, Objections, and Litigation of Decisions with Hazardous Fuel Reduction Activities; Associated Time Frames; and Identities of Appellants, Objectors, and Plaintiffs
Outcomes of Appeals, Time Frames, and Identities of Appellants
Of the 298 appeals filed on appealable decisions from fiscal years 2006 through 2008,
• For 160 appeals, the decisions were affirmed—that is, allowed to proceed—with no changes.
• For 22 appeals, the decisions were affirmed with specified changes.
• For 24 appeals, the decisions were reversed —that is, not allowed to proceed—based on issues raised by the appellants.
• A total of 91 appeals were dismissed for various reasons, including • 38 appeals that were resolved informally, of which 30 appeals were
withdrawn by the appellant and 8 decisions were withdrawn by the agency (when an appeal is resolved informally, changes may or may not be made to the decision);
Page 18 GAO-10-337 Forest Service

• 53 appeals that were dismissed without review, mostly for failing to meet procedural requirements, such as timeliness—however, 23 of these appeals were dismissed without review because, subsequent to receiving the appeal, the agency official who made the decision decided to withdraw the decision;22
• For 1 appeal, the outcome could not be determined based on documentation in the agency’s regional files, according to an agency official.
According to time frame information provided by Forest Service officials, all appeals of fiscal year 2006 through 2008 decisions were processed within the time frames prescribed in applicable laws and regulations.23 See appendix IV for detailed information on appeal outcomes for each Forest Service region.
The 298 appeals were filed by 217 appellants. This total includes appeals by 88 different interest groups, mostly environmental groups, and 129 individuals.24 Of the 88 interest groups, 10—Alliance for the Wild Rockies, Biodiversity Conservation Alliance, John Muir Project of the Earth Island Institute, Native Ecosystems Council, Oregon Wild, Ouachita Watch League, Sierra Club, The Lands Council, Utah Environmental Congress, and the WildWest Institute—each appealed 10 or more decisions. Appendix VI lists each interest group that appeared as an appellant in fiscal years 2006 through 2008 and the number of decisions for which each appellant filed appeals in each region. To protect the privacy of individual appellants, we do not list their names, but in appendix VI we provide information on the number of decisions appealed by individuals in each region.
22Decisions withdrawn in this manner are considered different from decisions the agency withdraws as a result of informal resolution. According to a regional official, withdrawn decisions that fall within the “Dismissed without Review” category avoid having to “daylight” to appellants what the flaws were in the decision.
23To verify these responses, we collected and reviewed agency documentation for a randomly selected sample of appealed decisions. Our review of this documentation confirmed that, for each such decision, the agency had processed appeals within prescribed time frames. See appendix I for additional information on our survey and data verification methodologies.
24Some of the individuals may have submitted an appeal on more than 1 decision. Consequently, there may have been some double counting of specific individuals.
Page 19 GAO-10-337 Forest Service

Of the 101 objections filed for 49 decisions from fiscal years 2006 through 2008,
• 38 objections resulted in no change to the final decision.
Outcomes of Objections, Time Frames, and Identities of Objectors
• 31 objections resulted in a change to the final decision.25
• 4 objections resulted in the Forest Service having to conduct additional analysis.
• 15 objections were set aside from review.
• 13 objections were addressed some other way; for example, several agency respondents explained that they addressed objector’s concerns by both agreeing to make a change to the final decision and by setting the objection aside from review. Rather than setting it aside from review for procedural reasons, however, the decisions were set aside because the objector withdrew the objection after the Forest Service agreed to make changes to the final decisions.
For objections that the Forest Service does not set aside, the Forest Service reviewing officer is required to respond in writing. Prior to issuing a written response, the objector or reviewing officer may request a meeting to discuss the issues that were raised in the objection and a possible resolution. According to some Forest Service officials we spoke with, these meetings have been used to further satisfy public concerns; however, because meetings are at the discretion of the reviewer, objectors with whom the reviewer decides not to meet may feel that their concerns were not adequately addressed, regardless of the outcome. For example, the Forest Service received 22 objections to the Middle East Fork Hazardous Fuel Reduction decision on the Bitterroot National Forest in west central Montana and east central Idaho, one of the first and, according to Forest Service officials, most contentious decisions authorized under HFRA authority in the Northern Region. One objector requested a meeting with the Forest Service and others expressed a willingness to meet, but the reviewing officer chose not to hold meetings, stating that their objections did not require additional clarification and that a private consultant with whom the forest contracted had determined
25As a result of one objection to one decision, a change was made and no written response was provided to the objector.
Page 20 GAO-10-337 Forest Service

that additional discussions would not resolve the objector’s concerns. The decision was ultimately litigated. In other cases, however, respondents reported that such meetings successfully addressed objectors’ concerns, sometimes resulting in objectors withdrawing their objections.
However, we also determined that different regions follow different approaches in addressing objectors’ concerns. For example, an official in the Pacific Southwest Region told us that officials generally meet with the objectors associated with valid objections (those that are not set aside for procedural reasons), with the goal of informally resolving the objections and having them subsequently withdrawn by the objectors. In contrast, an official in the Northern Region told us that while the region seeks to resolve objections informally, unlike the Pacific Southwest Region, it does not seek to have objectors subsequently withdraw their objections, and none have done so. Seeking to have objectors withdraw their objections, as the Pacific Southwest Region has done, may have important implications for subsequent litigation because, according to Forest Service officials, under HFRA and its implementing regulations, an objector that withdraws an objection has no standing to obtain judicial review of the Forest Service’s final decision.
According to time frame information provided by survey respondents, the final decisions for all proposals subject to the objection process from fiscal year 2006 through 2008 were signed in accordance with the time frames set forth by applicable laws and regulations.26 However, while officials are required to respond to objections within certain time frames, there is no limitation on the amount of time allowed to make a final decision. Of the 49 decisions for which objections were filed, 25 were signed between 35 days and 3 months of legal publication date of the proposed action. The remaining 24 were signed more than 3 months after the legal publication date, including 3 cases in which the final decision was signed more than a year after the legal publication date of the proposed action.
The 101 objections were filed by 37 organizations and 41 individuals. Of the 37 organizations, 3—the Center for Biological Diversity, the Idaho Conservation League, and the WildWest Institute27— each objected to 5 or
2636 C.F.R. part 218.12.
27Our data for the WildWest Institute include objections made by the Native Forest Network and Ecology Center. These two groups merged to form the WildWest Institute in April 2006.
Page 21 GAO-10-337 Forest Service

more decisions. Appendix VI lists each group that filed objections in fiscal years 2006 through 2008 and the number of decisions for which objections were filed in each region. As with appeals, in appendix VI we do not list the names of individual objectors, but do show the number of proposed decisions objected to by individuals in each region.
Outcomes of Litigation and Identities of Plaintiffs
Of the 29 decisions that were litigated from fiscal years 2006 through 2008, we are able to report the outcome for 21 of the lawsuits because they had been resolved at the time of our review. According to regional officials, lawsuits for 3 of these 21 decisions were dismissed because the plaintiffs and the Forest Service agreed to settle their claims. District courts reached an outcome on the 18 additional decisions, with 8 decided favorably to the plaintiffs and 10 decided favorably to the Forest Service.28 Lawsuits on the remaining 8 decisions were continuing at the time of our review.
In the 29 litigated decisions, 24 interest groups and 11 individuals were plaintiffs. The interest groups were primarily environmental groups, with three groups—Alliance for the Wild Rockies, Native Ecosystems Council, and the WildWest Institute—each acting as plaintiff in 5 or more decisions. Of the 29 litigated decisions, plaintiff groups and individuals had previously submitted appeals on 24 of the decisions and objections on 3 of the decisions during the administrative process. The remaining 2 litigated decisions were subject to appeal, but the plaintiffs did not submit an appeal during the administrative process. Appendix VI lists each group that acted as a plaintiff in fiscal years 2006 through 2008 and the number of decisions for which lawsuits were filed by each group within each Forest Service region. To protect the privacy of individual plaintiffs, we do not list their names, but in appendix VI provide information on the number of decisions litigated by individuals in each region.
28Both plaintiffs and the Forest Service have the option of appealing the decisions of the district court to the relevant federal court of appeals. We did not collect information on whether the decisions were appealed to a higher court.
Page 22 GAO-10-337 Forest Service

Prescribed burning was the most frequently used treatment method associated with the fuel reduction decisions included in our study, followed by mechanical treatment and commercial logging. Of these three methods, prescribed burning was the method most often challenged through appeals and objections; however, commercial logging was challenged at the highest rate, considering both appeals and objections. Table 4 shows, for all treatment methods in our study, the number and percentage of, and acreage associated with, appeals, objections, and litigation.
Treatment Methods and Contract Types Associated with Fuel Reduction Decisions; the Number of Appeals, Objections, and Lawsuits by Treatment Method and Contract Type; and the Associated Acreage
Table 4: Appeals, Objections, Exemptions, and Litigation Associated with Various Treatment Methods, and Associated Acreage, Fiscal Years 2006 through 2008
(Acres in thousands)
Decisions/acres Prescribed
burningMechanical
treatmentCommercial
logging
Construction/ maintenance of
fuel breaks
Chemical/ herbicide treatment
Livestock grazing
Total number of decisionsa 1,076 973 661 279 57 12
Total acreageb 5,099 1,109 1,283 111 336 297
Decisions subject to appeal
Number of decisions subject to appealc 940 804 546 225 50 7
Number of decisions appealed 187 167 162 64 18 2
Percentage of appealable decisions appealed 20 21 30 28 36 29
Acreage subject to appeal 4,344 787 704 85 328 229
Acreage appealed 512 266 315 59 12 42
Percentage of appealable acreage appealed 12 34 45 69 4 18
Decisions subject to objection
Number of decisions subject to objection 87 101 96 41 7 3
Number of decisions objected to 41 46 41 16 1 2
Percentage of decisions objected to 47 46 43 39 14 67
Acreage subject to objection 588 306 577 26 7 64
Acreage objected to 123 114 89 11 1 20
Percentage of acreage objected to 21 37 15 42 14 31
Page 23 GAO-10-337 Forest Service

(Acres in thousands)
Decisions/acres Prescribed
burningMechanical
treatmentCommercial
logging
Construction/ maintenance of
fuel breaks
Chemical/ herbicide treatment
Livestock grazing
Exempt decisions
Number of decisions exempt from appeal and objection 49 68 19 13 0 2
Percentage of decisions exempt from appeal and objection 5 7 3 5 0 17
Acreage exempt from appeal and objection 168 16 2 1 0 4
Percentage of acreage exempt from appeal and objection 3 1 <1 <1 0 1
Litigation
Number of decisions litigated 27 24 25 7 3 0
Percentage of decisions litigated 3 2 4 3 5 0
Acreage litigated 78 37 58 8 <1 0
Percentage of acreage litigated 2 3 5 7 <1 0
Source: GAO analysis of survey results.
Note: Numbers may not total because of rounding. Acreage data are not complete because some respondents did not report this information. In addition, depending on the status of the projects, some respondents reported the number of acres they planned to treat, while others reported the actual number of treated acres. aBecause land management projects may involve multiple treatment methods, the sum of decisions involving each treatment method exceeds the total of 1,415 decisions in our review. In addition to the treatment methods listed in the table, survey respondents selected “other” as a treatment method used for 95 decisions. bLand management projects may treat the same acreage more than once using different treatment methods. cOne project in our study was authorized under HFRA and involved a fuel reduction activity, but did not qualify as an “authorized hazardous fuel reduction project” under HFRA and therefore was not subject to the objection process. According to the survey respondent for this decision, it implemented HFRA provisions related to insect and disease infestation, and was subject to the notice, comment, and appeals process found in 36 C.F.R. part 215 because it included a timber sale activity. As a result, it is included in our count of decisions subject to appeal.
Appendix VII provides additional information on fuel reduction methods used and the number of appeals, objections and lawsuits by treatment method, for each Forest Service region.
Commercial timber sale contracts were the most frequent contract type used to implement the decisions included in our study, and were the type most often challenged through appeals and objections. Decisions using stewardship contracting, however, were challenged at a higher rate than the other contract types, considering both appeals and objections. Table 5 shows, for all the decisions included in our study, the number and
Page 24 GAO-10-337 Forest Service

percentage of contract types, and acreage associated with, appeals, objections, and litigation.29
Table 5: Number and Percentage of Appeals, Objections, Exemptions, and Litigation Associated with Various Contracting Types, Fiscal Years 2006 through 2008
Decisions
Timber sale
contractService
contract Stewardship
contract
Forest products permitsa
Total number of decisionsb 606 536 218 236
Decisions subject to appeal
Number of decisions subject to appealc 503 446 166 196
Number of decisions appealed 151 86 55 49
Percentage of appealable decisions appealed 30 19 33 25
Decisions subject to objection
Number of decisions subject to objection 82 59 48 29
Number of decisions objected to 32 22 24 11
Percentage of decisions objected to 39 37 50 38
Exempt decisions
Number of decisions exempt from appeal and objection 21 31 4 11
Percentage of decisions exempt from appeal and objection 3 6 2 5
Litigation
Number of decisions litigated 22 13 5 9
Percentage of decisions litigated 4 2 2 4
Source: GAO analysis of survey results.
Note: We did not collect acreage information by contract type. aForest products permits are often issued for such purposes as Christmas tree cutting and firewood gathering.
29For 32 of the decisions included in our study, the survey respondents did not provide information on the contract type.
Page 25 GAO-10-337 Forest Service

bA total of 1,085 decisions also included the use of Forest Service personnel to carry out fuel reduction activities. In addition to the contract types listed in the table, survey respondents selected “other” as a contract method used for 75 decisions. Because land management projects may involve multiple contracts and may also use agency personnel in addition to contracts, the sum of decisions involving each contracting type exceeds the total of 1,415 decisions in our review. cOne project in our study was authorized under HFRA and involved a fuel reduction activity, but did not qualify as an “authorized hazardous fuel reduction project” under HFRA and therefore was not subject to the objection process. According to the survey respondent for this decision, it implemented HFRA provisions related to insect and disease infestation, and was subject to the notice, comment, and appeals process found in 36 C.F.R. part 215 because it included a timber sale activity. As a result, it is included in our count of decisions subject to appeal.
Appendix VIII provides additional information on the contracting methods used for decisions included in our study and the appeal, objection, and litigation rates for each Forest Service region.
Of the 1,415 decisions in our review, respondents identified 954 decisions that included activities in the wildland-urban interface and 169 decisions that included activities in inventoried roadless areas. Both types of decision were appealed at about the same rate, while decisions involving inventoried roadless areas were objected to at a slightly higher rate than those involving the wildland-urban interface. Table 6 shows, for both wildland-urban interface and inventoried roadless areas, the number and percentage of, and acreage associated with, appeals, objections, and litigation.
Decisions Involving Fuel Reduction Activities in the Wildland-Urban Interface and Inventoried Roadless Areas; the Number of Appeals, Objections, and Lawsuits on Those Decisions; and the Associated Acreage
Page 26 GAO-10-337 Forest Service

Table 6: Appeals, Objections, Exemptions, and Litigation of Decisions with Fuel Reduction Activities in the Wildland-Urban Interface and Inventoried Roadless Areas, and Associated Acreage, Fiscal Years 2006 through 2008
(Acres in thousands)
Decisions Wildland-urban
interface Inventoried
roadless areas
Total number of decisions 954 169
Total acreage 4,062 748
Appeals
Decisions subject to appeal 772 138
Number of decisions appealed 140 26
Percentage of appealable decisions appealed
18 19
Acreage subject to appeal 2,764 709
Acreage appealed 335 26
Percentage of appealable acreage appealed
12 4
Objections
Decisions subject to objection 113 22
Number of decisions objected to 45 11
Percentage of decisions objected to 40 50
Acreage subject to objection 1,249 36
Acreage objected to 159 14
Percentage of acreage objected to 13 39
Exempt decisions
Number of decisions exempt from appeal and objection
69 6
Percentage of decisions exempt from appeal and objection
7 4
Acreage exempt from appeal and objection 50 5
Percentage of acreage exempt from appeal and objection
1 1
Litigation
Number of decisions litigated 13 4
Percentage of decisions litigated 1 2
Acreage litigated 48 1
Percentage of acreage litigated 1 <1
Source: GAO analysis of survey results.
Page 27 GAO-10-337 Forest Service

Note: Numbers may not total due to rounding. Acreage data are not complete because some respondents did not report this information. In addition, depending on the status of the projects, some respondents reported the number of acres they planned to treat, while others reported the actual number of treated acres.
Appendix IX provides information on the number of decisions with fuel reduction activities in the wildland-urban interface and the number of appeals, objections, and lawsuits for such decisions in each Forest Service region; this appendix also contains information on the various definitions used by field managers in responding to our survey.
Regarding fuel reduction activities in inventoried roadless areas, the majority of decisions in our study involved no road construction in the roadless area––which is a primary concern related to hazardous fuel reduction activities in roadless areas. About 10 percent included temporary road construction or other road construction activity, with one decision involving the construction of a permanent road in an inventoried roadless area. Appendix IX provides information on the number of decisions with fuel reduction activities in inventoried roadless areas and the number of appeals, objections, and lawsuits for such decisions in each Forest Service region.
Much has changed since we last reported on appeals and litigation of fuel reduction activities 7 years ago. One of the most significant changes to the process has been the passage of HFRA, which has provided a new approach for public challenges of fuel reduction projects by allowing the opportunity to formally object to decisions before they become final, rather than waiting to file appeals until after the decisions are made. Although the passage of HFRA was seen as an important new tool for streamlining fuel reduction decisions, our review indicates that the impact of the act appears to be limited. Most notably, fuel reduction decisions that used HFRA authority represented less than 10 percent of decisions signed during fiscal years 2006 through 2008. As a result, despite the opportunities HFRA introduced for a new approach to the administrative review process, in practice most decisions remained subject to the Forest Service’s traditional postdecisional appeals process. In addition, although the agency’s expectation was that HFRA would reduce litigation of fuel reduction decisions, our review shows that HFRA and non-HFRA decisions were litigated at about the same rate of 2 percent.
Concluding Observations
Another area of ongoing change is the dispute over the Forest Service’s ability to exempt categorically excluded decisions from appeal. Although most of these decisions were subject to appeal during the years we
Page 28 GAO-10-337 Forest Service

examined, the Supreme Court’s 2009 ruling means that the regulation exempting categorically excluded decisions from appeal is once again in effect. However, two factors suggest ongoing uncertainty about this issue. First, the Supreme Court’s ruling was made on procedural grounds rather than on the merits of the case—meaning that the court did not rule on whether the regulation is consistent with the Appeals Reform Act, allowing for the possibility of future challenges to the regulation. Second, even though the regulation survived the recent lawsuit, the Forest Service is considering changes to it in light of, among other things, the litigation it has engendered. Thus, the ultimate fate of the regulation—and the public’s ability to appeal categorically excluded decisions—remains uncertain.
We provided a draft of this report to the Forest Service for comment. The Forest Service did not provide comments, although it did provide technical corrections which we incorporated as appropriate.
Agency Comments and Our Evaluation
We are sending copies of this report to the Secretary of Agriculture; the
Chief of the Forest Service; appropriate congressional committees; and other interested parties. The report also will be available at no charge on the GAO Web site at http://www.gao.gov.
If you or your staff members have questions about this report, please contact me at (202) 512-3841 or [email protected]. Contact points for our Offices of Congressional Relations and Public Affairs may be found on the last page of this report. Key contributors to this report are listed in
appendix XIII.
nu K. Mittal Director, Natural Resources and Environment A
Page 29 GAO-10-337 Forest Service

Appendix I: Objectives, Scope, and
Methodology
Page 30 GAO-10-337 Forest Service
Appendix I: Objectives, Scope, and Methodology
We examined (1) the number and type of Forest Service decisions involving hazardous fuel reduction activities signed in fiscal years 2006 through 2008; (2) the number of these decisions that were objected to, appealed, or litigated, and the acreage associated with those decisions; (3) the outcomes of these objections, appeals, and lawsuits, including whether they were processed within prescribed time frames, and the identities of the objectors, appellants, and plaintiffs; (4) the treatment methods and contract types associated with fuel reduction decisions, and how frequently the different methods and types were objected to, appealed, and litigated; and (5) the number of decisions involving hazardous fuel reduction activities in the wildland-urban interface (WUI) and inventoried roadless areas (IRA), and how frequently these decisions were objected to, appealed, and litigated. To address our objectives, we implemented a nationwide, Web-based survey of Forest Service officials, to collect information about all fuel reduction decisions signed in fiscal years 2006 through 2008 (See appendix XII for a copy of the survey). We supplemented the survey with a semistructured interview of officials in all nine Forest Service regions to gather additional details about time frames, outcomes and identities related to appeals and litigation of fuel reduction decisions. Details about this process are described below.
To identify Forest Service decisions involving hazardous fuel reduction activities signed in fiscal years 2006 through 2008, we asked the agency’s Ecosystem Management Coordinator to query a Forest Service database designed to track decision planning, appeals, and litigation for all Forest Service decisions—-the Planning, Appeals, and Litigation System (PALS). This official queried the PALS database using the following criteria: (1) decisions signed in fiscal years 2006 through 2008, and (2) decisions that included fuels management as a purpose and/or one or more fuel treatment activities. This initial query identified 1,437 decisions in 108 national forest system units.
Because PALS was not designed to include all information we sought as part of our review—including information on the number of acres treated, treatment methods and contract types used, and decisions involving activities in the wildland-urban interface or in inventoried roadless areas—we determined that a nationwide survey would be necessary. We began our survey effort by ensuring that we had identified the correct universe of fuel reduction decisions. After reviewing the list of fuel reduction decisions from PALS and correcting for any obvious duplication and other errors, we sent a list of each national forest’s fuel reduction decisions to the corresponding forest supervisor’s office. We asked the supervisor or cognizant official to verify the accuracy of our list, removing any decisions

Appendix I: Objectives, Scope, and
Methodology
that did not meet our criteria (i.e, that were not signed in fiscal years 2006 through 2008, or that did not involve any hazardous fuel reduction activities), and adding decisions that met our criteria but did not appear in PALS. At this time, we also asked the supervisor or cognizant official to identify Forest Service employees most knowledgeable about these decisions. A total of 1,415 decisions, issued by 108 national forests, were determined to fit our criteria. We gave recipients 3 weeks to respond to our request for information and granted extensions as needed. We obtained a 100 percent response rate from the national forests.
To determine the characteristics of each fuel reduction decision, we subsequently administered a Web-based survey to those Forest Service employees identified by each forest supervisor or cognizant official as most knowledgeable about the decisions at all 108 national forests that issued decisions with hazardous fuel reduction activities in fiscal years 2006 through 2008. Appendix XII contains a copy of the survey used to gather these data. The survey asked respondents to provide information about each of the decisions, including the type of environmental analysis used, acres involved, treatment methods and contract types used, the extent to which the decisions included activities in the wildland-urban interface and inventoried roadless areas, and detailed information about the outcomes of those decisions subject to the predecisional objection process.
The Forest Service does not have a uniform definition of a hazardous fuel reduction activity, a fact that could affect the information that forest managers reported to us. Many activities have the practical effect of reducing fuels, but their stated purpose may be for something other than, or in addition to, fuel reduction. For example, the cutting and gathering of firewood or forest products to provide a product to the public may have the additional benefit of reducing hazardous fuels. Some forest managers may have included such projects among the decisions they reported in their responses to our survey, while other forest managers with similar decisions may not have included them.
Similarly, there are a number of limitations to the acreage data. The data reported by forest managers include a mixture of planned, estimated, and actual treatment acres for decisions included in our review. In our survey, we did not limit responses to acres actually treated because once a decision is made and documented, there are many reasons that activities covered by the decision may be delayed or not implemented, including availability of funding or personnel, weather conditions, and administrative appeals or litigation. In addition, national forests may have
Page 31 GAO-10-337 Forest Service

Appendix I: Objectives, Scope, and
Methodology
submitted more than one decision with activities on the same area of land, or may have planned to use a series of different treatments on the same land. Therefore, the 10.5 million acres covered by decisions in our review may include overlapping acreage.
Because this was not a sample survey, there are no sampling errors. However, the practical difficulties of conducting any survey may introduce errors, commonly referred to as nonsampling errors. For example, differences in how a particular question is interpreted, in the sources of information that are available to respondents, or in how the data are entered into a database or were analyzed can introduce unwanted variability into the survey results. We took steps in the development of the survey, the data collection, and data analysis to minimize these nonsampling errors. For example, prior to developing the data collection instruments, we met with Forest Service personnel at the headquarters, regional, and national forest levels to discuss the Forest Service decision-making, appeal, objection, and litigation processes. We also reviewed current policies, legislation, and court cases that are relevant to our questions and the analysis of the survey responses. Survey specialists designed the questionnaire in conjunction with GAO staff with subject matter expertise. The draft survey was then pretested with officials from four national forests in four different regions to ensure that the questions were relevant, clearly stated, and easy to comprehend.
Upon receiving survey responses, we verified the accuracy of 5 percent of the surveys by comparing the responses to three survey questions against the decision documents used to complete the surveys, which were provided by respondents at our request. Using this approach, we verified 70 randomly selected decisions. Discrepancies between the survey responses and our data verification were discussed and resolved with the responsible forest official. In addition, we conducted follow-up to clarify ambiguous or incomplete responses that were identified through an internal logic test of all submitted responses. Through our data verification process, we determined that the data submitted were generally reliable.
To gather specific details about the outcomes of appeals and litigation, we conducted semistructured interviews with regional appeals and litigation officials in each of the Forest Service’s nine regions. The semistructured interviews were used to gather information about each of the decisions that were appealed or litigated, including related dates, status and outcomes of administrative and court decisions, and the identities of the appellants and litigants. Information collected through these semistructured interviews was also verified for a randomly selected
Page 32 GAO-10-337 Forest Service

Appendix I: Objectives, Scope, and
Methodology
sample of decisions. We verified the accuracy of about 10 percent of the appealed decisions and about 50 percent of the litigated decisions by comparing the information provided in response to several interview questions against the administrative and court decision documents provided to us by interviewees at our request. Any discrepancies between the interview responses and the documents provided were discussed and resolved with the responsible regional official. Through our data verification process, we determined that the data gathered during the semistructured interviews were generally reliable.
There are some limitations to the data we gathered. As with any survey, the information obtained from the national forests was self-reported, and we were not able to ensure that all decisions meeting our criteria were identified. In particular, we had no way to determine whether forests were fully reporting their hazardous fuel reduction activities. To get some indication of the completeness and accuracy of the data provided by Forest Service, we contacted several interest groups that, according to our data collection efforts, often appealed and objected to decisions or determinations. We asked these groups to verify the data pertaining to their appeals, objections, and litigation of Forest Service fiscal year 2006 through 2008 fuel reduction decisions and to identify any missing data. The groups generally agreed that the data provided by the agency were complete and accurate. In addition, during these interviews, we asked the groups for their perspectives on the administrative process for challenging decisions, including the objection process authorized under the Healthy Forests Restoration Act. The interviewees’ comments and perspectives are incorporated in this report.
We conducted our work from October 2008 through February 2010, in accordance with all sections of GAO’s Quality Assurance Framework that are relevant to our objectives. The framework requires that we plan and perform the engagement to obtain sufficient and appropriate evidence to meet our stated objectives and to discuss any limitations in our work. We believe that the information and data obtained, and the analysis conducted, provide a reasonable basis for any findings and conclusions in this product.
Page 33 GAO-10-337 Forest Service

Appendix II: Number of Fuel Reduction
Decisions and Associated Acreage, by Forest
Service Region
Appendix II: Number of Fuel Reduction Decisions and Associated Acreage, by Forest Service Region
Figure 2 shows, for each of the Forest Service’s nine regions, the number of fuel reduction decisions and the total associated acreage. As shown, the Southern Region (Region 8) had the largest number of decisions and the largest acreage, while the Alaska Region (Region 10) had the fewest decisions and the smallest acreage.
Page 34 GAO-10-337 Forest Service

Appendix II: Number of Fuel Reduction
Decisions and Associated Acreage, by Forest
Service Region
Figure 2: Number of Fuel Reduction Decisions and Associated Acreage, by Forest Service Region
AcresDecisionsNumber of decisions
17
132
79
333
0 80 160 240 320 400
14
151
85
2
50
0 80 160 240 320 400
179
60
117
0 80 160 240 320 400
8
157
1170
32
0 80 160 240 320 400
15251
161
8
67
0 80 160 240 320 400
8
180
1072
63
0 80 160 240 320 400
781,195
1,045072
Region 5
Region 4
Region 6
Regions
Region 1
Region 2
Region 3
Acres (in thousands)
0 900 1,800 2,700 3,600 4,500
211751
1000
440
0 900 1,800 2,700 3,600 4,500
53,114
7261
2,382
0 900 1800 2700 3600 4500
19251
168
063
0 900 1,800 2,700 3,600 4,500
72316
1073
134
0 900 1,800 2,700 3,600 4,500
0 900 1,800 2,700 3,600 4,500
58578
200
1319
Page 35 GAO-10-337 Forest Service

Appendix II: Number of Fuel Reduction
Decisions and Associated Acreage, by Forest
Service Region
AcresDecisionsNumber of decisionsRegions Acres (in thousands)
1344
2261
115
0 80 160 240 320 400
7
116
550
54
0 80 160 240 320 400
0
5
30
2
0 80 160 240 320 400
Region 8
Region 9
Region 10
Categorical exclusions (decision memo required)
Categorical exclusions (decision memo not required)
Environmental assessments
Environmental impact statements
Total
Source: GAO analysis of survey results.
1174,056
1,1300
2,806
0 900 1,800 2,700 3,600 4,500
26284
79
0179
0 900 1,800 2,700 3,600 4,500
02
101
0 900 1,800 2,700 3,600 4,500
Note: In Region 8, the decisions by decision type and acres do not match the sum for the total because for one decision, the respondent indicated that the decision did not fall within any of our survey selection categories. Also, acreage data are not complete because some respondents did not report this information. In addition, depending on the status of the projects, some respondents reported the number of acres they planned to treat, while others reported the actual number of treated acres.
Page 36 GAO-10-337 Forest Service

Appendix III: Number of Appeals, Objections,
and Lawsuits of Fuel Reduction Decisions, by
Forest Service Region
Appendix III: Number of Appeals, Objections, and Lawsuits of Fuel Reduction Decisions, by Forest Service Region
Figure 3 shows, for each of the Forest Service’s regions, information on appeals, objections, and litigation of fuel reduction decisions, including the total number of appeals, objections, and litigation and the percentage of decisions appealed, objected to, and litigated. The Southern Region (Region 8) had the highest combined total of decisions subject to appeal and objection; however, decisions in the Northern Region (Region 1) were challenged at the highest rate, considering both appeals and objections.
Page 37 GAO-10-337 Forest Service

Appendix III: Number of Appeals, Objections,
and Lawsuits of Fuel Reduction Decisions, by
Forest Service Region
Figure 3: Number of Decisions Subject to Appeal and Objection, and the Number and Frequency of Appeals, Objections, Exemptions, and Litigation, by Forest Service Region
Subject to appealAppealedLitigated
252525
Subject to objectionObjected to
ExemptLitigated
2525
2525
Subject to appealAppealedPercent appealed
1373727
Subject to objectionObjected toPercent objected to
15747
5364
ExemptPercent exemptLitigatedPercent litigated
252525
Subject to objectionObjected to
2525
2525
Subject to appealAppealedPercent appealed
66711
Subject to objectionObjected toPercent objected to
8338
5600
ExemptPercent exemptLitigatedPercent litigated
252525
Subject to objectionObjected to
2525
2525
Subject to appealAppealedPercent appealed
1222218
Subject to objectionObjected toPercent objected to
21629
8500
ExemptPercent exemptLitigatedPercent litigated
Region 4
Regions
Region 1
Region 2
Region 3
Total number of decisions 132
252525
Subject to objectionObjected to
Number of decisions
2525
2525
Total number of decisions 151
Total number of decisions 79
Subject to appealAppealedPercent appealed
1124036
Subject to objectionObjected toPercent objected to
151387
54118
Total number of decisions 157
Appeals Objections Exempt/Litigated
ExemptPercent exemptLitigatedPercent litigated
Page 38 GAO-10-337 Forest Service

Appendix III: Number of Appeals, Objections,
and Lawsuits of Fuel Reduction Decisions, by
Forest Service Region
Subject to appealAppealedLitigated
Subject to objectionObjected to
ExemptLitigated
Subject to appealAppealedPercent appealed
Subject to objectionObjected toPercent objected to
ExemptPercent exemptLitigatedPercent litigated
Subject to objectionObjected to
Subject to appealAppealedPercent appealed
Subject to objectionObjected toPercent objected to
ExemptPercent exemptLitigatedPercent litigated
Subject to objectionObjected to
Subject to appealAppealedPercent appealed
Subject to objectionObjected toPercent objected to
ExemptPercent exemptLitigatedPercent litigated
Regions
Subject to objectionObjected to
Number of decisions
Subject to appealAppealedPercent appealed
Subject to objectionObjected toPercent objected to
Appeals Objections Exempt/Litigated
ExemptPercent exemptLitigatedPercent litigated
1002424
9111
7633
3013110
1616
27810
22
1392115
191053
1232
239
2123517
16850
52
Region 9
Region 5
Region 6
Region 8
Total number of decisions 251
Total number of decisions 180
Total number of decisions 344
Total number of decisions 116
Page 39 GAO-10-337 Forest Service

Appendix III: Number of Appeals, Objections,
and Lawsuits of Fuel Reduction Decisions, by
Forest Service Region
Source: GAO analysis of survey and interview results.
Regions
Region 10
Total number of decisions 5
252525
Subject to objectionObjected to
Number of decisions
2525
2525
Subject to appealAppealedPercent appealed
200
Subject to objectionObjected toPercent objected to
200
12000
Appeals Objections Exempt/Litigated
ExemptPercent exemptLitigatedPercent litigated
Page 40 GAO-10-337 Forest Service

Appendix IV: Appeal Outcomes for Fuel
Reduction Decisions, by Forest Service
Region
Appendix IV: Appeal Outcomes for Fuel Reduction Decisions, by Forest Service Region
Figure 4 shows, for each Forest Service region, the outcomes of appeals filed on fuel reduction decisions within the region. While six of the eight regions reporting appeal activity allowed the majority of appealed decisions to proceed without changes, the Southwestern Region (Region 3) had no appealed decisions that were allowed to proceed without changes and the highest rate of reversed decisions.
Page 41 GAO-10-337 Forest Service

Appendix IV: Appeal Outcomes for Fuel
Reduction Decisions, by Forest Service
Region
Figure 4: Outcomes of Appeals of Fuel Reduction Decisions, by Forest Service Region
Region 1
Region 2
Region 3
Region 4
Region 5
Region 6
Regions Percent Dis
mis
sed
with
out r
evie
wR
esol
ved
inf
orm
ally
,
a
ppea
l
w
ithdr
awn
Res
olve
d i
nfor
mal
ly,
d
ecis
ion
with
draw
n
Affi
rmed
with
no
chan
geA
ffirm
ed w
ith
ins
truc
tions
Rev
erse
d
Number of appeal outcomes
52%
52% Affirmed with no change
12% Affirmed with instructions
13% Reversed
15% Dismissed without review
8% Resolved informally/decision withdrawn
0% Resolved informally/appeal withdrawn
31
7
8
9
5
0
14%
14%57%
57% Affirmed with no change
11% Affirmed with instructions
4% Reversed
14% Dismissed without review
14% Resolved informally/decision withdrawn
0% Resolved informally/appeal withdrawn
16
3
1
4
4
0
42%50%
0% Affirmed with no change
50% Affirmed with instructions
42% Reversed
8% Dismissed without review
0% Resolved informally/decision withdrawn
0% Resolved informally/appeal withdrawn
0
6
5
1
0
0
38%43%
43% Affirmed with no change
0% Affirmed with instructions
6% Reversed
38% Dismissed without review
6% Resolved informally/decision withdrawn
4% Resolved informally/appeal withdrawn
2% Unknown/no answer
20
0
3
18
3
2
61%
61% Affirmed with no change
12% Affirmed with instructions
8% Reversed
2% Dismissed without review
6% Resolved informally/decision withdrawn
10% Resolved informally/appeal withdrawn
30
6
4
1
3
5
54%
17%
54% Affirmed with no change
0% Affirmed with instructions
0% Reversed
17% Dismissed without review
25% Resolved informally/decision withdrawn
4% Resolved informally/appeal withdrawn
13
0
0
4
6
1
25%
Total number of appeals 60
Total number of appeals 28
Total number of appeals 12
Total number of appeals 47
Total number of appeals 49
Total number of appeals 24
Page 42 GAO-10-337 Forest Service

Appendix IV: Appeal Outcomes for Fuel
Reduction Decisions, by Forest Service
Region
Total number of appeals 0
Total number of appeals 33
Total number of appeals 45
Region 8
Region 9
Region 10
Regions Percent Dis
mis
sed
with
out r
evie
wR
esol
ved
inf
orm
ally
,
a
ppea
l
w
ithdr
awn
Res
olve
d i
nfor
mal
ly,
d
ecis
ion
with
draw
n
Affi
rmed
with
no
chan
geA
ffirm
ed w
ith
ins
truc
tions
Rev
erse
d
Number of appeal outcomes
64%
64% Affirmed with no change
0% Affirmed with instructions
3% Reversed
12% Dismissed without review
21% Resolved informally/decision withdrawn
0% Resolved informally/appeal withdrawn
21
0
1
4
7
0
21%
64%
64% Affirmed with no change
0% Affirmed with instructions
4% Reversed
27% Dismissed without review
4% Resolved informally/decision withdrawn
0% Resolved informally/appeal withdrawn
29
0
2
12
2
0
-% Affirmed with no change
-% Affirmed with instructions
-% Reversed
-% Dismissed without review
-% Resolved informally/decision withdrawn
-% Resolved informally/appeal withdrawn
0
0
0
0
0
0
27%
Source: GAO analysis of interview results.
Note: Numbers may not total because of rounding.
Page 43 GAO-10-337 Forest Service

Appendix V: Litigation Outcomes for Fuel
Reduction Decisions, by Forest Service
Region
Appendix V: Litigation Outcomes for Fuel Reduction Decisions, by Forest Service Region
Figure 5 shows, for each Forest Service region, the outcomes of litigation filed on fuel reduction decisions within the region. Six of the nine regions experienced litigation during the period covered by our survey. The Northern Region (Region 1) had the highest number of decisions judicially challenged as well as the greatest number of ongoing lawsuits.
Page 44 GAO-10-337 Forest Service

Appendix V: Litigation Outcomes for Fuel
Reduction Decisions, by Forest Service
Region
Figure 5: Outcomes of Litigation of Fuel Reduction Decisions, by Forest Service Region
Region 1
Region 2
Region 3
Region 4
Region 5
Region 6
Regions
Number of litigation outcomes
3
4
1
3
0
0
0
0
0
0
0
0
4
0
1
1
1
3
0
1
1
0
1
1
ContinuingSettledWon
by plaintiff
Won byForestService
Total number of litigated decisions 11
Total number of litigated decisions 0
Total number of litigated decisions 0
Total number of litigated decisions 6
Total number of litigated decisions 5
Total number of litigated decisions 3
Page 45 GAO-10-337 Forest Service
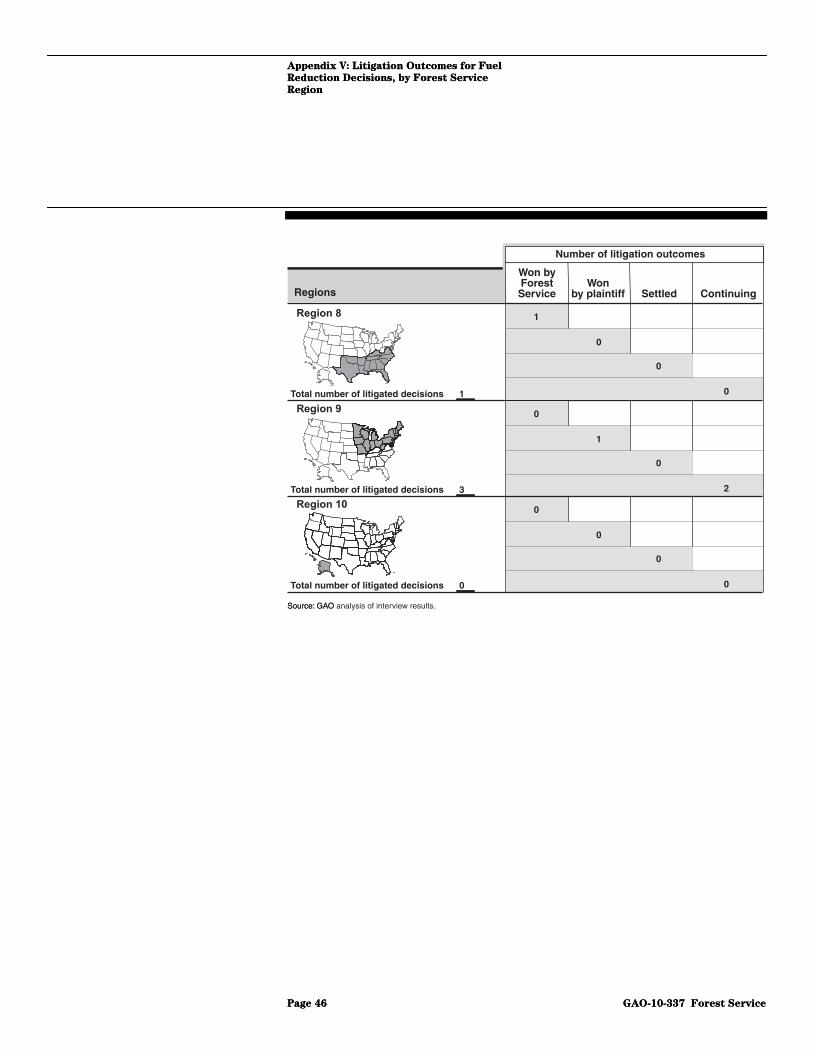
Appendix V: Litigation Outcomes for Fuel
Reduction Decisions, by Forest Service
Region
Appendix V: Litigation Outcomes for Fuel
Reduction Decisions, by Forest Service
Region
Page 46 GAO-10-337 Forest Service
Source: GAOSource: GAO analysis of interview results.
Region 8
Region 9
Region 10
Regions
Number of litigation outcomes
1
0
0
0
0
1
0
2
0
0
0
0
Total number of litigated decisions 1
Total number of litigated decisions 3
Total number of litigated decisions 0
ContinuingSettledWon
by plaintiff
Won byForestService
Page 46 GAO-10-337 Forest Service

Appendix VI: List of Appellants, Objectors
and Litigants, by Forest Service Region
Tables 7, 8, and 9 list, by Forest Service region, the appellants, objectors, and litigants of fuel reduction decisions. We list the identities of organizations filing appeals, objections, and litigation, but summarize data on individuals to protect their privacy. As shown, organizations were most active in the Northern Region (Region 1) for appeals, objections, and litigation. Individuals were likewise most active in the Northern Region for objections, but were most active in the Eastern Region (Region 9) for appeals and litigation.
Table 7: Appellants and Number of Appeals Filed, by Forest Service Region, Fiscal Years 2006 through 2008
Number of appeals by region
Organization filing appeals 1 2 3 4 5 6 8 9 10 Total
1 Alliance for the Wild Rockies 32 10 42
2 American Forest Resource Council 1 1 2
3 Attorney General, State of California 1 1
4 Bark 1 1
5 Biodiversity Conservation Alliance 11 11
6 California Forest Association 1 1
7 California Native Plants Society 1 1
8 Carson Forest Watch 1 1
9 Cascadia Wildlands Project 1 1
10 Center for Biological Diversity 1 3 1 1 6
11 Cherokee Forest Voices 3 3
12 Citizens Assisted Monitoring 1 1
13 Citizens for Better Forestry 2 2
14 Clinch Coalition 1 1
15 Colorado Wild 3 3
16 Conservation Congress 4 4
17 Defenders of Wildlife 1 1
18 Environmental Law & Policy Center 3 3
19 Environmental Protection Information Center 5 5
20 Ferry County Natural Resources Board 1 1
21 Forest Guardians 4 4
22 Forest Issues Group 4 4
23 Forest Legacy 1 1
24 Forest Service Employees for Environmental Ethics
1 1
25 Forests Forever 1 1
Appendix VI: List of Appellants, Objectors and Litigants, by Forest Service Region
Page 47 GAO-10-337 Forest Service

Appendix VI: List of Appellants, Objectors
and Litigants, by Forest Service Region
Number of appeals by region
Organization filing appeals 1 2 3 4 5 6 8 9 10 Total
26 Friends of Boundary Waters Wilderness 1 1
27 Friends of the Clearwater 8 1 9
28 Friends of the Wild Swan 1 1
29 Greater Yellowstone Coalition 2 2
30 Habitat Education Center 3 3
31 Heartwood 9 9
32 Heartwood, Inc. 1 1
33 Hells Canyon Preservation Council 4 4
34 Idaho Conservation League 5 1 6
35 Idaho Sporting Congress 2 3 5
36 Indiana Forest Alliance 1 1
37 Institute for Regeneration Agro Forestry 1 1
38 John Muir Project of the Earth Island Institute 12 12
39 Keep the Sespe Wild Committee 1 1
40 Kentucky Heartwood 1 1
41 Kerncrest Audubon Society 1 1
42 Klamath Forest Alliance 3 3
43 Klamath-Siskiyou Wildlands Center 5 1 6
44 Kootenai Environmental Alliance 4 4
45 Lassen Forest Preservation Group 1 1
46 League of Wilderness Defenders BMBP 6 6
47 Leech Lake Band of Ojibwe 1 1
48 Los Padres Forest Watch 2 2
49 Minnesota Forest Industries, Inc. 1 1
50 Montanans for Multiple Use 1 1
51 Native Ecosystems Council 12 1 13
52 Native Forest Network 1 1
53 New Mexico Wilderness Alliance 1 1
54 Newton County Wildlife Association 1 1
55 Northwoods Wilderness Recovery 1 1
56 not documented, unknown 1 1 2
57 Oregon Natural Resources Council 2 2
58 Oregon Wild 10 10
59 Ouachita Watch League 10 10
60 Plumas Forest Project 5 5
61 Prairie Hills Audubon Society 4 4
Page 48 GAO-10-337 Forest Service

Appendix VI: List of Appellants, Objectors
and Litigants, by Forest Service Region
Number of appeals by region
Organization filing appeals 1 2 3 4 5 6 8 9 10 Total
62 Protect Our Woods 1 1
63 Red Rock Forests 1 1
64 Santa Fe Forest Watch 2 2
65 Selkirk Conservation Alliance 4 4
66 Sequoia Forest Alliance 1 1
67 Sequoia Forest Keeper 1 1
68 Sierra Club 13 6 6 3 28
69 Sierra Forest Legacy 7 7
70 Sierra Nevada Forest Protection Campaign 4 4
71 Southern Appalachian Biodiversity Project 3 3
72 Swan View Coalition 1 1
73 The Clinch Coalition 1 1
74 The Ecology Center 6 6
75 The Lands Council 22 1 23
76 The Wilderness Society 1 1
77 Tree of Life Alliance 1 1
78 Tule River Conservancy 1 1
79 Utah Environmental Congress 19 19
80 Virginia Forest Watch 5 5
81 Western Watersheds Project 1 1
82 Wild Connections 1 1
83 Wild South 5 5
84 Wild Virginia 1 1
85 Wild Watershed 5 5
86 WildSouth 1 1
87 WildWest Institute 23 12 35
Total for organizational appellants 123 20 16 51 81 36 40 27 0 394
Total for individual appellants 6 13 7 6 5 1 8 33 0 79
Total for all appellants 129 33 23 57 86 37 48 60 0 473
Source: GAO analysis of interview results. Note: A decision can be appealed multiple times, and multiple appellants can be parties to an appeal. This table provides a list of the appellants who appeared in the 298 appeals of the 217 appealed decisions signed in fiscal years 2006 through 2008.
Page 49 GAO-10-337 Forest Service

Appendix VI: List of Appellants, Objectors
and Litigants, by Forest Service Region
Table 8: Objectors and Number of Objections Filed, by Forest Service Region, Fiscal Years 2006 through 2008
Number of objections by region
Organization filing objections 1 2 3 4 5 6 8 9 10 Total
1 Alliance For the Wild Rockies 3 3
2 American Forest Resource Council 1 1
3 Bark 1 1
4 Biodiversity Conservation Alliance 2 2
5 Center for Biological Diversity 3 1 3 7
6 Colorado Wild 2 2
7 Environmental Protection Information Center
1 1
8 Friends of the Bitterroot , Inc 1 1
9 Friends of the Wild Swan 1 1
10 Great Old Broads for Wilderness 1 1
11 Idaho Conservation League 5 3 8
12 Idaho Sporting Congress 1 1
13 Idaho Transportation Department 1 1
14 John Muir Project of Earth Island Institute 1 3 4
15 Klamath Forest Alliance 2 2
16 Klamath Riverkeeper 1 1
17 Klamath-Siskiyou Wildlands Center 2 2 4
18 Kootenai Environmental Alliance 3 3
19 League of Wilderness Defenders-Blue Mountains Biodiversity Project
1 1
20 Montana Logging Association 1 1
21 Montana Wood Products Association 1 1
22 Native Ecosystems Council 1 1
23 Oregon Natural Resources Council 4 4
24 Oregon Wild 3 3
25 Pacific Rivers Council and American Wildlands
1 1
26 Rocky Mountain Log Homes 1 1
27 Selkirk Conservation Alliance 1 1
28 Sierra Club 1 3 4
29 Sierra Nevada Forest Protection Campaign 1 1
30 Sinapu 1 1
31 South Carolina Native Plant Society 1 1
32 Southern Appalachian Biodiversity Project 1 1
Page 50 GAO-10-337 Forest Service

Appendix VI: List of Appellants, Objectors
and Litigants, by Forest Service Region
Number of objections by region
Organization filing objections 1 2 3 4 5 6 8 9 10 Total
33 The Lands Council 3 3
34 The Wilderness Society 2 2
35 Utah Environmental Congress 1 1
36 WildWest Institute 3 1 4
Native Forest Network 1 1
The Ecology Center 2 2
37 Wilderness Workshop 1 1
Total for organizational objectors 30 8 3 10 13 14 2 0 0 80
Total for individual objectors 28 3 0 3 2 4 0 1 0 41
Total for all identified objectors 58 11 3 13 15 18 2 1 0 121
Source: GAO analysis of survey results.
Note: Proposed decisions can be the subject of multiple objections, and multiple objectors can be parties to an objection. This table provides a list of the objectors who appeared in the 101 objections filed on 49 proposed decisions that were signed in fiscal years 2006 through 2008.
Table 9: Plaintiffs and Number of Lawsuits Filed, by Forest Service Region, Fiscal Years 2006 through 2008
Number of lawsuits by region
Plaintiff 1 2 3 4 5 6 8 9 10 Total
1 Alliance for the Wild Rockies 8 1 9
2 Bark 1 1
3 California Native Plant Society 1 1
4 Cascadia Wildlands 1 1
5 Citizens for Better Forestry 1 1
6 Conservation Congress 2 2
7 Earth Island Institute 3 3
8 Environmental Law & Policy Center 2 2
9 Friends of the Bitterroot, Inc 1 1
10 Friends of the Boundary Waters Wilderness
1 1
11 Habitat Education Center 2 2
12 Hell's Canyon Preservation Council 1 1
13 Klamath Forest Alliance 1 1
14 League of Wilderness Defenders - BMBP
1 1
15 Native Ecosystems Council 7 7
Page 51 GAO-10-337 Forest Service

Appendix VI: List of Appellants, Objectors
and Litigants, by Forest Service Region
Number of lawsuits by region
Plaintiff 1 2 3 4 5 6 8 9 10 Total
16 Northeastern Minnesotans for Wilderness
1 1
17 Oregon Wild 1 1
18 Sequoia Forest Keeper 1 1
19 Sierra Club 1 1 1 3
20 Sierra Forest Legacy 1 1
21 The Lands Council 1 1
22 The Wilderness Society 1 1
23 Utah Environmental Congress 1 1
24 WildWest Institute 3 4 7
Total for organizational plaintiffs 20 0 0 6 11 6 0 8 0 51
Total for individual plaintiffs 1 0 0 0 1 0 1 2 0 5
Total for all plaintiffs 21 0 0 6 12 6 1 10 0 56
Source: GAO analysis of interview results.
Note: Multiple parties may serve as plaintiffs on a single lawsuit. This table provides a list of the plaintiffs who appeared in the 29 lawsuits filed on decisions signed in fiscal years 2006 through 2008.
Page 52 GAO-10-337 Forest Service

Appendix VII: Fuel Reduction Treatment
Methods and Number of Appeals, Objections,
and Lawsuits, by Forest Service Region
Appendix VII: Fuel Reduction Treatment Methods and Number of Appeals, Objections, and Lawsuits, by Forest Service Region
Figure 6 shows, for each Forest Service region, the number of decisions using various fuel reduction treatment methods and the number and frequency of appeals, objections, and litigation by fuel reduction method. The rate at which treatment methods were used varied by region. For example, the Southern Region (Region 8) and the Eastern Region (Region 9) used prescribed burning more than any other treatment method, whereas the remaining regions used mechanical treatment the most. In addition, the Northern Region (Region 1) used commercial logging at a higher rate than any other region.
Page 53 GAO-10-337 Forest Service

Appendix VII: Fuel Reduction Treatment
Methods and Number of Appeals, Objections,
and Lawsuits, by Forest Service Region
Figure 6: Number of Decisions Subject to Appeal and Objection, and the Number and Frequency of Appeals, Objections, Exemptions, and Litigation, by Treatment Method and Forest Service Region
Con
stru
ctio
n
of f
uel b
reak
sC
hem
ical
/
her
bici
de
Com
mer
cial
log
ging
Live
stoc
k g
razi
ngO
ther
met
hod
Pres
crib
ed
bur
ning
Mec
hani
cal
tre
atm
ent
Regions
Region 1
132
Region 2
151
Region 3
79
Region 4
157
Region 5
251
Treatment method
1118
816
34
24
15
01
00
00
4
1
21
0
10
0
00
0
0
2722
2525
25
0
50
87
35
33
12
35
00
00
00
0
0
00
0
00
1
00
0
0
3843
3340
-
-
-
1114
513
77
27
02
00
43
03
0
1
00
0
00
0
10
1
0
6450
4054
-
0
-
1416
98
78
64
38
11
22
12
Subj
ect t
o a
ppea
l
8689
679
4
12
0
87109
3264
3
6
2
5454
1310
1
8
0
104104
1357
1
8
0
173191
5096
6
21
2
App
eale
d
3032
334
3
5
0
1722
1016
2
1
1
77
44
0
2
0
3125
727
0
4
0
3134
2130
5
2
00
0
00
0
00
0
0
Exem
pt
28
02
0
0
0
24
00
0
1
0
03
00
0
0
2
720
32
0
0
0<1
0
0
Litig
ated
1315
315
1113
313
22
02
88
18
0
2
00
2
00
1
02
1
0
8587
10087
-
100
-
33
03
0
1
0
1111
110
2
1
0
00
00
0
0
0
00
00
0
0
0
64
04
0
1
0
55
25
1
0
0
5050
6750
-
-
-
Perc
ent
app
eale
d
3536
5043
75
42
-
2020
3125
67
17
50
1313
3140
0
25
-
3024
5447
0
50
-
1818
4231
83
10
0
Subj
ect t
o o
bjec
tion
Obj
ecte
d t
o Perc
ent
obj
ecte
d to
Perc
ent
exe
mpt
Perc
ent
liti
gate
d
Number of decisions
Total numberof decisions
Total numberof decisions
Total numberof decisions
Total numberof decisions
Total numberof decisions
Page 54 GAO-10-337 Forest Service

Appendix VII: Fuel Reduction Treatment
Methods and Number of Appeals, Objections,
and Lawsuits, by Forest Service Region
Source: GAO analysis of survey results.
Con
stru
ctio
n
of f
uel b
reak
sC
hem
ical
/
her
bici
de
Com
mer
cial
log
ging
Live
stoc
k g
razi
ngO
ther
met
hod
Pres
crib
ed
bur
ning
Mec
hani
cal
tre
atm
ent
Regions
Region 6
180Total numberof decisions
Total numberof decisions
Total numberof decisions
Total numberof decisions
Region 8
344
Region 9
116
Region 10
5
1718
618
99
29
611
33
11
12
0
1
10
1
10
4
00
1
0
Treatment method
5350
3350
-
100
100
73
413
11
01
61
1<1
<10
<10
2
0
00
0
00
<1
00
0
0
1433
08
0
-
-
58
38
01
01
34
23
22
13
1
1
00
0
00
0
00
1
0
013
013
0
0
-
12
00
00
00
020
00
00
00
0
1
00
0
00
0
00
0
0
00
--
-
0
-
Subj
ect t
o a
ppea
l
105122
2284
2
11
0
25167
5894
28
0
0
8065
3162
5
11
3
02
00
0
1
0
App
eale
d
2020
421
1
1
0
3012
915
6
0
0
2115
615
1
3
1
00
00
0
0
0
Exem
pt
1019
56
0
7
0
215
32
0
1
0
45
24
0
0
0
01
00
0
0
0
Litig
ated
22
23
0
1
0
10
10
0
0
0
22
13
0
1
0
00
00
0
0
0
Perc
ent
app
eale
d
1916
1825
50
9
-
1218
1616
21
-
-
2623
1924
20
27
33
-0
--
-
0
-
Subj
ect t
o o
bjec
tion
Obj
ecte
d t
o Perc
ent
obj
ecte
d to
Perc
ent
exe
mpt
Perc
ent
liti
gate
d
Number of decisions
Notes: Hyphens represent zero divided by zero. Because decisions may involve multiple treatment methods, the sum of decisions involving each treatment method may exceed the total number of decisions for each region.
Page 55 GAO-10-337 Forest Service

Appendix VIII: Contract Types and Number of
Appeals, Objections, and Lawsuits, by Forest
Service Region
Appendix VIII: Contract Types and Number of Appeals, Objections, and Lawsuits, by Forest Service Region
Figure 7 shows, for each Forest Service region, the number of decisions using various contract types and the number and frequency of appeals, objections, and litigation by contract type. The use of different contract types varies among regions. The Eastern Region (Region 9) has the highest rate of commercial timber sale contract use compared with other regions, while the Rocky Mountain Region (Region 2) has the highest rate of stewardship contracting use.
Page 56 GAO-10-337 Forest Service

Appendix VIII: Contract Types and Number of
Appeals, Objections, and Lawsuits, by Forest
Service Region
Figure 7: Number of Decisions Subject to Appeal and Objection, and the Number and Frequency of Appeals, Objections, Exemptions, and Litigation, by Contract Type and Forest Service Region
Fore
st s
ervi
ce
per
sonn
el/
fo
rce
acco
unt
Fore
st p
rodu
ct
per
mits
Stew
ards
hip
con
trac
t
Oth
er m
echa
nism
Com
mer
cial
tim
ber s
ale
c
ontr
act
Serv
ice
con
trac
t
Regions
Region 1
132
Region 2
151
Region 3
79
Region 4
157
Region 5
251
Contract type
1715
1212
44
34
12
31
00
00
12
3
4
1
1
1
0
0
2427
2533
33
33
33
65
22
22
11
31
00
00
4
1
1
0
3
1
0
0
6767
3340
25
0
115
143
53
72
00
20
31
40
3
2
1
0
0
2
1
0
4560
5067
33
0
1010
134
44
52
24
7<1
22
2<1
Subj
ect t
o a
ppea
l
5970
9425
36
11
1425
523
24
11
5445
1169
23
10
87117
16746
41
5
App
eale
d1514
178
11
4
53
52
5
3
289
305
6
2
2725
2417
10
0
5
2
3
2
1
<1
Exem
pt
13
51
1
1
11
21
2
1
00
30
0
3
410
181
2
1
1
0
Litig
ated
00
00
0
0
00
00
0
0
52
60
2
0
54
41
3
0
4040
3850
60
100
Perc
ent
app
eale
d
104
88
92
67
21
30
53
73
2
1
1
1
0
0
2
0
9050
7588
50
100
6324
6823
7
5
288
2113
4
1
31
40
0
0
74
94
2
0
4433
3157
57
20
2520
1832
31
36
3612
1067
21
27
5220
2656
26
20
3121
1437
24
0
Subj
ect t
o o
bjec
tion
Obj
ecte
d t
o Perc
ent
obj
ecte
d to
Perc
ent
exe
mpt
Perc
ent
liti
gate
d
Number of decisions
Total numberof decisions
Total numberof decisions
Total numberof decisions
Total numberof decisions
Total numberof decisions
Page 57 GAO-10-337 Forest Service

Appendix VIII: Contract Types and Number of
Appeals, Objections, and Lawsuits, by Forest
Service Region
Source: GAO analysis of survey results.
Fore
st s
ervi
ce
per
sonn
el/
fo
rce
acco
unt
Fore
st p
rodu
ct
per
mits
Stew
ards
hip
con
trac
t
Oth
er m
echa
nism
Com
mer
cial
tim
ber s
ale
c
ontr
act
Serv
ice
con
trac
t
Regions
180
344
Region 8
Region 9
116
Region 10
5
Contract type
125
84
10
11
11
60
00
00
0
0
0
0
<1
<1
0
0
80
1325
-
-
72
82
10
10
31
60
21
20
0
1
0
0
1
1
0
0
140
130
-
0
01
10
00
00
020
00
00
00
0
0
0
0
0
0
0
0
-0
0-
-
-
Subj
ect t
o a
ppea
l
9751
2369
20
2
5926
7919
14
4
02
10
0
0
App
eale
d155
291
3
0
138
213
3
0
00
00
0
0
Exem
pt
23
220
1
1
41
70
1
1
01
00
0
0
Litig
ated
00
10
0
1
21
20
0
0
00
00
0
0
Region 6
Perc
ent
app
eale
d
1214
1410
67
76
36
101
21
10
3
0
1
0
2
2
1
0
5050
5060
33
-
7086
10932
31
6
2014
166
7
0
611
181
4
3
32
20
2
0
2916
1519
23
0
1510
1211
15
0
2231
2716
21
0
-0
0-
-
-
Subj
ect t
o o
bjec
tion
Obj
ecte
d t
o Perc
ent
obj
ecte
d to
Perc
ent
exe
mpt
Perc
ent
liti
gate
d
Number of decisions
Total numberof decisions
Total numberof decisions
Total numberof decisions
Total numberof decisions
Notes: Hyphens represent zero divided by zero. Because decisions may involve multiple contract types, the sum of decisions involving each type may exceed the total number of decisions for each region.
Page 58 GAO-10-337 Forest Service

Appendix IX: Fuel Reduction Decisions in the
Wildland-Urban Interface and Inventoried
Roadless Areas, by Forest Service Region
Appendix IX: Fuel Reduction Decisions in the Wildland-Urban Interface and Inventoried Roadless Areas, by Forest Service Region
In this appendix, Figures 8 and 9 provide information about appeals, objections, and litigation of fuel reduction activities in the wildland-urban interface and in inventoried roadless areas. Figure 8 shows, for each Forest Service region, the number of decisions with fuel reduction activities in the wildland-urban interface and the number and frequency of appeals, objections, and litigation of such decisions by region. The Southern Region (Region 8) had the most decisions in the wildland-urban interface, while the Northern Region (Region 1) had the highest number of appeals and objections of such decisions, and the highest rate at which decisions were challenged, considering both appeals and objections.
Page 59 GAO-10-337 Forest Service

Appendix IX: Fuel Reduction Decisions in the
Wildland-Urban Interface and Inventoried
Roadless Areas, by Forest Service Region
Figure 8: Number of Fuel Reduction Decisions in the Wildland-Urban Interface (WUI), and the Number and Frequency of Appeals, Objections, Exemptions, and Litigation, by Forest Service Region
Region 1
Regions
Total number of decisions 103
Region 2
Region 3
Total number of decisions 108
Total number of decisions 60
Region 4
Total number of decisions 104
25Subject to objectionObjected to
Subject to appealAppealedPercent appealed
842226
Subject to objectionObjected toPercent objected to
15747
5522
ExemptPercent exemptLitigatedPercent litigated
Subject to objectionObjected to
Subject to appealAppealedPercent appealed
49510
Subject to objectionObjected toPercent objected to
8338
3500
ExemptPercent exemptLitigatedPercent litigated
Subject to objectionObjected to
Subject to appealAppealedPercent appealed
871720
Subject to objectionObjected toPercent objected to
18422
3300
ExemptPercent exemptLitigatedPercent litigated
Subject to objectionObjected to
Number of WUI decisions
Subject to appealAppealedPercent appealed
853136
Subject to objectionObjected toPercent objected to
141286
4488
Appeals Objections Exempt/Litigated
ExemptPercent exemptLitigatedPercent litigated
Regional percentage of totalWUI decisions nationwide
11%
11%
6%
11%
Page 60 GAO-10-337 Forest Service

Appendix IX: Fuel Reduction Decisions in the
Wildland-Urban Interface and Inventoried
Roadless Areas, by Forest Service Region
Regions
Subject to appealAppealedPercent appealed
651320
Subject to objectionObjected toPercent objected to
9111
7900
ExemptPercent exemptLitigatedPercent litigated
Subject to objectionObjected to
Subject to appealAppealedPercent appealed
1892212
Subject to objectionObjected toPercent objected to
1517
22101<1
ExemptPercent exemptLitigatedPercent litigated
Subject to appealAppealedPercent appealed
68913
Subject to objectionObjected toPercent objected to
18950
111100
ExemptPercent exemptLitigatedPercent litigated
Subject to objectionObjected to
Number of WUI decisions
Subject to appealAppealedPercent appealed
1452114
Subject to objectionObjected toPercent objected to
14857
13822
Appeals Objections Exempt/Litigated
ExemptPercent exemptLitigatedPercent litigated
Regional percentage of totalWUI decisions nationwide
Region 5
Total number of decisions 172
18%
Region 6
Total number of decisions 97
Region 8
Region 9
Total number of decisions 226
Total number of decisions 81
10%
24%
8%
Page 61 GAO-10-337 Forest Service

Appendix IX: Fuel Reduction Decisions in the
Wildland-Urban Interface and Inventoried
Roadless Areas, by Forest Service Region
Source: GAOSource: GAO analysis of survey results.
Regions
Subject to objectionObjected to
Number of WUI decisions
Subject to appealAppealedPercent appealed
000
Subject to objectionObjected toPercent objected to
200
13300
Appeals Objections Exempt/Litigated
ExemptPercent exemptLitigatedPercent litigated
Regional percentage of totalWUI decisions nationwide
Region 10
Total number of decisions 3
<1%
According to survey respondents, over half of these decisions (696) contained definitions of wildland-urban interface that were based on the definition provided in the January 4, 2001, Federal Register as refined by HFRA. HFRA Section 101 (16) defines wildland-urban interface as an area within or adjacent to a community that is identified as at risk in a community wildfire protection plan.1 In addition, for areas for which a community wildfire protection plan is not in effect, the definition in HFRA includes areas (1) extending 1/2 mile from the boundary of an at-risk community, or (2) within 1 1/2 miles of the boundary of an at-risk community, including any land that has for example, a sustained steep slope, a geographic feature that could help when creating an effective
1Under HFRA Section 101(1), an at-risk community is one that is an interface community as defined in the Federal Register notice of January 4, 2001 (66 FR 753), or a group of homes and other structures with basic infrastructure and services (such as utilities and collectively maintained transportation routes) in or adjacent to federal land; has conditions conducive to a large-scale wildland fire; and faces a significant threat to human life or property as a result of a wildland fire. HFRA defines a community wildfire protection plan as a plan that is developed primarily by state and local agencies in consultation with interested parties and federal land management agencies, and that identifies and prioritizes areas in and near a community for fuel reduction treatments and recommends the types of treatments to be used.
Page 62 GAO-10-337 Forest Service

Appendix IX: Fuel Reduction Decisions in the
Wildland-Urban Interface and Inventoried
Roadless Areas, by Forest Service Region
firebreak, or Condition Class 3 land,2 or (3) is adjacent to an evacuation route.3 Further, while many additional survey respondents who did not select this definition provided their own definition of wildland-urban interface, we found that 36 such respondents had definitions very similar to that contained in HFRA.
Other respondents said they defined wildland-urban interface as it is referenced in their forests’ National Forest Land Management Plans. Others said they used a combination of definitions from multiple sources. For example, in the Pacific Southwest Region, several wildland-urban interface definitions were based on both the Federal Register and their forests’ National Forest Land Management Plans. Still others defined wildland-urban interface as an area within some distance from private land, or private lands with structures. The remaining respondents either said they did not have a definition for wildland-urban interface (14) or did not know the definition they used to identify the wildland-urban interface (49).
Figure 9 shows, for each Forest Service region, the number of decisions with fuel reduction activities in inventoried roadless areas and the number and frequency of appeals, objections, and litigation of such decisions by region. The Intermountain Region (Region 4) had the most decisions with activities occurring in inventoried roadless areas and also the highest number of appeals, objections, and cases litigated. However, the Pacific Northwest Region (Region 6) had the highest rate at which decisions were challenged, considering both appeals and objections.
2The term “condition class 3” with respect to an area of federal land refers to the condition class description developed by the Rocky Mountain Research Station in the report Development of Coarse-Scale Spatial Data for Wildland Fire and Fuel Management, GTR RMRS-87 (Fort Collins, Colorado, U.S. Department of Agriculture, Forest Service Rocky Mountain Research Station: April 2002).
3There is no distance limitation for evacuation routes.
Page 63 GAO-10-337 Forest Service

Appendix IX: Fuel Reduction Decisions in the
Wildland-Urban Interface and Inventoried
Roadless Areas, by Forest Service Region
Figure 9: Number of Fuel Reduction Decisions in Inventoried Roadless Areas (IRA), and the Number and Frequency of Appeals, Objections, Exemptions, and Litigation, by Forest Service Region
Region 1
Regions
Total number of decisions 17
Region 2
Region 3
Total number of decisions 30
Total number of decisions 12
Region 4
Total number of decisions 71
Subject to appealAppealedLitigated
252525
Subject to objectionObjected to
ExemptLitigated
2525
2525
Subject to appealAppealedPercent appealed
611016
Subject to objectionObjected toPercent objected to
8563
2334
ExemptPercent exemptLitigatedPercent litigated
252525
Subject to objectionObjected to
2525
2525
Subject to appealAppealedPercent appealed
11218
Subject to objectionObjected toPercent objected to
100
0000
ExemptPercent exemptLitigatedPercent litigated
252525
Subject to objectionObjected to
2525
2525
Subject to appealAppealedPercent appealed
24521
Subject to objectionObjected toPercent objected to
6117
0000
ExemptPercent exemptLitigatedPercent litigated
252525
Subject to objectionObjected to
Number of IRA decisions
2525
2525
Subject to appealAppealedPercent appealed
13323
Subject to objectionObjected toPercent objected to
4375
0016
Appeals Objections Exempt/Litigated
ExemptPercent exemptLitigatedPercent litigated
Regional percentage of totalIRA decisions nationwide
10%
18%
7%
42%
Page 64 GAO-10-337 Forest Service

Appendix IX: Fuel Reduction Decisions in the
Wildland-Urban Interface and Inventoried
Roadless Areas, by Forest Service Region
Regions
Subject to appealAppealedLitigated
252525
Subject to objectionObjected to
ExemptLitigated
2525
2525
Subject to appealAppealedPercent appealed
400
Subject to objectionObjected toPercent objected to
000
0000
ExemptPercent exemptLitigatedPercent litigated
252525
Subject to objectionObjected to
2525
2525
Subject to appealAppealedPercent appealed
12217
Subject to objectionObjected toPercent objected to
000
1800
ExemptPercent exemptLitigatedPercent litigated
252525
Subject to objectionObjected to
2525
2525
Subject to appealAppealedPercent appealed
3133
Subject to objectionObjected toPercent objected to
22100
53000
ExemptPercent exemptLitigatedPercent litigated
252525
Subject to objectionObjected to
Number of IRA decisions
2525
2525
Subject to appealAppealedPercent appealed
9333
Subject to objectionObjected toPercent objected to
000
0000
Appeals Objections Exempt/Litigated
ExemptPercent exemptLitigatedPercent litigated
Regional percentage of totalIRA decisions nationwide
Region 5
Total number of decisions 9
Region 6
Total number of decisions 10
Region 8
Region 9
Total number of decisions 13
Total number of decisions 4
5%
6%
8%
2%
Page 65 GAO-10-337 Forest Service

Appendix IX: Fuel Reduction Decisions in the
Wildland-Urban Interface and Inventoried
Roadless Areas, by Forest Service Region
Source: GAOSource: GAO analysis of survey results.
Regions
252525
Subject to objectionObjected to
Number of IRA decisions
2525
2525
Subject to appealAppealedPercent appealed
100
Subject to objectionObjected toPercent objected to
100
13300
Appeals Objections Exempt/Litigated
ExemptPercent exemptLitigatedPercent litigated
Regional percentage of totalIRA decisions nationwide
Region 10
Total number of decisions 3
2%
Page 66 GAO-10-337 Forest Service

Appendix X: Types of Categorical Exclusions
Authorized by the Forest Service and
Represented in the GAO Survey
Appendix X: Types of Categorical Exclusions Authorized by the Forest Service and Represented in the GAO Survey
A categorical exclusion (CE) is a category of actions for which neither an environmental assessment nor an environmental impact statement is required because the agency has determined that it does not individually or cumulatively have a significant effect on the quality of the human environment.1 Agencies develop a list of categorical exclusions specific to their operations when they develop or revise their implementing procedures for the National Environmental Policy Act (NEPA), in accordance with the Council on Environmental Quality’s NEPA regulations.
When the Forest Service determines that activities of a proposed decision fall within a category of activities the agency has already determined have no significant environmental impact, it approves it using one of the predetermined categorical exclusions established by the Secretary of Agriculture or the Chief of the Forest Service.2 Table 10 shows the types and frequency of categorical exclusions reported in our survey. They are divided into two types: those that require the agency to prepare a decision memo for each action approved using a categorical exclusion, and those that do not require such documentation.3
Table 10: Types of Categorical Exclusions Authorized for Use by the Forest Service and Represented in the GAO Survey
CE number CE description Total number
in GAO survey
Categorical exclusions established by the Secretary, Department of Agriculture, not requiring a decision memo
1 Policy development 0
2 Program funding 0
3 Inventories, research activities, and studies 1
4 Educational and Informational Programs 0
5 Law enforcement 0
140 C.F.R. § 1508.4.
2HFRA, Title IV—Insect Infestations and Related Diseases—also authorizes categorical exclusions for applied silvicultural assessments and research treatments provided the total number of acres does not exceed 250,000. Decisions authorized under Title IV are not subject to the predecisional administrative review process, but are subject to the notice, comment, and appeals process found in 36 C.F.R. 215.
3While a decision memo is not required for certain categories, one may be prepared at the discretion of the responsible Forest Service official. For more information, see GAO, Forest
Service: Use of Categorical Exclusions for Vegetation Management Projects, Calendar
Years 2003 through 2005, GAO-07-99 (Washington, D.C.: Oct. 10, 2006).
Page 67 GAO-10-337 Forest Service

Appendix X: Types of Categorical Exclusions
Authorized by the Forest Service and
Represented in the GAO Survey
CE number CE description Total number
in GAO survey
6 Legal counsel and representation 0
7 Trade and market development abroad 0
Categorical exclusions established by the Chief of the Forest Service not requiring a decision memo
1 Short-term resource protection, public health, and safety 1
2 Agencywide administrative rules, regulations, and policies 0
3 Repair and maintenance of administrative sites 11
4 Repair and maintenance of road, trails, and landline boundaries 6
5 Repair and maintenance of recreation sites and facilities 9
6 Acquisition of land or a land interest 2
7 Land or resource sales or exchanges 0
8 Approving, modifying or continuing minor, short-term special uses of Forest Service lands
3
9 Issuance of a ski area permit 0
10 Amending or replacing an existing special-use authorization 0
Categorical exclusions established by the Chief of the Forest Service requiring a decision memo
1 Construction and reconstruction of trails 1
2 Construction and reconstruction of utilities 0
3 Approval, modification, or continuation of minor special uses 0
4 Reserved N/A
5 Regeneration of native tree species 21
6 Timber stand and/or wildlife habitat improvement 454
7 Modification or maintenance of stream or aquatic habitat improvement structures
2
8 Short-term mineral, energy, or geophysical investigations 0
9 Allotment improvements 0
10 Hazardous fuel reduction activities 379
11 Postfire rehabilitation activities 4
12 Harvest of live trees 38
13 Salvage of dead and/or dying trees 64
14 Harvest of trees to control insects or disease 18
15 Issuance of a new special use authorization 0
16 Land management plans, amendments, and revisions 0
17 Approval of oil and gas exploration plans 0
Categorical exclusion established by HFRA not requiring a decision memo
No number Applied silvicultural assessments and research treatments 1
Sources: (1) Forest Service National Environmental Policy Act Handbook, Chapter 30–Categorical Exclusion from Documentation. April 15, 2009; (2) 16 U.S.C. § 6554(d)(1); and (3) GAO data (see citations above).
Page 68 GAO-10-337 Forest Service

Appendix XI: Major Litigation Affecting
Appeal Procedures for Categorical Exclusions
Appendix XI: Major Litigation Affecting Appeal Procedures for Categorical Exclusions
A summary of the major litigation that affected the exemption of categorical exclusions from the requirements of the National Environmental Policy Act process is shown in table 11. Starting in late 2003, these exemptions were challenged in court and were the subject of a Supreme Court ruling. Table 12 summarizes the litigation centered specifically on the validity of the Hazardous Fuel Reduction categorical exclusion, or Fuels CE, also known as CE #10.
Table 11: A Chronology of Litigation Concerning Regulation Exempting Decisions That Have Been Categorically Excluded from Appeals
Date Major events
June 4, 2003 Forest Service published a final rule revising appeal procedures that, among other things, exempted decisions using categorical exclusions from appeal (CE appeals exemption).
June 5, 2003 Forest Service action created a new categorical exclusion for certain fuel reduction activities (Fuels CE).
September 8, 2003 Forest Service issued its Burnt Ridge Project decision memo approving a timber sale and treatment of 238 acres of postfire forest area, using the Fuels CE and the CE appeals exemption.
December 1, 2003 Earth Island filed a complaint against the Forest Service that, among other things, challenged the CE appeals exemption nationwide and as applied to the Burnt Ridge Project, arguing that the exemption violated the Appeal Reform Act. The Forest Service later withdrew the Burnt Ridge Project.
July 7, 2005 Federal district court invalidated the CE appeals exemption. Earth Island v. Pengilly, 376 F.Supp.2d 994 (E.D.Cal.2005).
September 16, 2005 District court clarified that the scope of the injunction was nationwide, precluding any enforcement and implementation of the invalidated regulations. The district court further clarified that the injunction would apply only prospectively, to decisions made after the July 7, 2005 order date.
August 10, 2006 Ninth Circuit affirmed the district court’s invalidation of the CE appeals exemption and the nationwide injunction against its enforcement. Earth Island v. Ruthenbeck, 459 F.3d 954 (9th Cir. 2006), amended 490 F.3d 687 (2007).
March 3, 2009
In a 5-4 decision the Supreme Court reversed the Ninth Circuit, holding that because the Forest Service had withdrawn the Burnt Ridge Project, the plaintiffs lacked standing to challenge portions of the 36 C.F.R. appeal regulations that exempted categorical exclusions from notice, comment, and appeal. Summers v. Earth Island Institute, 555 U.S. ___, 129 S.Ct. 1142-50 (2009).
Source: GAO analysis of relevant court cases.
Page 69 GAO-10-337 Forest Service

Appendix XI: Major Litigation Affecting
Appeal Procedures for Categorical Exclusions
Table 12: A Chronology of Litigation Concerning the Validity of the Fuels CE
Date Major events
June 5, 2003 Forest Service action created a new categorical exclusion for certain fuel reduction activities (Fuels CE).
October 8, 2004 Sierra Club challenged the Fuels CE as applied to several projects in the Eldorado and Lassen National Forests, arguing, among other things, that the CE inappropriately included activities that have significant effects.
September 16, 2005 Federal district court rejected the Sierra Club’s challenge, holding that the Forest Service provided reasoned explanations for its conclusion that the category of actions covered by the Fuels CE would not normally have a significant impact on the environment. Sierra Club v. Bosworth, 2005 WL 2281074 (E.D.Cal.).
December 5, 2007 Ninth Circuit held that the Forest Service failed to assess properly the significance of the hazardous fuels reduction categorical exclusion and thus it failed to demonstrate that it made a reasoned decision to promulgate the Fuels CE based on relevant factors and information. Accordingly, the court held that the agency’s promulgation of the Fuels CE was arbitrary and capricious. Sierra Club v. Bosworth, 510 F.3d 1016 (9th Cir. 2007).
Source: GAO analysis of relevant court cases.
Page 70 GAO-10-337 Forest Service

Appendix XII: Survey Questions to National
Forests
Appendix XII: Survey Questions to National Forests
Page 71 GAO-10-337 Forest Service

Appendix XII: Survey Questions to National
Forests
Page 72 GAO-10-337 Forest Service

Appendix XII: Survey Questions to National
Forests
Page 73 GAO-10-337 Forest Service

Appendix XII: Survey Questions to National
Forests
Page 74 GAO-10-337 Forest Service

Appendix XII: Survey Questions to National
Forests
Page 75 GAO-10-337 Forest Service

Appendix XII: Survey Questions to National
Forests
Page 76 GAO-10-337 Forest Service

Appendix XII: Survey Questions to National
Forests
Page 77 GAO-10-337 Forest Service

Appendix XII: Survey Questions to National
Forests
Page 78 GAO-10-337 Forest Service

Appendix XII: Survey Questions to National
Forests
Page 79 GAO-10-337 Forest Service

Appendix XII: Survey Questions to National
Forests
Page 80 GAO-10-337 Forest Service

Appendix XII: Survey Questions to National
Forests
Page 81 GAO-10-337 Forest Service

Appendix XII: Survey Questions to National
Forests
Page 82 GAO-10-337 Forest Service

Appendix XII: Survey Questions to National
Forests
Page 83 GAO-10-337 Forest Service

Appendix XII: Survey Questions to National
Forests
Page 84 GAO-10-337 Forest Service

Appendix XII: Survey Questions to National
Forests
Page 85 GAO-10-337 Forest Service

Appendix XII: Survey Questions to National
Forests
Page 86 GAO-10-337 Forest Service

Appendix XII: Survey Questions to National
Forests
Page 87 GAO-10-337 Forest Service

Appendix XII: Survey Questions to National
Forests
Page 88 GAO-10-337 Forest Service

Appendix XII: Survey Questions to National
Forests
Page 89 GAO-10-337 Forest Service

Appendix XII: Survey Questions to National
Forests
Page 90 GAO-10-337 Forest Service

Appendix XIII:
A
GAO Contact and Staff
cknowledgments
Page 91 GAO-10-337 Forest Service
Appendix XIII: GAO Contact and Staff Acknowledgments
Anu K. Mittal, 202-512-3841 or [email protected]
In addition to the individual named above, Steve Gaty (Assistant Director), Ulana Bihun, Sandra Davis, Justin Fisher, Cathy Hurley, Richard P. Johnson, Stuart Kaufman, Armetha Liles, Diane Lund, Robin Nazzaro, Alison O’Neill, and Shana Wallace made key contributions to this report.
GAO Contact
Staff Acknowledgments
(361012)

GAO’s Mission The Government Accountability Office, the audit, evaluation, and investigative arm of Congress, exists to support Congress in meeting its constitutional responsibilities and to help improve the performance and accountability of the federal government for the American people. GAO examines the use of public funds; evaluates federal programs and policies; and provides analyses, recommendations, and other assistance to help Congress make informed oversight, policy, and funding decisions. GAO’s commitment to good government is reflected in its core values of accountability, integrity, and reliability.
The fastest and easiest way to obtain copies of GAO documents at no cost is through GAO’s Web site (www.gao.gov). Each weekday afternoon, GAO posts on its Web site newly released reports, testimony, and correspondence. To have GAO e-mail you a list of newly posted products, go to www.gao.gov and select “E-mail Updates.”
Obtaining Copies of GAO Reports and Testimony
Order by Phone The price of each GAO publication reflects GAO’s actual cost of production and distribution and depends on the number of pages in the publication and whether the publication is printed in color or black and white. Pricing and ordering information is posted on GAO’s Web site, http://www.gao.gov/ordering.htm.
Place orders by calling (202) 512-6000, toll free (866) 801-7077, or TDD (202) 512-2537.
Orders may be paid for using American Express, Discover Card, MasterCard, Visa, check, or money order. Call for additional information.
Contact:
Web site: www.gao.gov/fraudnet/fraudnet.htm E-mail: [email protected] Automated answering system: (800) 424-5454 or (202) 512-7470
Ralph Dawn, Managing Director, [email protected], (202) 512-4400 U.S. Government Accountability Office, 441 G Street NW, Room 7125 Washington, DC 20548
To Report Fraud, Waste, and Abuse in Federal Programs
Congressional Relations
Chuck Young, Managing Director, [email protected], (202) 512-4800 U.S. Government Accountability Office, 441 G Street NW, Room 7149 Washington, DC 20548
Public Affairs
Please Print on Recycled Paper