u.s. forest products annual market review and prospects ... · the lower rate of growth in the u.s...
TRANSCRIPT

U.S. Forest Products Annual Market Review and Prospects, 2010–2014 James L. HowardDavid B. McKeever
Research NoteFPL–RN–0331
United States Department of Agriculture
Forest Service
Forest ProductsLaboratory
September2014
September 2014
Howard, James L.; McKeever, David B. 2014. U.S. forest products annual market review and prospects, 2010–2014. Research Note FPL-RN-0331. Madison, WI: U.S. Department of Agriculture, Forest Service, Forest Prod-ucts Laboratory. 11 p.
A limited number of free copies of this publication are available to the public from the Forest Products Laboratory, One Gifford Pinchot Drive, Madison, WI 53726–2398. This publication is also available online at www.fpl.fs.fed.us. Laboratory publications are sent to hundreds of libraries in the United States and elsewhere.
The Forest Products Laboratory is maintained in cooperation with the University of Wisconsin.
The use of trade or firm names in this publication is for reader information and does not imply endorsement by the United States Department of Agriculture (USDA) of any product or service.
The USDA prohibits discrimination in all its programs and activities on the basis of race, color, national origin, age, disability, and where applicable, sex, marital status, familial status, parental status, religion, sexual orienta-tion, genetic information, political beliefs, reprisal, or because all or a part of an individual’s income is derived from any public assistance program. (Not all prohibited bases apply to all programs.) Persons with disabilities who require alternative means for communication of program informa-tion (Braille, large print, audiotape, etc.) should contact USDA’s TARGET Center at (202) 720–2600 (voice and TDD). To file a complaint of discrimi-nation, write to USDA, Director, Office of Civil Rights, 1400 Independence Avenue, S.W., Washington, D.C. 20250–9410, or call (800) 795–3272 (voice) or (202) 720–6382 (TDD). USDA is an equal opportunity provider and employer.
AbstractThis paper describes the current state of the U.S. economy and provides general and statistical information on forest products markets in terms of production, trade, consump-tion, and prices. Market developments are described for sawn softwood, sawn hardwood, softwood log trade, wood-based panels, paper and paperboard, fuelwood, forest product prices, and housing starts. Policy initiatives that can affect domestic markets and international trade in wood products are also discussed in some detail. Data are pro-vided through the end of 2012, with estimates for 2013 and forecasts for 2014.
Keywords: production, trade, prices, forest products
AcknowledgmentThis publication contains contributions from Jesslyn Whitfield, Economics Assistant, who organized and compiled much of the data contained in this report.
ContentsExecutive Summary ...........................................................1
General Economic and Major Market Trends ....................2
Timber Products Production, Trade, and Consumption .....3
Statistics and Prospects ..................................................3
U.S. Wood Product Market Shares ................................3
Energy Policy Initiatives ....................................................9
Wood Energy .................................................................9
Biomass Energy .............................................................9
Summary of Timber Products and Energy Policy ........ 10
Conclusion ....................................................................... 10
Sources of Informaiton .................................................... 10

U.S. Forest Products Annual Market Review and Prospects, 2010–2014James L. Howard, EconomistDavid B. McKeever, Research ForesterForest Products Laboratory, Madison, Wisconsin USA
Executive SummaryEconomic activity in the United States exhibited continued weakness during the third quarter of 2013, and the outlook for growth in 2014 is weaker than previously forecast. This outlook is confirmed by the decline in the estimated annual rate of real gross domestic product (GDP) to 1.5% in 2013, down from the previously expected 2.0%. Economic activity during the fourth quarter of 2013 is projected to increase to an annual rate of 2.3%. The rate of growth in the U.S. econ-omy will likely increase slightly in the first half of 2014 and then flatten out as predicted by the 41 forecasters surveyed by the Federal Reserve Bank (FRB) of Philadelphia (2013). The lower rate of growth in the U.S. economy predicted for 2014 results partly from declining growth in exports for the U.S. economy as Europe cuts imports. Indications are that global trade is flat, dimming prospects that exports will buoy the U.S. economy in the coming months as net exports remain at about $450 billion quarterly. Growth in U.S. real output looks weaker and inflation low over the near term, compared with previous estimates. Forecasters, as expected, see a slight decline in the 2013 unemployment rate, measured on an annual-average basis. Unemployment is expected to fall from 7.4% in the third quarter of 2013 to 7.2% in the first quarter of 2014, while a decline to 7.3 % in the fourth quarter of 2013 was expected. Unemployment rate was 8.1% at the beginning of 2012 and could have been larger because many unemployed simply stopped looking for work. Forecasters see prices unchanged in the third quar-ter of 2013, which is a slightly lower rate than previously expected, and then staying flat in the fourth quarter of 2013 and into 2014. The housing recovery, exceedingly stronger during the first eight months of 2013 than a year ago as new and existing home sales increased in August, seems to be maintaining momentum. While still remaining close to his-toric lows, new-home sales grew in August, with expecta-tions for continued improvement into 2014 (NAHB 2013a). August housing starts were also encouraging, jumping 7.0% from July. The increase came mostly from the single-family sector, which the industry finds encouraging. Even though the government shutdown was brief, the housing market is expected to be collateral damage from budget wrangling in the U.S. Capital. Consumer sentiment is plunging, and un-certainty is not good for potential home buyers.
Growth in the housing sector is having a positive effect on softwood lumber consumption through 2013. According to the Western Wood Products Association (WWPA), during the first eight months of 2013, softwood lumber consump-tion increased 8.6% from the same period in 2012, and ship ments of softwood lumber from western mills increased 7.9% during the first eight months of 2013 compared with the same period in 2012. The Southern region continues to have the highest levels of production and shipments of softwood lumber on a volume basis, while the West leads in production and shipments of softwood lumber on a percent-age basis.
Total structural panel production increased 6.8% over the first three quarters of 2013 compared with the first three quarters of 2012 (APA October 2013). For the first nine months of 2013, structural panel production was up about 974 million cubic meters compared with the same time pe-riod in 2012. Structural panel consumption at the end of the third quarter of 2013 was 1.5 million cubic meters above the same time period of a year ago, representing a 9.3% increase for the first three quarters in 2013. Overall, structural panel consumption is expected to increase to 23.0 million cubic meters in 2013 (Adair 2013).
Roundwood production for pulp and wood-based panel mills was 137 million cubic meters in 2012, up slightly from 2011. Roundwood pulpwood consumption is expected to increase during 2013. Pulpwood supplied from residues should continue to increase in 2013 relative to roundwood because of an improving housing market and wood prod-ucts industry. An opposing view suggests declining residual production that could result from competition for residuals for pellets and biomass. If the decline in pulpwood supplied from residues occurs, it would not be because of preference on the part of pulp producers.
U.S. timber exports to China were strong during the first eight months of 2013, as both softwood lumber and soft-wood log exports to China are above levels of a year ago. Mills in the Pacific Northwest, such as Weyerhaeuser and Plum Creek Timber, are benefiting the most from the 2013 surge. China’s demand for wood is being fueled by demand for nonresidential construction, which has remained strong.
The U.S. furniture industry, in retreat since 1999, was up 4.7% during the first eight months of 2013 compared with

Research Note FPL–RN–0331
2
a year ago. The domestic industry market share continues to erode because of low-cost furniture imports, a sluggish global economy, and a need for the industry to become more consumer-focused. Employment in the domestic furni ture industry has fallen more than 50% since 1999.
General Economic and Major Market TrendsAccording to 41 forecasters surveyed by the Federal Re-serve Bank of Philadelphia (2013), the U.S. economy is expected to grow at a slower rate during the third quarter of 2013 than during the second quarter, and expectations for a fouth quarter rebound are slim. Forecasters expect real gross domestic product (GDP) to grow at an annual rate of 1.5% in 2013. Continued pessimism about the labor market ac-companies the outlook for weaker output growth. Measured on an annual-average basis, unemployment is expected to average 7.5% in the third quarter before declining to 7.3% in the fourth quarter of 2013, with the fourth quarter revised lower, for an average of 7.5% in 2013. The 41 forecasters expect unemployment to improve to 7.1% in 2014. This de-cline in unemployment equates to nonfarm payroll employ-ment growing at a rate of 183,800 jobs per month during 2013 and 180,100 jobs per month during 2014. On an annual-average basis, forecasters expect job gains of 169,400 per month during the third quarter of 2013 and 178,600 in the fourth quarter 2013. During the Great Recession from 2007 to 2009, the impact on the job market was 8 million jobs lost in the worst economic downturn since the 1930s Great Depression. Almost every sector ex-perienced job cuts: construction lost 2 million jobs, financial services lost 800,000 jobs, and the auto sector lost thousands of jobs. About 7 million adults were already looking for full-time employment before the recession hit in December 2007. The U.S. economy must create about 125,000 new jobs per month just to keep up with population growth and to prevent unemployment from rising. The strength of GDP growth will be the major determinant of when the U.S. economy reaches full employment. With strong GDP growth, full employment could be reached in 4 years. But if GDP growth is weak, reaching full employment could take 10 years.
Core inflation, as measured by the Price Index for personal consumption expenditures, is expected to average 1.3% in 2013 and rise slightly to 1.8% into 2014. On an annual-average over annual-average basis, inflation in the core consumer Price index is projected to remain around 1.8% in 2013 before increasing to 2.0% in 2014 (Federal Reserve Bank of Philadelphia 2013).
New housing construction showed improvement during the third quarter of 2013, when 891,000 units were started in August at a seasonally adjusted rate (NAHB 2013a). The increase was due mainly to gains of single-family starts, which jumped to 628,000 units, up 7% from July. All four
regions of the United States contributed to the increase in the level of housing starts during the first three quarters of 2013. Single family starts in the West jumped 17.5% after declining 8.0% in July. After declining in the first quarter, starts in the Northeast are still on pace to exceed the 2012 level for third-quarter starts. After two months of falling starts, the Midwest and South saw starts rise in August. The South is the largest region for multifamily starts, and the annual rate increased 48.8% in August. The West region also experienced significant increases in August. Single-family building permits in August increased from 609,000 in July to 627,000 in August, a 3.0% increase. The increase in starts reported in the Northeast and Midwest coincided with increases in permits of 10.0% and 4.3%, respectively. The South experienced a decrease in building permits of 46,000 in August from July. New single-family units com-pleted increased in August by 0.5%, from 570,000 in July to 573,000 in August. Total housing starts for 2012 were 781 thousand units, and expectations for 2013 are for sig-nificant improvement.
In August 2013, the total value of all new construction in the United States was $915 billion, $61 billion above the annual 2012 value of $854 billion (NAHB 2013a). The seasonally adjusted annual rate for the total value of new construction was above the 2012 annual rate for each month through Au-gust in 2013. Residential construction was $340 billion in August 2013, $53 billion above the $287 billion annual rate of residential construction in 2012. Nonresidential construc-tion was $300 billion in 2013, 4% above the $288 billion during August 2012. Public construction in 2013 accounted for nearly 30% of all construction. The National Association of Home Builders 2013 forecast calls for the housing sector to improve in the fourth quarter, and starts and sales overall for 2013 will end the year above 2012 levels.
With a large forest resource and high production and con-sumption of wood products, the United States continues to play an important role in world forest product markets. For the past two years the U.S. role on the world stage has improved as a result of the ongoing recovery in the wood segment of America’s economy, precipitated by the rise in residential construction and production of building materi-als. The United States is a world leader in the consumption of paper and paperboard (about 74 million metric tons in 2012), which is mostly supplied by domestic production and imports from Canada (AF&PA 2013). Domestic paper and paperboard production for the first nine months of 2013 was about 0.2% below the production for the first nine months of 2012. The U.S. solid wood industry manufactured about 62 million cubic meters of lumber and 17 million cubic me-ters of structural panel products in 2012. For the first eight months of 2013, softwood lumber production was 5.6% above 2012 production, and for the first eight months of 2013, structural panel consumption was 9.3% above 2012 levels. The U.S. forest products industry’s annual harvest

U.S. Forest Products Annual Market Review and Prospects, 2010–2014
3
was 371 million cubic meters in 2012, exceeding the 361 million cubic meters harvested in 2011. Domestic roundwood timber harvest in 2013 that supports domestic consumption is expected to be above the 2012 harvest level.
Expenditures for residential repair and remodeling fell in 2012 to $116 billion, down 38% from the record high years of 2006 and 2007. The recovery in the housing market is also reflected in residential remodeling, averaging $130 mil-lion monthly for the first three quarters of 2013. In 2007 the U.S. Department of Commerce stopped collecting residen-tial repair and remodeling data. Estimates for 2012 and 2013 presented here are Forest Service estimates based on private residential construction expenditures. The National Associa-tion of Home Builders Remodeling Market Index (RMI) climbed to 57.0 in the third quarter 2013, up from 50.0 in the second quarter of 2012. This index level is above the record level in 2004 prior to the housing market crash. Dur-ing this same period, new residential construction exhibited strengthening and continues to do so into the third quarter of 2013. Since 2000, expenditures for maintenance and repairs to all existing residential properties have averaged about 25% of total expenditures, with the remaining 75% for improvements. Given the unprecedented levels of U.S. home foreclosures in recent years, residential improvements and repairs may be an even bigger part of the economy than usual. Many foreclosed homes need significant maintenance to become marketable. Expectations are for continued and growing investments in existing residential properties.
The three major indicators of demand for wood products—furniture and related products, paper products output, and total industrial production—were higher during the first eight months of 2013 relative to 2012.
Industrial production, an important demand determinant for pallet lumber, containerboard, and some grades of paper, increased 2.3% during the first eight months of 2013 when compared to the annual level for 2012.
Furniture and related products output, a determinant of high-grade lumber production, was up during the first eight months of 2013 by 1.4%.
Paper products output, a determinant of pulpwood and wood residue use and recycled fiber availability and use, increased during the first eight months of 2013 compared with the 2012 average. The index (2007 = 100) of paper products output for the first eight months of 2013 was 2.3% above the 2012 average for the comparable time period.
In summary, the housing sector gained strength during the first three quarters of 2013 and is expected to continue to improve the fourth quarter of 2013; this strength is expected to continue into 2014. Starts in 2013 will probably exceed year-ago levels significantly. With the slow rate of growth in GDP, most analysts predicted that conditions favorable to growth of timber markets would not occur until the second half of 2013, and those predictions have held true, although 2013 has been a good year overall. Selected U.S. economic indicators are shown in Table 1.
Timber Products Production, Trade, and ConsumptionStatistics and ProspectsProspects for wood and wood products are shown in Table 2. All volumes are reported in 1,000 cubic meters. Data for 2013 are preliminary estimates, data for 2014 are forecasts.
U.S. Wood Product Market SharesSolid wood products production and foreign trade data are collected annually by governmental agencies and industry associations. This information provides an overview of how robust the wood using sectors of the U.S. economy are and how their performance has changed over time (Howard 2013). However, it does not provide detailed information
Table 1—Selected U.S. economic indicators, 2010–2014.Actuala Estimateb Forecastc
Indicator 2010 2011 2012 2013 2014 Gross domestic product (billion 2005 dollars) 13,063 13,299 13,593 13,706 14,001 New housing starts (million units) 0.587 0.609 0.781 0.924 1.197 Mobile home shipments (thousand units) 50 51 55 57 59 Total residential fixed investment (billion 2005 dollars) 332.2 327.6 367.1 404.6 422.4 Total nonresidential fixed investment (billion 2005 dollars) 1,268.5 1,378.2 1,487.9 1,520.6 1,562.8 Total industrial production (Index: 2007=100) 90.6 93.6 97.1 99.4 102.6 Furniture and related products (Index: 2002 = 100) 73.0 65.0 69.0 70.0 72.0 Paper products (Index: 2002 = 100) 80.0 83.0 84.0 86.0 88.0 aBoard of Governors of the Federal Reserve System. 2013, Council of Economic Advisors. 2013, National Association of Home Builders. Nov, 2013a, U.S. Department of Commerce, Bureau of the Census. 2013. bForest Service estimates based on 2012 actual data and preliminary 2013 data. cNational Association of Home Builders. 2013b, Survey of Professional Forecasters and Forest Service estimates.

Research Note FPL–RN–0331
4
Table 2–Prospects and statistics for wood and wood products, 2012-2014a
Sawn softwood Oriented strandboard (OSB)
2012 2013 2014 2012 2012 2014 Production 48,035 48,776 49,022 Production 9,768 9,780 9,802 Imports 16,768 16,800 17,000 Imports 2,990 2,995 3,000 Exports 2,688 2,701 2,744 Exports 335 340 350 Consumption 62,115 62,875 63,278 Consumption 12,423 12,435 12,452
Coniferous logs Particleboard
2012 2013 2014 2012 2013 2014 Production 117,002 119,031 120,008 Production 3,760 3,820 3,853 Imports 1,601 1,666 1,805 Imports 529 545 550 Exports 6,102 5,900 5,986 Exports 63 60 65 Consumption 112,501 114,797 115,827 Consumption 4,226 4,305 4,338
Sawn hardwood Medium density fiberboard (MDF)
2012 2013 2014 2012 2013 2014 Production 14,632 14,882 14,901 Production 2,886 2,886 2,900 Imports 595 600 615 Imports 881 881 890 Exports 2,574 2,580 2,601 Exports 620 620 640 Consumption 12,653 12,902 12,915 Consumption 3,147 3,147 3,150
Hardwood logs Insulation board
2012 2013 2014 2012 2013 2014 Production 30,881 31,622 31,706 Production 2,755 2,755 2,755 Imports 229 240 265 Imports 150 177 177 Exports 962 980 1,001 Exports 129 140 140 Consumption 30,148 30,882 30,970 Consumption 2,776 2,792 2,792
Coniferous plywood Roundwood pulpwood
2012 2013 2014 2012 2013 2014 Production 8,125 8,266 8,301 Production 137,494 137,820 138,721 Imports 2,449 2,501 2,566 Imports 533 548 566 Exports 908 940 965 Exports 446 463 475 Consumption 9,666 9,827 9,902 Consumption 137,581 137,905 138,812
Non-coniferous plywood Hardboard
2012 2013 2014 2012 2013 2014 Production 1,418 1,492 1,509 Production 649 655 660 Imports 2,303 2,388 2,397 Imports 180 185 185 Exports 176 192 201 Exports 227 239 240 Consumption 3,545 3,688 3,705 Consumption 602 601 605 aAll volumes are reported in 1,000 cubic meters. Figures for 2013 are Forest Service linear extrapolated estimates, 2014 are Forest Service linear extrapolated forecasts when industry forecasts are unavailable. rRevised.

U.S. Forest Products Annual Market Review and Prospects, 2010–2014
5
specific to individual end-use markets needed to further evaluate changing patterns of consumption. End-use mar-kets of interest include new single family, multifamily, and mobile home construction, repair and remodeling of exist-ing residential structures, low-rise nonresidential building and other types of nonresidential construction, furniture and other manufactured wood products, and packaging and ship-ping. These end-use markets typically account for 80% to 90% of all solid wood products consumption. Market share estimates presented here are based on findings from limited public and private research reports that were related to more readily available, annual economic indicator data specific to each end-use market. Consumption was then balanced over all end uses, and market shares were developed. These estimates provide a consistent, reliable look at solid wood products markets in the United States (McKeever and How-ard 2011).
Table 3 presents annual balanced wood products consump-tion by end use for sawn wood, structural panels, and non-structural panels for the period 2007 to 2012, with prelimi-nary estimates for 2013 and forecasts for 2014. Estimates for 2007 to 2012 have been revised from previously pub-lished reports to account for revised and more recent data. Figure 1 shows market shares for all solid wood products combined for the same time period.
Sawn Softwood
Housing and other construction markets started off strong in 2013 and strengthened into the third quarter 2013. The housing market is likely to finish the year at a slightly higher level than recorded a year ago. The housing sector is im-proving as evidenced by its overall increasing market share and is having a positive effect on softwood lumber con-sumption (Fig. 1, Table 3). According to the Western Wood Products Association (WWPA), during the first eight months of 2013, softwood lumber consumption increased 8.6% from the same period last year, and shipments of softwood lumber from western mills also increased 9.0% during the first eight months of 2013 compared with the same period in 2012 (WWPA 2013). Production increased 3.6% during this period in the South. Apparent consumption for the first eight months of 2013 was 45.2 million cubic meters, 7.9% above the 41.6 million cubic meters for the first eight months of 2012. As predicted, the U.S. housing construction industry grew over the first half of 2013. Timber production as a result of a strengthening domestic market continued to in-crease in 2013 slightly above the 2012 timber growth level. Softwood production through the first eight months of 2013 was 34.2 million cubic meters, which was up 5.3% com-pared with the first eight months of 2012, when 32.4 million cubic meters of sawn softwood were produced. Production of sawn softwood for 2013 is forecast to exceed 2012 lev-els and then continue to rebound with a gradual increase in 2014.
Sawn softwood imports increased 13.8% during the first eight months of 2013 relative to the same time period a year ago. The volume of Canadian imports, which constituted 90% of all sawn softwood imports, increased by 13.0% over this period. Total sawn softwood imports were 16.8 million cubic meters in 2012.
During the first eight months of 2013, U.S. sawn softwood exports increased 8.9% compared with exports for the same period in 2012. Exports to Canada increased by 3.0%, whereas exports to China increased 25.6 % and exports to Mexico decreased 2.0%.
Sawn Hardwood
Sawn hardwood production is expected to increase to 14.9 million cubic meters in 2013. Imports in 2013 are ex-pected to increase from a year earlier. Given the increase in U.S. production and imports as well as a strengthening housing market, apparent consumption for 2013 is forecast to exceed the 2012 volume.
Softwood Log Trade
Softwood log exports to China increased by 30% over the first eight months of 2013 when compared with exports in the same period of 2012. Softwood log exports to Canada increased by 3.9% in the same period. Softwood log exports to all other countries increased by 2.3% during the first eight months of 2013 compared with the same time period of a year ago. Fueling the increase in softwood log exports especially during the third quarter of 2013 is the increased exports to China as China’s economy enters a period of expansion. Most of the increase has been centered in the Pacific Northwest. Overall, the volume of U.S. logs shipped to China rose by more than 10 times, from 256,000 cubic meters in 2007 to an estimated 2.2 million cubic meters in 2012, or about 7% of the region’s total log production. U.S. softwood log imports decreased by 24.1% over the first eight months of 2013 compared with a year earlier. During 2012, the timber harvest surpassed the 2011 harvest, and the forecast calls for a further rise in harvest in 2013.
5
15
25
35
45
2007 2008 2009 2010 2011 2012 2013 2014
Con
sum
ptio
n (%
)
New housingResidential repair and remodelingNonresidentialManufacturing, packaging, and shippingOther
Figure 1—Solid wood timber products consumption market shares, 2007–2014.
Research Note FPL–RN–0331
6
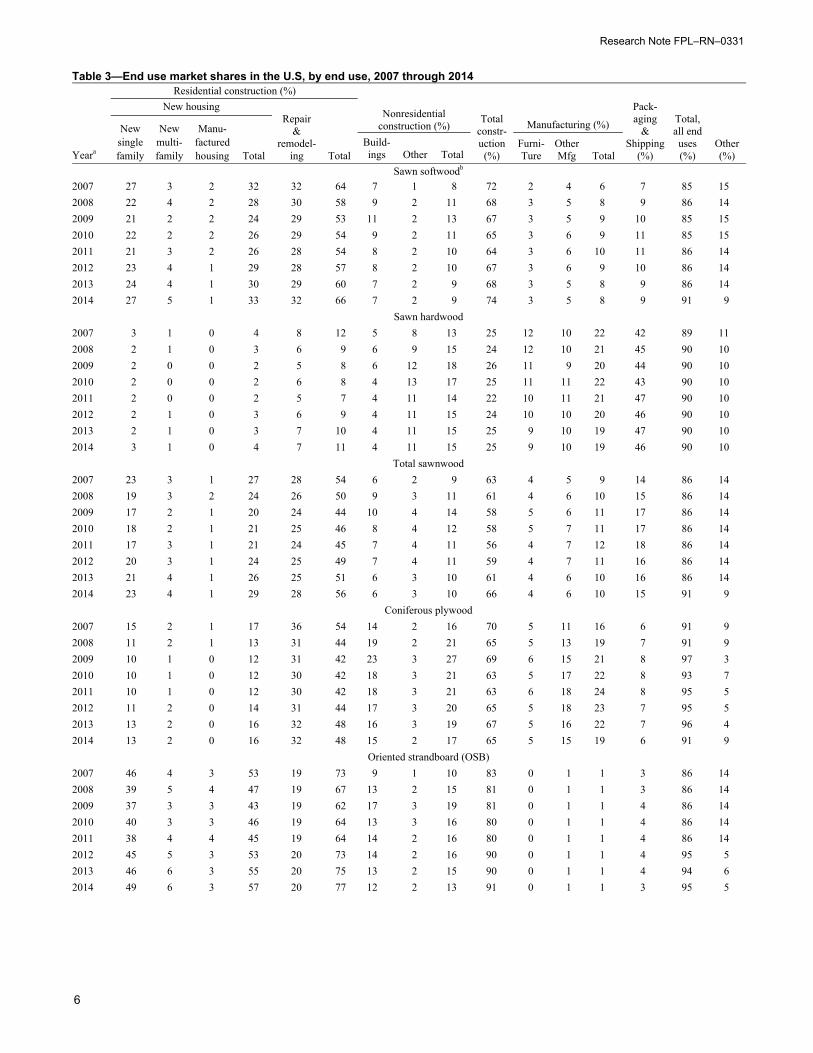
Table 3—End use market shares in the U.S, by end use, 2007 through 2014 Residential construction (%)
Nonresidential construction (%) Manufacturing (%)
Pack-aging
&Shipping
(%)
Total,all end uses(%)
New housing Repair
&remodel-
ing Total
Totalconstr-uction(%)
Other(%)
New singlefamily
New multi- family
Manu-facturedhousing Total
Build- ings Other Total
Furni-Ture
Other Mfg Total Yeara
Sawn softwoodb
2007 27 3 2 32 32 64 7 1 8 72 2 4 6 7 85 15 2008 22 4 2 28 30 58 9 2 11 68 3 5 8 9 86 14 2009 21 2 2 24 29 53 11 2 13 67 3 5 9 10 85 15 2010 22 2 2 26 29 54 9 2 11 65 3 6 9 11 85 15 2011 21 3 2 26 28 54 8 2 10 64 3 6 10 11 86 14 2012 23 4 1 29 28 57 8 2 10 67 3 6 9 10 86 14 2013 24 4 1 30 29 60 7 2 9 68 3 5 8 9 86 14 2014 27 5 1 33 32 66 7 2 9 74 3 5 8 9 91 9 Sawn hardwood 2007 3 1 0 4 8 12 5 8 13 25 12 10 22 42 89 11 2008 2 1 0 3 6 9 6 9 15 24 12 10 21 45 90 10 2009 2 0 0 2 5 8 6 12 18 26 11 9 20 44 90 10 2010 2 0 0 2 6 8 4 13 17 25 11 11 22 43 90 10 2011 2 0 0 2 5 7 4 11 14 22 10 11 21 47 90 10 2012 2 1 0 3 6 9 4 11 15 24 10 10 20 46 90 10 2013 2 1 0 3 7 10 4 11 15 25 9 10 19 47 90 10 2014 3 1 0 4 7 11 4 11 15 25 9 10 19 46 90 10 Total sawnwood 2007 23 3 1 27 28 54 6 2 9 63 4 5 9 14 86 14 2008 19 3 2 24 26 50 9 3 11 61 4 6 10 15 86 14 2009 17 2 1 20 24 44 10 4 14 58 5 6 11 17 86 14 2010 18 2 1 21 25 46 8 4 12 58 5 7 11 17 86 14 2011 17 3 1 21 24 45 7 4 11 56 4 7 12 18 86 14 2012 20 3 1 24 25 49 7 4 11 59 4 7 11 16 86 14 2013 21 4 1 26 25 51 6 3 10 61 4 6 10 16 86 14 2014 23 4 1 29 28 56 6 3 10 66 4 6 10 15 91 9 Coniferous plywood 2007 15 2 1 17 36 54 14 2 16 70 5 11 16 6 91 9 2008 11 2 1 13 31 44 19 2 21 65 5 13 19 7 91 9 2009 10 1 0 12 31 42 23 3 27 69 6 15 21 8 97 3 2010 10 1 0 12 30 42 18 3 21 63 5 17 22 8 93 7 2011 10 1 0 12 30 42 18 3 21 63 6 18 24 8 95 5 2012 11 2 0 14 31 44 17 3 20 65 5 18 23 7 95 5 2013 13 2 0 16 32 48 16 3 19 67 5 16 22 7 96 4 2014 13 2 0 16 32 48 15 2 17 65 5 15 19 6 91 9 Oriented strandboard (OSB) 2007 46 4 3 53 19 73 9 1 10 83 0 1 1 3 86 14 2008 39 5 4 47 19 67 13 2 15 81 0 1 1 3 86 14 2009 37 3 3 43 19 62 17 3 19 81 0 1 1 4 86 14 2010 40 3 3 46 19 64 13 3 16 80 0 1 1 4 86 14 2011 38 4 4 45 19 64 14 2 16 80 0 1 1 4 86 14 2012 45 5 3 53 20 73 14 2 16 90 0 1 1 4 95 5 2013 46 6 3 55 20 75 13 2 15 90 0 1 1 4 94 6 2014 49 6 3 57 20 77 12 2 13 91 0 1 1 3 95 5

U.S. Forest Products Annual Market Review and Prospects, 2010–2014
7
Hardwood Log Trade
Hardwood log exports increased by 2.2% and imports rose by 38.9% during 2012 compared with 2011. Canada tradi-tionally provides about 95% of U.S. imports. The trend in hardwood log exports was up from a year ago through the first eight months of 2013. Hardwood log imports were also up slightly through the first eight months of 2013 compared with 2012.
Pulpwood
Roundwood production for pulp and wood-based panel mills was 137 million cubic meters in 2012, up slightly from 2011. Roundwood pulpwood consumption is expected to de-crease during 2013 as indicated by a 0.2 % decline in paper-board production over the first eight months of 2013. Pulp-wood supplied from residues continued to decrease relative to roundwood. This is a result of declining residual produc-tion and competition for residuals for pellets and biomass and not out of preference on the part of pulp producers. The residue portion of pulpwood was 59.4 million cubic meters in 2012, unchanged from 2011 (Howard 2013). Trade pat-terns have continued to have a significant effect on paper and paperboard production and have affected pulpwood use, but the significant decline in U.S. paper and board production and consumption that occurred over the past decade was largely due to a downturn in consumer spend-ing associated with the U.S. and global recession. Exports
of paper, paperboard, and converted products increased by 1.0% to 13.9 million metric tons, while imports of paper and paperboard decreased by 3.5% to 9.3 million metric tons in 2011. Paper and paperboard production decreased by 0.7 % in 2012, falling to 73.4 million metric tons. The production of paper and paperboard in 2013 is forecast to be roughly the same as 2012 production, as reflected in the annual year to date rate for September 2013 of 60.8 million metric tons, which is down 0.2% from 2012 when paper and paperboard was produced at a level of 60.9 million metric tons. Paper and paperboard imports were at an annual rate in September of 9.1 million metric tons which is down 5.8% from last year.
Structural Panels
Structural panel production in 2012 was 5.9% above that of 2011, while consumption was 6.7% above consumption in 2011 (APA 2013). Structural panel production at the end of the third quarter of 2013 was 14.4 million cubic meters, which is above the first three quarters of 2012. Overall, structural panel production is expected to decrease to 21.0 million cubic meters in 2013 (Adair 2013). Structural panel market shares were negatively affected by the recent economic downturn. New residential construction, which in 2006, captured 46% of all structural panel consumption, fell to 35% in 2011 and is expected to continue recovering in 2013 (Table 3)
Table 3—End use market shares in the U.S, by end use, 2007 through 2014 Residential construction (%)
Nonresidential construction (%) Manufacturing (%)
Pack-aging
&Shipping
(%)
Total,all end uses(%)
New housing Repair
&remodel-
ing Total
Totalconstr-uction(%)
Other(%)
New singlefamily
New multi- family
Manu-facturedhousing Total
Build- ings Other Total
Furni-Ture
Other Mfg Total Yeara
Sawn softwoodb
2007 27 3 2 32 32 64 7 1 8 72 2 4 6 7 85 15 2008 22 4 2 28 30 58 9 2 11 68 3 5 8 9 86 14 2009 21 2 2 24 29 53 11 2 13 67 3 5 9 10 85 15 2010 22 2 2 26 29 54 9 2 11 65 3 6 9 11 85 15 2011 21 3 2 26 28 54 8 2 10 64 3 6 10 11 86 14 2012 23 4 1 29 28 57 8 2 10 67 3 6 9 10 86 14 2013 24 4 1 30 29 60 7 2 9 68 3 5 8 9 86 14 2014 27 5 1 33 32 66 7 2 9 74 3 5 8 9 91 9 Sawn hardwood 2007 3 1 0 4 8 12 5 8 13 25 12 10 22 42 89 11 2008 2 1 0 3 6 9 6 9 15 24 12 10 21 45 90 10 2009 2 0 0 2 5 8 6 12 18 26 11 9 20 44 90 10 2010 2 0 0 2 6 8 4 13 17 25 11 11 22 43 90 10 2011 2 0 0 2 5 7 4 11 14 22 10 11 21 47 90 10 2012 2 1 0 3 6 9 4 11 15 24 10 10 20 46 90 10 2013 2 1 0 3 7 10 4 11 15 25 9 10 19 47 90 10 2014 3 1 0 4 7 11 4 11 15 25 9 10 19 46 90 10 Total sawnwood 2007 23 3 1 27 28 54 6 2 9 63 4 5 9 14 86 14 2008 19 3 2 24 26 50 9 3 11 61 4 6 10 15 86 14 2009 17 2 1 20 24 44 10 4 14 58 5 6 11 17 86 14 2010 18 2 1 21 25 46 8 4 12 58 5 7 11 17 86 14 2011 17 3 1 21 24 45 7 4 11 56 4 7 12 18 86 14 2012 20 3 1 24 25 49 7 4 11 59 4 7 11 16 86 14 2013 21 4 1 26 25 51 6 3 10 61 4 6 10 16 86 14 2014 23 4 1 29 28 56 6 3 10 66 4 6 10 15 91 9 Coniferous plywood 2007 15 2 1 17 36 54 14 2 16 70 5 11 16 6 91 9 2008 11 2 1 13 31 44 19 2 21 65 5 13 19 7 91 9 2009 10 1 0 12 31 42 23 3 27 69 6 15 21 8 97 3 2010 10 1 0 12 30 42 18 3 21 63 5 17 22 8 93 7 2011 10 1 0 12 30 42 18 3 21 63 6 18 24 8 95 5 2012 11 2 0 14 31 44 17 3 20 65 5 18 23 7 95 5 2013 13 2 0 16 32 48 16 3 19 67 5 16 22 7 96 4 2014 13 2 0 16 32 48 15 2 17 65 5 15 19 6 91 9 Oriented strandboard (OSB) 2007 46 4 3 53 19 73 9 1 10 83 0 1 1 3 86 14 2008 39 5 4 47 19 67 13 2 15 81 0 1 1 3 86 14 2009 37 3 3 43 19 62 17 3 19 81 0 1 1 4 86 14 2010 40 3 3 46 19 64 13 3 16 80 0 1 1 4 86 14 2011 38 4 4 45 19 64 14 2 16 80 0 1 1 4 86 14 2012 45 5 3 53 20 73 14 2 16 90 0 1 1 4 95 5 2013 46 6 3 55 20 75 13 2 15 90 0 1 1 4 94 6 2014 49 6 3 57 20 77 12 2 13 91 0 1 1 3 95 5
Total, structural panels 2007 34 3 2 40 26 66 11 1 12 78 2 4 6 4 88 12 2008 28 4 3 34 24 58 15 2 17 75 2 6 8 5 88 12 2009 26 2 2 30 24 54 19 3 22 76 3 7 9 5 91 9 2010 27 2 2 32 23 55 15 3 18 73 2 8 10 6 89 11 2011 26 3 2 31 23 55 15 3 18 73 3 8 11 6 90 10 2012 29 4 2 35 25 60 15 3 18 78 3 9 12 6 95 5 2013 30 4 2 36 26 62 15 2 17 79 3 8 11 5 95 5 2014 32 4 2 38 26 63 13 2 15 79 2 7 10 5 93 7
Nonstructural panelsc
2007 18 4 1 23 19 42 9 0 9 51 20 16 36 1 88 12 2008 13 4 1 18 16 34 11 0 11 45 22 19 42 1 88 12 2009 11 2 1 14 14 29 12 1 13 42 22 20 42 1 85 15 2010 12 2 1 15 14 29 10 1 10 40 22 22 44 2 85 15 2011 10 3 1 14 14 28 9 0 10 38 22 24 46 2 85 15 2012 12 4 1 16 15 31 9 0 9 40 21 23 45 1 86 14 2013 13 4 1 18 16 35 9 0 9 44 22 23 44 1 89 11 2014 16 5 1 22 18 39 9 0 9 48 22 22 44 1 94 6 a2007–2012 revised, 2013 preliminary, 2014 forecast. bIncludes laminated veneer lumber. cIncludes particleboard, medium density fiberboard, insulation board, hardboard and non-coniferous plywood.

Research Note FPL–RN–0331
8
In 2012, 9.8 million cubic meters of oriented strandboard (OSB) were produced (Table 2). OSB consumption totaled 12.4 million cubic meters in 2012 and constituted 60% of the structural panel market (Table 3). This represented a 0.4% share decrease from 2008. Consumption is expected to further increase in 2013. At the end of the third quarter 2013, OSB consumption was 10.6 million cubic meters, 12.2% above the first three quarters of 2012. The continu-ing economic recovery and growing residential construction sector is expected to increase OSB consumption in 2013 to near 16 million cubic meters.
Softwood plywood production was 8.1 million cubic meters in 2012 (Table 2) (APA 2013). This level of production was 2.2% above 2011. Softwood plywood production at the end of the third quarter in 2013 was 6.3 million cubic meters, 2.0% above 2012 when compared to the numbers at the end of third quarter in 2012. The volume of softwood plywood production fell throughout the 1990s, and the decline con-tinued into 2011 before improving in 2012. Softwood ply-wood imports decreased in 2012 by 12.2% compared with 2011 data, while softwood plywood third quarter exports increased in 2012 by 0.8%. Plywood exports to Canada de-creased by 39% during the first eight months in 2013 com-pared with a year earlier, and plywood imports from Canada decreased 10%. Softwood plywood consumption was 6.1 million cubic meters at the end of the third quarter 2013, which was 4.1% above last year. Apparent consumption of softwood plywood is expected to increase in 2013 and 2014.
Nonconiferous Plywood
Hardwood plywood production, including core material such as softwood plywood and OSB, was estimated at 1.3 million cubic meters in 2012, unchanged from 2011 pro-duction. Hardwood plywood imports increased 22% in 2010 climbing to 2.3 million cubic meters compared with 2009. Hardwood plywood exports rose in 2010, increasing 43.2% to 185 thousand cubic meters. Production and consump-tion of hardwood plywood in 2010 and 2011 is forecasted to steadily fall to 2008 levels (Table 2). These declines are a result of falling Total Industrial Production and Furniture and Related Products indexes (Table 1), coupled with the U.S. housing market collapse.
Particleboard and Medium-Density Fiberboard
Information from the Composite Panel Association (CPA 2012) indicates that particleboard and medium-density fi-berboard (MDF) production increased slightly during 2012. Particleboard production was 3.8 million cubic meters, a decrease of 7.8%, and MDF production was 2.9 million cubic meters, an increase of 10.5% (Table 2). During 2012, particleboard and MDF imports combined increased on a volume basis, compared with 2011. Particleboard and MDF exports also increased in 2012 over 2011. Consumption of particleboard and MDF combined declined slightly in 2012 compared with 2011. Particleboard and MDF account for
well over half of all nonstructural panels consumed in the United States, although they are not a large component in residential construction. Although they are not a large com-ponent in residential construction, their market share fell by nearly half between 2006 and 2010.
Hardboard
Based on data from the Composite Panel Association (CPA 2013), 649 thousand cubic meters of hardboard was pro-duced in 2012; this level of production is expected to in-crease slightly in 2013. Hardboard imports and exports are expected to remain flat over the next two years.
Insulation Board
Information from the American Forest & Paper Associa-tion (AF&PA 2013) showed that 2.7 million cubic meters of insulation board was produced in 2012, unchanged from 2011. Production of insulation board has been flat for sev-eral years, resulting in a stable level of apparent annual con-sumption of about 3.0 million cubic meters.
Fuelwood
Using data from a 2012 Department of Energy survey (EIA 2013) and adjusting for the 2012 winter weather and an increasing trend in fuelwood use per household, fuelwood consumption was estimated to be 40.0 million cubic meters in 2012—an increase of 3.4% from 2011. Households use most fuelwood for heating and aesthetic enjoyment. Industry uses mill residues rather than roundwood for fuel. A small portion of roundwood fuelwood is used for electric power production. Use for electric power is limited by the low cost of coal and natural gas alternatives. Fuelwood consumption for 2012 was above the level for 2011, and the forecast calls for increased fuelwood consumption through 2013. Renew-able Fuel Standards and other biomass-related energy poli-cies are unlikely to increase the growth rate for fuelwood production and consumption but are likely to increase other forms of wood energy use, such as pellets.
Forest Products PricesTrends in the wholesale price of forest products are differ-ent across two broad categories: lumber and wood products (such as lumber and wood-based panels) and pulp and paper products (Fig. 2). Throughout the late 1990s, the producer price of lumber and wood products as reflected by the producer price index (PPI) continued to fluctuate around a level reached by the mid-1990s before peaking during the second half of 1999 (USDL 2013). The PPI for lumber and wood products continued to decrease during the first quarter of 2008, rose and peaked in the third quarter, and then de-clined again in the foruth quarter. The PPI for lumber was down 7.3 points in 2009 from 2008. Changes in the price of softwood lumber and a depressed lumber market accounted for much of this change and most of the volatility in the in-dex. In 1999, the deflated composite price index reached an all-time high (at a level more than 50% higher than that of

U.S. Forest Products Annual Market Review and Prospects, 2010–2014
9
the base year, 1982), followed immediately by a sustained decline that continued throughout 2000 and into 2011. The PPI reached its lowest level in 5 years during this period. The PPIs for both lumber and pulp paper and allied products have been increasing since 2011, throughout 2012, and into 2013. Because of these sustained low prices, U.S. demand for lumber and wood products during 2000 and into 2005 remained near record levels. But the current strengthening in the housing market has caused an uptick in the price levels during this current resurgence, fueled also by the increase in demand for wood products as a result of rebuilding made necessary by damage incurred from tropical storm Sandy. In contrast, the PPI of prices in the pulp and paper sector has exhibited considerably less short-term volatility. In deflated terms, the composite index began 2008 with a flat to declin-ing trend, before undergoing an upturn in the third quarter of 2008 that became flat in the first quarter of 2009 before fluctuating throughout 2011 but increasing into the fourth quarter of 2013.
Energy Policy InitiativesWood EnergyThe wood energy market in the United States is composed of four major sectors: industrial (68%), residential (20%), electricity (9%), and commercial (3%). The industrial sector represents the wood products and pulp and paper indus-tries, and the amount of wood energy it consumes has been mainly linked to wood product output rather than public policies. The other three sectors have been where public policy is focused at the state and federal level. Historically, public policy was focused on promoting the use of biomass for electricity, whereas in recent years, there has been a shift to greater support for liquid fuels for transport.
The most effective federal incentives introduced since 2004 according to recent publications appear to be (a) the Renew-able Energy Production Tax Credits, (b) Clean Renewable
Energy Bonds, (c) Qualified Energy Conservation Bonds, and (d) Investment Tax Credits (Aguilar et al. 2011). All these incentives are tailored to the electricity generation sector. Recent publications also suggest that the eligibility of open-loop biomass plants (i.e., not relying on bio-energy dedicated crops, but instead on material harvested from working forest and industry co-products) for Renewable En-ergy Production Tax Credits have favored the greater use of woody materials, especially in the electricity sector.
Biomass Crop Assistance Program (BCAP) implementa-tion guidelines (section 9.4.1.2) have been recently updated. BCAP, a policy established to help meet U.S. Federal Re-newable Fuel Standards, mandates increased national bio-fuel use to reach 36 billion gallons per year by 2022, with 21 billion gallons per year from advanced biofuels (US Pub-lic Law 110-140).
Wood pellet manufacturing is the most dynamic wood ener-gy sector in the United States because of increases in capac-ity and production of industrial pellets for export in the Eu-ropean Union (EU). U.S. export capacity has increased from less than 100,000 tonnes in 2008 to almost 2 million tonnes in 2012. Pellet production for the local market and use for U.S. residential heating is stalled, but industrial pellet use is increasing with current production capacity estimated at about 5 million tonnes (Spelter 2012).
Biomass EnergyRenewed growth in the world economy has had a significant impact on wood and energy demand, with the near-term future of U.S. wood and energy markets tied to the U.S. domestic upturn from the recession that started in 2008. Growing concern about greenhouse gas (GHG) emissions and its effect on energy investment decisions, increasing use of renewable fuels, increasing production of uncon-ventional natural gas, the shift in the transportation fleet to more efficient vehicles, and improved efficiency in end-use appliances are the result of U.S. energy concerns. Continued improvement of the world’s financial markets is especially important for the wood and energy supply outlook, because the capital-intensive nature of most large projects makes ac-cess to financing a critical necessity.
Although the electricity sector has been a major beneficiary of federal public policy support, it has recently been fac-ing increased scrutiny because of GHG emissions. Whether power generation using woody feedstock is considered a GHG carbon-neutral option is undergoing debate. On Janu-ary 12, 2011, the U.S. Environmental Protection Agency (EPA) announced its plan to defer for three years the re-quirement for GHG permits for CO2 emissions from bio-mass-fired and other biogenic sources (EPA 2011b).
EPA has been developing guidelines to restrict emissions from certain stationary sources, such as electric power plants. EPA has suggested the possibility that emissions
0
20
40
60
80
100
120
140
160
1997
1998
1999
2000
2001
2002
2003
2004
2005
2006
200
720
0820
0920
1020
1120
1220
13
Def
late
d pr
ice
inde
x, 1
997–
2013
Series 1Series 2
Figure 2—Wholesale prices of forest products, 1997–2013.
Research Note FPL–RN–0331
10
from biomass might be treated on the same terms as emis-sions from fossil fuels. At the same time it recognized the uncertainty about the carbon offset benefits of wood and other biomass sources (EPA 2010). Biogenic CO2 emissions being reviewed include diverse sources such as those de-rived from combustion of biological material, including all types of wood and wood co-products, forest residues, and agricultural material (EPA 2011a).
Summary of Timber Products and Energy PolicyThe past year has been a volatile one for U.S. wood and en-ergy markets, with oil prices rising throughout 2012 and into 2013 and wood markets gaining strength. Economic activity in the United States was improving in 2012 and has shown strength during the first three quarters of 2013 as evidenced by the increase in real GDP growth to an expected 2.2% in the third quarter 2013, signaling renewed strength in major sectors of the economy. With stronger GDP growth during the second half of 2013, resulting partly from continued improvement in the housing sector as reflected in the rise in building permits, increasing employment, and renewed confidence about the financial system, there is increased enthusiasm and expectations of better economic conditions into 2014. Also, with more new home purchases instead of home refinancing and stronger GDP growth, which is an indicator of employment growth, recovery of the U.S. economy seems on track. Current inflationary pressures are in decline and unemployment is falling, leading to higher expectations for the U.S. economy. Future strength for other domestic and foreign trade sectors of the wood products in-dustry also depends on the general economy, future lumber prices (which are stronger in 2013), the improving housing sector, and the strengthening value of the dollar. U.S. timber exports to China were strong in 2012 and into 2013. The future strength of the U.S. trade sector is also buoyed by surging exports to Mexico. As a result of increased tariffs on wood exports in 2007 from Russia, Chinese buyers have turned to Canada and the United States for wood amid the country’s construction rebound. If the surge in exports to Mexico is sustained and if the housing market continues to rebound throughout 2013, 2014 could be a good year for the U.S. wood industry.
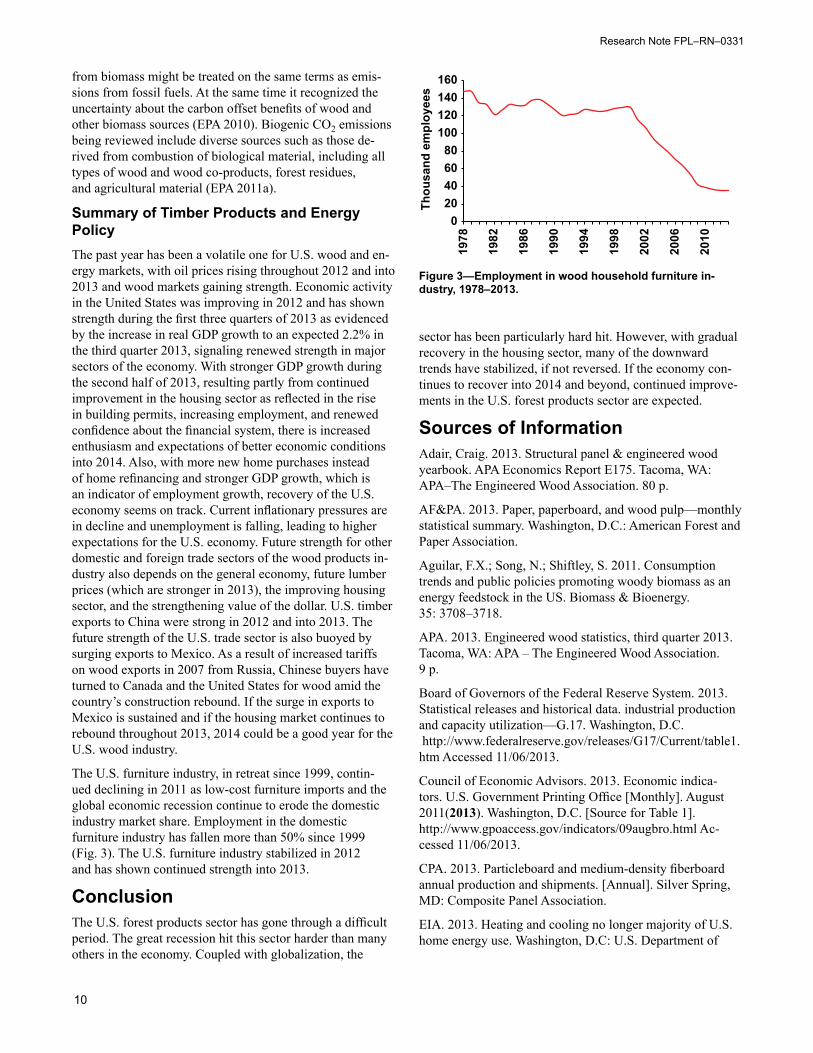
The U.S. furniture industry, in retreat since 1999, contin-ued declining in 2011 as low-cost furniture imports and the global economic recession continue to erode the domestic industry market share. Employment in the domestic furniture industry has fallen more than 50% since 1999 (Fig. 3). The U.S. furniture industry stabilized in 2012 and has shown continued strength into 2013.
ConclusionThe U.S. forest products sector has gone through a difficult period. The great recession hit this sector harder than many others in the economy. Coupled with globalization, the
sector has been particularly hard hit. However, with gradual recovery in the housing sector, many of the downward trends have stabilized, if not reversed. If the economy con-tinues to recover into 2014 and beyond, continued improve-ments in the U.S. forest products sector are expected.
Sources of InformationAdair, Craig. 2013. Structural panel & engineered wood yearbook. APA Economics Report E175. Tacoma, WA: APA–The Engineered Wood Association. 80 p.
AF&PA. 2013. Paper, paperboard, and wood pulp—monthly statistical summary. Washington, D.C.: American Forest and Paper Association.
Aguilar, F.X.; Song, N.; Shiftley, S. 2011. Consumption trends and public policies promoting woody biomass as an energy feedstock in the US. Biomass & Bioenergy. 35: 3708–3718.
APA. 2013. Engineered wood statistics, third quarter 2013. Tacoma, WA: APA – The Engineered Wood Association. 9 p.
Board of Governors of the Federal Reserve System. 2013. Statistical releases and historical data. industrial production and capacity utilization—G.17. Washington, D.C. http://www.federalreserve.gov/releases/G17/Current/table1.htm Accessed 11/06/2013.
Council of Economic Advisors. 2013. Economic indica-tors. U.S. Government Printing Office [Monthly]. August 2011(2013). Washington, D.C. [Source for Table 1]. http://www.gpoaccess.gov/indicators/09augbro.html Ac-cessed 11/06/2013.
CPA. 2013. Particleboard and medium-density fiberboard annual production and shipments. [Annual]. Silver Spring, MD: Composite Panel Association.
EIA. 2013. Heating and cooling no longer majority of U.S. home energy use. Washington, D.C: U.S. Department of
020406080
100120140160
1978
1982
1986
1990
1994
1998
2002
2006
2010
Thou
sand
em
ploy
ees
Figure 3—Employment in wood household furniture in-dustry, 1978–2013.

U.S. Forest Products Annual Market Review and Prospects, 2010–2014
11
Energy, Energy Information Administration. www.eia.doe.gov/emeu/recs/contens.html. Accessed 6/20/2013.
EPA. 2010. Prevention of significant deterioration and Title V greenhouse gas tailoring rule. Washington, D.C.: Environ-mental Protection Agency. Available at: www.epa.gov/nsr/documents/20100413final.pdf. Accessed 11/06/2012.
EPA. 2011a. Fact sheet: Proposed rule—deferral for CO2 emissions from bioenergy and other biogenic sources under the prevention of significant deterioration (PSD) and Title V programs. Washington, D.C.: Environmental Protection Agency. Available at: www.epa.gov/nsr/ghgdocs/biogenicfs.pdf. Accessed 11/06/2012.
EPA. 2011b. Guidance for determining best available con-trol technology for reducing carbon dioxide emissions from bioenergy production. Washington, D.C.: Environmental Protection Agency, Office of Air and Radiation. March 2011. Available at: http://www.epa.gov/nsr/ghgdocs/bioener-gyguidance.pdf. Accessed 11/06/2012.
Federal Reserve Bank of Philadelphia. 2013. Economic research, survey of professional forecasters, third quarter 2013. http://www.phil.frb.org/research-and-data/real-time-center/survey-of-professional-forecasters/. Accessed 11/06/2013.
Howard, James L. 2013. U.S. timber production, trade, consumption, and price statistics 1965–2011. Madison, WI: U.S. Department of Agriculture, Forest Service, Forest Products Laboratory.
McKeever, David B.; Howard, James L. 2011. Solid wood timber products consumption in major end uses in the United States, 1950–2009; A techni cal document supporting the Forest Service 2010 RPA assessment. Gen eral Technical Report FPL-GTR-199. Madison, WI: U.S. Department of Agriculture, Forest Service, Forest Products Laboratory. 41 p.
NAHB. 2013a. Housing economics. September. Washing-ton, D.C.: National Association of Home Builders. http://www.nahb.org/showpage_details.aspx?showPageID=311§ionID=1163. Accessed 11/06/2013.
NAHB. 2013b. Executive-level forecast. Eye on the econo-my. David Crowe. Washington, D.C.: National Association of Home Builders. http://www.nahb.org/reference_list.aspx?sectionID=869&channelID=311. Accessed 11/06/2013.
Spelter, H. 2012. Timber Processing Magazine, April 2012. www.timberprocessing.com/magazine.issue/April-2012/.
USDL. 2013. Producer prices and price indexes. [Monthly and annual]. Washington, D.C.: U.S. Department of Labor, Bureau of Labor Statistics. http://www.bls.gov/ppi. Ac-cessed 11/06/2013.
WWPA. 2013. Lumber track. [Monthly]. November 2013 Portland, OR: Western Wood Products Association.


