march 2009 cirrus hd-oct: practical application and … · sponsored by march 2009 current and...
TRANSCRIPT
SPONSORED BY
MARCH 2009
Current and future capabilities of Cirrus HD-OCT and theirimpact on retina and glaucomapatient care.
CIRRUS HD-OCT:
Practical Application andInterpretation for Glaucoma And Retinal Disease
Highlights from a panel discussion held at the annual meeting of the American Academy ofOphthalmology in November 2008 in Atlanta.
CIR.2200
0309OMD-379-9.qxd:OMD Poly 2/12/09 4:16 PM Page 1

the 5-line raster scan that delivers the highest B-scanimage quality for a detailed analysis of the macula.
• Macular cube 200 x 200 combo: I use this cubescan on every patient to obtain proportionately accurateareas and volumes involving the macula. I like the 200 x200 macular cube scanning strategy because both the A-scans and the B-scans are separated by 30 microns. Asa result, I get a uniform sampling within a 6-mm x 6-mmarea of the macula. If you want proportional volume andarea measurements, and a retinal thickness map that’s
In 2001, the images obtained using the Stratus OCT 3(Carl Zeiss Meditec, Dublin, Calif.) revolutionized theway physicians managed patients with macular diseases.Using the OCT 3 with breakthrough 3,072 A-scans with-in six diagonal B-scans centered on the fovea, we’ve beenable to image most macular pathologies. However, thistype of scanning pattern limited our ability to easily sam-ple pathology outside the central 1 mm, therefore requir-ing multiple scans positioned outside the central macula.Moreover, the algorithm that measured retinal thicknesswas unreliable and prone to artifacts. Despite these limi-tations at the time, the technology was sufficient for mostof our needs. Since then, our needs have changed, and ourexpectations have increased due to new spectral domainoptical coherence tomography (SD-OCT) technology.
Now we have Cirrus HD-OCT (Carl Zeiss Meditec)with scanning patterns totaling 27,000 A-scans per sec-ond. The question heard most often involves the clinicaluse of the different scanning patterns: “What’s the purposeof the scanning patterns, and when should we use them?”
I think of this the way I think of currency. As yoursalary increases, you find good use for the additionalincome. We’ve gotten an enormous raise in A-scans.Now I’m using them in ways I never imagined, and Iwonder how I ever survived with just 3,072 A-scans.Here’s some insight into the Cirrus HD-OCT scanningpatterns and when and why you’ll use them.
Cirrus HD-OCT Scan PatternsCirrus HD-OCT uses three major scanning patterns,
each of which has different benefits and practical appli-cations. There’s the 200 A-scan x 200 B-scan macularcube with lower horizontal B-scan image quality used forvolumetric and area analysis; the 512 A-scan x 128 B-scan macular cube that delivers an excellent, higherimage quality B-scan representation of the macula; and
Learn about current applications and future capabilities.
Using Cirrus HD-OCT for theManagement of Age-relatedMacular Degeneration
Macula Multislice Printout
Figure 1. This multislice printout from Cirrus HD-OCT shows a sampling ofthe B-scans throughout the macula, emphasizing the central macula.
2
0309OMD-379-9.qxd:OMD Poly 2/12/09 4:16 PM Page 2

identification, segmentation and quantitation. The latterfeature hinges on our ability to achieve the first two. Thatis, the OCT retinal thickness algorithms identify theboundaries of the internal limiting membrane (ILM) andthe retinal pigment epithelium (RPE). The distancebetween these two boundaries determines the retinalthickness, and the more accurate the boundary identifi-cation, the more accurate the thickness quantitation.
Cirrus HD-OCT retinal segmentation algorithms arehighly accurate and reproducible when compared withhand-drawn ILM-RPE boundaries, which are the goldstandard.1 Depending on the scan pattern you use toevaluate wet macular degeneration, the algorithms are97.1% to 98.6% accurate for the ILM and 85.7% to86.1% accurate for the RPE. The quantitation is farmore reliable than the quantitation we had with theOCT 3.
Segmentation techniques make it possible for the dataset to be displayed in layers, such as the ILM and RPE.These layers can be displayed individually and recon-structed into two- and three-dimensional images andthickness maps.
Cirrus HD-OCT Fundus Images Another unique feature of Cirrus HD-OCT is the
OCT fundus image. Think of it this way: A-scans makeup a B-scan, B-scans make up the HD-OCT cube, andthe fundus image is a projection of all of the summedreflectivity on one surface of the compiled B-scans. It’s avirtual fundus image depicted on the top surface of the
proportional in the X and Y dimensions, this cube ofinformation is exceptional.
• Macular cube 512 x 128 combo: I use this scanningpattern on every patient as well, because the B-scans offerbetter image quality covering the macula. It’s useful forqualitative analysis, and I can view the data on a moni-tor or with the new multislice printout, which soon willbe available.
With a 6-mm cube based on 512 A-scans x 128 B-scans, you can obtain the scan image quality that’s asgood as or better than the standard OCT radial lines. Butnow, instead of six diagonal scans, you get 128 B-scanscovering the macula. The A-scans are separated by 12microns. Since the best you can get in transverse resolu-tion is 20 microns, the separation of 12 microns is the bestyou will achieve no matter how many A-scans are used inthe transverse dimension. The B-scans are separated by 47microns, and a total of 128 high-quality B-scans areobtained in the central 6-mm x 6-mm area.
The new multislice printout will selectively show asampling of the B-scans throughout the scanned macula,with the central macula being over-represented in theprintout (Figure 1). In the central 1 mm of the macula —with every other B-scan shown and as the B-scans extendfurther from the fovea — every fourth and every eighthB-scan is displayed. However, the operator can adjust thesampling in the report. The printout will give you a beau-tiful representation of the entire macula, with the focuson the central macula. In summary, the standard defaultprintout will include 11 B-scans on seven pages, so thecomplete 512 printout of the macula will provide an easyway to visualize this wealth of information. In the report,each B-scan will be accompanied by the laser scanningophthalmoscopic (LSO) fundus image, the OCT fundusimage and a retinal thickness map.
• 5-line raster: I use this scan on all my patients to getthe highest quality image for detailed analysis. You canperform the 5-line raster scan horizontally, vertically orat any angle. The horizontal rasters give you 4,096 A-scans per B-scan that you can separate by 0.01 mm to1.25 mm. And the length of the scan can vary from 3 mmto 9 mm. The resolution is the same, but the image qual-ity is better than the 512 A-scan image.
Key Unique FeaturesCirrus HD-OCT provides capabilities that no other
instrument offers, including the most reliable boundary
By Philip J. Rosenfeld, MD, PhD
3
Geographic Atrophy Imaging: Cirrus HD-OCT vs. FAF
Figure 2. The Cirrus HD-OCT fundus image overlay on the LSO fundusimage (left) clearly shows geographic atrophy. Compare to FAF (right).
0309OMD-379-9.qxd:OMD Poly 2/12/09 4:16 PM Page 3
4
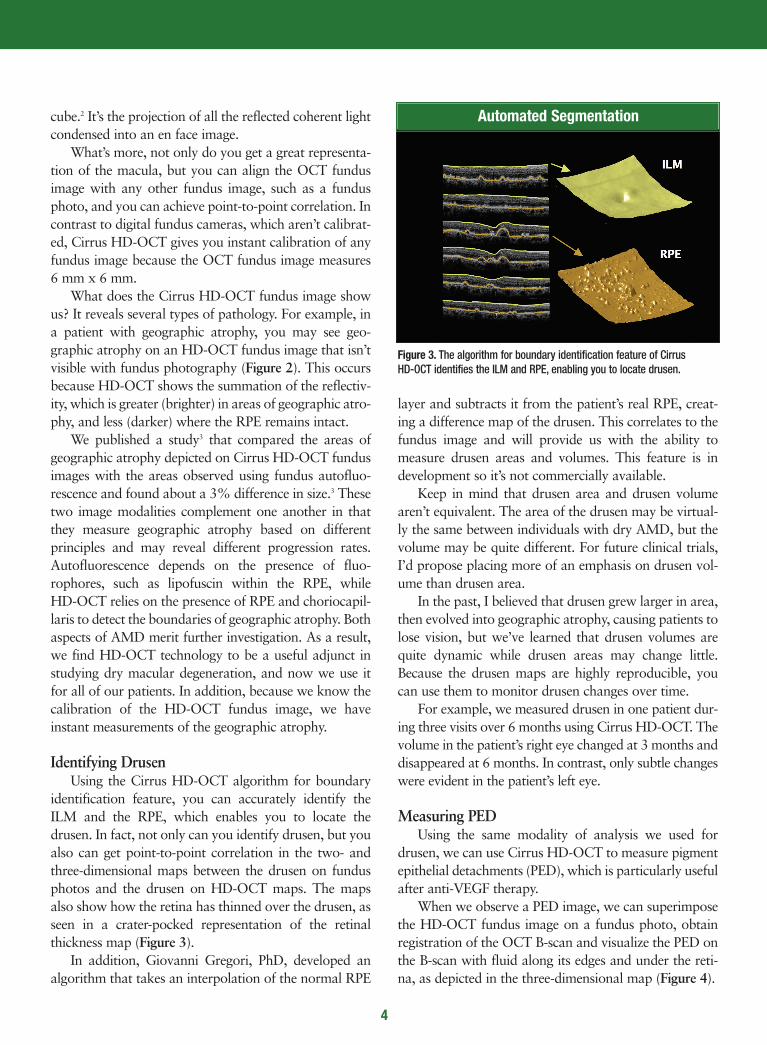
layer and subtracts it from the patient’s real RPE, creat-ing a difference map of the drusen. This correlates to thefundus image and will provide us with the ability tomeasure drusen areas and volumes. This feature is indevelopment so it’s not commercially available.
Keep in mind that drusen area and drusen volumearen’t equivalent. The area of the drusen may be virtual-ly the same between individuals with dry AMD, but thevolume may be quite different. For future clinical trials,I’d propose placing more of an emphasis on drusen vol-ume than drusen area.
In the past, I believed that drusen grew larger in area,then evolved into geographic atrophy, causing patients tolose vision, but we’ve learned that drusen volumes arequite dynamic while drusen areas may change little.Because the drusen maps are highly reproducible, youcan use them to monitor drusen changes over time.
For example, we measured drusen in one patient dur-ing three visits over 6 months using Cirrus HD-OCT. Thevolume in the patient’s right eye changed at 3 months anddisappeared at 6 months. In contrast, only subtle changeswere evident in the patient’s left eye.
Measuring PED Using the same modality of analysis we used for
drusen, we can use Cirrus HD-OCT to measure pigmentepithelial detachments (PED), which is particularly usefulafter anti-VEGF therapy.
When we observe a PED image, we can superimposethe HD-OCT fundus image on a fundus photo, obtainregistration of the OCT B-scan and visualize the PED onthe B-scan with fluid along its edges and under the reti-na, as depicted in the three-dimensional map (Figure 4).
cube.2 It’s the projection of all the reflected coherent lightcondensed into an en face image.
What’s more, not only do you get a great representa-tion of the macula, but you can align the OCT fundusimage with any other fundus image, such as a fundusphoto, and you can achieve point-to-point correlation. Incontrast to digital fundus cameras, which aren’t calibrat-ed, Cirrus HD-OCT gives you instant calibration of anyfundus image because the OCT fundus image measures6 mm x 6 mm.
What does the Cirrus HD-OCT fundus image showus? It reveals several types of pathology. For example, ina patient with geographic atrophy, you may see geo-graphic atrophy on an HD-OCT fundus image that isn’tvisible with fundus photography (Figure 2). This occursbecause HD-OCT shows the summation of the reflectiv-ity, which is greater (brighter) in areas of geographic atro-phy, and less (darker) where the RPE remains intact.
We published a study3 that compared the areas ofgeographic atrophy depicted on Cirrus HD-OCT fundusimages with the areas observed using fundus autofluo-rescence and found about a 3% difference in size.3 Thesetwo image modalities complement one another in thatthey measure geographic atrophy based on differentprinciples and may reveal different progression rates.Autofluorescence depends on the presence of fluo-rophores, such as lipofuscin within the RPE, while HD-OCT relies on the presence of RPE and choriocapil-laris to detect the boundaries of geographic atrophy. Bothaspects of AMD merit further investigation. As a result,we find HD-OCT technology to be a useful adjunct instudying dry macular degeneration, and now we use itfor all of our patients. In addition, because we know thecalibration of the HD-OCT fundus image, we haveinstant measurements of the geographic atrophy.
Identifying DrusenUsing the Cirrus HD-OCT algorithm for boundary
identification feature, you can accurately identify theILM and the RPE, which enables you to locate thedrusen. In fact, not only can you identify drusen, but youalso can get point-to-point correlation in the two- andthree-dimensional maps between the drusen on fundusphotos and the drusen on HD-OCT maps. The mapsalso show how the retina has thinned over the drusen, asseen in a crater-pocked representation of the retinalthickness map (Figure 3).
In addition, Giovanni Gregori, PhD, developed analgorithm that takes an interpolation of the normal RPE
Automated Segmentation
Figure 3. The algorithm for boundary identification feature of Cirrus HD-OCT identifies the ILM and RPE, enabling you to locate drusen.
0309OMD-379-9.qxd:OMD Poly 2/12/09 4:16 PM Page 4

5
moves accordingly on the second image. This permits thecorrelation of registered B-scans from one visit to thenext. Over time, as the patient receives treatment, the dif-ference map will show fluid changes. This is a useful fea-ture, in addition to the high-resolution scans, particular-ly when using anti-VEGF therapy.
For example, I followed one patient with dry AMD ina clinical study. The Cirrus HD-OCT map showed meareas of geographic atrophy and dryness. Follow-up scansat one and a half months showed some activity. At twoand a half months, the patient came in complaining ofdecreased vision, and the maps showed a little more fluidindicative of some diffuse occult leakage. I treated thepatient; she returned, and the maps improved. The macu-lar change analysis showed me the change, and I was ableto scroll up and down on the map to precisely locate thefluid. The analysis gave me an accurate picture of thepatient’s condition at the beginning and end of treatment.
Power for the FutureIn my view, Cirrus HD-OCT gives me one-stop shop-
ping for dry and wet AMD. I still get fundus photo-graphs, and I like autofluorescence, but I can see every-thing with Cirrus HD-OCT. I use a 200 x 200 macularcube when I want accurate volume and area measure-ments, which is most of the time. I use the 512 x 128macular cube when I want a good representation of B-scans through the macula. Plus, I use the 5-line raster forhigh-definition images.
What I like about Cirrus HD-OCT is the quantitationand all of the different scanning strategies I can performin a short period of time. The Cirrus lets me performmultiple scans, and it interprets the data in several ways.I’ve found that it quickly becomes indispensable.
My colleagues and I are incorporating all of thesescan patterns in clinical trials as we move forward. Ibelieve the device helps us manage our patients more suc-cessfully than ever before. OM
Dr. Rosenfeld is professor of ophthalmology at Bascom Palmer Eye Institute,
University of Miami Miller School of Medicine.
After treatment with bevacizumab (Avastin,Genentech), we saw changes in the area of the PED as wewould with fluorescein angiography but, more impor-tantly, we can follow changes in the volume of the PED.These B-scans and the volumetric analysis make it easierto follow and treat patients with VEGF inhibitors.
As a practical matter, it’s important to emphasize thepower of the Cirrus HD-OCT map. I’ve learned to lookat the maps immediately when I receive the printout. Forexample, if I have a patient with a hemorrhagic PED, Ican collect the baseline HD-OCT image, as well as thefluorescein and indocyanine green angiograms. The mul-tislice printout shows the B-scans and the superimposedthickness map, so I can see the PED. As the patientreceives bevacizumab treatments, the map will show thefluid resolution and guide future treatment decisions.
Macular Change AnalysisA new Cirrus HD-OCT feature that soon will
become available is called macular change analysis, andit’s going to make our lives even easier. Cirrus HD-OCThas excellent boundary identification, segmentation andquantitation. The macular change analysis softwaretakes two HD-OCT fundus images and aligns them. Thisenables you to take the thickness map from one visit andsubtract the thickness map from another visit, whichresults in a perfectly registered difference map.
The printout shows you the thickness maps from thetwo visits, along with the difference in thickness. As youmove the horizontal B-scan on the first image, the B-scan
References1. Weisbrod M, Stetson P, Wieland M, et al. Comparison of hand-drawn ILM and RPE segmenta-
tion to the retinal segmentation algorithm of the Cirrus HD-OCT. Poster presented at the annu-al meeting of The Association for Research in Vision and Ophthalmology, April 27–May 1, 2008,Fort Lauderdale, Fla.
2. Lujan BJ, Wang F, Gregori G, et al. Calibration of fundus images using spectral domain opticalcoherence tomography. Ophthalmic Surg Lasers Imaging. 2008;39:S15–S20.
3. Lujan BJ, Rosenfeld PJ, Gregori G, et al. Spectral domain optical coherence tomographic imag-ing of geographic atrophy. Ophthalmic Surg Lasers Imaging. 2008;39:S8–S14.
Superimposed OCT Fundus ImageAnd 3-D Maps Show PED
Figure 4. The retinal thickness map (upper right) shows fluid on the edgesof a pigment epithelial detachment (PED). The ILM and RPE segmentationmaps display the PED in 3-D.
0309OMD-379-9.qxd:OMD Poly 2/12/09 4:16 PM Page 5
6
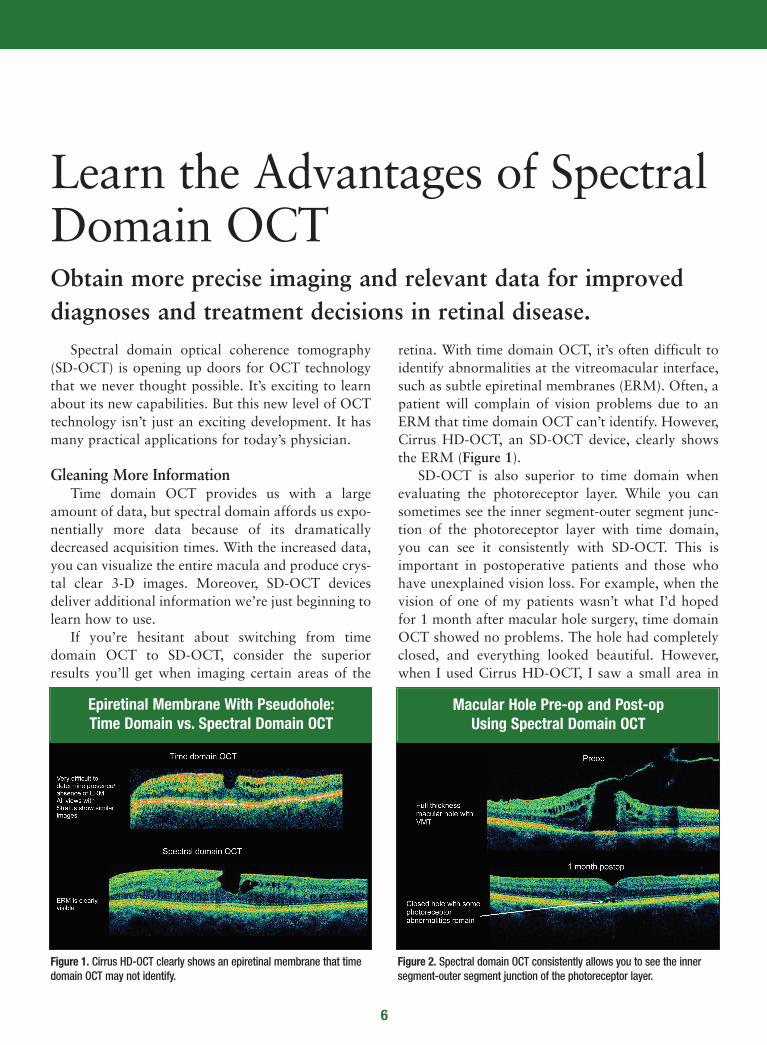
retina. With time domain OCT, it’s often difficult toidentify abnormalities at the vitreomacular interface,such as subtle epiretinal membranes (ERM). Often, apatient will complain of vision problems due to anERM that time domain OCT can’t identify. However,Cirrus HD-OCT, an SD-OCT device, clearly showsthe ERM (Figure 1).
SD-OCT is also superior to time domain whenevaluating the photoreceptor layer. While you cansometimes see the inner segment-outer segment junc-tion of the photoreceptor layer with time domain,you can see it consistently with SD-OCT. This isimportant in postoperative patients and those whohave unexplained vision loss. For example, when thevision of one of my patients wasn’t what I’d hopedfor 1 month after macular hole surgery, time domainOCT showed no problems. The hole had completelyclosed, and everything looked beautiful. However,when I used Cirrus HD-OCT, I saw a small area in
Spectral domain optical coherence tomography(SD-OCT) is opening up doors for OCT technologythat we never thought possible. It’s exciting to learnabout its new capabilities. But this new level of OCTtechnology isn’t just an exciting development. It hasmany practical applications for today’s physician.
Gleaning More Information Time domain OCT provides us with a large
amount of data, but spectral domain affords us expo-nentially more data because of its dramaticallydecreased acquisition times. With the increased data,you can visualize the entire macula and produce crys-tal clear 3-D images. Moreover, SD-OCT devicesdeliver additional information we’re just beginning tolearn how to use.
If you’re hesitant about switching from timedomain OCT to SD-OCT, consider the superiorresults you’ll get when imaging certain areas of the
Obtain more precise imaging and relevant data for improved diagnoses and treatment decisions in retinal disease.
Learn the Advantages of SpectralDomain OCT
Epiretinal Membrane With Pseudohole:Time Domain vs. Spectral Domain OCT
Figure 1. Cirrus HD-OCT clearly shows an epiretinal membrane that timedomain OCT may not identify.
Macular Hole Pre-op and Post-opUsing Spectral Domain OCT
Figure 2. Spectral domain OCT consistently allows you to see the innersegment-outer segment junction of the photoreceptor layer.
0309OMD-379-9.qxd:OMD Poly 2/12/09 4:16 PM Page 6
7
By Peter K. Kaiser, MD
patients. They’re the “Gee whiz!” of Cirrus HD-OCT.Single-scan tomograms might give you a 5-line rasterthrough the fovea and a cool view of a macular hole.But if you look at the retina in 3-D and show this toyour patients, you can pinpoint the traction descendingonto the optic nerve and fovea, and help them under-stand why treatment options to relieve that tractionwill work. You also can show the 3-D view to patientsto help illustrate macular edema with an ERM. Thisview is incredibly revealing. Patients get an “Ah-ha!”moment when they see 3-D scans.
Viewing the LayersThe automated segmentation of these scans gives
us another opportunity to improve diagnosis andmanagement of retinal disease. For example, we canview the segmented layers of the retina and see howan ERM affects the retinal contours. You can see thecrinkling of the internal limiting membrane (ILM). Inthe future, this might help us decide whether or not apatient needs surgery.
the fovea where the inner segment-outer segmentjunction was still abnormal, and there was a smallamount of retinal tissue that needed to coalesce(Figure 2).
Therefore, I was able to tell this patient with con-fidence that his vision likely would continue toimprove as this area healed. Without using CirrusHD-OCT, I wouldn’t have known this, and Iwould’ve had to tell the patient, “I really don’t thinkwe’re going to get additional visual improvement.”
I’ve also found Cirrus HD-OCT to be very usefulafter retinal detachment repair. When one of mypatients complained of poor vision, I needed to knowif it would improve. HD-OCT showed a little puddleof fluid that remained in the fovea. Again, I was ableto tell the patient, “The fluid is going to resolve, andyou’ll have better vision. We just have to wait.”
3-D ImagingThe single-scan tomogram, however, isn’t always
the best way to evaluate retinal pathology. CirrusHD-OCT scans rapidly, gathering a large amount ofinformation we can analyze in new and useful ways.For example, HD-OCT can perform a cube scan thatimages the entire macula. Often, we can barely seesubtle retinal pathology with time domain OCT, butby scanning with a cube scan, we can view pathologyeasily since we can see it in three dimensions. Forexample, we can visualize subtle subretinal orintraretinal fluid when treating age-related maculardegeneration (AMD) patients with anti-vascularendothelial growth factor drugs. This ability gives usthe power to make better treatment decisions for ourpatients.
If you’re looking for vitreous traction, the three-dimensional view allows you to see the relationshipbetween the vitreous and macula, and you can rotateand view it from several angles. As a result, you canmore accurately plan your surgical approach if thepatient needs surgery.
These 3-D views are also very exciting to show
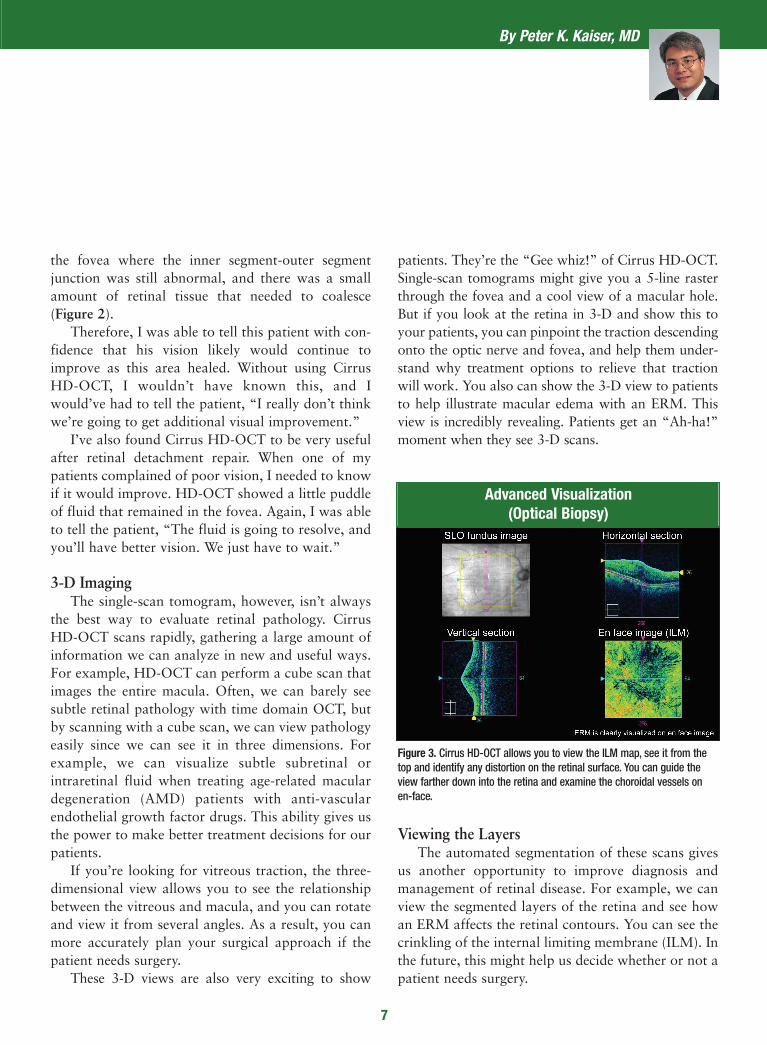
Advanced Visualization (Optical Biopsy)
Figure 3. Cirrus HD-OCT allows you to view the ILM map, see it from thetop and identify any distortion on the retinal surface. You can guide theview farther down into the retina and examine the choroidal vessels onen-face.
0309OMD-379-9.qxd:OMD Poly 2/12/09 4:17 PM Page 7
More Accurate Retinal MapsBecause Cirrus HD-OCT provides so much more
information than time domain OCT, we can obtainretinal maps that are considerably more accurate.Time domain OCT captures six radial line scans, andthen interpolates between the scans to create a retinalthickness map. HD-OCT gives us a 6-mm cube withalmost every point within that grid map measureddirectly — far more than the area mapped with timedomain OCT.
This is very important for a reading center. Withtime domain OCT, you can miss small lesions that fallbetween the radial lines, and if there’s an error in thesegmentation analysis, the software will propagate itinto a large area of the resulting retinal thicknessmap.
In addition, time domain software assumes thatall six of the radial lines intersect at one point. In real-
The advanced visualization tool is excitingbecause we’ve used the term “optical biopsy” foryears with time domain OCT — but now Cirrus HD-OCT technology makes it possible (Figure 3).
In the Cirrus HD-OCT display, I can show theILM map, view it from the top and see any distortionon the retinal surface. Then I can guide the view far-ther down into the retina and look at the choroidalvessels. I can see the choroidal vessels on en-face — aview that just isn’t available with any other technolo-gy to date.
One thing I appreciate about Cirrus HD-OCT isthe ability to print all of these images in a way that’sboth helpful for making diagnoses and meaningful topatients. A standard printout includes everythingyou’d want to show your patient. New Review soft-ware allows us to remotely show these images andvideos in our clinic as well.
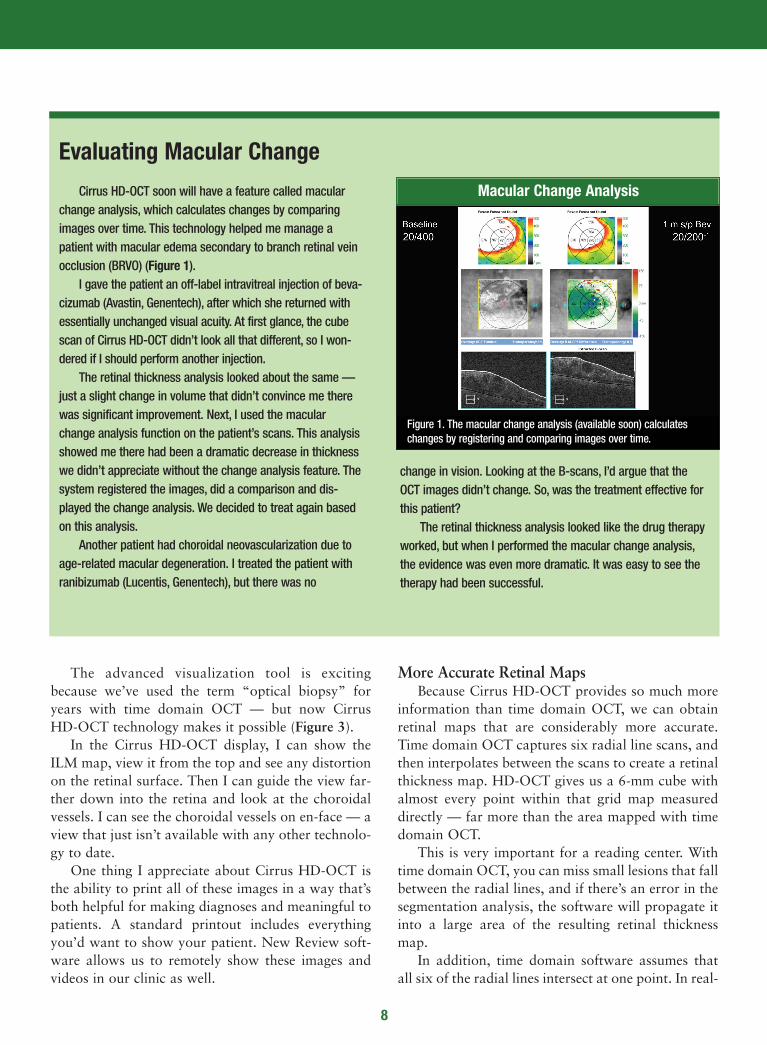
Cirrus HD-OCT soon will have a feature called macularchange analysis, which calculates changes by comparingimages over time. This technology helped me manage apatient with macular edema secondary to branch retinal veinocclusion (BRVO) (Figure 1).
I gave the patient an off-label intravitreal injection of beva-cizumab (Avastin, Genentech), after which she returned withessentially unchanged visual acuity. At first glance, the cubescan of Cirrus HD-OCT didn’t look all that different, so I won-dered if I should perform another injection.
The retinal thickness analysis looked about the same —just a slight change in volume that didn’t convince me therewas significant improvement. Next, I used the macularchange analysis function on the patient’s scans. This analysisshowed me there had been a dramatic decrease in thicknesswe didn’t appreciate without the change analysis feature. Thesystem registered the images, did a comparison and dis-played the change analysis. We decided to treat again basedon this analysis.
Another patient had choroidal neovascularization due toage-related macular degeneration. I treated the patient withranibizumab (Lucentis, Genentech), but there was no
change in vision. Looking at the B-scans, I’d argue that theOCT images didn’t change. So, was the treatment effective forthis patient?
The retinal thickness analysis looked like the drug therapyworked, but when I performed the macular change analysis,the evidence was even more dramatic. It was easy to see thetherapy had been successful.
Macular Change Analysis
Figure 1. The macular change analysis (available soon) calculateschanges by registering and comparing images over time.
8
Evaluating Macular Change
0309OMD-379-9.qxd:OMD Poly 2/12/09 4:17 PM Page 8

9
compare certain locations on the retina over time.Therefore, we’ll know if the patient’s vision haschanged as a result of disease progression or clinicaltreatment. Registration accuracy at this level simplyisn’t possible with time domain OCT.
Dramatic ShiftCirrus HD-OCT has dramatically changed the
way I practice, and I think it will change the way weconduct clinical trials. The accuracy of the boundarydetection has improved significantly, giving us moreprecise and more relevant measurements for bothclinical practice and clinical trials. Scanning speed hasbecome so amazingly fast that we can attain highlydetailed cubes of data for 3-D analysis, and we canexamine a large area of the macula. Hopefully, thiswill improve our diagnosis and treatment decisions inthe future. OM
Dr. Kaiser is director of the Digital OCT Reading Center of Cole Eye Institute
at the Cleveland Clinic Foundation. He’s study chairman of the DENALI trial,
and principal investigator in multiple national, multicenter clinical trials.
ity, there’s eye movement between each of the scans,so they don’t intersect at one point. This is a big issuesince eye movement can cause the software to artifi-cially under- or overestimate retinal thickness. SD-OCT devices image a larger area of the retina andare much faster, so eye movement becomes less of anissue and we get a more accurate retinal map. Thishopefully will translate into more accurate outcomesin clinical trials and when we follow up with patientsto determine treatment response.
What’s more, the segmentation algorithms ofCirrus HD-OCT have improved its ability to identifythe retinal boundaries in patients with AMD andchoroidal neovascularization. Retinal thickness meas-urements in patients with AMD can be inaccuratewith time domain OCT. In contrast, HD-OCT map-ping is extremely precise. Moreover, if the lines don’taccurately reflect the location of the inner and outerretina, we can move the lines to correct the issue. Thisisn’t possible with time domain devices.
Finally, Cirrus HD-OCT offers dramaticallyimproved registration between visits. We can registera patient’s retinal maps to ensure we’re imaging thesame place every time we perform our scans. We can
0309OMD-379-9.qxd:OMD Poly 2/12/09 4:17 PM Page 9

10
To ensure that reproducibility is excellent, Kimand colleagues1 studied the reproducibility of timedomain OCT versus Cirrus HD-OCT.
Hypotheses. Researchers approached the study1
with two hypotheses: First, they believed Cirrus HD-OCT would have better reproducibility than timedomain OCT. Second, they knew that when they tookretinal nerve fiber layer (RNFL) measurements, theyshould measure a 3.4-mm scanning circle, centered onthe optic nerve head. They believed the placement ofthat circle would influence the value and, therefore,the reproducibility. In other words, the way theyplaced the circle would be relevant. And there are twoways to place the circle. Physicians can center a newcircle every time they have a data cube or do whatsome of the confocal scanning laser ophthalmoscopesdo and register the images. Then they can import thecircle they placed the first time.
Methods. The researchers enrolled 14 healthy sub-jects and studied 27 eyes. Using time domain OCT(Stratus OCT software version 5.0) and HD-OCT(Cirrus HD-OCT software version 3.0), they per-formed three repeated scans per eye on the same day.With time domain OCT, they performed a fast RNFLscan with a signal strength ≥ 6. They performed anoptic disc cube scan with Cirrus HD-OCT at a signalstrength ≥ 8.
Results. The study validated the researchers’ firsthypothesis. With statistical significance, Cirrus HD-OCTshowed better RNFL thickness measurement repro-ducibility than time domain OCT.
They invalidated the second hypothesis. Resamplingcircle location variation on Cirrus HD-OCT was rela-tively small from scan to scan, and there was no statis-tically significant difference between the “center eachtime” and “center once” methods. No matter which
Spectral domain optical coherence tomography(SD-OCT) has proven to be a very useful tool for thedetection and management of glaucoma. Its 3-D imag-ing enhances reproducibility and registration andoffers the objective quantitative data that supportsglobal standardization of care at an expert level. SD-OCT helps physicians establish and pinpoint cor-relations in ocular structure and function, matchingareas of abnormal tissue with attendant vision prob-lems. The technology also may enhance sensitivity andspecificity in disease detection and reduce uncertaintyin glaucoma suspects. Software is under developmentto help detect disease progression.
SD-OCT is part of the standard approach of manyphysicians to managing glaucoma.
Reproducibility StudyKim and colleagues1 studied the reproducibility of
time domain OCT and Cirrus HD-OCT. It’s been welldocumented that HD-OCT produces high-definitiondigital photos. Physicians can see cross-sectionalimages and 3-D cubes and can detect fluid or topo-graphic distortion, making it easy to see the presenceof pathology. High precision digital imaging hasbecome an excellent advantage of OCT that ophthal-mologists have relied on for years.
However, one of the great features of OCT is itsobjective quantitative data, which is what will drivethis technology in the global standardization of care,according to Joel S. Schuman, MD, FACS, professorand chairman of ophthalmology at the Eye and EarFoundation, University of Pittsburgh School ofMedicine, and director of the University of PittsburghMedical Center (UPMC) Eye Center. Physicians canexpect the same good quantitative, reproducible datain Omaha, Beijing and Madrid.
Here’s how top physicians use Cirrus HD-OCT to diagnose and treat patients.
Understanding the Utility of Spectral Domain OCT in Glaucoma
0309OMD-379-9.qxd:OMD Poly 2/12/09 4:17 PM Page 10
11
a
By Erin Murphy, Contributing Editor
detailed information about the structure-functionrelationship between SD-OCT, RNFL thickness andfunction shown through perimetry testing. Using SD-OCT technology, ophthalmologists can see astrong relationship between structure and function,and that’s very important for gauging the status of aglaucoma patient, Dr. Schuman says.
Clinically, some physicians frequently use SD-OCTto achieve these goals. The following cases are exam-ples of how they use the technology.
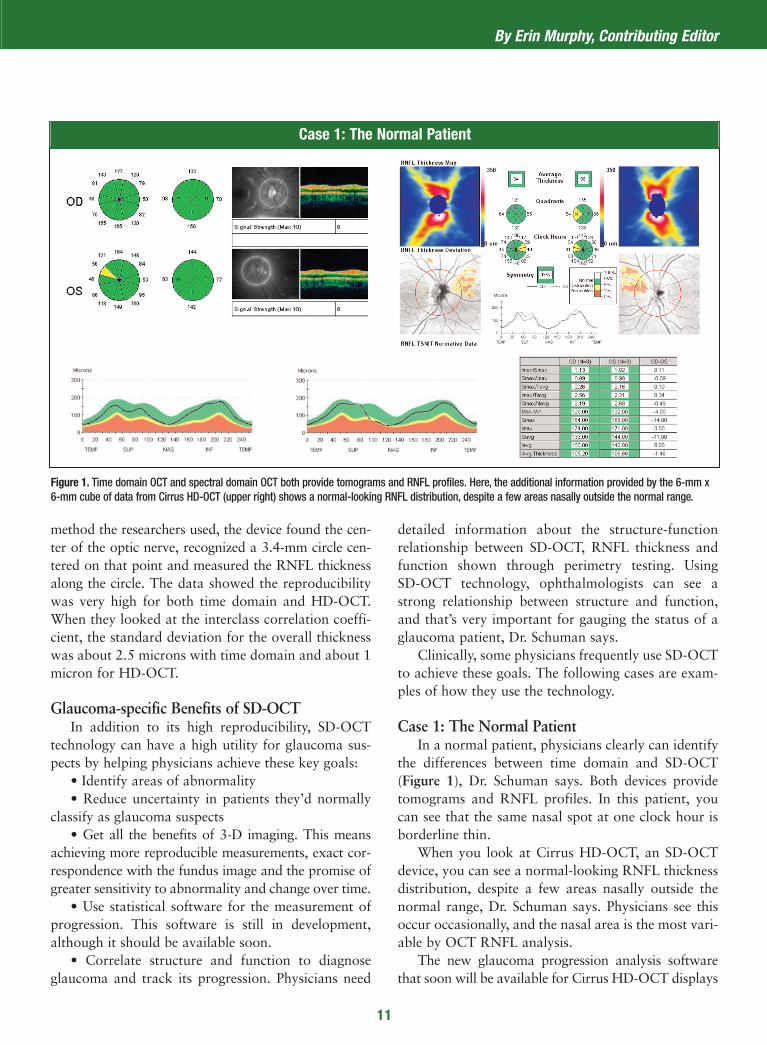
Case 1: The Normal Patient In a normal patient, physicians clearly can identify
the differences between time domain and SD-OCT(Figure 1), Dr. Schuman says. Both devices providetomograms and RNFL profiles. In this patient, youcan see that the same nasal spot at one clock hour isborderline thin.
When you look at Cirrus HD-OCT, an SD-OCTdevice, you can see a normal-looking RNFL thicknessdistribution, despite a few areas nasally outside thenormal range, Dr. Schuman says. Physicians see thisoccur occasionally, and the nasal area is the most vari-able by OCT RNFL analysis.
The new glaucoma progression analysis softwarethat soon will be available for Cirrus HD-OCT displays
method the researchers used, the device found the cen-ter of the optic nerve, recognized a 3.4-mm circle cen-tered on that point and measured the RNFL thicknessalong the circle. The data showed the reproducibilitywas very high for both time domain and HD-OCT.When they looked at the interclass correlation coeffi-cient, the standard deviation for the overall thicknesswas about 2.5 microns with time domain and about 1micron for HD-OCT.
Glaucoma-specific Benefits of SD-OCTIn addition to its high reproducibility, SD-OCT
technology can have a high utility for glaucoma sus-pects by helping physicians achieve these key goals:
• Identify areas of abnormality • Reduce uncertainty in patients they’d normally
classify as glaucoma suspects• Get all the benefits of 3-D imaging. This means
achieving more reproducible measurements, exact cor-respondence with the fundus image and the promise ofgreater sensitivity to abnormality and change over time.
• Use statistical software for the measurement ofprogression. This software is still in development,although it should be available soon.
• Correlate structure and function to diagnoseglaucoma and track its progression. Physicians need
Case 1: The Normal Patient
Figure 1. Time domain OCT and spectral domain OCT both provide tomograms and RNFL profiles. Here, the additional information provided by the 6-mm x6-mm cube of data from Cirrus HD-OCT (upper right) shows a normal-looking RNFL distribution, despite a few areas nasally outside the normal range.
0309OMD-379-9.qxd:OMD Poly 2/12/09 4:17 PM Page 11
12
tion, from that data cube, giving physicians highreproducibility and good registration from scan toscan, Dr. Schuman says.
The Cirrus HD-OCT printout also enables oph-thalmologists to see an RNFL thickness map, a devia-tion plot, the RNFL thickness profile and have theprofile overlaid on normative data.
Printouts include the mean thickness in quadrantsand clock hours. Physicians clearly can see that theRNFL is thinner on the top half than on the bottomhalf, Dr. Schuman says. The numbers showed anRNFL thickness that was statistically significantlyreduced compared to a healthy eye of a person in thepatient’s age group, and the RNFL thickness profileillustrated where the thickness dropped down into theabnormal range.
Case 3: Following Glaucoma SuspectsPhysicians are always looking for signs in patients
who are glaucoma suspects, Dr. Schuman says. Doesthe patient need treatment, or can a doctor follow himwithout treatment?
A 40-year-old African American man presentedwith an IOP of 23 mmHg, a central corneal thicknessof 555 microns and a normal visual field (Figure 3). Aphysician determined he had a large cup because hehad a large disc. OCT put his RNFL thickness wellwithin the normal range, so the physician decided tomonitor him.
Ophthalmologists can follow RNFL thickness for
a series of scans and calculations of mean thickness tohelp detect changes in RNFL thickness over time.
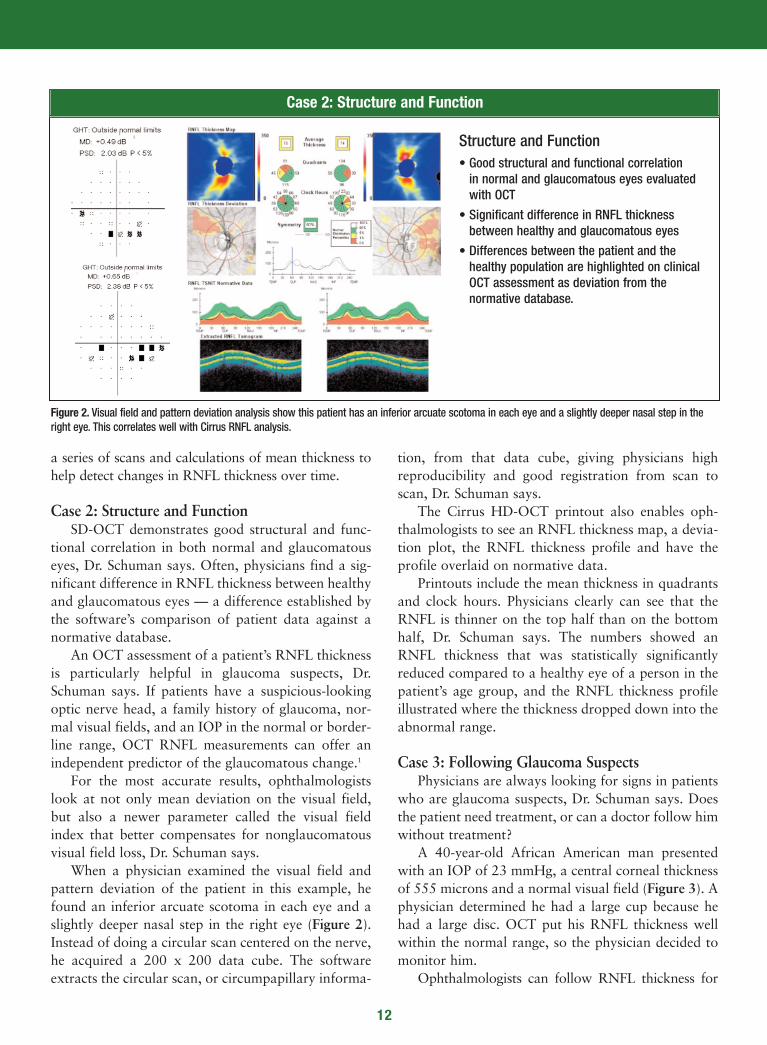
Case 2: Structure and FunctionSD-OCT demonstrates good structural and func-
tional correlation in both normal and glaucomatouseyes, Dr. Schuman says. Often, physicians find a sig-nificant difference in RNFL thickness between healthyand glaucomatous eyes — a difference established bythe software’s comparison of patient data against anormative database.
An OCT assessment of a patient’s RNFL thicknessis particularly helpful in glaucoma suspects, Dr.Schuman says. If patients have a suspicious-lookingoptic nerve head, a family history of glaucoma, nor-mal visual fields, and an IOP in the normal or border-line range, OCT RNFL measurements can offer anindependent predictor of the glaucomatous change.1
For the most accurate results, ophthalmologistslook at not only mean deviation on the visual field,but also a newer parameter called the visual fieldindex that better compensates for nonglaucomatousvisual field loss, Dr. Schuman says.
When a physician examined the visual field andpattern deviation of the patient in this example, hefound an inferior arcuate scotoma in each eye and aslightly deeper nasal step in the right eye (Figure 2).Instead of doing a circular scan centered on the nerve,he acquired a 200 x 200 data cube. The softwareextracts the circular scan, or circumpapillary informa-
Case 2: Structure and Function
Figure 2. Visual field and pattern deviation analysis show this patient has an inferior arcuate scotoma in each eye and a slightly deeper nasal step in theright eye. This correlates well with Cirrus RNFL analysis.
Structure and Function• Good structural and functional correlation
in normal and glaucomatous eyes evaluatedwith OCT
• Significant difference in RNFL thicknessbetween healthy and glaucomatous eyes
• Differences between the patient and thehealthy population are highlighted on clinicalOCT assessment as deviation from the normative database.
0309OMD-379-9.qxd:OMD Poly 2/12/09 4:17 PM Page 12

lation of structure and function, identify abnormali-ties and achieve truly sensitive screening for the dis-ease. Today, ophthalmologists are realizing the powerof HD-OCT. They’re developing strategies to use thevast amounts of data it collects to improve patientcare. And they’re constantly extending the possibilitiesas new software emerges. OM
change over time to track glaucoma progression, butvalidated, robust software for this purpose is still indevelopment. When it’s introduced, physicians mayhave the ability to detect progression more accuratelyusing the SD-OCT RNFL thickness measurementrather than using the visual field and perimetry, Dr.Schuman says. OCT detection of a thin RNFL is anindependent predictor of future glaucomatous change.2
Case 4: Patient with Glaucoma Of course, the most important goals for glaucoma
patients are obtaining a specific diagnosis to guidetreatment, following the effects of treatment anddetecting any disease progression, Dr. Schuman says.In this case, the patient has an RNFL defect infer-otemporally in the left eye (Figure 4).
Macular segmentation with Cirrus HD-OCTshows even more information about the area of dam-age. Using this function, physicians can see thepatient’s focal defect extending into the macula, layerby layer, Dr. Schuman says.
What’s more, although Cirrus HD-OCT was ableto detect an abnormality in this patient, it wasn’t per-ceptible with time domain OCT. The RNFL doesn’tfall outside the normal range until it gets beyond thearea of that 3.4 mm diameter circle.
Advantages of OCT OCT helps physicians establish the presence or
absence of glaucoma. They can use OCT in the corre-
13
Case 3: Tracking Glaucoma Suspects
Figure 3. A 40-year-old African American man presented with an IOP of 23 mmHg, a central corneal thickness of 555 microns and a normal visual field. Hisphysician determined he had a large cup because he had a large disc. OCT put his RNFL thickness in the normal range, so he decided to monitor him.
Glaucoma Suspect: 40 YO AA Man, IOP 23, CCT 555
Disc Size Matters
Disc area = 3.95 mm2
Case 4: Patient With Glaucoma
Figure 4. The macular segmentation feature of Cirrus HD-OCT shows apatient with an RNFL defect inferotemporally in the left eye.
OD OS
References1. Kim JS, Xu J, Ishikawa H, et al. Reproducibility improved with 3D spectral domain opti-
cal coherence tomography. Poster presented at the annual meeting of The Associationfor Research in Vision and Ophthalmology, April 27–May 1, 2008, Fort Lauderdale, Fla.
2. Lalezary M, Medeiros FA, Weinreb RN, et al. Baseline optical coherence tomography predicts the development of glaucomatous change in glaucoma suspects. Am JOphthalmol. 2006;142: 576–582.
RNFL THICKNESS AVERAGE ANALYSISAvg Thickness 98
0309OMD-379-9.qxd:OMD Poly 2/12/09 4:17 PM Page 13
the classic scan, which is similar to macular scanning, thedevice gives us a 6-mm cube, 200 A-scans x 200 B-scans.But unlike other instruments, technicians don’t have toplace the circle exactly where they want it to be aroundthe disc, creating another source of error.
Technicians use the exquisite fundus image of the linescanning ophthalmoscope to visualize the optic nervehead during scan acquisition. Then Cirrus HD-OCTautomatically identifies the center of the disc and per-forms an RNFL analysis with a 3.4-mm diameter. Then,the software compares the TSNIT graph to a normativedatabase of about 300 patients.
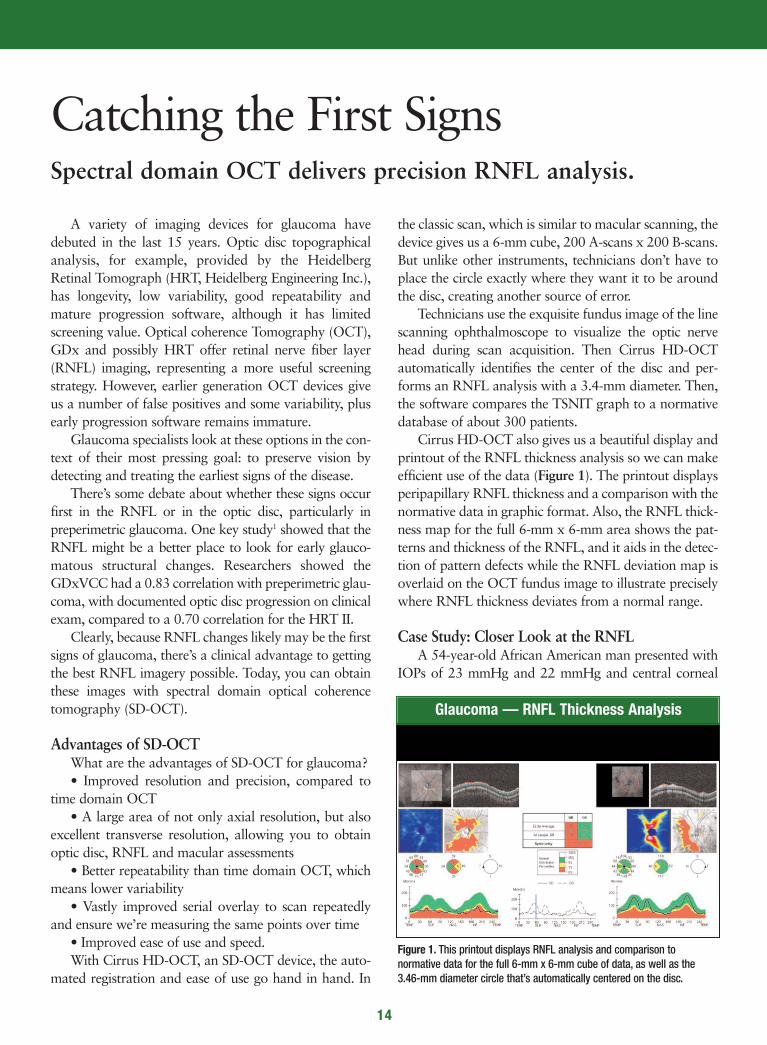
Cirrus HD-OCT also gives us a beautiful display andprintout of the RNFL thickness analysis so we can makeefficient use of the data (Figure 1). The printout displaysperipapillary RNFL thickness and a comparison with thenormative data in graphic format. Also, the RNFL thick-ness map for the full 6-mm x 6-mm area shows the pat-terns and thickness of the RNFL, and it aids in the detec-tion of pattern defects while the RNFL deviation map isoverlaid on the OCT fundus image to illustrate preciselywhere RNFL thickness deviates from a normal range.
Case Study: Closer Look at the RNFLA 54-year-old African American man presented with
IOPs of 23 mmHg and 22 mmHg and central corneal
A variety of imaging devices for glaucoma havedebuted in the last 15 years. Optic disc topographicalanalysis, for example, provided by the HeidelbergRetinal Tomograph (HRT, Heidelberg Engineering Inc.),has longevity, low variability, good repeatability andmature progression software, although it has limitedscreening value. Optical coherence Tomography (OCT),GDx and possibly HRT offer retinal nerve fiber layer(RNFL) imaging, representing a more useful screeningstrategy. However, earlier generation OCT devices giveus a number of false positives and some variability, plusearly progression software remains immature.
Glaucoma specialists look at these options in the con-text of their most pressing goal: to preserve vision bydetecting and treating the earliest signs of the disease.
There’s some debate about whether these signs occurfirst in the RNFL or in the optic disc, particularly inpreperimetric glaucoma. One key study1 showed that theRNFL might be a better place to look for early glauco-matous structural changes. Researchers showed theGDxVCC had a 0.83 correlation with preperimetric glau-coma, with documented optic disc progression on clinicalexam, compared to a 0.70 correlation for the HRT II.
Clearly, because RNFL changes likely may be the firstsigns of glaucoma, there’s a clinical advantage to gettingthe best RNFL imagery possible. Today, you can obtainthese images with spectral domain optical coherencetomography (SD-OCT).
Advantages of SD-OCTWhat are the advantages of SD-OCT for glaucoma? • Improved resolution and precision, compared to
time domain OCT • A large area of not only axial resolution, but also
excellent transverse resolution, allowing you to obtainoptic disc, RNFL and macular assessments
• Better repeatability than time domain OCT, whichmeans lower variability
• Vastly improved serial overlay to scan repeatedlyand ensure we’re measuring the same points over time
• Improved ease of use and speed. With Cirrus HD-OCT, an SD-OCT device, the auto-
mated registration and ease of use go hand in hand. In
14
Spectral domain OCT delivers precision RNFL analysis.
Catching the First Signs
Glaucoma — RNFL Thickness Analysis
Figure 1. This printout displays RNFL analysis and comparison to normative data for the full 6-mm x 6-mm cube of data, as well as the3.46-mm diameter circle that’s automatically centered on the disc.
0309OMD-379-9.qxd:OMD Poly 2/12/09 4:17 PM Page 14
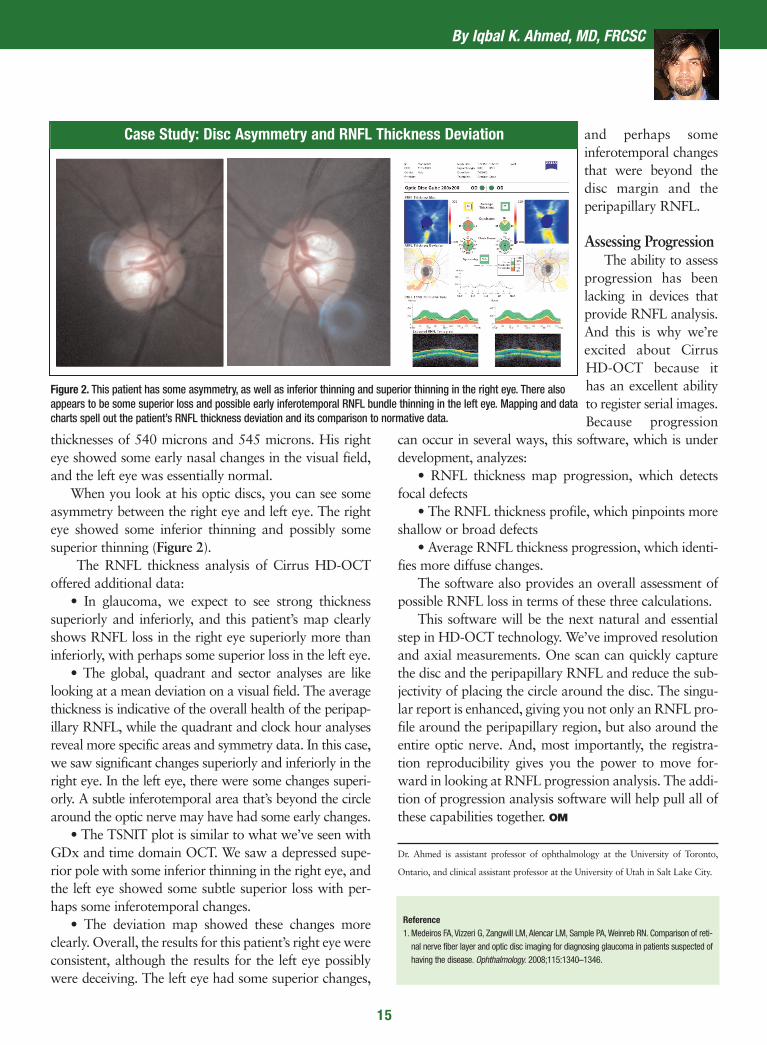
and perhaps someinferotemporal changesthat were beyond thedisc margin and theperipapillary RNFL.
Assessing ProgressionThe ability to assess
progression has beenlacking in devices thatprovide RNFL analysis.And this is why we’reexcited about CirrusHD-OCT because ithas an excellent abilityto register serial images.Because progression
can occur in several ways, this software, which is underdevelopment, analyzes:
• RNFL thickness map progression, which detectsfocal defects
• The RNFL thickness profile, which pinpoints moreshallow or broad defects
• Average RNFL thickness progression, which identi-fies more diffuse changes.
The software also provides an overall assessment ofpossible RNFL loss in terms of these three calculations.
This software will be the next natural and essentialstep in HD-OCT technology. We’ve improved resolutionand axial measurements. One scan can quickly capturethe disc and the peripapillary RNFL and reduce the sub-jectivity of placing the circle around the disc. The singu-lar report is enhanced, giving you not only an RNFL pro-file around the peripapillary region, but also around theentire optic nerve. And, most importantly, the registra-tion reproducibility gives you the power to move for-ward in looking at RNFL progression analysis. The addi-tion of progression analysis software will help pull all ofthese capabilities together. OM
Dr. Ahmed is assistant professor of ophthalmology at the University of Toronto,
Ontario, and clinical assistant professor at the University of Utah in Salt Lake City.
thicknesses of 540 microns and 545 microns. His righteye showed some early nasal changes in the visual field,and the left eye was essentially normal.
When you look at his optic discs, you can see someasymmetry between the right eye and left eye. The righteye showed some inferior thinning and possibly somesuperior thinning (Figure 2).
The RNFL thickness analysis of Cirrus HD-OCToffered additional data:
• In glaucoma, we expect to see strong thicknesssuperiorly and inferiorly, and this patient’s map clearlyshows RNFL loss in the right eye superiorly more thaninferiorly, with perhaps some superior loss in the left eye.
• The global, quadrant and sector analyses are likelooking at a mean deviation on a visual field. The averagethickness is indicative of the overall health of the peripap-illary RNFL, while the quadrant and clock hour analysesreveal more specific areas and symmetry data. In this case,we saw significant changes superiorly and inferiorly in theright eye. In the left eye, there were some changes superi-orly. A subtle inferotemporal area that’s beyond the circlearound the optic nerve may have had some early changes.
• The TSNIT plot is similar to what we’ve seen withGDx and time domain OCT. We saw a depressed supe-rior pole with some inferior thinning in the right eye, andthe left eye showed some subtle superior loss with per-haps some inferotemporal changes.
• The deviation map showed these changes moreclearly. Overall, the results for this patient’s right eye wereconsistent, although the results for the left eye possiblywere deceiving. The left eye had some superior changes,
15
By Iqbal K. Ahmed, MD, FRCSC
Reference1. Medeiros FA, Vizzeri G, Zangwill LM, Alencar LM, Sample PA, Weinreb RN. Comparison of reti-
nal nerve fiber layer and optic disc imaging for diagnosing glaucoma in patients suspected ofhaving the disease. Ophthalmology. 2008;115:1340–1346.
Case Study: Disc Asymmetry and RNFL Thickness Deviation
Figure 2. This patient has some asymmetry, as well as inferior thinning and superior thinning in the right eye. There alsoappears to be some superior loss and possible early inferotemporal RNFL bundle thinning in the left eye. Mapping and datacharts spell out the patient’s RNFL thickness deviation and its comparison to normative data.
0309OMD-379-9.qxd:OMD Poly 2/12/09 4:17 PM Page 15