maps chile macroeconomic modelling results: memo ii model november 5th, 2014 econlab iii, cape town
TRANSCRIPT

MAPS Chile
Macroeconomic Modelling Results: MEMO II Model
November 5th, 2014EconLab III, Cape Town

2
Framework

Macroeconomic Modelling: Objectives
Macroeconomic model (DSGE) to asses the impact of 9 mitigation scenarios built by Institute for Structural Research (IBS, Poland):
• Aggregate emissions
• Macroeconomic indicators:
‐ GDP growth rate‐ Sectorial GDP‐ Employment and unemployment‐ Consumption‐ Investment‐ Fiscal revenue and expenditure‐ Current account‐ Exchange rate‐ Wages
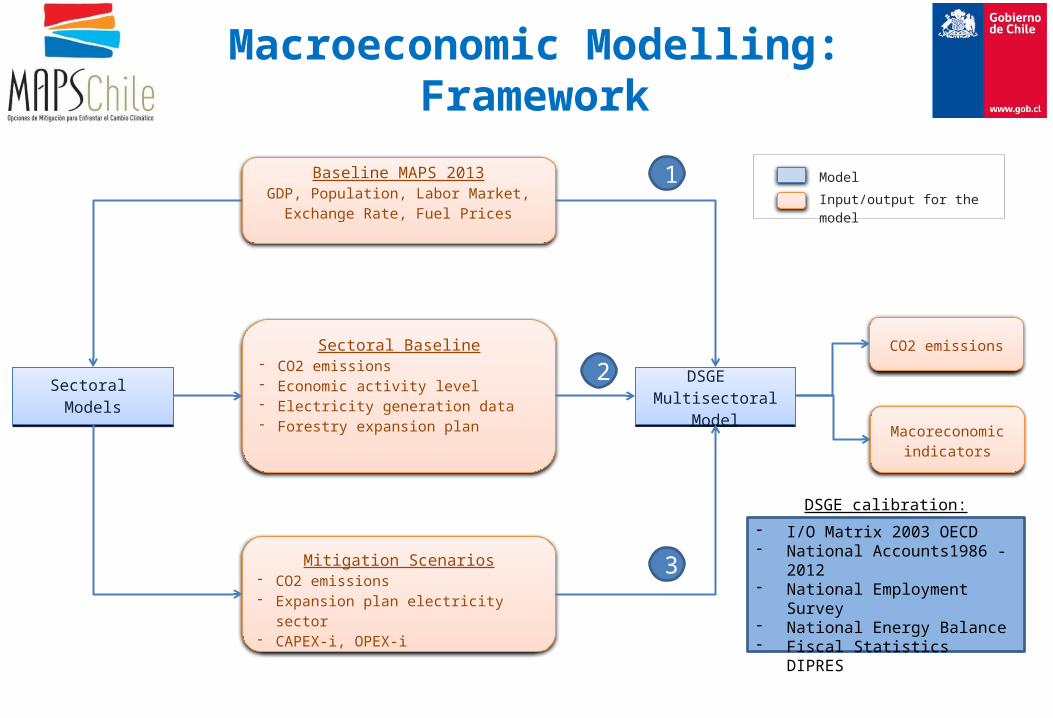
Macroeconomic Modelling:Framework
Sectoral Baseline- CO2 emissions- Economic activity level- Electricity generation data - Forestry expansion plan
DSGE Multisectoral Model
DSGE Multisectoral Model
Baseline MAPS 2013GDP, Population, Labor Market, Exchange
Rate, Fuel Prices
Sectoral Models
Sectoral Models
Macoreconomic
indicators
CO2 emissions
Model
Input/output for the model
Mitigation Scenarios- CO2 emissions- Expansion plan electricity sector- CAPEX-i, OPEX-i
1
2
3DSGE calibration:
- I/O Matrix 2003 OECD- National Accounts1986 -2012- National Employment Survey- National Energy Balance- Fiscal Statistics DIPRES

Links: Sectoral Models and DSGE Model
Electricity generation
Mining and Industry
Transport
Agriculture
Forestry
CPR
Waste
Raw materials
Public services
Construction
Transport
Agriculture and Forestry
Trade
Financial Services
Industry
Services
Electricity generation
Households
Sectoral Models DSGE Model
Coal
Oil
Gas
Copper
Coal
Crude petroleum
Diesel
Gasoline
Other oil derivate
Natural gas
LPG and kerosene
Copper
Sectoral Models DSGE Model

6
Macroeconomic model: DSGE MEMO II

Characteristics of MEMO II Model
• Dynamic Stochastic General Equilibrium model (DSGE)
• Small open economy
• 10 productive sectors y 4 type of raw materials
• More than 4000 variables
• Calibrated with data for the Chilean economy

Structure of the Model: General Equilibrium

9
Mitigation Actions
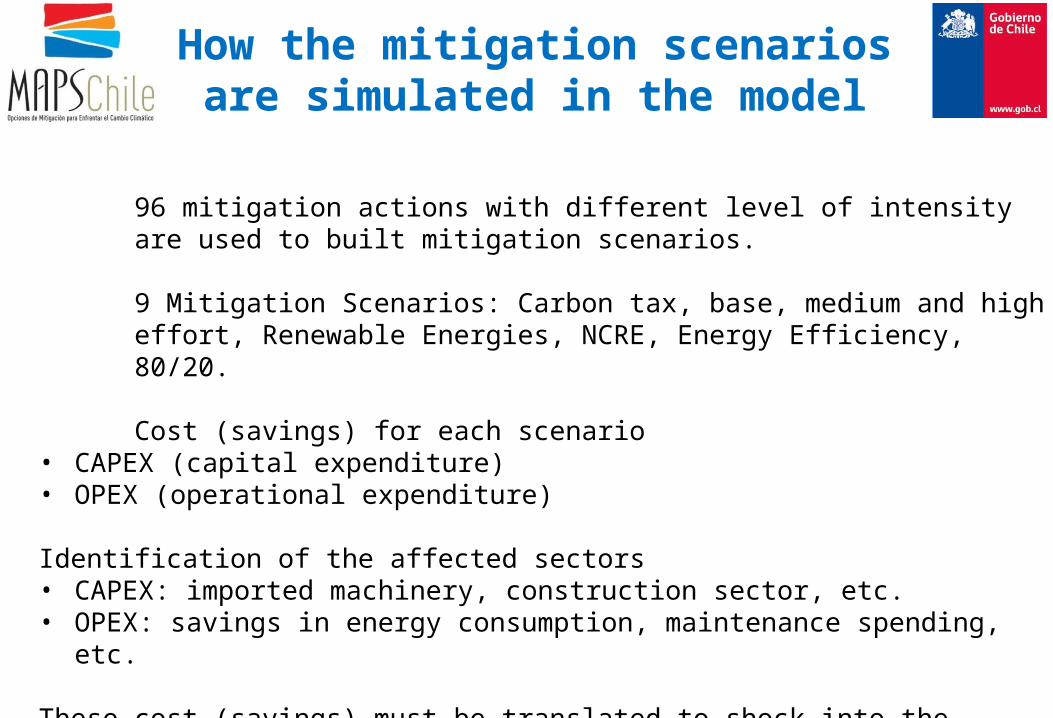
How the mitigation scenarios are simulated in the model
96 mitigation actions with different level of intensity are used to built mitigation scenarios.
9 Mitigation Scenarios: Carbon tax, base, medium and high effort, Renewable Energies, NCRE, Energy Efficiency, 80/20.
Cost (savings) for each scenario• CAPEX (capital expenditure)• OPEX (operational expenditure)
Identification of the affected sectors• CAPEX: imported machinery, construction sector, etc.• OPEX: savings in energy consumption, maintenance spending, etc.
These cost (savings) must be translated to shock into the model.

11
Model:
Kalman filter
Information (w) Selection of shocks ()
Estimated shocks
)
Simulation results (deviations from baseline, %)
Problems
Simulation Strategy
Data (w)Shocks
selection ()

DSGE Model ResultsMitigation Scenarios
DSGE Model ResultsCarbon Tax Scenarios
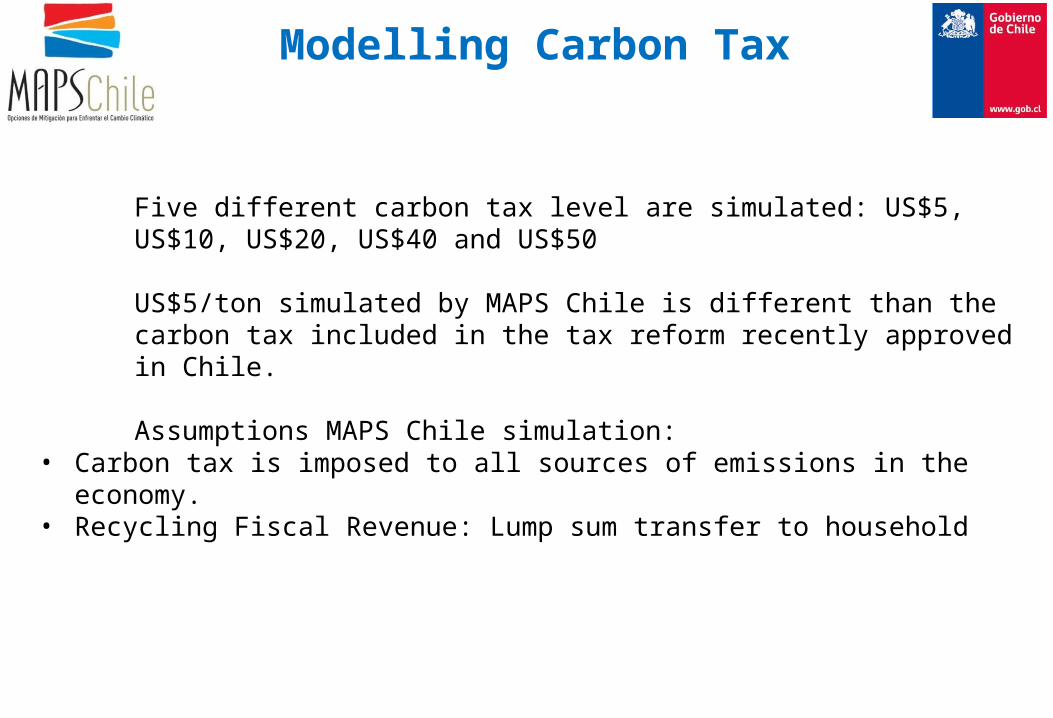
Modelling Carbon Tax
Five different carbon tax level are simulated: US$5, US$10, US$20, US$40 and US$50
US$5/ton simulated by MAPS Chile is different than the carbon tax included in the tax reform recently approved in Chile.
Assumptions MAPS Chile simulation:• Carbon tax is imposed to all sources of emissions in the economy.• Recycling Fiscal Revenue: Lump sum transfer to household
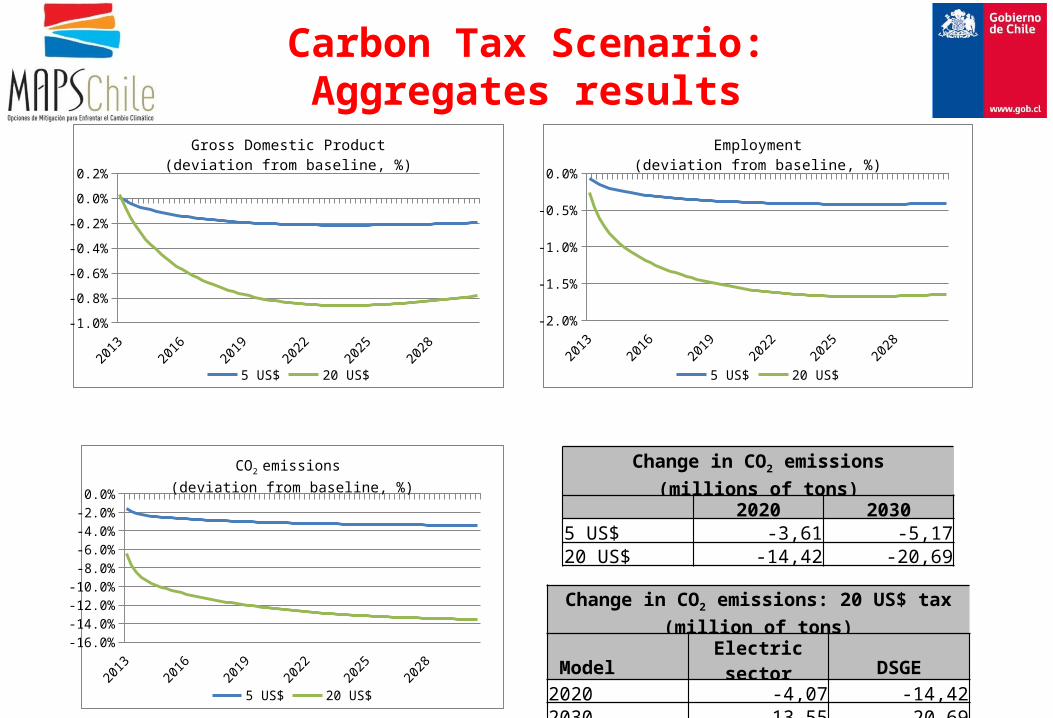
Carbon Tax Scenario: Aggregates results
20132014
20152016
20172018
20192020
20212022
20232024
20252026
20272028
20292030
-1.0%
-0.8%
-0.6%
-0.4%
-0.2%
0.0%
0.2%
5 US$ 20 US$
Gross Domestic Product(deviation from baseline, %)
20132014
20152016
20172018
20192020
20212022
20232024
20252026
20272028
20292030
-1.8%-1.6%-1.4%-1.2%-1.0%-0.8%-0.6%-0.4%-0.2%0.0%
5 US$ 20 US$
Employment(deviation from baseline, %)
-16.0%-14.0%-12.0%-10.0%
-8.0%-6.0%-4.0%-2.0%0.0%
5 US$ 20 US$
CO2 emissions (deviation from baseline, %)
Change in CO2 emissions(millions of tons)
2020 20305 US$ -3,61 -5,1720 US$ -14,42 -20,69
Change in CO2 emissions: 20 US$ tax(million of tons)
Model Electric sector DSGE2020 -4,07 -14,422030 -13,55 -20,69
20132014
20152016
20172018
20192020
20212022
20232024
20252026
20272028
20292030
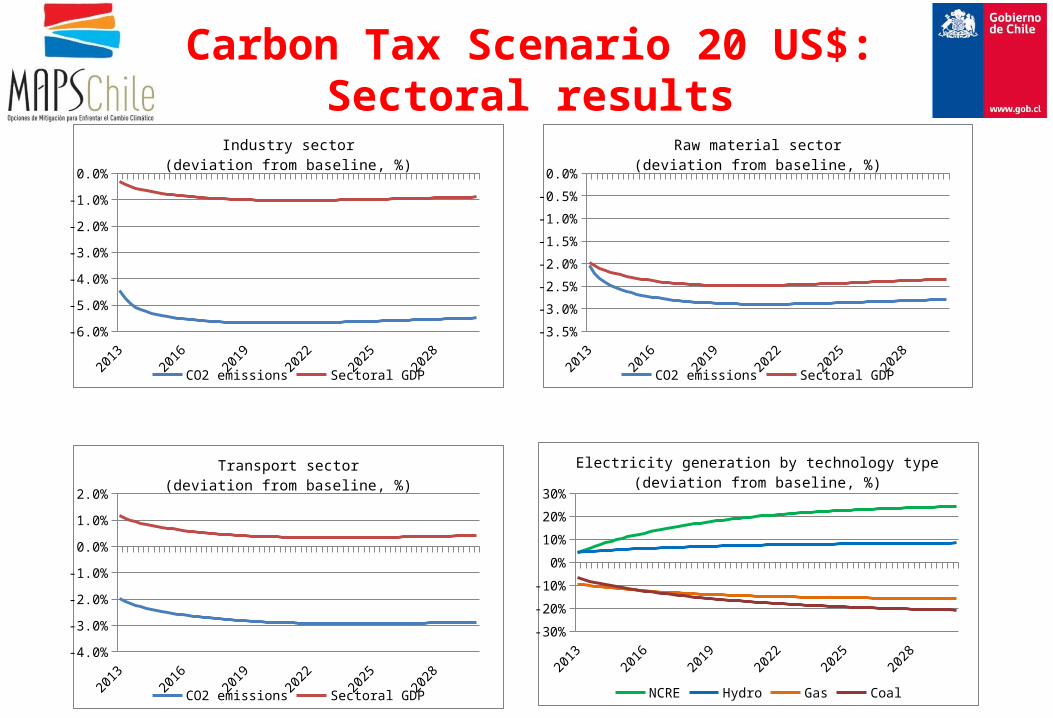
-6.0%
-5.0%
-4.0%
-3.0%
-2.0%
-1.0%
0.0%
CO2 emissions Sectoral GDP
Industry sector(deviation from baseline, %)
20132014
20152016
20172018
20192020
20212022
20232024
20252026
20272028
20292030
-3.5%
-3.0%
-2.5%
-2.0%
-1.5%
-1.0%
-0.5%
0.0%
CO2 emissions Sectoral GDP
Raw material sector(deviation from baseline, %)
20132014
20152016
20172018
20192020
20212022
20232024
20252026
20272028
20292030
-3.5%-3.0%-2.5%-2.0%-1.5%-1.0%-0.5%0.0%0.5%1.0%1.5%
CO2 emissions Sectoral GDP
Transport sector(deviation from baseline, %)
Carbon Tax Scenario 20 US$: Sectoral results
20132014
20152016
20172018
20192020
20212022
20232024
20252026
20272028
20292030
-30%
-20%
-10%
0%
10%
20%
30%
NCRE Hydro Gas Coal
Electricity generation by technology type(deviation from baseline, %)

Effects on Employment Effects on Employment and Unemployment rate
(1) It Includes agriculture, hunting, forestry and fishing.(2) It Includes construction and real states.(3) It Includes electricity, gas and water.(4) It Includes services of finance intermediation.(5) It Includes manufacturing industry.(6) It Includes public administration, defense, social security, education, others. (7) It Includes domestic services and other services.(8) It transport, storage and telecommunication.(9) It Includes retail sales.(10) It Includes mining.
(1) There is no direct relationship between unemployment and employment because the labor force is endogenous in the DSGE model.
Carbon Tax Scenario 20 US$: Employment
SectorSector share in
total employment
(year 2012, %)
Deviation from baseline
year 2020 (%)
Deviation from baseline
year 2030 (%)
Agriculture (1) 10,0% -1,8% -1,8%Construction (2) 14,6% -2,0% -0,9%
Electricity (3) 0,7% -1,5% -2,1%Financial services (4) 1,8% -1,9% -1,9%
Industry (5) 11,6% -2,5% -2,4%Public services (6) 20,8% -0,8% -1,5%Other services (7) 10,3% -1,3% -1,4%
Transport (8) 7,3% -1,9% -1,8%Trade (9) 19,7% -1,6% -1,5%
Raw material (10) 3,3% -3,0% -2,9%Total 100,0% -1,6% -1,6%
YearNatural
unemployment rate (%)
Unemployment rate1 (%)
Change in employment
(number)
2020 8,0% 8,3% -140.182
2030 8,0% 8,2% -152.469

DSGE Model ResultsBase Scenario
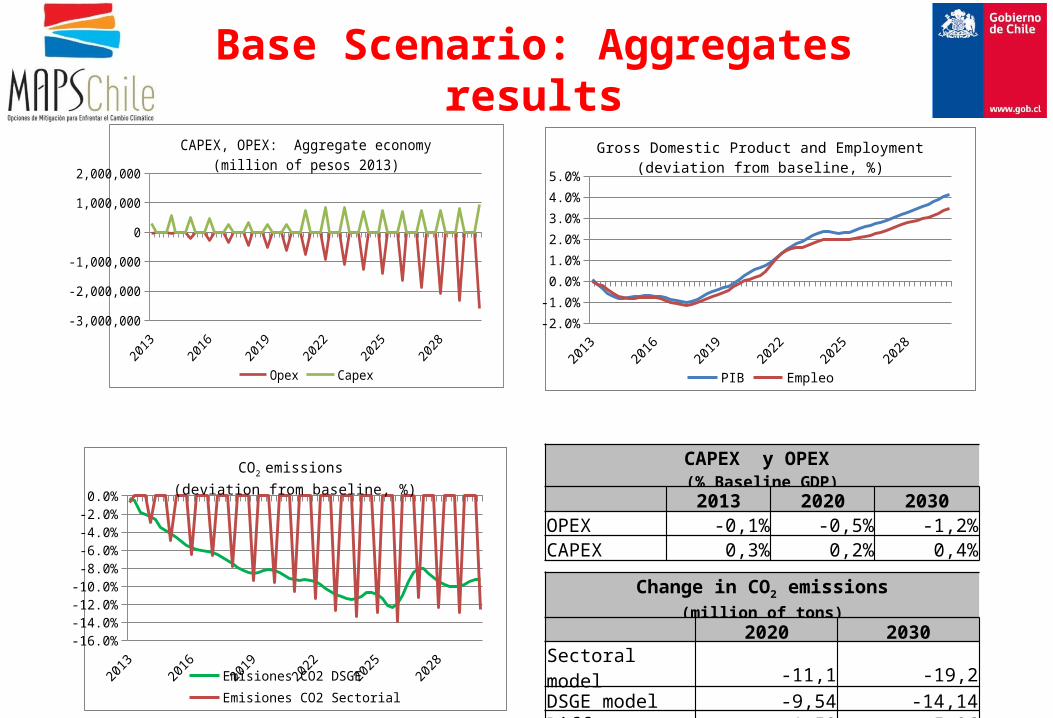
Base Scenario: Aggregates results
20132014
20152016
20172018
20192020
20212022
20232024
20252026
20272028
20292030
-2.0%
-1.0%
0.0%
1.0%
2.0%
3.0%
4.0%
5.0%
PIB Empleo
Gross Domestic Product and Employment(deviation from baseline, %)
-16.0%-14.0%-12.0%-10.0%
-8.0%-6.0%-4.0%-2.0%0.0%
Emisiones CO2 DSGE Emisiones CO2 Sectorial
CO2 emissions (deviation from baseline, %)
-3,000,000-2,500,000-2,000,000-1,500,000-1,000,000
-500,0000
500,0001,000,0001,500,000
Opex Capex
CAPEX, OPEX: Aggregate economy(million of pesos 2013)
CAPEX y OPEX (% Baseline GDP)
2013 2020 2030OPEX -0,1% -0,5% -1,2%CAPEX 0,3% 0,2% 0,4%
Change in CO2 emissions(million of tons)
2020 2030Sectoral model -11,1 -19,2DSGE model -9,54 -14,14Difference 1,58 5,06
20132014
20152016
20172018
20192020
20212022
20232024
20252026
20272028
20292030
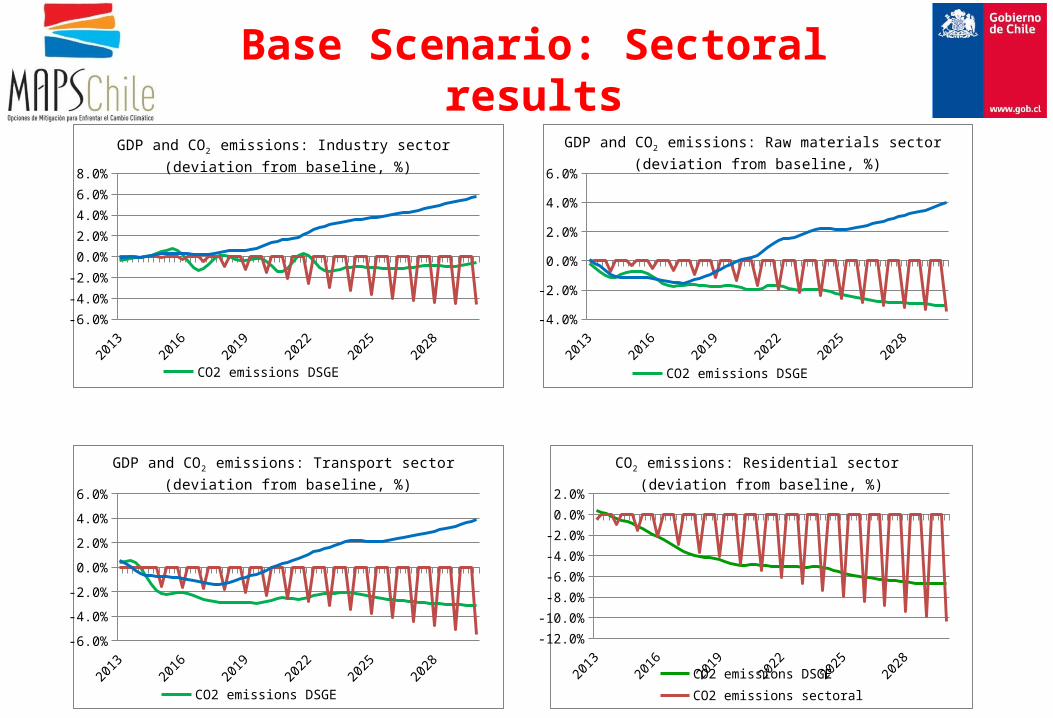
-6.0%
-4.0%
-2.0%
0.0%
2.0%
4.0%
6.0%
8.0%
CO2 emissions DSGE CO2 emissions sectoral model GDP
GDP and CO2 emissions: Industry sector (deviation from baseline, %)
20132014
20152016
20172018
20192020
20212022
20232024
20252026
20272028
20292030
-4.0%
-2.0%
0.0%
2.0%
4.0%
6.0%
CO2 emissions DSGE CO2 emissions sectoral model GDP
GDP and CO2 emissions: Raw materials sector (deviation from baseline, %)
20132014
20152016
20172018
20192020
20212022
20232024
20252026
20272028
20292030
-6.0%
-4.0%
-2.0%
0.0%
2.0%
4.0%
6.0%
CO2 emissions DSGE CO2 emissions Sectoral model GDP
GDP and CO2 emissions: Transport sector (deviation from baseline, %)
-12.0%
-10.0%
-8.0%
-6.0%
-4.0%
-2.0%
0.0%
2.0%
CO2 emissions DSGE CO2 emissions sectoral
CO2 emissions: Residential sector (deviation from baseline, %)
Base Scenario: Sectoral results
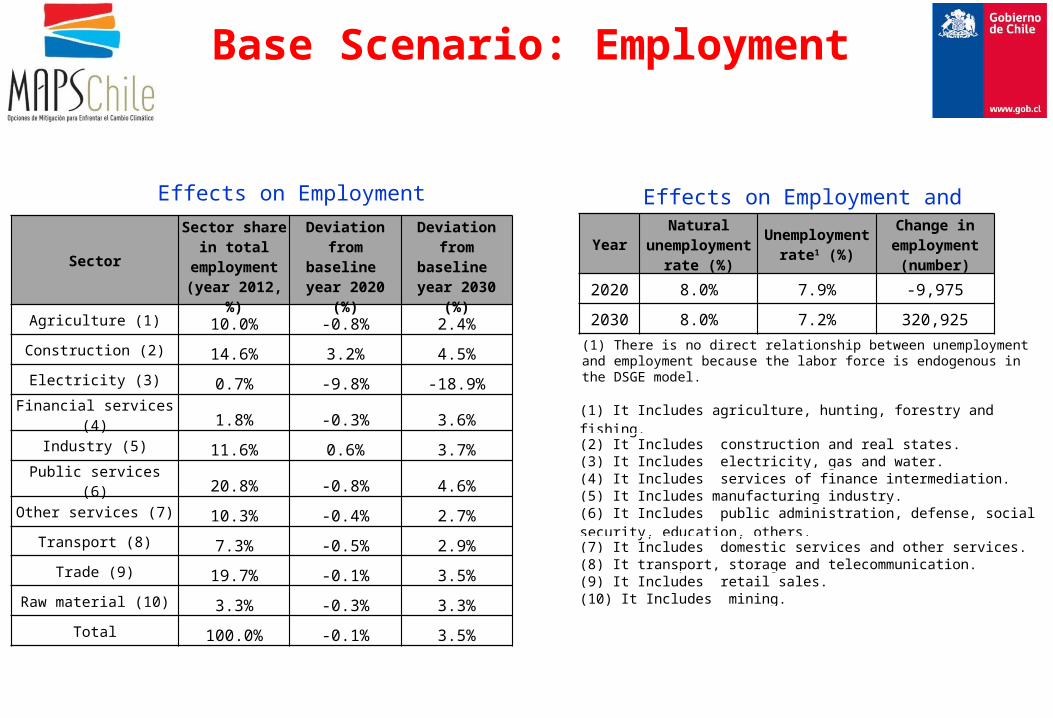
Effects on Employment Effects on Employment and Unemployment rate
(1) It Includes agriculture, hunting, forestry and fishing.(2) It Includes construction and real states.(3) It Includes electricity, gas and water.(4) It Includes services of finance intermediation.(5) It Includes manufacturing industry.(6) It Includes public administration, defense, social security, education, others. (7) It Includes domestic services and other services.(8) It transport, storage and telecommunication.(9) It Includes retail sales.(10) It Includes mining.
(1) There is no direct relationship between unemployment and employment because the labor force is endogenous in the DSGE model.
Base Scenario: Employment
SectorSector share in
total employment
(year 2012, %)
Deviation from baseline
year 2020 (%)
Deviation from baseline
year 2030 (%)
Agriculture (1) 10.0% -0.8% 2.4%Construction (2) 14.6% 3.2% 4.5%
Electricity (3) 0.7% -9.8% -18.9%Financial services (4) 1.8% -0.3% 3.6%
Industry (5) 11.6% 0.6% 3.7%Public services (6) 20.8% -0.8% 4.6%Other services (7) 10.3% -0.4% 2.7%
Transport (8) 7.3% -0.5% 2.9%Trade (9) 19.7% -0.1% 3.5%
Raw material (10) 3.3% -0.3% 3.3%Total 100.0% -0.1% 3.5%
YearNatural
unemployment rate (%)
Unemployment rate1 (%)
Change in employment
(number)
2020 8.0% 7.9% -9,975
2030 8.0% 7.2% 320,925
DSGE Model ResultsHigh Effort Scenario
20132014
20152016
20172018
20192020
20212022
20232024
20252026
20272028
20292030
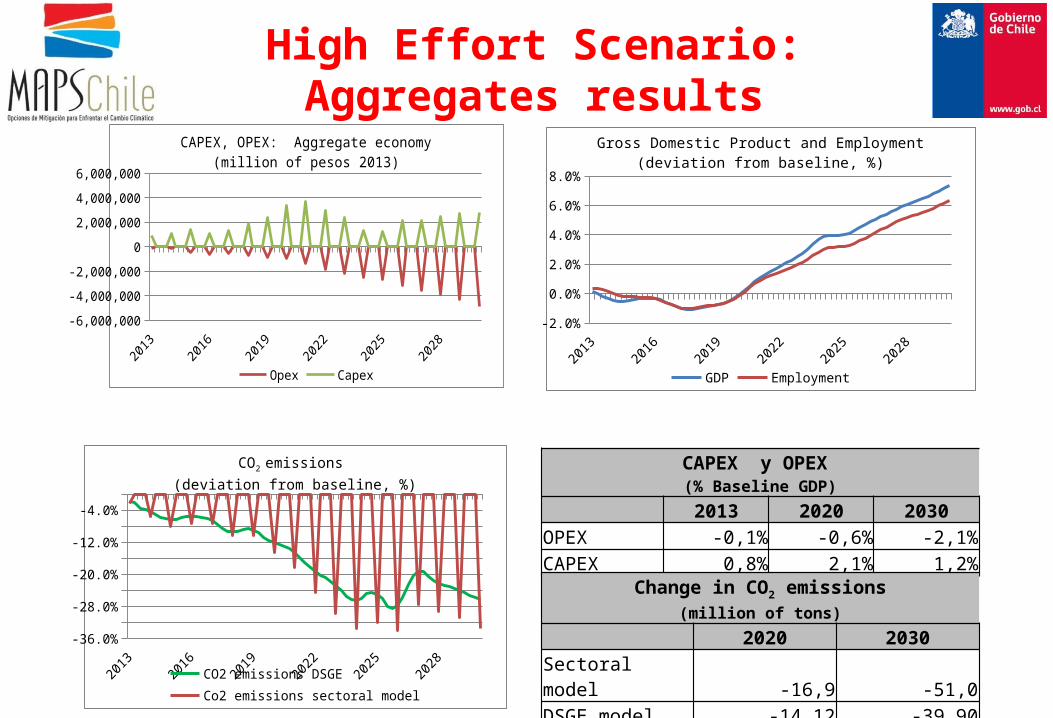
-2.0%-1.0%0.0%1.0%2.0%3.0%4.0%5.0%6.0%7.0%8.0%
GDP Employment
Gross Domestic Product and Employment(deviation from baseline, %)
-36.0%-32.0%-28.0%-24.0%-20.0%-16.0%-12.0%
-8.0%-4.0%0.0%
CO2 emissions DSGE Co2 emissions sectoral model
CO2 emissions (deviation from baseline, %)
-6,000,000
-4,000,000
-2,000,000
0
2,000,000
4,000,000
6,000,000
Opex Capex
CAPEX, OPEX: Aggregate economy(million of pesos 2013)
CAPEX y OPEX (% Baseline GDP)
2013 2020 2030OPEX -0,1% -0,6% -2,1%CAPEX 0,8% 2,1% 1,2%
Change in CO2 emissions(million of tons)
2020 2030Sectoral model -16,9 -51,0DSGE model -14,12 -39,90Difference 2,76 11,06
High Effort Scenario: Aggregates results

-15.0%
-10.0%
-5.0%
0.0%
5.0%
10.0%
15.0%
CO2 emissions DSGE CO2 emissions sectoral model GDP
GDP and CO2 emissions: Industry sector (deviation from baseline, %)
-12.0%-10.0%
-8.0%-6.0%-4.0%-2.0%0.0%2.0%4.0%6.0%
CO2 emissions DSGE CO2 emissions sectoral model GDP
GDP and CO2 emissions: Raw materials sector (deviation from baseline, %)
-20.0%
-15.0%
-10.0%
-5.0%
0.0%
5.0%
10.0%
Emisiones CO2 DSGE CO2 emissions sectoral model GDP
GDP and CO2 emissions: Transport sector (deviation from baseline, %)
-12.0%
-10.0%
-8.0%
-6.0%
-4.0%
-2.0%
0.0%
CO2 emissions DSGE CO2 emissions sectoral model
CO2 emissions: Residential sector (deviation from baseline, %)
High Effort Scenario: Sectoral results
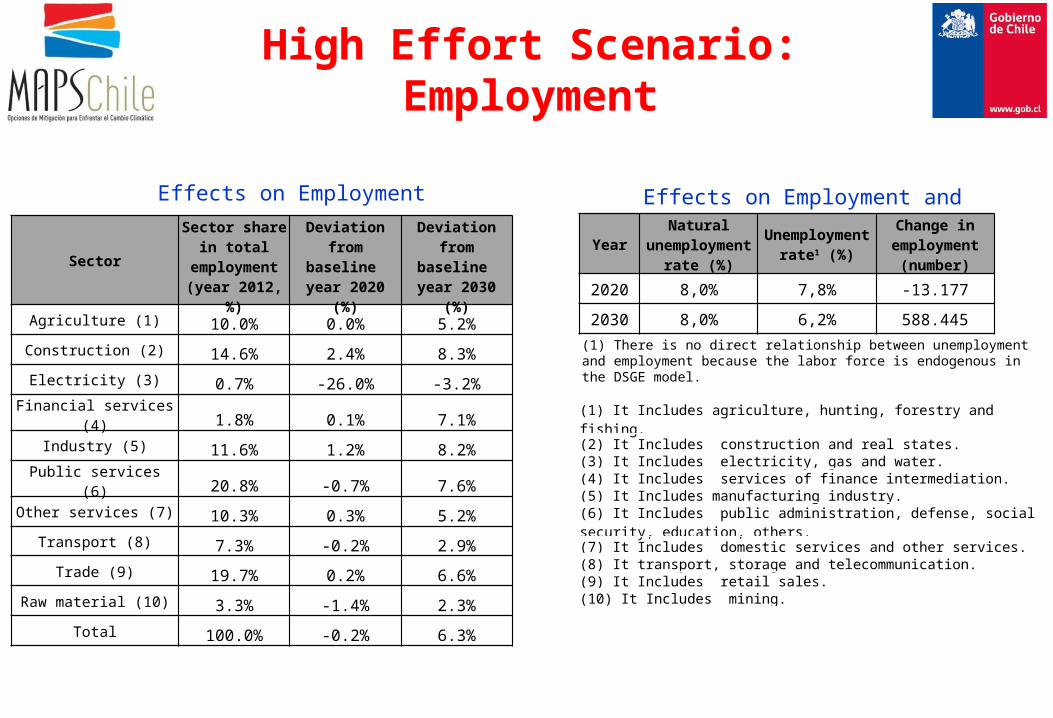
Effects on Employment Effects on Employment and Unemployment rate
(1) It Includes agriculture, hunting, forestry and fishing.(2) It Includes construction and real states.(3) It Includes electricity, gas and water.(4) It Includes services of finance intermediation.(5) It Includes manufacturing industry.(6) It Includes public administration, defense, social security, education, others. (7) It Includes domestic services and other services.(8) It transport, storage and telecommunication.(9) It Includes retail sales.(10) It Includes mining.
(1) There is no direct relationship between unemployment and employment because the labor force is endogenous in the DSGE model.
High Effort Scenario: Employment
SectorSector share in
total employment
(year 2012, %)
Deviation from baseline
year 2020 (%)
Deviation from baseline
year 2030 (%)
Agriculture (1) 10.0% 0.0% 5.2%Construction (2) 14.6% 2.4% 8.3%
Electricity (3) 0.7% -26.0% -3.2%Financial services (4) 1.8% 0.1% 7.1%
Industry (5) 11.6% 1.2% 8.2%Public services (6) 20.8% -0.7% 7.6%Other services (7) 10.3% 0.3% 5.2%
Transport (8) 7.3% -0.2% 2.9%Trade (9) 19.7% 0.2% 6.6%
Raw material (10) 3.3% -1.4% 2.3%Total 100.0% -0.2% 6.3%
YearNatural
unemployment rate (%)
Unemployment rate1 (%)
Change in employment
(number)
2020 8,0% 7,8% -13.177
2030 8,0% 6,2% 588.445

DSGE Model ResultsAll Scenarios
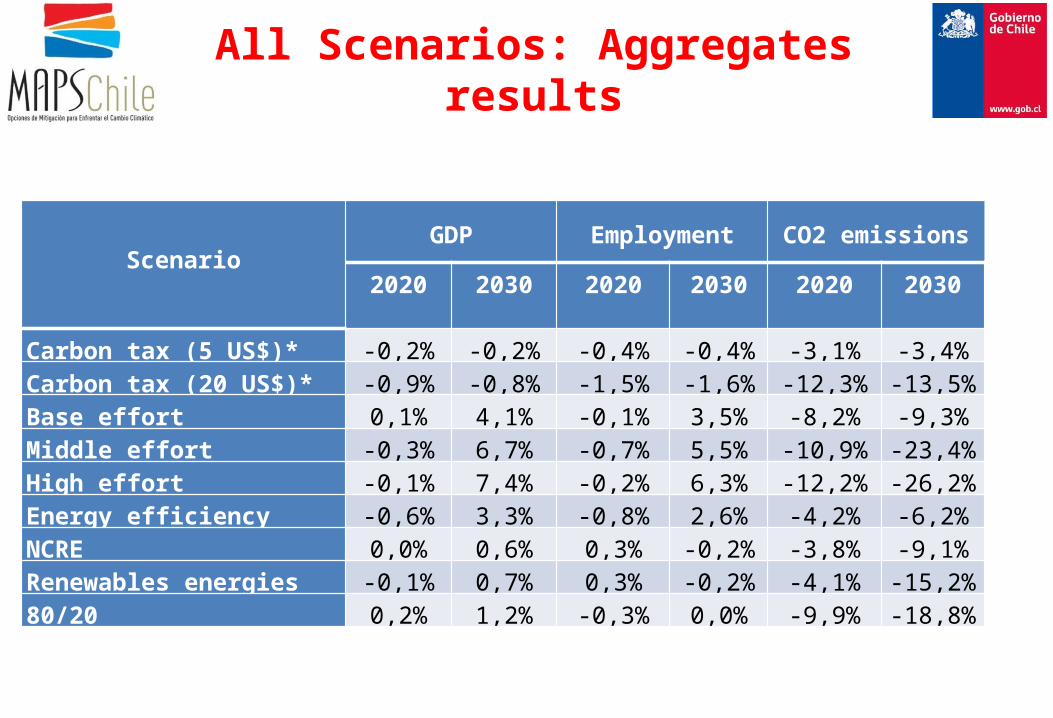
All Scenarios: Aggregates results
Scenario GDP Employment CO2 emissions
2020 2030 2020 2030 2020 2030
Carbon tax (5 US$)* -0,2% -0,2% -0,4% -0,4% -3,1% -3,4%Carbon tax (20 US$)* -0,9% -0,8% -1,5% -1,6% -12,3% -13,5%Base effort 0,1% 4,1% -0,1% 3,5% -8,2% -9,3%Middle effort -0,3% 6,7% -0,7% 5,5% -10,9% -23,4%High effort -0,1% 7,4% -0,2% 6,3% -12,2% -26,2%Energy efficiency -0,6% 3,3% -0,8% 2,6% -4,2% -6,2%NCRE 0,0% 0,6% 0,3% -0,2% -3,8% -9,1%Renewables energies -0,1% 0,7% 0,3% -0,2% -4,1% -15,2%80/20 0,2% 1,2% -0,3% 0,0% -9,9% -18,8%

Macroeconomic Modelling Results: MEMO II Model
November 5th, 2014EconLab III, Cape Town