manufacturing cell design with reduction in setup time through genetic...
TRANSCRIPT

Journal of Theoretical and Applied Information Technology
© 2005 JATIT. All rights reserved.
www.jatit.org
MANUFACTURING CELL DESIGN WITH REDUCTION IN
SETUP TIME THROUGH GENETIC ALGORITHM M. MURUGAN 1, V. SELLADURAI 2.
1. SENIOR LECTURER, DEPARTMENT OF MECHANICAL ENGINEERING, SRI RAMAKRISHNA ENGINEERING COLLEGE, COIMBATORE, TAMILNADU, INDIA
2. PROFESSOR, DEPARTMENT OF MECHANICAL ENGINEERING, COIMBATORE INSTITUTE OF
TECHNOLOGY, COIMBATORE, TAMILNADU, INDIA
ABSTRACT
Cellular manufacturing emerged as a production strategy capable of solving the problems of complexity and long manufacturing lead times in batch production. The fundamental problem in cellular manufacturing is the formation of product families and machine cells. This paper presents a new approach for obtaining simultaneous arrangement of part families and machine cells for cellular manufacturing systems. The main feature of the proposed method is, the relevant production data such as process sequences and setup times are taken in to account. It has the ability to select the best solution among the solutions of compactness, group technology efficiency and reducing setup time efficiency for each part before attempting to cluster the machines and parts. The formation of part family and machine cell has been treated as a maximization problem according to a defined performance measure ‘β’. A genetic algorithm has been developed for solving the cell formation problem considering the reduction in setup time. The validation has been done based on a real time manufacturing data. This algorithm is written in the ‘C’ language on Intel Pentium / PIII compatible system.
Keywords: Part family, Machine cell, Setup time, cell formation, genetic algorithm and Performance
measure.
M.Murugan, Faculuty of Mechanical Engineering, Sri Ramakrishna Engineering
College, Coimbatore- 641 022, Tamilnadu, India. Phone: 91-422-2460088,extn. 364,
Fax: 91-422-2461089, E-mail: [email protected]
76

Journal of Theoretical and Applied Information Technology
© 2005 JATIT. All rights reserved.
www.jatit.org
1. INTRODUCTION
Recent competitive economic situations
demand quicker supply of newer products with more innovative functionality to satisfy quickly changing customer requirements. In striving to remain competitive, the concept of Cellular Manufacturing has been extensively employed to the manufacturing systems. Cellular manufacturing emerged as a production strategy capable of solving the problem of complexity and long manufacturing lead times in batch production systems in the beginning of the 1960s. Burbidge (1979) defined group technology (GT) as an approach to the optimization of work in which the organizational production units are relatively independent groups, each responsible for the production of a given family of products. The fundamental problem in cellular manufacturing is the formation of product families and machine cells. Group technology is a principle, which decomposes a global system into several subsystems, which are easier to manage than the entire system. Applied to manufacturing, this principle is the base for the design of production cells. According to Wemmerlov and Hyer, the main improvements that can be expected from cellular manufacturing are reductions in throughput time, in material handling, in setup time and improvement of part quality. In essence, the basic information required to solve a CM problem is the Machine-Part Incidence Matrix, which consists of values of 0s and 1s, where 1 in an entry denotes that the corresponding coordinate of a part that requires the service of that machine, or otherwise. All CM problems are resolved by manipulating the incidence matrix in a manner such that the grouping of all similar objects is possible. The manipulation of a machine-part incidence matrix is based on, (a) the direct approach and (b) the indirect approach. The direct approach to a CM problem includes those methods in which the grouping of similarity objects entails rearrangement of rows and columns of the original incidence matrix. In such an approach, machine cells and part families are formed simultaneously. The Rank Order Clustering (ROC) algorithm of King (1980) and the Cluster Identification Algorithm (CIA) of Kusiak and Chow (1987) are
typical examples of such an approach. While the indirect approach involves the transformation of the original incidence matrix into a different form of information before data analysis is carried out. Data transformation can be done in two ways. The first way is by transforming a Machine Part Incidence Matrix (MPIM) into a part-based matrix in which the final result is in the form of part families. The second way is by transforming the original Machine Part Incidence Matrix into a machine-based matrix, the result of which is based on machine cells. Indirect approaches have been studied by Chow and Hawaleshka (1992), King and Nakomachai (1982), Wei and Kern (1989) and so on. Most of these methods of cell formation are based on machine-part incidence matrix alone. Other factors such as operations sequence, reduction in setup time and production volumes, if incorporated, can enhance the quality of the solutions. Nair and Narendran (1998) presented the algorithm, which clusters machines and parts on the basis of sequence data. Hiroshi Ohta & Masateru Nakamura (2002) developed the algorithm for cell formation with reduction in set up times through iterative method.
To the best of our knowledge, no algorithm to optimally solve the product- families and machine-cells problem has yet been proposed in the literature. This paper proposes a new cell formation with reduction in setup times between machines in the same cell through genetic algorithm approach. The objective of this paper is to present a procedure for obtaining manufacturing cells considering the factor sequence data with reduction in setup time. The approach combines a heuristic with a genetic algorithm. The heuristic proposed by Hiroshi Ohta et al.is responsible for selecting the initial solutions and the genetic algorithm is responsible for generating sets of machines cells with the objective of constructing sets of machine/product groups and improving the performance measure. 2. LITERATURE SURVEY The fundamental problem in cellular manufacturing is the formation of product families
77

Journal of Theoretical and Applied Information Technology
© 2005 JATIT. All rights reserved.
www.jatit.org
and machine cells. The objective of this product-machine grouping problem is to form perfect (i.e. disjoint) groups in which products do not have to move from one cell to the other for processing. The most common algorithms for GT found in the literature can be classified into the following four method categories: array-based, clustering, mathematical programming-based, and graph theoretic. Array-based clustering methods perform a series of column and row permutations to form product and machine cells simultaneously. King (1980) and later King and Nakornchai (1982) developed the earliest array-based methods. King and Nakornchai (1982), Chandrasekharan and Rajagopalan (1987), Khator and Irani (1987), and Kusiak and Chow (1987) proposed other algorithms. A comprehensive comparison of three array-based clustering techniques is given in Chu and Tsai (1990). The quality of the solution given by these methods depends on the initial configuration of the zero-one matrix. McAuley (1972) and Carrie (1973) developed the first algorithms using clustering and similarity coefficients. Since then, Mosier and Taube (1985a, b), Seifoddini (1989), Gupta and Seifoddini (1990), Khan et al. (2000), Yamada and Yin (2001), and Dimopoulos and Mort (2001) proposed hierarchical methods. These methods have the disadvantage of not forming product and machine cells simultaneously; so additional methods must be employed to complete the design of the system. GRAFICS, developed by Srinivasan and Narendran (1991), and ZODIAC, which is a modular version of MacQueen's clustering method, developed by Chandrasekharan and Rajagopalan (1987), are examples of non-hierarchical methods. Miltenburg and Zhang (1991) present a comprehensive comparison of nine clustering methods where non-hierarchical methods outperform both array-based and hierarchical methods. Mathematical programming methods treat the clustering problem as a mathematical
programming optimization problem. Different objective models have been used. Kusiak (1987) suggested the p-median model for GT, where it minimizes the total sum of distances between each product/machine pair. Shtub (1989) modeled the grouping problem as a generalized assignment problem. Choobineh (1988) formulated an integer-programming problem, which first determines product families and then assigns product families to cells with an objective of minimizing costs. Co and Araar (1988) developed a three-stage procedure to form cells and solved a 3-assignment problem to assign jobs to machines. Gunasingh and Lashkari (1989) formulated an integer-programming problem to group machines and products for cellular manufacturing systems. Srinivasan et al. (1990) modeled the problem as an assignment problem to obtain product and machine cells. Joines et al. (1996) developed an integer program that is solved using a genetic algorithm. Cheng et al. (1998) formulate the problem as a traveling salesman problem and solve the model using a genetic algorithm. Chen and Heragu (1999) present two stepwise decomposition approaches to solve large-scale industrial problems. Won (2000) presents a two-phase methodology based on an efficient p-median approach. Akturk and Turkcan (2000) propose an integrated algorithm that solves the machine/product-grouping problem by simultaneously considering the within-cell layout problem. Plaquin and Pierreval (2000) propose an evolutionary algorithm for cell formation taking into account specific constraints. Zhao and Wu (2000) present a genetic algorithm for cell formation with multiple routes and objectives. Caux et al. (2000) address the cell formation problem with multiple process plans and capacity constraints using a simulated annealing approach. Onwubolu and Mutingi (2001) develop a genetic algorithm approach taking into account cell-load variation. Uddin and Shanker (2002) address a generalized grouping problem, where each part has more than one process route. José Fernando Gonçalves and Mauricio G.C. Resende (2004) propose an evolutionary algorithm for obtaining the manufacturing cells. The problem is formulated as an integer-programming problem and a procedure based on a genetic algorithm is suggested as a solution methodology.
78

Journal of Theoretical and Applied Information Technology
© 2005 JATIT. All rights reserved.
www.jatit.org
Rajagopalan and Batra (1975) were the first to use graph theory to solve the grouping problem. They developed a machine graph with as many vertices as the number of machines. Two vertices were connected by an edge if there were parts requiring processing on both the machines. Cliques obtained from the graph were used to determine machine cells. The limitation of this method is that machine cells and part families are not formed simultaneously. Kumar et al. (1986) solved a graph decomposition problem to determine machine cells and part families for a fixed number of groups and with bounds on cell size. Their algorithm for grouping in a flexible manufacturing system is also applicable in the context of Group Technology.
Vannelli and Kumar (1986) developed graph theoretic models to determine machines to be duplicated so that a perfect block diagonal structure can, be obtained. Kumar and Vannelli (1987) developed a similar procedure for determining parts to be subcontracted in order to obtain a perfect block diagonal structure. These methods are found to depend on the initial pivot element choice. Vohra et al. (1990) suggested a network-based approach to solve the grouping problem. They used a modified form of the Gomory-Hu algorithm to decompose the part-machine graph. Askin et al. (1991) proposed a Hamiltonian-path algorithm for the grouping problem. The algorithm heuristically solves the distance matrix for machines as a TSP and finds a Hamiltonian path that gives the rearranged rows in the block diagonal structure. The disadvantage of this approach is that actual machine groups are not evident from its solution. Lee and Garcia-Diaz (1993) transformed the cell formation problem into a network flow formulation and used a primal-dual algorithm developed by Bertsekas and Tseng (1988) to determine the machine cells. Other graph approaches include the heuristic graph partitioning approach of Askin and Chiu (1990) and the
minimum spanning tree approach of Ng.S,. (1993, 1996). Selim et al. (1998) provide a comprehensive mathematical formulation of the cell formation problem and present a methodology-based classification of prior research. . Srinivasan and Narenderan (1991) developed a non-hierarchical clustering algorithm that identified seeds for clustering by solving an assignment problem. The above algorithms are based on the binary data. Based on production data, Gupta and Seifoddini (1990) and Nair and Narenderan (1998) developed a similarity coefficient based on part sequence data and developed non-hierarchical clustering algorithm to allow natural clusters to emerge and yield solutions of higher quality. They also developed (1999) a similarity coefficient based on production sequence, volumes, processing times and machine capacities and developed a non-hierarchical clustering algorithm with a twin objectives of minimizing within cell load variation as well as intercellular moves. Hiroshi Ohta and Nakamura (2002) developed an algorithm, which clusters machines and parts on the basis of sequence data and reduction in setup times between machines in the same cell, with an objective of maximizing the performance measure through an iterative method. This paper proposes a new cell formation with reduction in setup times between machines in the same cell through genetic algorithm approach. The objective of this paper is to present a procedure for obtaining manufacturing cells considering the factors sequence data and reduction in setup time. The approach combines a heuristic with genetic algorithm. The heuristic proposed by Hiroshi Ohta et al.is responsible for selecting the initial solutions and the genetic algorithm is responsible for generating sets of machines cells with the objective of constructing sets of machine/product groups and improving the performance measure.
Notations
79

Journal of Theoretical and Applied Information Technology
© 2005 JATIT. All rights reserved.
www.jatit.org
3.Similarity measure
Considering the number of trips for the parts and the set up time between machines i
and l, and the similarity measure introduced by Hiroshi Ohta & Nakamura is well taken in to this analysis.
__________________________ (1) ililil
bSTaICS +=
80

Journal of Theoretical and Applied Information Technology
© 2005 JATIT. All rights reserved.
www.jatit.org
Where Sil: Pairwise similarity between machines i and l ICil: Pairwise similarity between machines i and l on the movement of part STil: Pairwise similarity between machines i and l on setup times a, b : Weighting factors for similarity (where a + b = 1, 0 <= a, b <= 1)
____________________________ (2)
Where, Xjil: Number of import-trips to machine i and export-trips from machine i for part j that needs machine i and l Yji: Number of trips on machine i for part j bji: The operations sequence of part j on machine I ,bji=0 means that part j does not need machine i
____________________________ (3) djil : reducing rate of setup time Pjil if machine i and j are in the same cell Pjil : setup time for part j from machine i to machine l 3.1 Performance measure
The performance of the obtained cells is evaluated by the Compactness (members of the same group are highly similar), the group
technology efficiency, and the reducing efficiency of the setup times. The performance measure introduced by Hiroshi Ohta & Nakamura is
81

Journal of Theoretical and Applied Information Technology
© 2005 JATIT. All rights reserved.
www.jatit.org
____________________________ (4) STEGTECPN
β : Performance measure CPN: Compactness ◊ members of the same group are highly similar GTE: Group technology efficiency STE: Efficiency of setup times λ, µ, θ: weighting factors for performance measure Where,
____________________________ (5)
TOk : total number of operations in the k-th cell NOk : total number of non-operations in the k-th cell C : number of machine cell
____________________________ (6)
Where, H: the maximum number of inter-cell travels possible G: Number of inter-cell travels in the obtained cell Zjk: 0, if the k-th and (k+1)-th operations for part j are done in the same cell, and l, otherwise
______________________________ (7)
θµλβ ++=
82

Journal of Theoretical and Applied Information Technology
© 2005 JATIT. All rights reserved.
www.jatit.org
Where, U : Total reduced times in the obtained cell T : Maximum reduced setup times possible djil : reducing rate of setup time pjil if machine i and j are in the same cell Vjkil : 1, if the k-th and (k+1)-th operations for part j are done on machines j and i in the same cell, respectively, and 0, otherwise Pjil : setup time for part j from machine i to machine l
Eqn. (2) gives the similarity coefficient as the
ratio of the sum of the moves common to the machines i and l and sum of the total number of moves to and from machines i and l. Eqn. (3) gives the similarity coefficient as the ratio of the sum of the reduced setup times when machines i and l are in the same cell and sum of total reduced setup times possible between machines i and l. Eqn.(4) gives the performance measure β Eqn. (5) gives the compactness that is defined as the ratio of the number of operations within it to the maximum number of operations possible in it. Eqn. (6) gives the Group Technology Efficiency (GTE) which is defined as the ratio of the difference between the maximum number of intercell travels possible and the number of intercell travels in obtained cells. Eqn. (7) gives the reducing efficiency of the setup times which is defined as the ratio of the sum of reduced setup times in the obtained cells to the sum of the reduced setup times possible. 4. Cell Formation
Based on the similarity measure given by Eqn. (1), the machine-pair is chosen for which the similarity measure is minimum as the seeds for clustering. The machines chosen as the seeds for clustering are called centroids. Once a set of centroids is determined, machine-cells can be formed around these seeds by allotting other machines to the seed with which it has the maximum similarity. If a machine has the maximum similarity to the centroids, Nair and Narendran (1998) suggest that ties are broken arbitrarily (by randomly choosing a subset of machines from the contenders). However, in such a case, Hiroshi Ohta & Nakamura proposes the following modified procedure.
• The allotting machine is deferred and other machines are assigned to the centroids.
• The average similarity between the deferred machine and each cluster is computed by using Eqn. (8).
____________________________ (8)
83
Journal of Theoretical and Applied Information Technology
© 2005 JATIT. All rights reserved.
www.jatit.org
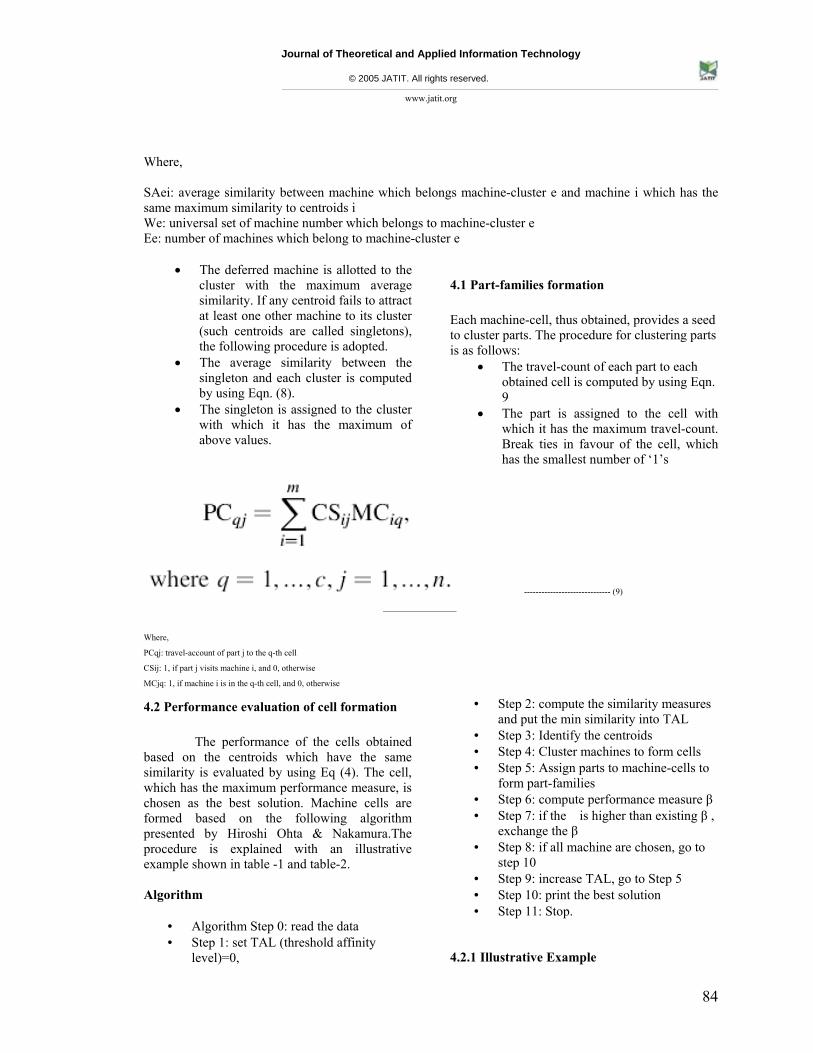
Where, SAei: average similarity between machine which belongs machine-cluster e and machine i which has the same maximum similarity to centroids i
iversal set of machine number of machines whic
The deferred machine is allotted to the
•
ll, thus obtained, provides a seed procedure for clustering parts
llows: • The travel-count of each part to each
ed by using Eqn.
------------------------------ (9)
2 Performa aluation f cel ormat
The performance of the cells obtained ich have the same
Eq (4). The cell, measure, is
e
nted
level)=0,
• Step 3: Identify the centroids • Step 4: Cluster machines to form cells • Step 5: Assign parts to machine-cells to
form part-families
p 8: if all machine are chosen, go to
5
4.2.1 Illu
We: un number which belongs to machine-cluster e e: h belong to machine-cluster e E
•
cluster with the maximum average similarity. If any centroid fails to attract
4.1 Part-families formation
at least one other machine to its cluster Each machine-celuster parts. The(such centroids are called singletons),
the following procedure is adopted. to cis as fo
• The average similarity between the singleton and each cluster is computed by using Eqn. (8). The singleton is assigned to the cluster with which it has the maximum of above values.
obtained cell is comput9
• The part is assigned to the cell with which it has the maximum travel-count. Break ties in favour of the cell, which has the smallest number of ‘1’s
_________________
Where,
PCqj: travel-account of part j to the q-th cell
CSij: 1, if part j visits machine i, and 0, otherwise
MCjq: 1, if machine i is in the q-th cell, and 0, otherwise
4. nce ev o l f ion • Step 2: compute the similarity measures and put the min similarity into TAL
based on the centroids whsimilarity is evaluated by using which has the maximum performancechosen as the best solution. Machine cells arformed based on the following algorithmprese by Hiroshi Ohta & Nakamura.The procedure is explained with an illustrative example shown in table -1 and table-2. Algorithm
• Algorithm Step 0: read the data • Step 1: set TAL (threshold affinity
• Step 6: compute performance measure β • Step 7: if the is higher than existing β ,
exchange the β • Ste
step 10 • Step 9: increase TAL, go to Step• Step 10: print the best solution • Step 11: Stop.
strative Example
84
Journal of Theoretical and Applied Information Technology
© 2005 JATIT. All rights reserved.
www.jatit.org
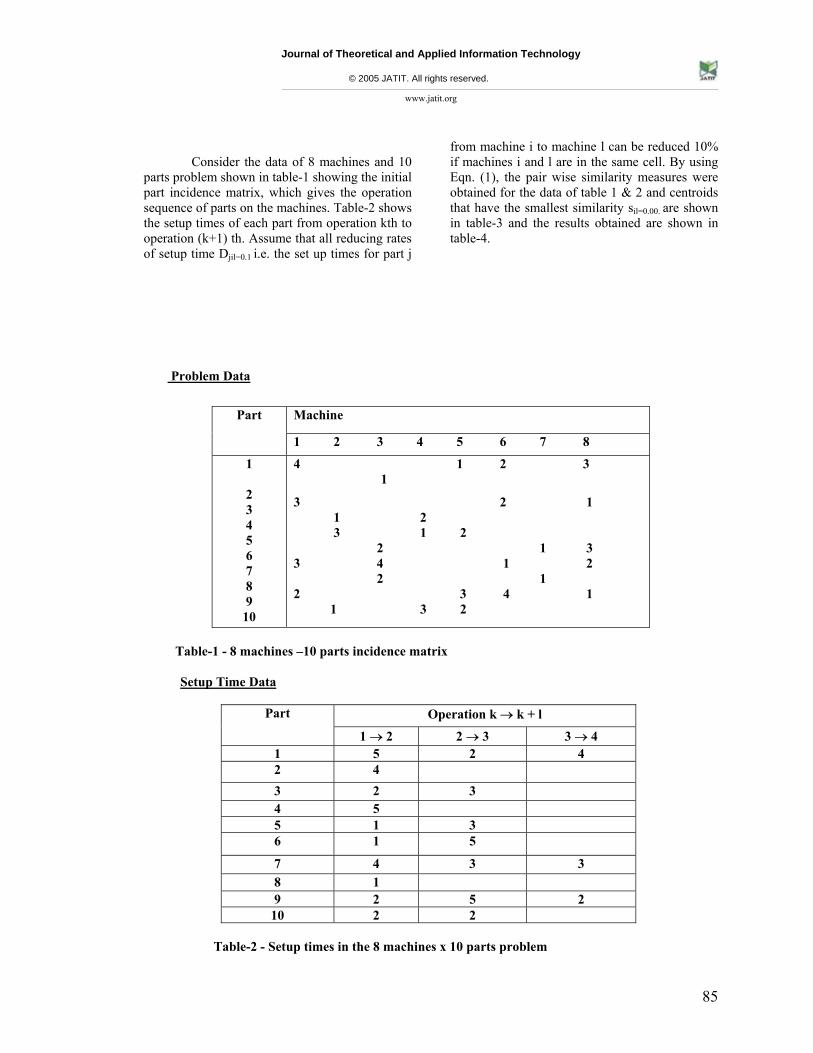
0 parts pro part inci h gives the operation sequence the poperationof setup j
Consider the data of 8 machines and 1blem shown in table-1 showing the initialdence matrix, whic of parts on the machines. Table-2 shows
setu times of each part from operation kth to (k+1) th. Assume that all reducing rates time Djil=0.1 i.e. the set up times for part
from machine i to machine l can be reduced 10% if machines i and l are in the same cell. By using Eqn. (1), the pair wise similarity measures were obtained for the data of table 1 & 2 and centroids that have the smallest similarity sil=0.00. are shown in table-3 and the results obtained are shown in table-4.
ta Problem Da
Table-1 - 8 machines
Setup Time Data
–10 parts incidence matrix
Machine Part
1 2 3 4 5 6 7 8
1
2 3
6
4 1 2 3 1
3 2 1 1 2
1 2
2
Table-2 - Setup times in the 8 machines x 10 parts problem
4 5
7 8 9
10
3 2 1 3 3 4 1 2 2 1
3 4 1 1 3 2
Operation k → k + l Part
3 → 4 1 → 2 2 → 3 1 5 2 4 2 4 3 2 3 4 5 5 1 3 6 1 5
7 4 3 3 8 1 9 2 5 2
10 2 2
85

Journal of Theoretical and Applied Information Technology
© 2005 JATIT. All rights reserved.
www.jatit.org
Pair-wise similarity between machine s i and l
Machine i Machine
l 1 2 4 5 6 7 3
2 0.000 3 0.238 0.000
4 0.000 0.822 0. 0 00
5 0.356 0.439 0. 0 0.373 00
6 0.572 0.000 0. 0 0.000 0.437 107 0.000 0.000 0.617 0.000 0.000 0.000 8 0.657 0.000 0.429 0.000 0.215 0.662 0.111
Table-4 - Pair-wise similarity between m
achines i and l
Machine cells and Part families by Hiro al rithmshi Ohta go
Machi cells rt f CPN STE GTE IENCYne Pa amily EFFIC
(13678,245) (136789,24510) 0.667 0.796 0.850 0.744986
(12 8,37) 1 ,6 0. 0.8 0.900 0.71033456 ( 23457910 8) 538 64 2
(23 ,168) (2 ,137 0. 0.6 0.750 0.662457 456810 9) 619 61 278
(2345,16 0.650 0.631780 78) (24510,136789) 0.625 0.627
(12456,378) (123457910,68) 0.543 0.661 0.650 0.599493
(134678,25) (136789,24510) 0.545 0.593 0.650 0.583532
(123678,45) 4510) 5 9 0 (136789,2 0.54 0.55 0.65 0.575058
(12368,457) (13679,245810) 0.550 0.525 0.550 0.543856
Table-4 – Result of Hiroshi Ohta algorithm
86

Journal of Theoretical and Applied Information Technology
© 2005 JATIT. All rights reserved.
www.jatit.org
The results of d partfamilies based on the 1 set of centroids and the perf sure β Eqn.(4). ble 4, in pes ofcell formed in the first iteration, but type 1 has the
perfo m β=74 refore, centroid (1, 2) was chosen as the best centroids in the first iteratio ause t ets of centr e the sa n and the result is shown in table-5.
Final Result of the 8 machines x 10 parts problem
machine cells an
ormance meaas shown in ta
obtained by using this example 4 ty
rmance easure .5%. The
n, bec 1 lead
he other sme cell formatiooids in typ
machine
6 1 8
2 4
1 1 2 4 3
3 2 3 1 4 1 3 2
IC ALGOR APP ACH
e ic gorithm GA) were intro
s bas h echanand n tural g netics. They
ch algor thms.
hromosomes) is generated. Some individuals are selected to be parents to produce offspring via a crossover operator. All the individuals are then evaluated and selected based on Darwin’s concept
of survival of the fittest. The process of reproduction, evaluation, and selection is repeated until a termination criterion is reached. In addition,
makeup e objective of this mutation process is to increase th iversity of th population and ensure an extensive search. Each iteration (also
o ) is made p of ch osom Each romos e is in
genes
evaluate the function being optimized. In each iteration of the search process, the system has a
on of chromosomes that represent the current solutions to the problem. Figure - 1 represents a pseudo-code for a standard genetic algorithm.
Part
2 4 5 3 7
2 1 1 2
5 3 1 2 10 1 3 2 6 2 1 3 8 2 1 7 9 3 4 2 1
Table-5- Final result of Hiroshi Ohta Algorithm. 5. GENET HM RO IT
G al s ( dunet cedby Holland (1975) and have been applied in a a
mutation operator with certain probability is number of fields, e.g. mathematics, engineering, biology, and social science (Goldberg, 1989). GAs
rc algorithm
applied to the individuals to change their genetic
are sea h ed on t e m icsnatural selection a e e d e
. Th of
combine the concept of survival of the fittest with e , yet ra omized ion exc ange referred to as generation or family of soluti nsstructur d nd , informat h
to form robust sear i u rom es. ch om
The concept of genetic algorithms is
turn made up of individual . These genes are encodings of the design variables that are used to
based on the evolution process that occurs in natural biology. An initial population of possible
lutions (referred to as individuals or fixed populatisoc
87

Journal of Theoretical and Applied Information Technology
© 2005 JATIT. All rights reserved.
www.jatit.org
______________________________________________________________________
_
nts of Pt and put Pt+
Genetic algorithm { Generate initial population Pt Evaluate population Pt while stopping criteria not satisfied repeat { Select elements from Pt to put into Pt+l
Crossover eleme into l Mutate elements of Pt and put into Pt+l Evaluate new population Pt+l Pt = Pt+l } } Figure -1 A standard genetic algorithm. The GA calls a subroutine to compute the fitness value (the quality) for each chromosome in the population. This fitness value is the only feedback to the GA. As mentioned earlier, the fitness function used is performance measure. The other important aspects of genetic algorithms: chromosomal representation and decoding, parent selection, crossover, and mutation will be discussed next. 5.1 Proposed Genetic Algorithm
The GA approach for machine grouping problem can be summarized as follows:
Step 1. Initialization
• Initialize population P0 randomly or
lation P0.
ep 2. P
mes Ck and Ck′ from the current
tion Pt.
ossover (one-point)
g point x from the range [1, 8].
the genes of osomes Ck and Ck′.
rom the range [1, 8]. • Select y genes randomly and change
ndom integer numbers from the range [1, 8].
tness function ft for all offspring chromosomes.
somes
tep 8. Stop
ormance measure.
the termin tiof gener nused as t tehas been cod
tis only tw ab, and every
select from the known values • Compute fitness function ft for all
osomes in the popuchrom
S arent selection t
• Randomly select two chromoso
popula
Step 3. Cr
• Generate an integer random cuttin
• Obtain two offspring chromosomes by exchangingchrom
Step 4. End of generation
• If the size of offspring is less than L, go to step 2; otherwise, go to the next step.
Step 5. Mutation
• Generate an integer random number y f
their values to ra
Step 6. Fitness evaluation
• Compute fi
• For the next generation population Pt+1, select the best chromoamong the offspring and the current population.
Step 7. Termination
• If the termination condition is not satisfied, set t→t+1 and go to step 2; otherwise go to next step
S
• Calculate the perf
In the above algorithm, the user can set a on condition. Either a limited number
atio s or a maximum run time could be he rmination rule. The GA algorithm
ed in “ C++ ” language.
5.1.1 Representation
In his work, number of cells considered o nd coding is done using alphabets a &
gene represents a cell number, and the
88

Journal of Theoretical and Applied Information Technology
© 2005 JATIT. All rights reserved.
www.jatit.org
position of a gene in the chromosome represents a machine number. The length of a chromosome representhe problem.
• Len ich indicates the number of machines in the
• The genes in the chromosome are a and b. Th lmachine hnumber 1of thcell numb• The position of awhich machine is present in which cell, i, e.
5 is in cell 2 and machine 1,
population or a well-selected population. An initial population desired size is chosen from the res tai shown isol(sh
Initia
ts the number of machines considered in For example
ababbaaa
gth of the chromosome is 8, wh
problem is 8.
e a phabet a indicates the position of the number and it belongs to t e cell . The alphabet b indicates the position
e machine number and it belongs to the er 2.
n alphabet indicates
machine 2, 4 and 3,6,7,8 is in cell 1.
5.1.2 Initialization
The initialization can be executed with either a randomly created
of the ults ob ned as
n the table 4. For example, 8 initial utions are chosen from the results obtained own in table-4) and shown in table-6
l Population
Sample Number Initial Population
1 ababbaaa
2 aabaaaba
3 baaaabab
4 baaaabbb
5 aabaaabb
6 abaabaaa
7 aaabbaaa
8 aaabbaba
Table-65.1.3 Fitness Function
- Initial Population
The fitness string in the population is computed and the objective is to find the maximum fitness function value. Initial population and its objecti function values are shown in table-7.
function for each
ve
( ) ( )( )tftF
+=
11
where,
ction value of a string ie objec
function value. Eqn. (1) is taken
F (t nction
Initial Population and their objective function value
f(t) = Objective funtive
as f (t)
) = Fitness fu
89

Journal of Theoretical and Applied Information Technology
© 2005 JATIT. All rights reserved.
www.jatit.org
Table-7-Initial population and their Objective function values
5.1.4 Selection an eproduction
Repro uction selects good strings in a population and f s a mating pool. That isthe reproduction o or is sometimes called the selection operator. Reproduction is responsiblthe exploration the current population by making many du es of good strings. Cover and mutation re responsible for exploring a set of good strings better strings. The suof GA depends o balance between the two. If too many copies of the good strings are alloin the mating pool en the diversity of the maool reduces, which in turn reduces the extent of
Here the Univ ling method is adopted for selecting the good strings and the
pulation after reprodu own in table-8. The probability of selecting each string is
lculated by
d R
dormperat
why ca
e for of plicats a
ross
for n a
ccess
cated ting , th
pthe search that can be accomplished using rossover and mutation operators. c
ersal samp
po ction is sh
totalFtFSI )(
=
Where, F (t) = Fitness string Ftotal = Total fitn f all strings
e Total fitness of th n is calculated as
value of the ithess value o
Th e populatio
n
∑==
total tFF )(
Sample Numbe Initial Population unction Value
i 1
r Objective F
1 ababbaaa 44986 0.7
2 aabaaaba 0.710332
3 baaaabab 0.662278
4 baaaabbb 0.631780
5 abb 0.599493 aabaa
6 abaabaaa 0.583532
7 aaabbaaa 0.575058
8 aaabbaba 0.543856
90

Journal of Theoretical and Applied Information Technology
© 2005 JATIT. All rights reserved.
www.jatit.org
After Reproduction
Table-8- Population after Reproduction
5.1.5 Crossover
The chromosome to be crossed and the crossing points are to be selected randomly. Crossover is carried out with a probability called the crossover probability Cprob. Random numbers are generated for each chromosome and compared with the crossover probability values. The
chromosomes within the values of Cprob are chosen for crossover. Here, Crossover probability is taken as 0.90. There are several types of crossover operators available and some of them are single point, two points, uniform and arithmetic crossover operators. Single point crossover is adopted in this work. The new population after mutation is shown in table-9.
For example,
no function
value
value
ili
selection
ve
pro
y
m
No.
prod’n
Sample
no.
on after
reprod’n
Sampl
e
Population before reprod’n
Objecti
ve
Raw
fitness
Probab
ty of
Cumulati Rando Re Populati
babilit
1 ababbaaa 74.4985
96
0.01342
3
0.104849 0.104849 0.14830 1 ababbaaa
2 aabaaaba 71.0332
03
0.01407
8
0.109964 0.214813 0.37190 2 aabaaaba
3 baaaabab 66.2277
98
0.01509
9
0.117943 0.332755 0.14410
0
1 ababbaaa
4 baaaabbb 63.1780
01
0.01582
8
0.123636 0.456391 0.93660
0
7 aaabbaaa
5 aabaaabb 59.9492
99
0.01668
1
0.130295 0.586686 0.23950
0
1 ababbaaa
6 abaabaaa 58.3531
99
0.01713
7
0.133859 0.720545 0.59150
0
4 aaabbaaa
7 aaabbaaa 57.5057
98
0.01739
0
0.135831 0.856376 0.93440
0
7 aaabbaaa
8 aaabbaba 54.3856
01
0.01838
7
0.143624 1.000000 0.66140
0
5 ababbaaa
91

Journal of Theoretical and Applied Information Technology
© 2005 JATIT. All rights reserved.
www.jatit.org
(Parent 1) aaa a|babb
(P nt 2) aaabare a|ab a
1) aabaaaba (Child
(Child 2) aa ababba
After Crossover
S.N er
reprodu n nction
ue
and
numbers
ross
Y or N
Cro
over
Site
Po
after
o. Population aft
ctio
Objective
fu
val
R om C over ss pulation
crossover
1 ababbaaa 80.497177 0.939700 N - ababbaaa
2 aaba .595337 0.869000 Y 6 aabaaaaa aaba 83
3 b 71 291400 Y 6 a abbaaa 80.49 77 0. ababbaba
4 aaab .420650 0.237300 Y 3 aaabbaaa baaa 61
5 b 71 722000 Y 3 a abbaaa 80.49 77 0. ababbaaa
6 aaabbaaa 61.420650 0.524900 Y 3 aaabbaaa
7 aaab .420650 0.501800 Y 3 aaabbaaa baaa 61
8 b 71 515100 N - a abbaaa 80.49 77 0. ababbaaa
.1.6 Mutation
The crossover may cause the occurrence of overcome this problem,
d out with mutation probability
are randomly selected and the genes corresponding to the mutation sites are interchanged. The same procedure is repeated for the rest of the selected
After Mutation
Table-9- Population after Crossover 5
an empty cell. Tomutation is carrieas 0.20.Random integers X and Y are generated for each solution string. The strings with random number within the mutation probability are chosen for mutation. Mutation operation is carried out within the solution string. Here, the shift mutation is used for each selected string, two mutation sites
solution strings. The new population after mutation is shown in table-10.
For example,
Take random numbers X=2, Y=5 then
Before mutation aabbbaab
After mutation abbbaaab
92

Journal of Theoretical and Applied Information Technology
© 2005 JATIT. All rights reserved.
www.jatit.org
le-10 - aft n 5.4 Termination of GA
h h method, is di orm convergen ia. A ess of n may rem static ber of s before a superior individual is found. The
application of conventional termination criteria roble tic. A common p to
terminate the GA after a prespecified number of ns and en test the quality st
he population against th tions o ned afte 00 ge re
le-11
GTE Efficiency
Tab Population er Mutatio
Because tit
e GA is a stocfficult to f
hastic searcally specify
ce criterain
s the fitnfor a num
a populatio generation
becomes p ma ractice is
generatiomembers of t
th of the bee problem.
The solushown in tab
btai.
r 1 nerations a
Machine cells Part family CPN STE
(135678,24) (136789,24510) 0.636 0.864 0.900 85.583977
(124568,37) (12345910,678) 0.437 0.864 0.900 83.595337
(13678,245) (136789,24510) 0.666 0.796 0.850 80.497177
Table-11- Results of Gen
6.Results And Discussions etic Al
The optimum solution for the problem
nder study has been obtained using Genetic
Alg r probability as
0.9 and mutation probability as 0.2. Table-12
shows the result of the objective function values
and the relevant part families / machine cells.
Result of genetic algorithm approach
gorithm Approach
u
orithm approach with crossove
S.NO. Popul
before
muta
Random
numbers
Mutate
Y OR N
Mu
Site
Population after
mutation
ation
tion
tation
1 ababb 128600 Y 4 abaabbaa aaa 0. 6
2 aabaaaaa 0.865400 N 0 0 aabaaaaa
3 0. a ababbaba 176600 Y 5 6 ab babba
4 aaabbaaa 0.3 Y 4 2 abaa15000 baaa
5 ab 0. 5 abababbaaa 680100 Y 6 abaa
6 aa 0 5 aabbabbaaa .384100 Y 3 aaaa
7 aa 0 4 aaaaabbaaa .443800 Y 6 bbaa
8 ab 0 2 abababbaaa .188900 Y 5 baaa
93

Journal of Theoretical and Applied Information Technology
© 2005 JATIT. All rights reserved.
www.jatit.org
Machine cell art fa CP STE s P mily N GTE Performance measure (β %)
(135678,24) 36789,24510) 0.6 0.864 0 85.583977 (1 36 0.90
(124568,37) 23459 0.437 0.864 0 (1 10,678) 0.90 83.595337
(13678,245) (136789,24510) 0.666 0.796 0.850 80.497177
(1234568,7) (1234567910,8) 0.436 0.966 0.900 88.671280
Ta obt gene gorithm appr
chine Cells Part families
Cell 1: m1, m3, m5, m6, m7, m8. Family 1: p1, p3, p6, p7, p8, p9.
ell 2: m2 Family 2: p2, p4, p5, p10
ompactne .6%
Setup time efficiency: 86.4%
roup tech ency:
osed method with
Hiroshi Ohta appr
sequen achine. T the set up = 0.5, λ= 5,θ= 0.25 and d =0.1,by using the algorithm given in section olution o in
.7449 (74.49%) and 0.855 (85.5%) respectively. Comparison of the proposed
ch e H Ohta ch is in t 3.
Comparison of Hiroshi Ohta Algorithm Vs Genetic algorithm
ble-12 Results ained through tic al oach
Ma
C , m4. .
C ss of cells: 63
G nology effici 90%
Performance measure (β): 85.58%
6.1 Comparison of prop
oach
Consider the data used by Harhalakis, Nagi and Proth (1990) in table-1 showing the initial machine part incidence matrix (zeros not printed). Numbers in table-1 shows the operation
table-11, the performance measure β of this solution is β=0.855(85.5%). The performance measures of the cell formations obtained by Harhalakis et al. (1990) and Nair and Narendran (1998) and Hiroshi Ohta and Nakamura (2002) and the proposed approach are β= 0.6966(69.66%), 0.7411 (74.11%), 0
ce of part on m times. Let a=b
able-2 shows0. 50, µ= 0.2
jil5.1, the best s btained is shown
approashown
with thable-1
iroshi et al. approa
Variable Hiroshi Ohta Algorithm PropGenetic Algorithm
osed
Machine cells
(1,3,6,7,8), (2
(1,3,5,6,7,8), (2,4)
(3,7,8), (1,2,4
(1,3,5,6,7,8), (2,4) (1,2,4,5,6,8), (3,7)
3,6,7,8), (2,4,5)
,4,5)
(1,2,4,5,6,8), (3,7) (1,(1,,5,6) 2,3,4,5,6,8), (7)
Part family
4,5,10)
(1,3,6,7,8,9), 4,5,10)
(1,2,3,4,5,7,9, ), (6,8)
(1,3,6,7,8,9), (2,4,5,10) (1,2,3,4,5,9,10), (6,7,8) (1,3,6,7,8,9), (2,4,5,10)
(1,3,6,7,8,9), (2,
(2,
10
(1,2,3,4,5,9,10), (6,7,8) (1,2,3,4,5,6,7,9,10), (8)
94

Journal of Theoretical and Applied Information Technology
© 2005 JATIT. All rights reserved.
www.jatit.org
CPN ---------
0
0.666 0.
.636 0.437
436
STE ------
0.864 0.0.0.
--- 864 796 966
GTE ----------
0.0.0.850 0.900
900 900
P
85.583977 83.595337 80.497177
erformance Measure 73.43 β(%)
71.03
74.50
Table- ta Algorithm with the Proposed Genetic Algorithm 7. CO
uring ment
s how d the parts. Most of the
existing methods of grouping are indifferent to the processi
nd Nair and Narendran (1998) and Hiroshi Ohta and Nakam oposare β= 0.69 ), 0.7411 (74.11(74.49%) and 0.855 (85.5%) respectivresults obtained through the Genetic Algoapproach in th e example wmuch s onsidering thproduction factors such as part volume, altroutings for parts and processing timeextend this current research work. Stuprogress in this direction using metaheuas Tabu Searc tworks. Reference
1. Akturk, M.S., and Turkcan, ACellular manufacturing systusing a holonistic approach. International
Journal of Production Research, 38(1) 2327-2347.
2. Askin, R.G., and Chiu K. S., 1990. A
J. L., 1979. Group Technology in Engineering Industry (London:
hanical engineering Publications).. rie, S., 1973. Numerical Taxonomy
applied to Group and Plant Layout Inte l of Production Re
Caux, C., Brun al, H: 2000. Cell f rnative process plans apacity constraints: A proach. International duction Economics, 64 (1-3) 279- 284. Chandrasekharan, M.P. and Rajagopalan, R., 1989. G is of the properti s for group techn rnal of Productio 1052. Chandrasekharan, M.P. and Rajagopalan, R., 1987. ZODIAC - An algorithm for
13 Comparison of Hiroshi OhNCLUSION
When solving a cellular manufactproblem by means of the machines assignmethod, the common problem encountered ito group the machines an
ng sequence. Considering the processing sequence, the set up time is an important factor. In this paper, a genetic algorithm approach for grouping machines and part families by considering the sequence data with reduction in set up time between machines in the same cell is presented.
The performance measures of the cell
graph partitioning procedure for machine assignment and cell formation in-group technology. International Journal of Production Research, 28(8) 1555-1572.
3. Askin, R.G., Cresswell, S. H,. Goldberg J. B. and Vakharia A. J., 1991. Hamiltonian path approach to reordering the part-machine matrix for cellular manufacturing. International Journal of Production Research, 29, 1081- 1100.
4. Burbidge,
formations obtained by Harhalakis et al. (1990) mec5. Cara
ura (2002) and the pr66(69.66%
ed approach %), 0.7449
ely. The 6.rithm ere very e illustrativ
atisfactory. C e other ernate
etc can dies are in 7. ristics such
h and Neural Nes
., 2000. em design 8.
Technologyrnational Journasearch. 11, 399-416. iaux, R., and Pierrev
ormation with alte and machine c new combined ap
Journal of Pro
ROUPABILITY: Analyses of binary data matriceology. International Joun Research, 27(6) 1035-
95
Journal of Theoretical and Applied Information Technology
© 2005 JATIT. All rights reserved.
www.jatit.org
concurrent formation of part families and machine cells. International JournaProd Research. 25(6) 835-850.
9. Chen, J. and Heragu, S.S., 1999. Stepwise decomposition approaches for large scale cell formation problems. EuropJourn Operational Research, 1164-79.
10. Cheng, C.H., Gupta, Y.P., Lee, W.H. and Wong 98. A TSP-based heuristic for f g machine groups and families. International Journal of Production Research. 36(5) 1325-1337.
11. Choobineh, F., 1988. A framework forthe design of cellular manufactur
nal Journal Prod Research, 26(7) 1161-1172.
12. Chu, C.H. and Tsai, M., 1990. comparison of three array-based clustering techniques for manufacturing
Research, 28(8) 1417-1433. 13. Co, H.C. and Araar, A., 1988.
aptation in
19. Hiorshi Ohta, Masate amura,. 2002. Cell formation with in set up times. Computers and Industrial Engineering, 42, 317
20. Joines, J.A., Culbre . and King, R.E., 1996. Manufa cell design: An integer pro ing model employing genetic algorithms. IIE Transations, 28, 69-8
21. José Fernando Gon nd Mauricio G.C. Resende., 200 evolutionary algorithm for m turing cell formation. Computers in Industrial Engineering, 47, 247-273.
22. Khan, r, B., 2000. A similarity coefficient measure and machine-parts g cellular manufacturing system . International Journal of Production Research, 38(3) 699-720.
Computers in Industrial
24.
f
25.
27.
28.
ch,
29.
l of uction
ean 3(1) al of
, K.F., 19ormin part
ing
systems. Internatiouction
of
A
cell formation. International Journal of 23. Khator, S.K. and Irani, S.KProduction
Configuring cellular manufacturing systems. International Journal of Production Research, 26(9) 1511-1522.
14. Dimopoulos, C., and Mort, N., 2001. A hierarchical clustering methodology based on genetic programming for the solution of simple cell-formation problems. International Journal of Production Research, 39(1) 1-19.
15. Goldberg, D.E., 1989. Genetic Algorithms in Search Optimization, and Machine Learning, Addison-Wesley, Reading, MA.
16. Gunasingh, K. R., and Lashkari, R. S., 1989a. Machine grouping problem in cellular manufacturing systems-an integer programming approach. International Journal of Production Research, 27(9), 1465-1473.
17. Gupta, T. and Seifoddini, H., 1990. Production data based similarity coefficient for machine-component grouping decisions in the design of a cellular manufacturing system. International Journal of Production Research, 28(7) 1247-1269.
land, J. H., 1975. Ad18. HolNatural and Artificial Systems. The University of Michigan Press, Ann Arbor, Michigan.
., 1987. Cell formation in-group technology: A new approach.
ru Nak reduction
-327 th, C.Tcturinggramm
5. çalves a4. An anufac
M., Islam, S. and Sarke
rouping ins
Engineering, 12(2) 131-142. King, J.R. (1980) Machine-component grouping in production flow analysis: An approach using a rank order-clustering algorithm. International Journal oProduction Research, 18(2) 213-232. King, J.R. and Nakornchai, V., 1982. Machine-component group formation in-group technology: Review and extension. International Journal of Production Research, 20(2) 117-133.
26. Kumar, K. R., and Vannelli, A., 1987. Strategic subcontracting for efficient disaggregated manufacturing. International Journal of Production Research, 25(12) 1715-1728. Kumar, K. R., Kusiak, A-, and Vannelli, A., 1986. Grouping of parts and components in flexible manufacturing systems. European Journal of Operations Research, 24, 387-397. Kusiak, A. 1987. The generalized group technology concept. International Journal of Production Resear 25(4) 561-569. Kusiak, A. and Chow, W., 1987. Efficient solving of the group technology problem. Journal of Manufacturing Systems, 6(2) 117-124.
30. Lee, H. and Garcia-Diaz, A., 1993. A network flow approach to solve clustering
96

Journal of Theoretical and Applied Information Technology
© 2005 JATIT. All rights reserved.
www.jatit.org
problems in-group technology. International Journal of Production Research, 31(3) 603-612.
31. McAuley, J., 1972. Machine grouping for efficient production. Production Engineer, 51(2) 53-57. Mosier, C.T. and Taube, L., 1985a. The facets
32. of group technology and their
33.
e
34. Jl
35. .
36. p
37.
in-144.
nduction Economics, 64 (1-
39.
41. n in-group
42. , 1989. Modeling group technology cell formation as a
h43. an, T.T., 1991.
44. ndran, T. and
45. r K., 2002.
46. r finding minimal bottleneck
47. J. and Chen,
48. to
49. A dissimilarity
50. A genetic
impact on implementation, OMEGA, 13(6) 381-391. Mosier, C.T. and Taube, L., 1985b. Weighted similarity measure heuristics for the group technology machinclustering problem. OMEGA, 13(6) 577-583 Nair G. & Narendran, T.T,. 1988. CASE: A Clustering algorithm for celformation with sequence data, International Journal of Production Research, 36(1), 157-179. Ng, S., 1993. Worst-case analysis of an algorithm for cellular manufacturingEuropean Journal of Operational Research, 69(3) 384-398. Ng, S., 1996. On the characterization and measure of machine cells in groutechnology. Operations Research, 44(5) 735-744. Onwubolu, G.C., Mutingi, M., 2001. A genetic algorithm approach to cellular manufactur g systems. Computers and Industrial Engineering, 39(1-2) 125
38. Plaquin, M., Pierreval, H., 2000. Cell formation using evolutionary algorithms with certain constrai ts. International Journal Of Pro3) 267-278. Rajagopalan, R. and Batra, J.L., 1975. Design of cellular production systems: a graph-theoretic approach. International Journal of Production Research, 13(6) 567-579.
40. Seifoddini, H., 1989. Single linkage versus average linkage clustering in machine cells formation applications. Computers and Industrial Engineering, 16(3) 419-426. Selim, H.M., Askin, R.G. and Vakharia, A.J., 1998. Cell formatiotechnology: Evaluation and directions for future research. Computers and Industrial Engineeraing, 34(1) 3-20. Shtub, A.
generalized assignment problem. International Journal of Production Researc , 27(5) 775-782. Srinivasan, G. and NarendrGRAFICS - A nonhierarchical clustering algorithm for group technology. International Journal of Production Research, 29(3) 463-478. Srinivasan, G., NareMahadevan, B., 1990. An assignment model for the part-families problem in-group technology. International Journal of Production Research, 28(l) 145-152. Uddin, M. K., ShankeGrouping of parts and machines in presence of alternative process routes by genetic algorithm, International Journal of Production Economics, 76(3) 219-228 Vannelli, A., and Kumar, K. R., 1986. A method focells for grouping part-machine families. International Journal of Production Research, 24(2) 387-400. Vohra, T., Chen, D., Chang, H., 1990. A network approach to cell formation in cellular manufacturing. International Journal of Production Research, 28(11) 2075-2084. Won, Y., 2000. Two-phase approachGT cell formation using efficient p-median formulations. International Journal of Production Research, 38(7) 1601- 1613. Yasuda, K., Yin, Y., 2001.measure for solving the cell formation problem in cellular manufacturing. Computers and Industrial Engineering, 39 (1-2) 1-17. Zhao, C., and Wu, Z., 2000.algorithm for manufacturing cell formation with multiple routes and multiple objectives. International Journal of Production Research, 38(2) 385-395.
97