management’s discussion and analysis and consolidated
TRANSCRIPT
Management’s Discussion and Analysisand
Consolidated Financial StatementsJune 30, 2020
June 30, 2020
ContentsPage
I Executive Summary 4II Client Services 9III Liquid Assets 21IV Funding Resources 22V Risk Management 25VI Critical Accounting Policies 34VII Results of Operations 36VIII Governance and Control 49
INTERNATIONAL FINANCE CORPORATION Page 2
Management’s Discussion and Analysis

June 30, 2020
LIST OF TABLESPage
Table 1: Reconciliation of reported Net Income or Loss to Income Available for Designations 6Table 2: Selected Financial data as of and for the last Five Fiscal Years 7Table 3: Key Financial Ratios 8Table 4: FY20 vs FY19 Long-Term Finance Commitments (Own Account and Core Mobilization) 12Table 5: Disbursed Investment Portfolio Distribution by Industry Sector 13Table 6: Currency position of the Disbursed Loan Portfolio 15Table 7: Funds Managed by AMC and their Activities FY20 vs FY19 18Table 8: IFC Advisory Services - Program Expenditures by Region for FY20 vs FY19 20Table 9: IFC Advisory Services - Program Expenditures by Business Area for FY20 vs FY19 21Table 10: IFC's Capital 23Table 11: IFC's Retained Earnings 23Table 12: IFC Loan Portfolio Credit Risk Indicators 29Table 13: Main Elements of Net Income and Comprehensive Income 36Table 14: Change in Net Income FY20 vs FY19 38Table 15: Net Unrealized Gains and Losses on Non-Trading Financial Instruments FY20 vs FY19 41Table 16: Other Comprehensive Income (Loss) - Unrealized Gains and Losses on Debt Securities and Borrowings
FY20 vs FY19 42Table 17: Change in Net Income FY19 vs FY18 43Table 18: FY19 Change in Income from Loans and Guarantees, including Realized Gains and Losses on Loans and
Associated Derivatives 44Table 19: Net Unrealized Gains and Losses on Non-Trading Financial Instruments FY19 vs FY18 46Table 20: Other Comprehensive Income (Loss) - Unrealized Gains and Losses on Equity Investments, Debt Securities
and Borrowings FY19 vs FY18 47
LIST OF FIGURES
Figure 1: Disbursed Investment Portfolio Distribution by Region 13
Figure 2: Carrying Amount of Loan Portfolio 14
Figure 3: Carrying Amount of Equity Investments Portfolio 15
Figure 4: Carrying Amount of Debt Securities Portfolio 16
Figure 5: IFC's Funding Resources 22
Figure 6: IFC's Enterprise Risk Management Framework 26
Figure 7: NPLs as Percentage of Disbursed Loan Portfolio 29
Figure 8: ESRR Distribution FY13-FY20 34
Figure 9: IFC's Net Income (Loss), Fiscal Years 2016-2020 37
Figure 10: Non-Performing Loans 39
Figure 11: Loan Loss Reserve 39
INTERNATIONAL FINANCE CORPORATION Page 3
Management’s Discussion and Analysis

l. EXECUTIVE SUMMARY
This Management’s Discussion and Analysis (MD&A) discusses the financial results of the International Finance Corporation (IFC or theCorporation) for the fiscal year ended June 30, 2020 (FY20). This executive summary highlights selected information and may not containall of the information that is important to readers of this document. For a complete description of FY20’s performance, as well as the risksand critical accounting estimates affecting IFC, this MD&A should be read in its entirety.
OVERVIEW
IFC is the largest global development institution focused on the private sector in developing countries. Established in 1956, IFC is ownedby 185 member countries, a group that collectively determines its policies. IFC is a member of the World Bank Group (WBG)1 but is a legalentity separate and distinct from IBRD, IDA, MIGA, and ICSID, with its own Articles of Agreement, share capital, financial structure,management, and staff. Membership in IFC is open only to member countries of IBRD.
In FY20, IFC continued to focus and grow in the poorest countries and fragile areas, in line with the capital increase that shareholdersendorsed in April 2018. The financing package comprised: (i) a three-step capital raising process: Conversion of a portion of retainedearnings into paid-in capital, a Selective Capital Increase (SCI) and a General Capital Increase (GCI) that would provide up to $5.5 billionin additional paid-in capital; (ii) a planned suspension of grants to IDA after the conclusion of the IDA 18 replenishment cycle; and (iii)internal measures for increased efficiency was endorsed by the Board of Governors.
The GCI and SCI Resolutions were adopted and became effective on April 16, 2020 and the subscription process was formally launchedon April 22, 2020. Accordingly, the increase in authorized capital and the conversion of a portion of retained earnings to paid-in capitalwere recorded in the three months ended June 30, 2020 (FY20 Q4).
In FY20, IFC made $11.1 billion in long-term investments from its own account and mobilized $10.9 billion from other investors, totaling$22.0 billion in long-term investments. These investments supported 282 long-term finance projects in developing countries. In addition,IFC extended $6.5 billion in short-term trade finance. In total, IFC had a combined delivery of long-term and short-term commitments of$28.5 billion in FY20.
COVID-19 SUPPORT PACKAGE
In March 2020, in response to the global outbreak of the coronavirus disease (COVID-19), IFC’s Board of Directors approved a COVID-19support package in the amount of $8 billion, as part of a WBG package.
The IFC response has four components:
• $2 billion from the Real Sector Crisis Response Facility, which will support existing clients in the infrastructure, manufacturing,agriculture and services industries. IFC will offer loans to companies in need, and if necessary, make equity investments. Thisinstrument will also help companies in the healthcare sector that are seeing an increase in demand.
• $2 billion from the existing Global Trade Finance Program, which will allow financial institutions to provide trade financing tocompanies that import and export goods.
• $2 billion from the Working Capital Solutions program, which will provide funding to emerging-market banks to extend creditto help businesses shore up their working capital and thereby maintain viable private sector firms.
• $2 billion from the Global Trade Liquidity Program, and the Critical Commodities Finance Program, both of which offer risk-sharing support to local banks so they can continue to finance viable companies in emerging markets.
IFC's long-term investments from its own account in FY20 included $1.5 billion of COVID response. Short-term trade finance included$2.0 billion of COVID response.
COVID-19 IMPACT ASSESSMENT
In light of COVID-19, IFC faces additional credit, market and operational risks for its financial activities. The extent of the impact on IFC’sinvestment (debt and equity investments) and treasury (liquid assets and borrowings) portfolios is uncertain and continues to evolve. IFCcontinues to monitor developments and manage the risks associated with these portfolios. IFC’s response is within its existing financial,operational, and risk management policies as well as prescribed limits, which have not been modified as a result of the planned responseto the outbreak.
The outbreak of COVID-19, has resulted in governments worldwide enacting emergency measures to combat the spread of the virus.These measures, which include the implementation of travel bans, self-imposed quarantine periods and social distancing, have causedmaterial disruption to businesses globally resulting in an economic slowdown. Governments and central banks have reacted with significantmonetary and fiscal interventions designed to stabilize economic conditions.
INTERNATIONAL FINANCE CORPORATION Page 4
Management’s Discussion and Analysis
1 The other institutions of the WBG are the International Bank for Reconstruction and Development (IBRD), the International Development Association (IDA), the MultilateralInvestment Guarantee Agency (MIGA), and the International Centre for Settlement of Investment Disputes (ICSID).

TREASURY PORTFOLIOS
As of June 30, 2020, IFC had sufficient resources to meet its liquidity requirements and continues to have access to capital market resourcesto fund its liquidity requirements, despite market volatility. IFC continues to maintain a robust liquidity position and flexibility to access thenecessary liquidity resources, mainly as a result of its prudent approach to liquidity management. IFC experienced widening of creditspreads in its liquid asset and funding portfolios during the three months ended March 31, 2020 (FY20 Q3) which largely reversed in FY20Q4. Management remains vigilant in assessing funding in the medium and longer-term to manage the effect of possible severe marketmovements.
INVESTMENT PORTFOLIOS
COVID-19 has had a significant negative impact on the valuation of IFC’s equity investment portfolio at June 30, 2020. Recognizing thereis a heightened degree of uncertainty and judgment in incorporating the impact of COVID-19, IFC has utilized, where available, comparator,sector and country information, in addition to discounted cash flow models, in valuing its equity investment portfolio at June 30, 2020.Valuations of equity investments at June 30, 2020 were significantly lower than as of June 30, 2019. Debt securities and loans accountedfor at fair value that do not have available market prices were primarily valued using discounted cash flow approaches and reflected spreadsat June 30, 2020. IFC generally saw a widening of such spreads at June 30, 2020 when compared to June 30, 2019 resulting in anincrease in unrealized losses on loans and debt securities in the year ended June 30, 2020 (FY20).
IFC recognizes impairment on loans not carried at fair value through a reserve against losses. The reserve against losses on loans reflectsmanagement’s estimates of both identified probable losses and probable losses inherent in the portfolio but not specifically identifiable.Reserves against losses on loans as of June 30, 2020 reflects credit risk assessments as of that date. The assessment of level of reservesagainst losses also carried a heightened degree of uncertainty and judgment in incorporating the impact of COVID-19. In evaluating theappropriateness of IFC’s reserves against losses at June 30, 2020, IFC has considered the impact of COVID-19 largely through its ratingsystem that classifies its loans according to credit worthiness and risk. In light of COVID-19, many of the credit risk ratings of individualloans deteriorated at June 30, 2020 reflecting general credit considerations and specific COVID-19 related considerations. As a result,IFC has reported higher provisions for losses in the year ended June 30, 2020.
Valuations of equity investments, debt securities and certain loans reported at fair value and reserves against losses reflect management’sbest estimates as of June 30, 2020.
During FY20 Q4, IFC implemented a loan modification program in response to requests received from borrowers for short-term modificationssuch as payment deferrals under existing loans that are related to COVID-19 including establishing appropriate governance over theapproval process for such requests. As of June 30, 2020, 9 suspension agreements had been signed, deferring $10 million of principalpayments.
OPERATIONAL CONSIDERATIONS
Home-based work has been invoked for all IFC offices throughout the world, with certain exceptions, in line with IFC’s business continuityprocedures. In addition, IFC has adopted other prudent measures to ensure the health and safety of its employees, including imposingtravel restrictions, rescheduling public events or holding them in virtual format. IFC’s operations remain functional, even with these significantchanges in working arrangements.
FORWARD-LOOKING CONSIDERATIONS
While the duration of the COVID-19 pandemic and its effects are difficult to predict at this time, IFC has seamlessly transitioned to home-based work with its operations fully functional.
Looking ahead, Management has finalized a reopening plan that prioritizes staff health and safety while taking into consideration risksincluding business continuity. The reopening plan provides for the incremental return to office and the resumption of non-remote businessin stages or "tiers," allowing for enough time in between tiers to fully assess risk and preparedness indicators. IFC continues to monitorrisks associated with COVID-19 and prepare plans to respond in case the situation deteriorates.
The length and severity of the pandemic and its impact on the financial results and condition of IFC in future periods cannot be reasonablyestimated at the current time.
IFC has incorporated its best estimates and judgment in reporting assets and liabilities on its June 30, 2020 consolidated balance sheetwhich may vary significantly when it prepares future consolidated balance sheets using conditions in existence at that future time.
FINANCIAL PERFORMANCE SUMMARY
From year to year, IFC's net income is affected by a number of factors that can result in volatile financial performance. The overall marketenvironment also has a significant influence on IFC’s financial performance. Emerging equity markets were volatile during FY20. In thesix months ended December 31, 2019, emerging markets were generally positive but deteriorated substantially in FY20 Q3 largely dueto COVID-19 before partially recovering in FY20 Q4. IFC's major investment currencies depreciated against IFC's reporting currency, theUS dollar in FY20.
INTERNATIONAL FINANCE CORPORATION Page 5
Management’s Discussion and Analysis

IFC reported a net loss of $1,672 million in FY20, as compared to net income of $93 million in the fiscal year ended June 30, 2019 (FY19)(net income of $1,280 million for the year ended June 30, 2018, FY18). IFC's financial results were significantly volatile throughout FY20.IFC reported a net loss of $168 million in the three months ended September 30, 2019 (FY20 Q1) and net income of $447 million in thethree months ended December 31, 2019 (FY20 Q2) before reporting a net loss of $2,554 million in FY20 Q3. Financial results reboundedin FY20 Q4 when IFC reported net income of $603 million.
The overall net loss in FY20 was primarily due to lower valuations on equity investments, principally in FY20 Q3, and higher provisionsfor losses.
IFC's equity investment portfolio returned negative $1,067 million in FY20 (comprising dividends and realized gains on sales of $536 millionand unrealized losses of $1,603 million).
IFC recorded provisions for losses of $638 million in FY20, substantially higher than FY19 ($87 million). Debt security impairments totaled$130 million in FY20 largely due to project-specific developments; debt security impairments totaled $247 million in FY19, largely due tothe significant depreciation of a currency that was deemed other than temporary in FY19 Q1.
Unrealized losses from loans and debt securities were $423 million in FY20, as compared to $203 million in FY19, mainly due to increasedcredit risk spreads and lower interest rates on swaps used to economically hedge loans and debt securities.
IFC's liquid asset income, net of allocated charges on borrowings, was $506 million in FY20, compared to $454 million in FY19. FY20results were largely due to the yield curve of U.S. Treasuries falling substantially in FY20 resulting in significant gains in income from thenet worth funded portfolios.
IFC's administrative expenses were $1,281 million in FY20, $74 million lower than in FY19. Administrative expenses were lower principallydue to lower staff costs and a decline in operational and other travel costs following COVID-19 related restrictions.
IFC’s financial performance is detailed more fully in Section VII – Results of Operations.
BASIS OF PREPARATION OF IFC’S CONSOLIDATED FINANCIAL STATEMENTS
The accounting and reporting policies of IFC conform to accounting principles generally accepted in the United States (GAAP). IFC’saccounting policies are discussed in more detail in Section VI, Critical Accounting Policies, and in Note A to IFC’s consolidated financialstatements as of year ended June 30, 2020 (FY20 consolidated financial statements).
Prior to the year ended June 30, 2020 (FY20), management used Income Available for Designations (a non-GAAP measure) as a basisfor designations of retained earnings. Income Available for Designations generally comprised net income excluding: net unrealized gainsand losses on equity investments and net unrealized gains and losses on non-trading financial instruments accounted for at fair value,income from consolidated entities other than the AMC2, and expenses reported in net income related to prior year designations.
IFC reviewed the calculation of Income Available for Designations in FY20 due to the adoption of ASU 2016-01, Recognition andMeasurement of Financial Assets and Liabilities (ASU 2016-01) in FY19 which resulted in all unrealized gains and losses on equityinvestments being reported in Net Income. Beginning in FY20, IFC uses "income excluding unrealized gains and losses on investmentsand borrowings and grants to IDA" as the metric for Income Available for Designations.
Table 1: Reconciliation of reported Net Income or Loss to Income Available for Designations (US$ millions)
FY20 FY19 FY18Net (loss) income $ (1,672) $ 93 $ 1,280Adjustments to reconcile Net (Loss) Income to Income Available for Designations
Unrealized losses (gains) on investments 2,026 1,121 (198)Unrealized losses on borrowings 218 15 93Grants to IDA — — 80Advisory Services Expenses from prior year designations — 54 60Adjustments to conform to approach to designations approved by IFC's Board in FY17 — (377) —Other — 3 3
Income Available for Designations $ 572 $ 909 $ 1,318
The Management’s Discussion and Analysis contains forward looking statements which may be identified by such terms as “anticipates,”“believes,” “expects,” “intends,” “plans” or words of similar meaning. Such statements involve a number of assumptions and estimates thatare based on current expectations, which are subject to risks and uncertainties beyond IFC’s control. Consequently, actual future resultscould differ materially from those currently anticipated. IFC undertakes no obligation to update any forward-looking statements.
INTERNATIONAL FINANCE CORPORATION Page 6
Management’s Discussion and Analysis
2 Effective January 31, 2020, IFC Asset Management Company, LLC (AMC) was merged into IFC. IFC, as the successor to AMC, has assumed all the assets, rights, liabilitiesand obligations of AMC. The AMC business is now operated as a division within IFC. This change did not have a significant impact on IFC's financial position, results ofoperations or cash flows.

Table 2: Selected Financial data as of and for the last Five Fiscal Years (US$ millions)
AS OF AND FOR THE YEARS ENDED JUNE 30 2020 2019 2018 2017 2016
Consolidated income highlights:Income from loans and guarantees, including realized gains and
losses on loans and associated derivatives $ 1,510 $ 1,774 $ 1,377 $ 1,298 $ 1,126Provision for losses on loans, guarantees, accrued interest and
other receivables (638) (87) (90) (86) (359)(Loss) income from equity investments and associated derivatives (1,067) (253) 853 707 518Income from debt securities, including realized gains and losses on
debt securities and associated derivatives 231 126 363 282 129Income from liquid asset trading activities 1,039 1,291 771 917 504Charges on borrowings (1,181) (1,575) (1,041) (712) (409)Other income 559 622 578 528 501Other expenses (1,628) (1,746) (1,662) (1,617) (1,464)Foreign currency transaction gains (losses) on non-trading activities 144 159 123 (188) (46)(Loss) income before net unrealized gains and losses on non-
trading financial instruments accounted for at fair value andgrants to IDA (1,031) 311 1,272 1,129 500
Net unrealized (losses) gains on non-trading financial instrumentsaccounted for at fair value (641) (218) 88 394 (204)
(Loss) income before grants to IDA (1,672) 93 1,360 1,523 296
Grants to IDA — — (80) (101) (330)
Net (loss) income (1,672) 93 1,280 1,422 (34)
Less: Net (gains) losses attributable to non-controlling interests — — — (4) 1
Net (loss) income attributable to IFC $ (1,672) $ 93 $ 1,280 $ 1,418 $ (33)
AS OF AND FOR THE YEARS ENDED JUNE 30 2020 2019 2018 2017 2016
Consolidated balance sheet highlights:Total assets $ 95,800 $ 99,257 $ 94,272 $ 92,254 $ 90,434Liquid assets3 40,791 39,713 38,936 39,192 41,373Investments 41,138 43,462 42,264 40,519 37,356Borrowings outstanding, including fair value adjustments 55,486 54,132 53,095 54,103 55,142
Total capital $ 25,182 $ 27,606 $ 26,136 $ 25,053 $ 22,766of which
Undesignated retained earnings $ 7,166 $ 25,905 $ 23,116 $ 21,901 $ 20,475Designated retained earnings 433 366 190 125 133Paid-in Capital 19,567 2,567 2,566 2,566 2,566Accumulated other comprehensive (loss) income (AOCI) (1,984) (1,232) 264 458 (431)Non-controlling interests — — — 3 23
INTERNATIONAL FINANCE CORPORATION Page 7
Management’s Discussion and Analysis
3 Net of securities sold under repurchase agreements, payable for cash collateral received and associated derivatives.

Table 3: Key Financial Ratios
2020 2019 2018 2017 2016Financial ratiosa:Return on average assets (GAAP basis)*b (1.7)% 0.1% 1.4% 1.6% 0.0%Return on average assets (non-GAAP basis)c 0.6% 1.4% 1.4% 1.3% 0.5%Return on average capital (GAAP basis)*d (6.3)% 0.3% 5.0% 5.9% (0.1)%Return on average capital (non-GAAP basis)e 2.1% 4.9% 5.1% 4.9% 1.8%Overall liquidity ratiof 96% 104% 100% 82% 85%Debt to equity ratiog 2.2:1 2.2:1 2.5:1 2.7:1 2.8:1Total reserves against losses on loans to total disbursed portfolioh 6.3% 4.7% 5.1% 6.1% 7.4%Capital measures:
Total Resources Required (US$ billions)i 20.3 21.8 20.1 19.4 19.2Total Resources Available (US$ billions)j 28.2 27.8 24.7 23.6 22.5Strategic Capitalk 7.9 6.0 4.6 4.2 3.3Deployable Strategic Capitall 5.0 3.2 2.2 1.8 1.0Deployable Strategic Capital as a percentage of Total
Resources Available 17.9% 11.6% 8.7% 7.8% 4.4%
* This ratio is not directly comparable due to the adoption of ASU 2016-01.
a. Certain financial ratios, as described below, are calculated excluding the effects of unrealized gains and losses on investments, othernon‑trading financial instruments, Accumulated Other Comprehensive Income (AOCI), and impacts from consolidated Variable InterestEntities (VIEs).
b. Net income for the fiscal year as a percentage of the average of total assets at the end of such fiscal year and the previous fiscal year.c. Return on average assets is defined as Net income, excluding unrealized gains/losses on investments accounted for at fair value,
income from consolidated VIEs and net gains/losses on non-trading financial investments, as a percentage of total disbursed loan andequity investments (net of reserves), liquid assets net of repos, and other assets averaged for the current and previous fiscal year.
d. Net income for the fiscal year as a percentage of the average of total capital (excluding payments on account of pending subscriptions)at the end of such fiscal year and the previous fiscal year.
e. Return on average capital is defined as Net income, excluding unrealized gains/losses on investments accounted for at fair value,income from consolidated VIEs and net gains/losses on non-trading financial investments, as percentage of the paid-in share capitaland accumulated earnings (before certain unrealized gains/losses and excluding cumulative designations not yet expensed) averagedfor the current and previous fiscal year.
f. Overall Liquidity Policy states that IFC would at all times maintain a minimum level of liquidity, plus undrawn borrowing commitmentsfrom the IBRD, that would cover at least 45% of the next three years’ estimated net cash requirements.
g. Leverage (Debt/equity) ratio is defined as the number of times outstanding borrowings plus committed guarantees cover paid-in capitaland accumulated earnings (net of retained earnings designations and certain unrealized gains/losses).
h. Total reserves against losses on loans to total disbursed loan portfolio is defined as reserve against losses on loans as a percentageof the total disbursed.
i. Total resources required (TRR) is the minimum capital required to cover the expected and unexpected loss on IFC’s portfolio, calibratedto maintain IFC’s triple-A rating. TRR is the sum of the economic capital requirements for IFC’s different assets, and it is determinedby the absolute size of the committed portfolio, the product mix (equity, loans, short-term finance, and Treasury portfolio assets), andby operational and other risks.
j. Total resources available (TRA) is the total capital of the Corporation, consisting of (i) paid-in capital; (ii) retained earnings net ofdesignations and some unrealized gains and losses; and (iii) total loan loss reserves. TRA grows based on retained earnings (profitminus distributions) and increases in reserves.
k. Total resources available less total resources required.l. 90% of total resources available less total resources required.
INTERNATIONAL FINANCE CORPORATION Page 8
Management’s Discussion and Analysis

II. CLIENT SERVICES
FINANCIAL BUSINESS MODEL
IFC helps developing countries achieve sustainable growth by financing private sector investment, mobilizing capital in international financialmarkets, and providing advisory services to businesses and governments. IFC’s principal investment products are loans, equity investments,debt securities and guarantees. IFC also plays an active and direct role in mobilizing additional funding from other investors and lendersthrough a variety of means. Such means principally comprise: loan participations, parallel loans, the Managed Co-lending Portfolio Program(MCPP), the non-IFC portion of structured finance transactions, and the non-IFC portion of commitments in funds managed by AMC,(collectively Core Mobilization). Unlike most other development institutions, IFC does not accept host government guarantees of itsexposures. IFC raises virtually all of the funds for its lending activities through the issuance of debt obligations in the international capitalmarkets, while maintaining a small borrowing window with IBRD. Equity investments are funded from capital (or net worth).
IFC’s capital base and its assets and liabilities, other than its equity investments, are primarily denominated in U.S. dollars ($ or US$) orswapped into U.S. dollars along with borrowings denominated in currencies other than U.S. dollars which are invested in such currencies.Overall, IFC seeks to minimize foreign exchange and interest rate risks arising from its loans, debt securities and liquid assets by closelymatching the currency and rate bases of its assets in various currencies with liabilities having the same characteristics. IFC generallymanages non-equity investment related and certain lending related residual currency and interest rate risks by utilizing currency andinterest rate swaps and other derivative instruments.
BUSINESS OVERVIEW
For all new investments, IFC articulates the expected impact on sustainable development, and, as the projects mature, IFC assesses thequality of the development benefits realized.
IFC’s strategic focus areas are aligned to advance the WBG’s global priorities.
INVESTMENT SERVICES
IFC’s investments are normally made in its developing member countries. The Articles of Agreement mandate that IFC shall invest inproductive private enterprises. The requirement for private ownership does not disqualify enterprises that are partly owned by the publicsector if such enterprises are organized under local commercial and corporate law, operate free of host government control in a marketcontext and according to profitability criteria, and/or are in the process of being completely or partially privatized.
IFC’s investment products and services are designed to meet the needs of clients in different industries, with a special focus on infrastructure,manufacturing, agribusiness services, and financial markets. Investment services product lines include: loans, equity investments, debtsecurities, trade and supply-chain finance, local currency finance, partial credit guarantees, portfolio risk-sharing facilities, securitizations,blended finance, venture capital, the IDA Private Sector Window (IDA-PSW), client risk management and various mobilization productssuch as loan participations, parallel loans and the Managed Co-lending Portfolio Program.
IFC’s investment project cycle can be divided into the following stages:
▪ Business Development▪ Concept Review▪ Appraisal (Due Diligence)▪ Investment Review▪ Negotiations▪ Public Disclosure▪ Board of Directors Review and Approval▪ Commitment▪ Disbursement of funds▪ Project Supervision and Development Outcome Tracking▪ Evaluation▪ Closing
IFC supervises its projects to monitor project performance and compliance with contractual obligations and with IFC’s internal policies andprocedures.
INTERNATIONAL FINANCE CORPORATION Page 9
Management’s Discussion and Analysis

INVESTMENT PRODUCTS
Loans – IFC finances projects and companies through loans, typically for seven to twelve years. IFC also makes loans to intermediarybanks, leasing companies, and other financial institutions for on-lending. IFC provides long-term local-currency solutions and helpscompanies access local capital markets through loans from IFC denominated in local currency, derivatives which allow clients to hedgeexisting or new foreign currency denominated liabilities back in to the client’s local currency, and structured finance which enable clientsto borrow in local currency from other sources. While IFC’s loans have traditionally been denominated in the currencies of major industrialnations, IFC has made it a priority to structure local currency products based on client demand and on IFC’s ability to fund in local-currencyand/or economically hedge loans in these currencies through the use of derivatives, principally currency and interest rate swaps andfinancial futures.
Loans generally have the following characteristics:
▪ Term - typically amortizing with final maturities generally for seven to twelve years, although some loans have been made fortenors as long as 20 years
▪ Currency - primarily in major convertible currencies, principally US dollar, and to a lesser extent, Euro, but with a growing local-currency loan portfolio
▪ Interest rate - typically variable (or fixed and swapped into variable)
▪ Pricing - reflects such factors as market conditions and country and project risks
Equity Investments - Equity investments provide developmental support and long-term growth capital that private enterprises need. IFCinvests directly in companies’ equity, and also through private-equity funds. IFC generally invests between 5 and 20 percent of a company’sequity. IFC’s equity investments are typically in the form of common or preferred stock which is not mandatorily redeemable by the issueror puttable to the issuer by IFC. Equity investments are usually denominated in the currency of the country in which the investment ismade. IFC also uses put and call options, profit participation features, conversion features, warrants and other types of instruments inmanaging its equity investments.
Debt Securities - Investments typically in the form of bonds and notes issued in bearer or registered form, securitized debt obligations(e.g. asset-backed securities (ABS), mortgage-backed securities (MBS), and other collateralized debt obligations) and preferred sharesthat are mandatorily redeemable by the issuer or puttable to the issuer by IFC.
Trade and Supply Chain Finance - IFC’s Global Trade Finance Program (GTFP) guarantees trade-related payment obligations of approvedfinancial institutions. Separately, the Global Trade Liquidity Program (GTLP) and Critical Commodities Finance Program (CCFP) providesliquidity, through risk sharing, for trade in developing countries. IFC has also commenced a number of other Trade and Supply ChainFinance-related programs, including Global Trade Supplier Finance (GTSF), Global Warehouse Finance Program, Working Capital andSystemic Solutions and Global Trade Structured Trade.
Local Currency Finance - Lending to the private sector in developing countries has traditionally been in the form of loans denominatedin foreign currency such as the US dollar or the Euro. But the volatility in currency markets represents a major risk for companies withrevenues in local currency. IFC provides long-term local currency solutions and helps companies access local capital markets.
Guarantees and Partial Credit Guarantees - IFC’s guarantee is available for debt instruments and trade obligations of clients and coverscommercial as well as noncommercial risks. IFC will provide local currency guarantees, but when a guarantee is called, the client willgenerally be obligated to reimburse IFC in US dollar terms. A partial credit guarantee represents a promise of full and timely debt servicepayment up to a predetermined amount. Typically, the sum that IFC pays out under the guarantee covers creditors irrespective of thecause of default. The guarantee amount may vary over the life of the transaction based on the borrower’s expected cash flows andcreditors’ concerns regarding the stability of cash flows. The guarantee is structured to reduce the probability of default of the debtinstrument and increase the recovery if default occurs.
Portfolio Risk Sharing Facilities - A risk sharing facility allows a client to sell a portion of the risk associated with a pool of assets. Theassets typically remain on the client’s balance sheet and the risk transfer comes from a partial guarantee provided by IFC.
Securitizations - IFC invests in domestics or cross-border securitizations and provides credit enhancement to transactions through fundedor unfunded participations, mainly at the mezzanine level.
Blended Finance - In addition to providing commercial financing for IFC’s own account, IFC uses a number of complementary tools tocrowd in private sector financing that would otherwise not be available to projects with high development impact. IFC blends concessionalfunds, typically from development partners, alongside IFC’s own commercial funding.
COVID-19 Response Facilities - The Real Sector Crisis Response Facility, which will support existing clients in the infrastructure,manufacturing, agriculture and services industries. IFC will offer loans to companies in need, and if necessary, make equity investments.This instrument will also help companies in the healthcare sector that are seeing an increase in demand. The existing Global TradeFinance Program, which will allow financial institutions to provide trade financing to companies that import and export goods. The WorkingCapital Solutions program, which will provide funding to emerging-market banks to extend credit to help businesses shore up their
INTERNATIONAL FINANCE CORPORATION Page 10
Management’s Discussion and Analysis

working capital and thereby maintain viable private sector firms. The Global Trade Liquidity Program, and the Critical CommoditiesFinance Program, both of which offer risk-sharing support to local banks so they can continue to finance viable companies in emergingmarkets.
IDA-PSW - The IDA-PSW is a new development finance tool to crowd-in more private sector investment where it is most needed. The$2.5 billion IDA-PSW was created under the IDA18 Replenishment for IFC and MIGA to rebalance the risk-reward profile for private sectorprojects in the poorest countries eligible to borrow from IDA and fragile and conflict-affected situations. The IDA-PSW is implementedthrough four facilities:
• A Risk Mitigation Facility: Involves both MIGA and IFC, this facility is designed to provide project-based guarantees to encourage/mobilize private sector investment in infrastructure projects and public-private partnerships.
• A Local Currency Facility: Administered by IFC, this facility is designed to provide local currency denominated loans, investmentsor hedges to private sector clients who operate in markets where there are limited currency hedging capabilities. In the absenceof currency hedging instruments and creditworthy counterparties, IDA would enter into swaps or indemnity agreement with IFC.
• A Blended Finance Facility: Administered by IFC, this facility blends PSW financing support with IFC investments to supportsmall and medium enterprises (SMEs), agribusiness and other pioneering investments.
• A MIGA Guarantee Facility: Administered by MIGA, this facility is designed to expand the coverage of MIGA Political RiskInsurance (PRI) products through shared first-loss or risk participation similar to reinsurance.
Client Risk Management Services - IFC extends long-maturity risk management products to clients in developing countries. IFC providesderivative products to its clients to allow them to hedge their interest rate, currency, or commodity-price exposures. IFC intermediatesbetween clients in developing countries and derivatives market makers to provide such clients with access to risk‑management productsto bridge the credit gap between its clients and the market.
Mobilization Products - IFC promotes development by mobilizing financing for the private sector in its developing member countries.
Loan Participations (B Loans): Through its B Loan Program, IFC offers participants the opportunity to lend to IFC-financed projects. Theseloans are a key part of IFC’s efforts to mobilize additional private sector financing in developing countries, thereby broadening theCorporation’s developmental impact. When an IFC loan includes financing from the market through the B Loan Program, IFC retains aportion of the loan for its own account (the A Loan), and sells participations in the remaining portion to participants (the B Loan). Theborrower signs a single Loan Agreement with IFC, and IFC signs a Participation Agreement with the participant or participants. IFC is thesole contractual lender for the borrower. While IFC is the lender of record, the participants’ involvement is known to the borrower. Thestructure allows participants to fully benefit from IFC’s status as a multilateral development institution.
A Loan Participations: An A Loan Participation (ALP) is an exposure management tool which IFC uses to reduce its risk exposures to aclient, country or sector. An ALP is created through the partial sale of an A Loan to commercial banks or other financial institutions and isgoverned by a Participation Agreement, much like the agreement used for B Loans. As in a B Loan, IFC remains the lender of record forthe entire A Loan and an ALP participant shares all project risks with IFC and has the same benefits of a traditional B Loan participant.
Parallel Loans: IFC acts as an arranger - and can also act as an administrative agent - by using its existing mobilization platform,deal‑structuring expertise and global presence to identify investments, perform due diligence, and negotiate loan documents in cooperationwith parallel lenders.
MCPP: MCPP creates diversified portfolios of emerging market private sector loans. MCPP leverages IFC’s origination capacity and deepmarket knowledge to source opportunities for third party investors to co-lend alongside IFC. MCPP gives IFC the ability to provide largerfinancing packages than it could from its own account and increases the pool of financing available for achieving development goals.MCPP builds a loan portfolio for an investor that mirrors the portfolio IFC is creating for its own account. MCPP investors and IFC signupfront administration agreements determining the makeup of the portfolio based on agreed eligibility. Investors pledge capital upfront andthen as IFC identifies eligible deals, investor exposure is allocated alongside IFC’s own per the terms of the agreement.
INVESTMENT PROGRAM
COMMITMENTS
Total Long-Term Finance Commitments (Own Account and Core Mobilization) were $21,961 million in FY20, an increase of $2,835 millionor 15% from FY19. IFC's FY20 Long-Term Finance Own Account Commitments were $11,135 million, compared to $8,920 million in FY19and Core Mobilization was $10,826 million, as compared to $10,206 million for FY19, mainly due to increased mobilization in trade financeby $1,307 million offset by a decrease in syndication by $748 million.
FY20 Long-Term Finance Own Account Commitments included $1,510 million of COVID response, largely in the form of loans, and CoreMobilization included $565 million of COVID response.
In addition, Short-Term Finance Commitments were $6,469 million at FY20, which included $2.0 billion of COVID response, as comparedto $5,764 million at FY19.
INTERNATIONAL FINANCE CORPORATION Page 11
Management’s Discussion and Analysis

CORE MOBILIZATION
Core Mobilization is financing from entities other than IFC that becomes available to clients due to IFC’s direct involvement in raisingresources. IFC mobilizes such private sector finance from other entities through a number of means, as outlined in the Table below.
Table 4: FY20 vs FY19 Long-Term Finance Commitments (Own Account and Core Mobilization) (US$ millions)
FY20 FY19
Total Long-Term Finance Commitments (Own Account and Core Mobilization)4 $ 21,961 $ 19,126Long-Term Finance Own Account Commitments
Loans $ 9,509 $ 7,137Equity Investments 992 999Guarantees 550 742Client Risk Management 84 42
Total Long-Term Finance Own Account Commitments $ 11,135 $ 8,920Core Mobilization
SyndicationParallel Loans $ 2,892 $ 3,473Loan Participations 1,285 1,784Managed Co-lending Portfolio Program 813 481
Total Syndication $ 4,990 $ 5,738AMC (see definitions in Table 7)
Asia Fund $ 20 $ 43GEM Funds 15 282FIG Fund 14 18Global Infrastructure Fund — 33MENA Fund — 9Catalyst Funds — 3
Total AMC Mobilization $ 49 $ 388Advisory Mobilization
Public Private Partnership $ 2,202 $ 1,137CFS Equity Mobilization 215 43
Total Advisory Mobilization $ 2,417 $ 1,180IFC Initiatives
Global Trade Liquidity Program, Critical Commodities Finance Program, Global WarehouseFinance Program and Global Structured Trade Finance Program $ 2,143 $ 836
Mobilization by Decision 756 1,364Debt and Asset Recovery Program 390 614Other Mobilization 81 86
Total IFC Initiatives $ 3,370 $ 2,900
Total Core Mobilization $ 10,826 $ 10,206
INVESTMENT DISBURSEMENTS
IFC disbursed $10,518 million for its own account in FY20 ($9,074 million in FY19): $8,465 million of loans ($7,083 million in FY19),$803 million of equity investments ($908 million in FY19), and $1,250 million of debt securities ($1,083 million in FY19).
DISBURSED INVESTMENT PORTFOLIO
IFC’s total disbursed investment portfolio (a non-GAAP performance measure) was $44,309 million at June 30, 2020 ($44,535 million atJune 30, 2019), comprising the disbursed loan portfolio of $26,036 million ($25,400 million at June 30, 2019), the disbursed equity portfolio
INTERNATIONAL FINANCE CORPORATION Page 12
Management’s Discussion and Analysis
4 Debt security commitments are included in loans and equity investments based on their predominant characteristics.

of $11,785 million ($12,929 million at June 30, 2019), and the disbursed debt security portfolio of $6,488 million ($6,206 million at June 30,2019).
IFC’s disbursed investment portfolio is diversified by industry sector and geographic region.
The distribution of the disbursed investment portfolio by geographical region and industry sector as of June 30, 2020 and June 30, 2019is shown below:
Figure 1: Disbursed Investment Portfolio Distribution by Region (US$ millions)
FY20 FY19
0 3,000 6,000 9,000 12,000 15,000
Asia
Latin America and Caribbean
Europe and Central Asia
Sub-Saharan Africa
Middle East and North Africa
Other
Table 5: Disbursed Investment Portfolio Distribution by Industry Sector (US$ millions)
Disbursed Investments As a % of TotalFY20 FY19 FY20 FY19
Finance & Insurance $ 18,896 $ 17,815 43% 40%Electric Power 4,882 5,344 11% 12%Collective Investment Vehicles 4,048 4,172 9% 9%Chemicals 2,523 2,291 5% 5%Transportation and Warehousing 2,154 2,391 5% 6%Agriculture and Forestry 1,722 1,741 4% 4%Natural Resources 1,478 1,624 3% 4%Wholesale and Retail Trade 1,229 1,044 3% 2%Construction and Real Estate 1,160 959 3% 2%Food & Beverages 1,023 1,053 2% 2%Others 5,194 6,101 12% 14%
Total $ 44,309 $ 44,535 100% 100%
The carrying value of IFC’s investment portfolio comprises: (i) the disbursed investment portfolio; (ii) less reserves against losses on loans;(iii) unamortized deferred loan origination fees, net and other; (iv) disbursed amount allocated to a related financial instrument reportedseparately in other assets or derivative assets; (v) unrealized gains and losses on equity investments held by consolidated variable interestentities; and (vi) unrealized gains and losses on investments.
The carrying value of IFC’s investment portfolio was $41,138 million at June 30, 2020 ($43,462 million at June 30, 2019), comprising theloan portfolio of $24,102 million ($23,983 million at June 30, 2019), the equity portfolio of $10,370 million ($13,130 million at June 30,2019), and the debt security portfolio of $6,666 million ($6,349 million at June 30, 2019).
INTERNATIONAL FINANCE CORPORATION Page 13
Management’s Discussion and Analysis

LOANS
Loans comprise 59% of the disbursed investment portfolio as of June 30, 2020 (57% at June 30, 2019) and 59% of the carrying amountof the investment portfolio as of June 30, 2020 (55% at June 30, 2019).
The carrying amount of IFC’s loan portfolio on IFC’s consolidated balance sheet (comprising the disbursed loan portfolio together withadjustments as detailed in Note D to IFC’s FY20 consolidated financial statements) grew 0.5% to $24,102 million at June 30, 2020 ($23,983million at June 30, 2019) analyzed as follows:
Figure 2: Carrying Amount of Loan Portfolio (US$ millions)
30,000
28,000
26,000
24,000
22,000
Jun 2019 Changes inReserves andFair Value
Disbursements Repayments Prepayments Write-offs,net
ForeignExchange
losses
Other Jun 2020
23,983
(517)
8,465
(5,630)
(1,261) (164)(652) (122)
24,102
The carrying value of the loan portfolio grew by $119 million. New disbursements exceeded repayments and prepayments by $1,574million. Currency exchange rate losses were $652 million as IFC’s reporting currency, the US dollar, appreciated against investmentcurrencies, particularly the Brazilian real, Mexican peso and Indian rupee. Foreign exchange losses are largely offset by foreign exchangegains from associated currency swaps. The residual largely represents the Foreign exchange gain or loss on unhedged quasi-equity loansand loans funded by local currency bonds. Changes in reserves and fair value totaled $517 million reflecting greater credit risk in IFC'sloan portfolio, and write-offs net of recoveries totaled $164 million. The remainder of the change is due to loan conversions and capitalizedinterest and charges.
Loans have been traditionally denominated in the currencies of major industrial nations, but IFC has an extensive portfolio of local currencyproducts. IFC typically offers local currency products in other currencies where it can economically hedge the local currency loan cashflows back into US dollars using swap markets or where it can fund itself in local bond markets. IFC’s disbursed loan portfolio at June 30,2020 includes $4,124 million of currency products denominated in Brazilian real, Chinese renminbi, Indian rupee, Indonesian rupiah,Mexican peso, Colombian peso, South African rand, Philippine peso, Hong Kong dollar, Turkish lira, new Romanian lei, Georgian lariKazakhstan tenge, and Tanzanian shilling ($4,217 million at June 30, 2019). The $93 million decrease in FY20 in local currency loansoutstanding measured in US dollars was mainly due to lower disbursements of loans denominated in Indian rupee, South African randand Brazilian real compared with FY19. IFC has also made loans in a number of frontier market currencies such as Vietnamese dong,Tanzanian shilling and Bangladeshi taka.
At June 30, 2020, 74% of IFC’s disbursed loan portfolio was US dollar-denominated (72% at June 30, 2019).
INTERNATIONAL FINANCE CORPORATION Page 14
Management’s Discussion and Analysis

The currency composition of the disbursed loan portfolio at June 30, 2020 and June 30, 2019 is shown below:
Table 6: Currency position of the Disbursed Loan Portfolio (US$ millions)
Disbursed Loans As a % of TotalFY20 FY19 FY20 FY19
US dollar $ 19,311 $ 18,219 74% 72%Euro 2,239 2,492 9% 10%Brazilian real 760 855 3% 3%Chinese renminbi 750 675 3% 3%Indian rupee 644 760 2% 3%Indonesian rupiah 362 221 1% 1%Mexican peso 346 369 1% 1%Colombian peso 273 272 1% 1%South African rand 253 357 1% 1%Philippine peso 197 211 1% 1%Others 901 969 4% 4%
Total $ 26,036 $ 25,400 100% 100%
EQUITY INVESTMENTS
IFC’s disbursed equity portfolio totaled $11,785 million at June 30, 2020 ($12,929 million at June 30, 2019), a decrease of $1,144 millionor 9%.
Equity investments accounted for 26% of IFC’s disbursed investment portfolio at June 30, 2020, compared with 29% at June 30, 2019and 25% of the carrying amount of the investment portfolio at June 30, 2020 (30% at June 30, 2019).
The carrying amount of IFC’s equity investment portfolio (comprising the disbursed equity portfolio, together with adjustments as detailedin Note D to IFC’s FY20 consolidated financial statements), declined 21.0% to $10,370 million at June 30, 2020 ($13,130 million at June 30,2019) analyzed as follows:
Figure 3: Carrying Amount of Equity Investments Portfolio (US$ millions)
14,000
13,000
12,000
11,000
10,000
9,000
8,000
Jun 2019 Fair Value Changes Purchases Cost of Sales Other Jun 2020
13,130
(1,620)
803
(2,005)
62 10,370
The fair value of IFC’s equity portfolio5 was $10,938 million at June 30, 2020 ($13,890 million at June 30, 2019).
DEBT SECURITIES
IFC’s disbursed debt securities portfolio totaled $6,488 million at June 30, 2020 ($6,206 million at June 30, 2019), an increase of $282million or 5%.
Debt securities accounted for 15% of IFC’s disbursed investment portfolio at June 30, 2020 (14% at June 30, 2019) and 16% of the carryingamount of the investment portfolio at June 30, 2020 (15% at June 30, 2019).
INTERNATIONAL FINANCE CORPORATION Page 15
Management’s Discussion and Analysis
5 Including “equity-like” securities classified as debt securities in IFC’s consolidated balance sheet and equity-related options.

The carrying amount of IFC’s debt securities portfolio (comprising the disbursed debt securities portfolio, together with adjustments asdetailed in Note D to IFC’s FY20 consolidated financial statements), increased 5% to $6,666 million at June 30, 2020 ($6,349 million atJune 30, 2019) analyzed as follows:
Figure 4: Carrying Amount of Debt Securities Portfolio (US$ millions)
8,000
7,000
6,000
5,000
4,000
Jun 2019 Changes inFair Value
Purchases Redemptions Prepayments ForeignExchangelosses
Impairments Other Jun 2020
6,349
11
1,250
(488) (47)(310) (130)
31 6,666
The increase in the debt securities portfolio is largely due to new disbursements exceeding redemptions and prepayments ($715 millionin FY20), partially offset by reduction in balances outstanding due to currency exchange rate fluctuations ($310 million in FY20) and other-than temporary- impairments ($130 million in FY20).
Additional information on IFC’s investment portfolio as of and for the years ended June 30, 2020, and June 30, 2019, can be found inNotes B, D, E, F, G, H, P, R and T to IFC’s FY20 consolidated financial statements.
GUARANTEES AND PARTIAL CREDIT GUARANTEES
IFC offers partial credit guarantees to clients covering, on a risk-sharing basis, client obligations on bonds and/or loans. IFC’s guaranteeis available for debt instruments and trade obligations of clients and covers commercial as well as noncommercial risks. IFC will providelocal currency guarantees, but when a guarantee is called, the client will generally be obligated to reimburse IFC in U.S. dollars terms.Guarantee fees are consistent with IFC’s loan pricing policies.
Guarantees of $3,900 million were outstanding (i.e., not called) at June 30, 2020 ($2,899 million at June 30, 2019).
INVESTMENT PORTFOLIO MANAGEMENT
At the core of IFC’s approach to portfolio management is the aim to build and proactively manage a portfolio that produces strong financialresults and development impact. IFC achieves this through a combination of strong presence on the ground and deep sector expertise,that enables IFC to stay close to its clients and markets, monitor trends and anticipate impacts on its portfolio of clients.
In order to provide continued corporate oversight to IFC’s portfolio, the Operations Committee periodically reviews the investment portfolio,looking both at broad trends as well as select individual assets, which are further complemented by monthly focused in-depth discussionsof IFC’s key sector and country exposures. Quarterly reviews of IFC’s portfolio results are presented to the Board, along with an in-depthanalysis at the end of the Fiscal Year. IFC's investment and portfolio teams, largely based in field offices, complement global reviews withasset-by-asset quarterly assessments, for investments.
At the corporate level, IFC combines the analysis of its portfolio performance with sector expertise and country/region market intelligence,and projections of global macroeconomic and market trends to inform decisions about future investments. IFC also regularly conductsstress tests to assess the performance of the portfolio against possible macroeconomic developments, and to identify and address risks.
At the asset level, IFC’s multidisciplinary teams, including investment and sector specialists with deep industry expertise, closely monitorinvestment performance and compliance with investment agreements. IFC does this, among other things, through site visits to evaluateproject implementation, and through active engagement with sponsors and government officials, where relevant, to identify potentialproblems early on and formulate appropriate solutions. IFC also systematically and timely tracks environmental and social performance,and measures financial and development results.
IFC constantly assesses its equity portfolio proactively to identify assets ready for divestments, where IFC’s development role has beencompleted. This rebalancing of the equity portfolio is the result of an analysis that takes into account market conditions, opportunities,expected returns, and risks, and is adjusted periodically as required. To strengthen this process, IFC has recently appointed Equity Headsof Industry, who provide central oversight particularly of IFC’s larger and more complex equity positions.
INTERNATIONAL FINANCE CORPORATION Page 16
Management’s Discussion and Analysis
For projects in financial distress, IFC’s Special Operations Department determines the appropriate remedial actions. It seeks to keep theproject operational to achieve the development impact intended at its onset. It also negotiates agreements with creditors and shareholdersto share the burden of restructuring.
Investors and other partners participating in IFC’s operations are kept regularly informed on project developments. IFC consults or seekstheir consent as appropriate.
At the core of active portfolio management is the need to have timely and accurate information to drive business decisions. IFC continuesto invest in information-technology systems to better support the management of its portfolio, and is in the process of strengthening itsportfolio support structure through the creation of the Operations Support Unit at the corporate level, to be further extended to its sectorand regional teams.
MCPP
As of June 30, 2020, twelve global investors have pledged $10 billion to MCPP; four investors participate exclusively in infrastructureprojects, six exclusively in financial institutions, and two others are cross-sectoral. Investors have also approved funding for 182 projectstotaling $7 billion across 51 countries as of June 30, 2020, of which $5.1 billion has been committed. IFC will continue to deploy theremaining funds raised as IFC identifies projects that meet investors’ investment criteria.
IDA-PSW
As of June 30, 2020, $1,370 million of instruments under the IDA-PSW had been approved, of which $1,008 million related to IFC. Referto Note X to the FY20 consolidated financial statements for transaction details.
INTERNATIONAL FINANCE CORPORATION Page 17
Management’s Discussion and Analysis

AMC
Effective January 31, 2020, IFC Asset Management Company, LLC (AMC) was merged into IFC. IFC, as the successor to AMC, hasassumed all the assets, rights, liabilities and obligations of AMC. The AMC business is now operated as a division within IFC. In this form,the AMC division continues to operate as manager of all AMC funds, retaining independent decision-making on deploying investors’ fundsand managing the funds’ portfolio investments.
This change did not have a significant impact on IFC's financial position, results of operations or cash flows.
AMC was established by IFC in 2009 to invest third-party capital and IFC capital, enabling outside investors to invest alongside IFC indeveloping markets. Investors in funds managed by AMC have included sovereign wealth funds, national pension funds, multilateral andbilateral development institutions, national development agencies and international financial institutions (IFIs).
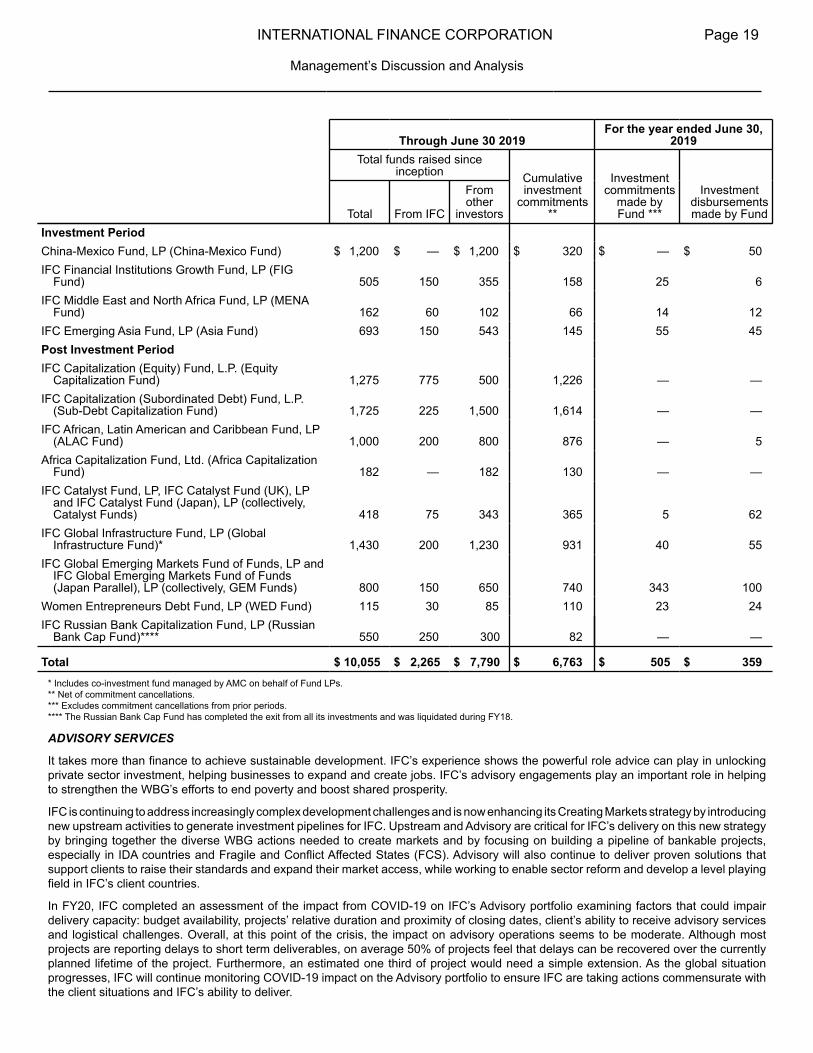
Cumulatively through June 30, 2020, AMC raised total funds of $10.1 billion ($10.1 billion at June 30, 2019).
The Funds Managed by AMC and their activities as of and for the years ended June 30, 2020 and 2019 are summarized as follows:
Table 7: Funds Managed by AMC and their Activities FY20 vs FY19 (US$ millions unless otherwise indicated)
Through June 30, 2020For the year ended June 30,
2020Total funds raised since
inception Cumulativeinvestment
commitments**
Investmentcommitments
made byFund ***
Investmentdisbursementsmade by FundTotal From IFC
Fromother
investorsInvestment PeriodIFC Financial Institutions Growth Fund, LP (FIG
Fund) $ 505 $ 150 $ 355 $ 178 $ 20 $ 7IFC Middle East and North Africa Fund, LP (MENA
Fund) 162 60 102 66 — 6IFC Emerging Asia Fund, LP (Asia Fund) 693 150 543 171 26 13Post Investment PeriodIFC Capitalization (Equity) Fund, L.P. (Equity
Capitalization Fund) 1,275 775 500 1,226 — —IFC Capitalization (Subordinated Debt) Fund, L.P.
(Sub-Debt Capitalization Fund) 1,725 225 1,500 1,614 — —IFC African, Latin American and Caribbean Fund, LP
(ALAC Fund) 1,000 200 800 876 — 3Africa Capitalization Fund, Ltd. (Africa Capitalization
Fund) 182 — 182 130 — —IFC Catalyst Fund, LP, IFC Catalyst Fund (UK), LP
and IFC Catalyst Fund (Japan), LP (collectively,Catalyst Funds) 418 75 343 365 — 30
IFC Global Infrastructure Fund, LP (GlobalInfrastructure Fund)* 1,430 200 1,230 929 — —
IFC Global Emerging Markets Fund of Funds, LPand IFC Global Emerging Markets Fund of Funds(Japan Parallel), LP (collectively, GEM Funds) 800 150 650 757 17 71
Women Entrepreneurs Debt Fund, LP (WED Fund) 115 30 85 110 — —China-Mexico Fund, LP (China-Mexico Fund) 1,200 — 1,200 320 — 35IFC Russian Bank Capitalization Fund, LP (Russian
Bank Cap Fund)**** 550 250 300 82 — —
Total $ 10,055 $ 2,265 $ 7,790 $ 6,824 $ 63 $ 165* Includes co-investment fund managed by AMC on behalf of Fund LPs.** Net of commitment cancellations.*** Excludes commitment cancellations from prior periods.**** The Russian Bank Cap Fund has completed the exit from all its investments and was liquidated during FY18.
INTERNATIONAL FINANCE CORPORATION Page 18
Management’s Discussion and Analysis
Through June 30 2019For the year ended June 30,
2019Total funds raised since
inception Cumulativeinvestment
commitments**
Investmentcommitments
made byFund ***
Investmentdisbursementsmade by FundTotal From IFC
Fromother
investorsInvestment PeriodChina-Mexico Fund, LP (China-Mexico Fund) $ 1,200 $ — $ 1,200 $ 320 $ — $ 50IFC Financial Institutions Growth Fund, LP (FIG
Fund) 505 150 355 158 25 6IFC Middle East and North Africa Fund, LP (MENA
Fund) 162 60 102 66 14 12IFC Emerging Asia Fund, LP (Asia Fund) 693 150 543 145 55 45Post Investment PeriodIFC Capitalization (Equity) Fund, L.P. (Equity
Capitalization Fund) 1,275 775 500 1,226 — —IFC Capitalization (Subordinated Debt) Fund, L.P.
(Sub-Debt Capitalization Fund) 1,725 225 1,500 1,614 — —IFC African, Latin American and Caribbean Fund, LP
(ALAC Fund) 1,000 200 800 876 — 5Africa Capitalization Fund, Ltd. (Africa Capitalization
Fund) 182 — 182 130 — —IFC Catalyst Fund, LP, IFC Catalyst Fund (UK), LP
and IFC Catalyst Fund (Japan), LP (collectively,Catalyst Funds) 418 75 343 365 5 62
IFC Global Infrastructure Fund, LP (GlobalInfrastructure Fund)* 1,430 200 1,230 931 40 55
IFC Global Emerging Markets Fund of Funds, LP andIFC Global Emerging Markets Fund of Funds(Japan Parallel), LP (collectively, GEM Funds) 800 150 650 740 343 100
Women Entrepreneurs Debt Fund, LP (WED Fund) 115 30 85 110 23 24IFC Russian Bank Capitalization Fund, LP (Russian
Bank Cap Fund)**** 550 250 300 82 — —
Total $ 10,055 $ 2,265 $ 7,790 $ 6,763 $ 505 $ 359* Includes co-investment fund managed by AMC on behalf of Fund LPs. ** Net of commitment cancellations.*** Excludes commitment cancellations from prior periods.**** The Russian Bank Cap Fund has completed the exit from all its investments and was liquidated during FY18.
ADVISORY SERVICES
It takes more than finance to achieve sustainable development. IFC’s experience shows the powerful role advice can play in unlockingprivate sector investment, helping businesses to expand and create jobs. IFC’s advisory engagements play an important role in helpingto strengthen the WBG’s efforts to end poverty and boost shared prosperity.
IFC is continuing to address increasingly complex development challenges and is now enhancing its Creating Markets strategy by introducingnew upstream activities to generate investment pipelines for IFC. Upstream and Advisory are critical for IFC’s delivery on this new strategyby bringing together the diverse WBG actions needed to create markets and by focusing on building a pipeline of bankable projects,especially in IDA countries and Fragile and Conflict Affected States (FCS). Advisory will also continue to deliver proven solutions thatsupport clients to raise their standards and expand their market access, while working to enable sector reform and develop a level playingfield in IFC’s client countries.
In FY20, IFC completed an assessment of the impact from COVID-19 on IFC’s Advisory portfolio examining factors that could impairdelivery capacity: budget availability, projects’ relative duration and proximity of closing dates, client’s ability to receive advisory servicesand logistical challenges. Overall, at this point of the crisis, the impact on advisory operations seems to be moderate. Although mostprojects are reporting delays to short term deliverables, on average 50% of projects feel that delays can be recovered over the currentlyplanned lifetime of the project. Furthermore, an estimated one third of project would need a simple extension. As the global situationprogresses, IFC will continue monitoring COVID-19 impact on the Advisory portfolio to ensure IFC are taking actions commensurate withthe client situations and IFC’s ability to deliver.
INTERNATIONAL FINANCE CORPORATION Page 19
Management’s Discussion and Analysis

During FY20, IFC provided advice in key business areas:
Financial Institutions: IFC helps increase the availability and affordability of financial services for individuals and for micro, small, andmedium enterprises. IFC works with financial institutions to strengthen their risk management and diversify their product offering in areassuch as SMEs, housing finance, and sustainable energy.
Manufacturing Agribusiness & Services (MAS): IFC helps clients improve farmer productivity and standards in agribusiness. IFC’sefforts are focused on designing efficient value chains and boosting food security-thereby providing valuable social, economic, andenvironmental benefits for all stakeholders. MAS helps clients develop clean, affordable, competitive, and high-quality energy and resourceefficiency solutions across the value chain. MAS also works to improve manufacturing productivity and increase the efficiency andeffectiveness in the healthcare and education sectors.
Infrastructure & Natural Resources: IFC helps both private and sub-sovereign public sector clients to build capacity and mechanismsto become attractive destinations for infrastructure investments. IFC works closely with private sector clients and commercially run state-owned enterprises to acquire a social license to operate in tough environments by increasing benefits to local communities; mitigatingsocial risks; and addressing obstacles to equality and inclusion in the workplace, across the supply chain. IFC also works with subnationalgovernments to strengthen institutions and regulations; improve critical infrastructure and environmental sustainability; foster skills andinnovation; expand access to finance; and build capacity to manage tax and royalty payments to improve community welfare and localcontent.
Telecoms, Media, Technology, Venture Investing: Provides Advisory Services in two areas: (i) through its SME Ventures program, itsupports local first-time fund managers delivering risk capital to SMEs in difficult markets (FCS & Low-Income IDA Countries), and (ii) theVenture Investing unit which focuses on cross-cutting themes across regions and industries for creating markets around disruptivetechnologies, digitalization, and innovation in emerging markets.
Environment Social & Governance: IFC helps clients conduct business in a sustainable manner and manage risks by promoting soundenvironmental, social and corporate governance practices.
Transaction Advisory: Provides two types of advisory services: (i) through its Public-Private Partnerships team, it supports national andsubnational governments in structuring and procuring private sector partners for Public-Private Partnerships, to improve access to education,energy, transport, healthcare, and sanitation services; and (ii) through its Corporate Finance team, it supports private sector clients in theircross-border mergers and acquisition transactions.
Global Practices: Working in partnership with the World Bank GPs, IFC support national and local governments to enact and implementreforms to facilitate job creation and growth in IFC's client countries, primarily in the areas of investment climate and development offinancial markets.
Other Advisory: IFC also provides advisory solutions that can be deployed across several industries, which include work on climatebusiness, gender and country engagement advisory.
As of June 30, 2020, the IFC Advisory Services Portfolio totaled about $1,509 million ($1,529 million at June 30, 2019). FY20 programexpenditures was $274 million ($295 million in FY19) with a strong focus on IFC's strategic priority areas IDA at 57%, FCS at 22%, andClimate Change at 25%, (compared to 59%, 21% and 24% respectively in FY19). Despite the pandemic, IFC expect a steady growthparticularly with IFC’s increased utilization of its Creating Markets Advisory Window in support of the creating markets agenda in IDAeligible and fragile countries.
Table 8: IFC Advisory Services - Program Expenditures by Region for FY20 vs FY19
FY20 FY19IFC Advisory Services expenses by region US$ millions % US$ millions %
Sub Saharan Africa $ 93 34 $ 97 33East Asia and the Pacific 43 16 55 19Europe and Central Asia 35 13 39 13Latin America and the Caribbean 31 11 30 10South Asia 26 9 36 12World region 25 9 21 7Middle East and North Africa 21 8 17 6
Total Program Expenditures $ 274 100 $ 295 100
INTERNATIONAL FINANCE CORPORATION Page 20
Management’s Discussion and Analysis
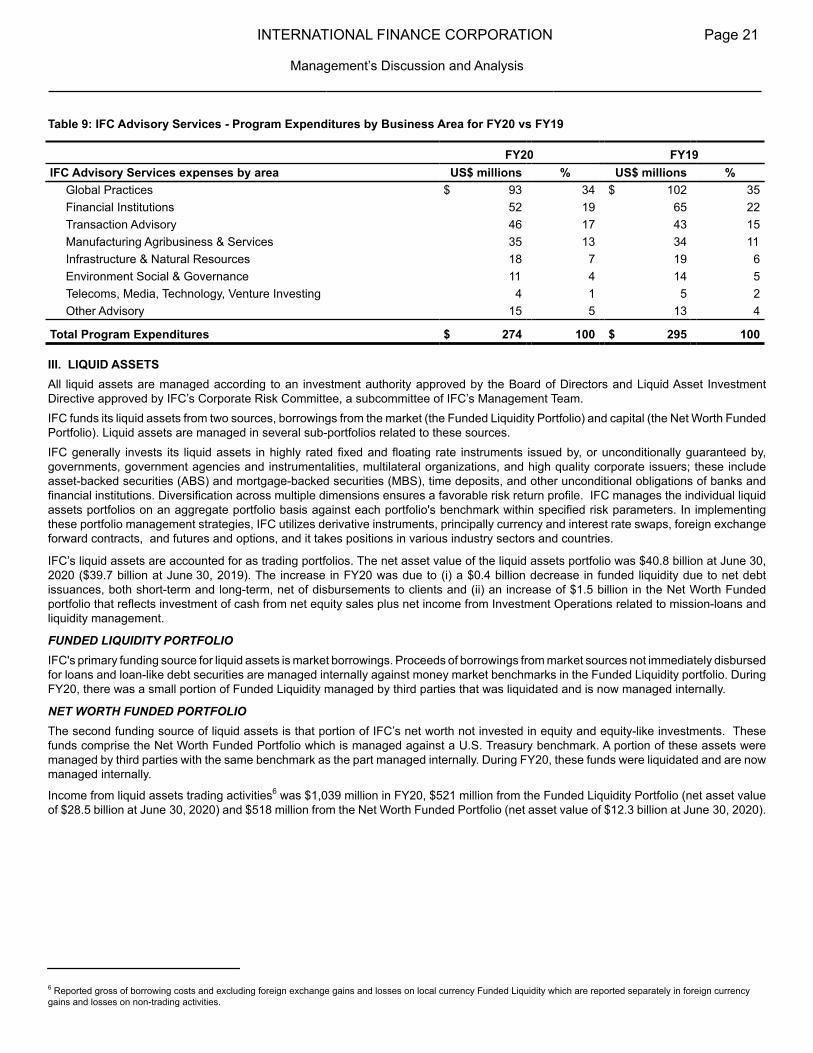
Table 9: IFC Advisory Services - Program Expenditures by Business Area for FY20 vs FY19
FY20 FY19IFC Advisory Services expenses by area US$ millions % US$ millions %
Global Practices $ 93 34 $ 102 35Financial Institutions 52 19 65 22Transaction Advisory 46 17 43 15Manufacturing Agribusiness & Services 35 13 34 11Infrastructure & Natural Resources 18 7 19 6Environment Social & Governance 11 4 14 5Telecoms, Media, Technology, Venture Investing 4 1 5 2Other Advisory 15 5 13 4
Total Program Expenditures $ 274 100 $ 295 100
INTERNATIONAL FINANCE CORPORATION Page 21
Management’s Discussion and Analysis
III. LIQUID ASSETSAll liquid assets are managed according to an investment authority approved by the Board of Directors and Liquid Asset InvestmentDirective approved by IFC’s Corporate Risk Committee, a subcommittee of IFC’s Management Team.IFC funds its liquid assets from two sources, borrowings from the market (the Funded Liquidity Portfolio) and capital (the Net Worth FundedPortfolio). Liquid assets are managed in several sub-portfolios related to these sources.IFC generally invests its liquid assets in highly rated fixed and floating rate instruments issued by, or unconditionally guaranteed by,governments, government agencies and instrumentalities, multilateral organizations, and high quality corporate issuers; these includeasset-backed securities (ABS) and mortgage-backed securities (MBS), time deposits, and other unconditional obligations of banks andfinancial institutions. Diversification across multiple dimensions ensures a favorable risk return profile. IFC manages the individual liquidassets portfolios on an aggregate portfolio basis against each portfolio's benchmark within specified risk parameters. In implementingthese portfolio management strategies, IFC utilizes derivative instruments, principally currency and interest rate swaps, foreign exchangeforward contracts, and futures and options, and it takes positions in various industry sectors and countries.
IFC’s liquid assets are accounted for as trading portfolios. The net asset value of the liquid assets portfolio was $40.8 billion at June 30,2020 ($39.7 billion at June 30, 2019). The increase in FY20 was due to (i) a $0.4 billion decrease in funded liquidity due to net debtissuances, both short-term and long-term, net of disbursements to clients and (ii) an increase of $1.5 billion in the Net Worth Fundedportfolio that reflects investment of cash from net equity sales plus net income from Investment Operations related to mission-loans andliquidity management.
FUNDED LIQUIDITY PORTFOLIOIFC's primary funding source for liquid assets is market borrowings. Proceeds of borrowings from market sources not immediately disbursedfor loans and loan-like debt securities are managed internally against money market benchmarks in the Funded Liquidity portfolio. DuringFY20, there was a small portion of Funded Liquidity managed by third parties that was liquidated and is now managed internally.
NET WORTH FUNDED PORTFOLIOThe second funding source of liquid assets is that portion of IFC’s net worth not invested in equity and equity-like investments. Thesefunds comprise the Net Worth Funded Portfolio which is managed against a U.S. Treasury benchmark. A portion of these assets weremanaged by third parties with the same benchmark as the part managed internally. During FY20, these funds were liquidated and are nowmanaged internally.
Income from liquid assets trading activities6 was $1,039 million in FY20, $521 million from the Funded Liquidity Portfolio (net asset valueof $28.5 billion at June 30, 2020) and $518 million from the Net Worth Funded Portfolio (net asset value of $12.3 billion at June 30, 2020).
6 Reported gross of borrowing costs and excluding foreign exchange gains and losses on local currency Funded Liquidity which are reported separately in foreign currencygains and losses on non-trading activities.

IV. FUNDING RESOURCES
IFC’s funding resources (comprising borrowings, capital and retained earnings) as of June 30, 2020 and June 30, 2019 are as follows:
Figure 5: IFC's Funding Resources (US$ millions)
FY20 FY19
0 10,000 20,000 30,000 40,000 50,000 60,000
Borrowings from market sources
Retained earnings
Discount Note Programand other short-term borrowings
Paid-in capital
Borrowings from IDA
BORROWINGSThe major source of IFC’s borrowings is the international capital markets. Under the Articles of Agreement, IFC may borrow in the publicmarkets of a member country only with approvals from that member, together with the member in whose currency the borrowing isdenominated.
IFC’s new medium and long-term borrowings (after the effect of borrowing-related derivatives and including discount notes with maturitiesgreater than three months of $3.7 billion in FY20, $4.7 billion in FY19 and $2.5 billion in FY18) totaled $14.6 billion during FY20 ($15.5 billionin FY19 and $16.0 billion in FY18) reflecting a paced implementation of the funding program in line with funding needs of the Corporation.In addition, the Board of Directors has authorized the repurchase and/or redemption of debt obligations issued by IFC, which enhancesthe liquidity of IFC’s borrowings. IFC uses its issuances as a tool to promote capital markets development in emerging and frontier markets.Proceeds of these issuances not disbursed into loans have primarily been invested in securities of the related sovereign and sovereigninstrumentalities in the currency of the issuances. During FY20, IFC repurchased and retired $2.1 billion of outstanding debt ($0.7 billionin FY19 and $0.8 billion in FY18), including debt called and bought back, generating gains on buybacks (from fees and capital gains) of$7.0 million in FY20 ($1.0 million - FY19 and $2.0 million - FY18).
IFC diversifies its borrowings by currency, country, source, and maturity to provide flexibility and cost-effectiveness. In FY20, IFC borrowedin 29 currencies and in final maturities ranging from 3 months to 40 years. Borrowings outstanding have a weighted average remainingcontractual maturity of 7.4 years at June 30, 2020 (8.2 years at June 30, 2019). Actual maturities may differ from contractual maturitiesdue to the existence of call features in certain of IFC’s borrowings.
Market borrowings are generally swapped into floating-rate obligations denominated in US dollars. As of June 30, 2020, IFC had grosspayables from borrowing-related currency swaps of $27.6 billion ($26.3 billion at June 30, 2019) and from borrowing-related interest rateswaps in the notional principal payable amount of $25.6 billion ($26.7 billion at June 30, 2019). After the effect of these derivative instrumentsis taken into consideration, 97% of IFC’s market borrowings at June 30, 2020 were variable rate US dollar-denominated (96% - June 30,2019). The weighted average cost of outstanding market borrowings after currency and interest rate swap transactions was 1.1% atJune 30, 2020 (2.8% at June 30, 2019). The decrease in cost of borrowings compared to the prior year was due to significantly lower US$ six‑month LIBOR rates.
IFC also uses its borrowings as a tool to promote capital markets development in emerging and frontier markets and this can result inraising local currency funds. Proceeds of these issuances not disbursed into loans have primarily been invested in securities of the relatedsovereign and sovereign instrumentalities in the currency of the issuances. Borrowings from market sources at June 30, 2020 with noassociated interest rate or currency swap amounted to 4% of the total borrowings from market sources (4% at June 30, 2019).
INTERNATIONAL FINANCE CORPORATION Page 22
Management’s Discussion and Analysis

As of June 30, 2020, $1.9 billion ($2.2 billion as of June 30, 2019) of such non-US$ denominated market borrowings were outstanding,denominated in Bangladeshi taka, Botswana pula, Costa Rican colòn, Dominican peso, Georgian lari, Indonesian rupiah, Indian rupee,Kazakhstan tenge, Namibian dollar, Philippine peso, new Romanian lei, new Serbian dinar, Turkish lira, Ukraine hrivnya and Uzbekistansum. Proceeds of such borrowings were invested in such local currencies, on-lent to clients and/or partially swapped into US dollars.
IFC has short term discount note programs in US dollar and Chinese renminbi to provide an additional funding and liquidity managementtool for IFC in support of certain of IFC’s trade finance and supply chain initiatives and to expand the availability of short term local currencyfinance. The discount note programs provide for issuances with maturities ranging from overnight to one year. The weighted average costof discount note borrowing in FY20 was 1.5%. During FY20, IFC issued $3.7 billion of discount notes and $3.0 billion were outstandingas of June 30, 2020 under the short-term discount note programs.
CAPITAL AND RETAINED EARNINGS
Table 10: IFC's Capital (US$ millions)
June 30, 2020
June 30, 2019
CapitalCapital stock, authorized $ 25,080 $ 2,580Subscribed capital 20,366 2,567Less: unpaid portion of subscriptions (799) —Paid-in capital 19,567 2,567Accumulated other comprehensive loss (1,984) (1,232)Retained earnings 7,599 26,271
Total Capital $ 25,182 $ 27,606
At June 30, 2020 and June 30, 2019, retained earnings comprised the following:
Table 11: IFC's Retained Earnings (US$ millions)
June 30, 2020
June 30, 2019
Undesignated Retained Earnings $ 7,166 $ 25,905Designated Retained Earnings:
Grants to IDA 213 115Creating Markets Advisory Window 135 166Advisory Services 69 66IFC SME Ventures for IDA countries 15 16Performance-based Grants 1 3
Total Designated Retained Earnings $ 433 $ 366
Total Retained Earnings $ 7,599 $ 26,271
Following the Spring Meetings in April 2018, a financing package, comprising: (i) a three-step capital raising process: Conversion of aportion of retained earnings into paid-in capital, a Selective Capital Increase (SCI) and a General Capital Increase (GCI) that would provideup to $5.5 billion in additional paid-in capital; (ii) a planned suspension of grants to IDA after the conclusion of the IDA 18 replenishmentcycle; and (iii) internal measures for increased efficiency was endorsed by the Board of Governors. The authorized capital stock as onJune 30, 2020 is 25,079,991 shares of $1,000 par value each (2,580,000 at June 30, 2019).
The GCI and SCI Resolutions were adopted and became effective on April 16, 2020 and $17 billion of retained earnings were convertedinto paid-in-capital in April 2020, and the capital subscription process was formally launched on April 22, 2020. As of June 30, 2020, ninecountries have subscribed a total of $799 million (General capital increase of $621 million and Selective capital increase of $178 million).
INTERNATIONAL FINANCE CORPORATION Page 23
Management’s Discussion and Analysis

DESIGNATIONS OF RETAINED EARNINGSAmounts available to be designated are determined based on a Board of Directors-approved income-based formula and on a principles-based Board of Directors-approved financial distribution policy, and are approved by the Board of Directors.IFC’s Board of Directors approved a change to the sliding-scale formula and the methodology used for calculating the incremental rate ofdesignation, beginning with the designation in respect of FY17. The revised approach establishes a threshold that no designations of anykind can take place if IFC’s DSC ratio is below 2%, and establishes a framework for prioritizing future designations to Advisory Servicesand for transfers to IDA based on IFC’s DSC ratio and a cushion for Advisory Services. IFC has also created a new mechanism that wasfunded for the first time in FY18, the Creating Markets Advisory Window (CMAW), to focus on market creation in eligible IDA countries andfragile and conflict situations.The revised approach established a maximum cumulative amount that can be contributed to IDA, during the IDA 18 Replenishment, of$300 million, with no more than $100 million in any given year (plus any shortfall from earlier years).The approach also conditions Grants to IDA during a fiscal year at IFC’s Net Income, if any, for the nine months ended March 31 of thatfiscal year with actual transfer to occur in June of that fiscal year. Any amounts designated in prior years and not transferred pursuant tothis requirement would be deferred to the next fiscal year. Grants to IDA would also be deferred to the next fiscal year if capital as reportedon IFC’s consolidated balance sheet has declined between June 30 of the prior fiscal year and March 31 of that fiscal year.New designations to IDA have been suspended, effective FY20. $213 million of designations approved in FY18 and FY19 have not beentransferred as of FY20-end. These designations would be transferred in June 2021, but capped at IFC's Net Income for the nine monthsending March 31, 2021, if any, and subject to capital as reported on IFC's consolidated balance sheet as of March 31, 2021 not decliningfrom capital as reported on IFC's consolidated balance sheet as of June 30, 2020. Any amount not transferred in June 2021 would thenbe transferred in the year ending June 2022, subject to that year's cap.IFC recognizes designations of retained earnings for Advisory Services and CMAW when the Board of Directors approves it and recognizesdesignations of retained earnings for grants to IDA when it is noted with approval by the Board of Governors. Expenditures for the variousapproved designations are recorded as expenses in IFC’s consolidated statement of operations in the period in which they occur, andhave the effect of reducing retained earnings designated for this specific purpose.IFC reviewed the calculation of Income Available for Designations in FY20 due to the adoption of ASU 2016-01, Recognition andMeasurement of Financial Assets and Liabilities (ASU 2016-01) in FY19 which resulted in all unrealized gains and losses on equityinvestments being reported in Net Income. Beginning in FY20, IFC uses "income excluding unrealized gains and losses on investmentsand borrowings and grants to IDA" as the metric for Income Available for Designations. FY19 DESIGNATIONSIncome available for designations in FY19 (a non-GAAP measure) totaled $909 million, as calculated under accounting standards forequity investments in effect prior to July 1, 2018 which formed the basis of IFC’s revised approach to designations and sliding scale formulaapproved in FY17, and is consistent with IFC’s designations from FY17 and FY18 net income. Given the CMAW spending cushion atFY19-end, IFC did not make an additional designation in FY19 and expects to continue to make designations in future years as allowedby IFC’s net income and as CMAW spending ramps up.On August 8, 2019, the Board of Directors approved a designation of $24 million of IFC’s retained earnings for Advisory Services, and,subject to the conditions detailed above, a designation of $98 million of IFC’s retained earnings for grants to IDA. These designations werenoted with approval by the Board of Governors on October 18, 2019. IFC did not recognize expenditures against designations for grants to IDA in FY19 from FY18 designation and the transfer was deferredto FY20 due to IFC's net loss for the nine months ended March 31, 2019 in accordance with the Board of Directors approved frameworkfor designations. IFC did not recognize expenditures against designations for grants to IDA in FY20 from FY18 and FY19 designations, and both transferswere deferred to FY21, due to IFC's net loss for the nine months ended March 31, 2020. FY20 DESIGNATIONSIncome available for designations in FY20 (a non-GAAP measure) totaled $572 million, calculated as net income excluding unrealizedgains and losses on investments and borrowings and grants to IDA. Based on the new Board-approved distribution policy outlined above,the maximum amount available for designation was $44 million. On August 7, 2020, the Board of Directors approved a designation of $44million of IFC’s retained earnings for CMAW, subject to the conditions detailed above. There were no designations of IFC's retainedearnings for Advisory Services. This designation is expected to be noted with approval by the Board of Governors, and subject to the aboveconditions, concluded in FY21.DEPLOYABLE STRATEGIC CAPITALIFC’s Capital Adequacy, as measured by Deployable Strategic Capital (DSC), was 17.9% at the end of FY20, higher than the 11.6% atthe end of FY19. The 6.3 percentage point (pp) increase was largely due to the reduction in capital required to support IFC’s business.
INTERNATIONAL FINANCE CORPORATION Page 24
Management’s Discussion and Analysis

V. RISK MANAGEMENT
IFC RISK MANAGEMENT RESPONSE TO COVID-19
What became the global COVID-19 global pandemic began to affect financial markets significantly in FY20 Q2 and this became pervasivein FY20 Q3, resulting in significant price volatility across most markets, setting off massive fiscal and monetary responses in many countriesin response. The real economy in the vast majority of countries in which IFC’s clients operate began to deteriorate in early FY20 Q3 andthen quickly contracted as most of those countries implemented drastic quarantine responses to mitigate the spread of contagion.
FY20 Q1 and FY20 Q2 economic and market expectations quickly became obsolete, necessitating fundamental reviews of, inter alia,potential funding, liquidity and valuation outlooks. As IFC clients began to be impacted directly, Risk Management’s involvement was keyto fast-tracking IFC’s COVID-19 emergency financing initiatives. Revised stress scenarios were also conducted on the investment portfolioto calibrate potential capital, balance sheet and income statement impacts, the results of which were discussed with IFC’s Board of Directors.
ENTERPRISE RISK MANAGEMENT
IFC provides long-term investments and advisory services to the private sector in emerging markets and is therefore exposed to a rangeof potential financial and non-financial impacts. Active monitoring and sound management of evolving risks remain critical pillars in termsof fulfilling IFC’s mission.
ENTERPRISE RISK MANAGEMENT FRAMEWORK
IFC’s enterprise risk management framework (ERM) is designed to enable the prudent management of financial and reputational impactsthat originate from the Corporation’s business activities. In this context, IFC’s risk management efforts are designed specifically to helpalign the Corporation’s performance with its strategic direction. The ERM framework that IFC adopted in the year ended June 30, 2014remains aligned with industry standards and is designed to underpin IFC's response to risk by defining:
• IFC's core risk management principles;
• A common risk taxonomy for use across the organization, to help ensure that risk management efforts are coordinated and alignedacross the distinct parts of the organization that share responsibility for managing different aspects of risk;
• A standard classification of roles and responsibilities for risk management, to differentiate and thereby clarify how different partsof the Corporation contribute towards the overall management of risk;
• How emerging and evolving risks are identified, defined, monitored and managed; and
• The structures, processes and methods that are necessary to put active risk management into practice.
KEY RISK MANAGEMENT PRINCIPLES
The key principles that continue to inform IFC’s ERM Framework are:
• Maximizing development impact while maintaining financial sustainability within specified tolerances;
• Ensuring that business decisions are based on a thorough understanding of risks and that risks and rewards are balancedappropriately;
• Being disciplined and selective in undertaking activities that could cause significant adverse reputational impact; and
• Sharing responsibility for risk management across the Corporation.
The ERM Framework comprises several components, each addressing a specific issue within the Framework. These components aredynamic in nature and reflect the fact that IFC’s risk management evolution is a continual, iterative and interconnected effort.
INTERNATIONAL FINANCE CORPORATION Page 25
Management’s Discussion and Analysis

The ERM Framework is depicted as follows:
Figure 6: IFC's Enterprise Risk Management Framework
Risk Culture - Starting with IFC’s senior management, building the right risk culture instills behaviors that are integral to the success ofERM.
Risk Coverage - IFC’s risk profile is assessed across five classes of risk, namely credit, market, operational, liquidity and business risks.Each of these is addressed in this section.
Risk Appetite - A comprehensive set of explicit risk appetite statements, with associated metrics, provides a consistent and integratedbasis for making decisions that impact IFC’s risk profile, while monitoring IFC’s risk exposures, and taking remedial action when risktolerances are threatened or exceeded.
Risk Governance and Policies - IFC’s risk governance structure is based on the industry-standard principle of “three lines of defense”.
• IFC’s first line of defense is line management, consisting of frontline decision makers on individual projects and transactions. Thesecond line of defense is, collectively, the Management Team, its committees and IFC’s independent risk management functions.Independent oversight bodies, together with the Board of Directors, serve as the third line of defense. These independent oversightbodies are:
• The Independent Evaluation Group, which assesses the alignment between projected and realized outcomes of IFC’sinvestment and advisory projects undertaken with its clients;
• The Compliance Advisor/Ombudsman, which is the independent recourse mechanism for IFC’s stakeholders, respondingto complaints from project-affected communities with the goal of enhancing social and environmental outcomes on the ground;
• The WBG’s Internal Audit Vice Presidency, which evaluates the effectiveness of the organization’s governance, riskmanagement, and control processes; and
• The Integrity Vice-Presidency, which investigates and pursues sanctions related to allegations of fraud and corruption inWBG-financed activities.
• IFC’s risk management policies define the types and amounts of risk that IFC’s Management Team is willing to assume, viadelegated authority from the Board.
Risk Data and Infrastructure - Source data is collected, integrated and analyzed to support decision-making across the Corporation.
Measurement and Evaluation - IFC uses a combination of quantitative and qualitative metrics to manage its risk profile. Key metrics foreach category of risk are discussed later in this section.
Control Environment - Management relies on internal controls, modelled on the Committee of Sponsoring Organizations of the TreadwayCommission (COSO) Framework, to reduce the level of financial reporting risk to an acceptable level.
INTERNATIONAL FINANCE CORPORATION Page 26
Management’s Discussion and Analysis

Risk Response - Risks are analyzed and monitored by IFC’s risk oversight units and the Corporate Risk Committee, a subcommittee ofIFC’s Management Team, which meets frequently to discuss and decide upon enterprise-level risk issues.
Stress Testing - IFC-wide stress testing provides Management with an additional tool to inform capital management and decision making.The testing involves multi-year projections of IFC’s financial performance and capital adequacy under base case and stressedmacroeconomic scenarios.
ENTERPRISE LEVEL RISK APPETITE
IFC has developed risk appetite statements which set the direction for the Corporation’s willingness to take risks in fulfilment of itsdevelopment goals. These statements reflect the Corporation’s core values of maximizing development impact, preserving its financialsustainability and safeguarding its reputation.
At the strategic level, IFC has adopted the following risk appetite statements:
• Developmental Impact: IFC will maximize developmental impact by focusing on the WBG’s twin goals of addressing extremepoverty and boosting shared prosperity, while maintaining financial sustainability and safeguarding its brand.
• Financial Sustainability: IFC will generate and maintain sufficient financial resources, conduct its business and manage risksconsistent with standards implied by a triple-A rating.
• Safeguarding Reputation: In determining what engagement and activities to pursue, IFC will assess whether any potentialadverse impact to its reputation is balanced by the potential development impact.
IFC applies a rigorous ex-ante and ex-post impact assessment framework (Anticipated Impact Measurement and Monitoring, AIMM) underwhich projects are scored, incentives are set and trade-offs managed on a portfolio basis.
From a financial sustainability perspective, the capital required to maintain a triple-A rating is assessed using an economic capital framework,which is the foundation of financial risk management at IFC. Economic capital acts as a “common currency of risk” across the organization,providing IFC with an objective, quantifiable measure of risk that can be applied consistently across business lines, products, regions andsectors. IFC holds economic capital for credit, market and operational risks. The primary measure of capital adequacy is DSC, which isthe capital available to support future commitments over and above the current portfolio plus an additional capital buffer.
IFC conforms to key financial policies approved by its Board of Directors, as detailed below:
• Capital Adequacy Policy - IFC is required to maintain a minimum level of total resources (including paid-in capital, total lossreserves and retained earnings, net of designations) equal to total potential losses for all on- and off-balance sheet exposuresestimated at levels consistent with maintaining a triple-A rating.
• Leverage Policy - IFC’s outstanding debt plus guarantees held must not exceed four times its net worth.
• Overall Liquidity Policy - Minimum liquidity (liquid assets) must be sufficient at all times to cover at least 45% of IFC’s estimatednet cash requirements for the next three years.
• Matched Funding Policy - Loans are funded with liabilities that have similar characteristics in terms of interest rate basis,currency, and maturity, except for new products, approved by the Board of Directors, involving asset-liability mismatches.
In order to safeguard its reputation, IFC pays close attention to potential adverse reputational impacts which may exceed its risk tolerance,as negative perceptions of IFC held by stakeholders or the general public may ultimately impact IFCs ability to carry out business effectively.In determining which engagements and activities to pursue, IFC assesses whether any identified potential adverse impact to its reputationis balanced by the project’s or program’s potential development impact and financial returns.
One of the key forward-looking tools used by IFC for promoting its brand and managing reputational impact is effective communication.Communication activities are coordinated by the IFC’s Partnerships, Communications & Outreach Vice Presidency. This unit providesadvice on strategic and crisis communications for managing potential and actual reputational impacts at both the corporate and projectlevels, throughout the project life cycle. It is also responsible for external and internal communications, campaigns, civil society engagement,brand marketing, and web, social, and other media. It collaborates across IFC and works in conjunction with other WBG entities to developand implement effective communications strategies that strengthen the IFC brand.
TREASURY RISK MANAGEMENT
Treasury risks are managed through a two-tier risk framework: (1) a comprehensive policy framework and (2) an economic capital limitfor Treasury activities. The policy framework is based on four principles:
▪ Investment in high quality assets;
• Diversification via position size/concentration limits;
• Limits on market risks (credit spread, interest rate, foreign exchange, and option risks); and
• Proactive portfolio surveillance.
INTERNATIONAL FINANCE CORPORATION Page 27
Management’s Discussion and Analysis

In line with regulatory changes in global financial markets, IFC has continued to refine its Treasury risk management framework, includingmanagement of funding and liquidity risks.
CREDIT RISK MANAGEMENT
DEFINITION AND SCOPE OF CREDIT RISK
IFC defines credit risk as the risk of loss of principal or loss of an expected financial return due to credit events such as a default ordowngrade in credit ratings or any other failure to meet a contractual obligation that results in financial loss. IFC is exposed to credit riskin its loan portfolio and to investment and counterparty credit risk in its Treasury portfolio.
INVESTMENT OPERATIONS
Credit risk in investment projects is actively managed throughout the project life cycle. Investment teams are responsible for gathering thenecessary information from the client and other relevant stakeholders to verify the financial viability of each project, and for assigning acredit rating (CR) at defined stages in the project approval process. The CR, the investment size, the product type and other project-related risks determine the authority level required for the approval of each transaction. All projects are subject to independent creditassessment by a credit officer within the independent Risk and Financial Sustainability Vice Presidency and who participates in the projectapproval process. Projects are approved with reference to a number of operational and prudential limits approved by the Corporate RiskCommittee, including limits related to single project or client exposure, single country exposure, and sector concentration; these are detailedbelow:
• IFC’s total exposure to a country, for the purpose of setting exposure limits, is measured as the amount of economic capitalrequired to support its investment portfolio in that country. Exposure limits are set for each country based on the size of its economyand its risk rating. Sub-limits apply for certain sector exposures within a country.
• IFC’s total exposure to a single client or client group may not exceed stipulated economic capital and nominal limits based onthe Credit Rating for the client.
• Individual Investment Limits are applied at the individual project or client level to prevent excessive concentrations.
• Preferential debt exposure to a country is limited by reference to that country’s total medium and long-term external debt.
• IFC’s total equity and quasi-equity exposure (outstanding exposure net of impairments) shall not exceed IFC’s net worth.
IFC’s investment projects are actively supervised after commitment. CRs are reviewed regularly for each project, with frequency dependingon the level of Credit Rating assigned, and revised if new material information is received. In addition, an independent risk managementteam in the Risk & Finance Vice Presidency regularly assesses IFC’s portfolio, including stress testing of exposure to emerging risks.Additionally, the Corporate Portfolio Management Department, as part of the Chief Operating Officer's (COO) Vice Presidency, regularlyreports to the Operations Committee on the performance of the overall debt and equity portfolio, and performs deep dives on selected topcountry and sector exposures. When projects show signs of financial distress, immediate attention is key for improving potential outcomes.Seasoned “workout” professionals from IFC’s Department of Special Operations in the Risk & Finance Vice Presidency focus on projects,to implement the restructuring, or possible recovery, of IFC’s exposure.
The credit risk of loans is quantified in terms of the probability of default, loss given default and exposure at risk. These risk parametersare used to determine risk-based economic capital for capital adequacy, capital allocation and internal risk management purposes, as wellas for setting the general reserve against losses on loans and exposure limits.
TREASURY OPERATIONS
IFC manages its exposures to investments and counterparties in its Treasury operations to mitigate potential losses from the failure by acounterparty to fulfill its contractual obligations. Counterparty eligibility criteria are set by Authorizations from the Board of Directors andby Directives approved by IFC’s Corporate Risk Committee. Eligible investments and counterparties are predominantly banks and financialinstitutions with high quality credit ratings issued by leading international credit rating agencies.
Details of applicable financial policies and guidelines are given below:
• Counterparties are selected based on standard eligibility criteria, with a tenor limit for deposits and repurchase agreements.
• Counterparties for derivative instruments are generally restricted to banks and financial institutions with high quality credit ratingsfrom leading international credit rating agencies; for the sole purpose of funding local currency loans, eligibility is extended tocentral banks and select local banks.
• Exposures to individual counterparties are subject to exposure limits.
• IFC signs collateral agreements with counterparties that require the posting of collateral when net mark-to-market exposuresexceed certain predetermined thresholds.
• For exchange-traded instruments, credit risk is limited by restricting transactions to a list of authorized exchanges, contracts anddealers.
INTERNATIONAL FINANCE CORPORATION Page 28
Management’s Discussion and Analysis

FY20 CREDIT RISK COMMENTARY
INVESTMENT OPERATIONS
Selected indicators of credit risk exposure in IFC’s loan portfolio, together with the five-year trend of non-performing loans (NPLs), aregiven below:
Table 12: IFC Loan Portfolio Credit Risk Indicators
INDICATOR June 30, 2020 June 30, 2019 ChangeNPLs as % of the loan portfolio 5.5% 4.3% Up 1.2%Principal amount outstanding on NPLs $1,770 million $1,331 million Up $439 millionTotal reserves against losses on loans $1,648 million $1,191 million Up $457 millionTotal reserves against losses on loans as % ofdisbursed loan portfolio 6.3% 4.7% Up 1.6%Total reserves against losses on guarantees $29 million $25 million Up $4 million
Figure 7: NPLs as Percentage of Disbursed Loan Portfolio
$ millions % of disbursed loans
1,8001,6001,4001,2001,000
800600400200
0
$m
illio
ns
7.06.05.04.03.02.01.00.0
%of
disb
urse
dlo
ans
FY16FY17
FY18FY19
FY20
Additional details are provided in Section VII – Results of Operations (Provision for Losses on Loans, Guarantees, Accrued Interest andOther Receivables).
TREASURY OPERATIONS
Treasury operations counterparties remain well diversified by sector and geography. In accordance with its agreements with counterparties,at June 30, 2020, IFC held $597 million in cash and $24 million in securities as collateral for changes in mark-to-market exposures onopen trades ($178 million in cash and $162 million in securities – June 30, 2019).
MARKET RISK MANAGEMENT
DEFINITION AND SCOPE OF MARKET RISK
Market risk is the risk of losses in positions arising from movements in market prices. IFC’s exposure to market risk is mitigated by itsmatched funding policy, whereby it uses derivative instruments to convert loans funded from market borrowings, and the market borrowingsthemselves, into floating rate US dollar assets and liabilities with similar duration. Similarly, market risk resulting from derivative transactionswith clients, to facilitate clients’ risk management, is typically mitigated by entering into offsetting positions with highly rated marketcounterparties. IFC’s exposure to unhedged market risk arises primarily from its listed and unlisted equity investments in emerging markets,its quasi-equity loans, and its Treasury liquid asset portfolio.
EQUITY INVESTMENTS
The risk of loss in value of IFC’s emerging markets equity investments is mitigated primarily by applying the same limits framework, decisionmaking process and portfolio management methods as described above for its lending operations. IFC has a multi-year horizon for itsequity investments and accepts short term price volatility of these investments, which can be significant.
INTERNATIONAL FINANCE CORPORATION Page 29
Management’s Discussion and Analysis

LIQUID ASSET PORTFOLIOS
Market risk in IFC’s liquid assets portfolios is managed according to the risk appetite chosen by IFC Management using derivative andother financial instruments such as over-the-counter foreign exchange forward agreements, interest rate and currency swaps, andexchange-traded interest rate futures and options. Overall market risk exposure is also subject to daily monitoring, based on Directivesapproved by the Corporate Risk Committee, which limit interest rate, credit spread, and foreign exchange risk.
ASSET-LIABILITY MANAGEMENT
While IFC’s matched-funding policy helps mitigate currency and interest rate risk, IFC is still exposed to residual market risks in the marketborrowings-funded portion of the balance sheet. Residual currency risk arises from factors such as changes in the level of reserves forlosses on non-US dollar loans. The aggregate position in each lending currency is monitored and the risk is managed to within the limitestablished for each currency. Residual interest rate risk may arise from differing interest rate reset dates on assets and liabilities or fromassets that may become mismatched with hedges over time due to write-downs, prepayments, or rescheduling. The residual interest raterisk is managed by measuring the sensitivity of the present value of assets and liabilities in each currency to a one basis point change ininterest rates and managing exposures to within the established limits.
FY20 MARKET RISK COMMENTARY
Although COVID-19 required resources to be promptly diverted towards dealing with the pandemic’s impact on our clients, portfolio andprivate sector partners, adequate time and effort continued to be allocated towards LIBOR transition preparedness. After a very thoroughimpact and financial planning study, IFC laid the foundation for the LIBOR transition implementation by mobilizing all relevant departmentswithin organization, establishing a strong governance structure, setting up relevant working groups, appropriating budget, startingawareness/information/training campaigns and identifying key risks. In addition, proper fallback language has been developed for use inIFC's syndications and multi-lender loans, as well as for LIBOR-related provisions in USD fixed-rate loans, local currency loans, hybridloans and client risk management (swap) transactions.
LIQUID ASSET PORTFOLIOS
IFC’s liquid asset portfolios have short-tenor benchmarks and deviations from those benchmarks are typically small. FY20 saw increasedvolatility in US Treasuries, but this was partially offset by lower credit spread exposure. In addition, the liquid asset portfolios reduced riskexposure to more capital-intensive sectors such as securitized products and increased risk exposure to less capital-intensive sectors.Interest rate, foreign exchange, and credit spread risks were controlled on a daily basis using a system of limits monitored to ensureongoing compliance during FY20.
EQUITY INVESTMENTS
Equity markets experienced a highly unusual 12 months. World markets reached record highs in February, followed by a sharp selloff ofmore than 30% in both emerging and developed markets as the pandemic swept the globe and closed down economies, and marketsbottomed out in the second half of March. Unprecedented monetary and fiscal stimulus then led to a sharp market rebound during the lastquarter of FY20, and at the end of the fiscal year, emerging markets (MSCI Emerging Market Index) had declined 3% over the 12-monthperiod and US markets (S&P500) were up 5%. The market recoveries were in stark contrast to the underlying economic performance asthe world economy saw a severe contraction and with an uncertain outlook. Oil prices (WTI) tumbled from $58/barrel at the beginning ofthe year, then experienced negative prices in April, and ended the year at $39/barrel. Gold prices rose 25% from $1,410/oz to $1,764/oz,and the US dollar strengthened 13% versus a basket of emerging market currencies (the JP Morgan Emerging Market Currency Index),as investors sought safe havens. A broader basket of commodities (Bloomberg Commodity Index) fell 20% over the year. Active managementled the Corporation to a very active sales program when markets rose and peaked in the earlier part of fiscal year while the market correctionand declining equity fair values led to lower sales in the last quarter of FY20. IFC continues to focus on strategic and highly selectiveadditions on the new business front, as well as active management of its equity portfolio with the rigorous analysis of macroeconomictrends informing management decision making throughout the project lifecycle.
LIQUIDITY RISK MANAGEMENT
IFC defines liquidity risk as the risk of a financial loss arising from the inability to liquidate financial assets or to raise additional funds inthe expected time frame to meet contractual obligations. IFC faces liquidity risk in its core development finance activities because itsinvestments are predominantly illiquid in nature due to the lack of capital flows, the infrequency of transactions, and the lack of pricetransparency in many emerging markets. To offset this risk, IFC maintains appropriate liquid asset portfolios funded from its net worth andmarket borrowings.
LIQUID ASSET PORTFOLIOS
Liquidity risk in the liquid asset portfolios is addressed by strict eligibility criteria defined in Directives approved by the Corporate RiskCommittee. Examples include minimum issuance sizes required for bond investments, limits on single bond issue concentration and limitson the percentage of total bond issuance held by IFC. Consequently, a significant portion of the liquid asset portfolio is invested in highlyliquid securities such as high-quality sovereign, sovereign-guaranteed, and supranational fixed income instruments. IFC expects to continueto be able to realize these assets as needed to meet its cash requirements, even in a liquidity crisis.
INTERNATIONAL FINANCE CORPORATION Page 30
Management’s Discussion and Analysis
FUNDING
IFC’s funding operations ensure that IFC has the funds it needs for its lending operations, and that it has sufficient liquidity to safeguardits triple-A rating and fulfill IFC’s counter-cyclical role. IFC is able to access a variety of funding markets, including the US dollar market,Pounds sterling market and the Australian dollar market as well as private placement and retail markets. IFC’s discount note programcomplements IFC's traditional funding sources by providing swift access to funded liquidity. IFC’s triple-A rating is critical to the Corporation’sability to maintain its low cost of funds. Regular issuance in a variety of markets serves to sustain investor confidence and maintain adiversified investor base.
FY20 LIQUIDITY RISK COMMENTARY
On June 30, 2020, IFC’s liquid asset portfolios totaled $40.8 billion (June 30, 2019 - $39.7 billion). The Corporation’s overall liquiditycoverage ratio as a percentage of next three years’ estimated net cash needs stood at 96%, above the minimum requirement of 45%.During FY20, IFC raised $14.6 billion in market borrowings, net of derivatives (FY19 - $15.5 billion). The outstanding balance under theShort-term Discount Note Program at June 30, 2020 was $3.0 billion (June 30, 2019 - $2.2 billion). In FY20, IFC’s funding costs vs USdollar 6 month LIBOR increased when compared with FY19 consistent with higher funding spreads for other AAA MDB issuers in thecapital markets.
OPERATIONAL RISK MANAGEMENT
Consistent with the Basel Framework, IFC defines operational risk as the risk of loss resulting from inadequate or failed internal processes,people and systems, or from external events and holds economic capital against such risks. Given IFC’s business model, both financialand non-financial potential impacts are considered in assessment of risks.
IFC’s Operational Risk Management (ORM) program conforms to a Directive approved by the Corporate Risk Committee (CRC), whichdefines the management of, and roles and responsibilities for, operational risk management in the Corporation. IFC’s ORM approach isdesigned to ensure that operational risks are identified, assessed, and managed to enable senior management to determine which risksIFC will accept, mitigate or transfer. IFC seeks to manage key risks by maintaining a comprehensive set of business processes and internalcontrols.
IFC utilizes risk transfer mechanisms, including insurance, at both the project and the institutional levels for mitigation of low probability/frequency and high impact operational risks. IFC identifies and evaluates operational risks from a standard likelihood-potential impactapproach, determines available contractual transfer and insurance options to bring residual risk within tolerance, implements therecommended/approved structuring of that risk, and tracks its effectiveness over time. IFC insures its corporate assets and operationsagainst catastrophic losses where commercially viable.
FY20 OPERATIONAL RISK COMMENTARY
IFC continues to develop and implement enhanced methodologies to identify, assess, mitigate, and monitor material operational risks inits key activities. The main ORM tools that IFC utilizes include Risk and Control Self-Assessments (RCSA), recording and analysis ofoperational risk events, and monitoring of Key Risk Indicators (KRIs).
IFC identifies, assesses, and monitors operational risks across the following key value chains/business functions, also known as operationalrisk areas: Debt, Equity, Treasury, Advisory Services, Third Party Responsibilities, Business Support Functions, Corporate Functions, andShared Services. On a quarterly basis, IFC’s corporate ORM function provides a consolidated ORM report to the CRC and a summarizedversion to the Audit Committee. IFC also continues to focus on its preparedness to react to significant events that could disrupt its normaloperations through the Business Continuity Management program, which covers critical business processes across all IFC offices.
IFC’s operations rely on the secure processing, storage and transmission of confidential and other information in computer systems andnetworks. As is the case for financial institutions generally, IFC’s cybersecurity risk has increased over the years due to the changing needsof its business and evolving sophistication of the threat landscape. These risks are unavoidable and WBG seeks to manage them on acost-effective basis within targeted levels consistent with the organization’s risk appetite.
To protect the security of its computer systems, software, networks and other technology assets, WBG has adopted a multi-layered approachto cybersecurity risk management to help detect malicious activities, both from within the organization and from external sources. Inmanaging emerging cyber threats, WBG regularly reviews and adapts its technical and process-level controls, and raises the level of userawareness to mitigate the risks. On a periodic basis, WBG also assesses the maturity and effectiveness of its cybersecurity defenses andstrives to incorporate industry standard risk mitigation techniques, including but not limited to, targeted testing, internal and external audits,incident response tabletop exercises, and industry benchmarking.
BUSINESS RISK MANAGEMENT
DEFINITION AND SCOPE OF BUSINESS RISK
Business risk is risk that is specific to IFC given its mission and strategy and that is not covered by other risk dimensions. It has the followingcomponents, which are described in the paragraphs below together with the specific risk mitigation measures that are adopted: environmentand social; corporate governance; integrity; anti-money laundering and combating the financing of terrorism (AML/CFT); use of offshore
INTERNATIONAL FINANCE CORPORATION Page 31
Management’s Discussion and Analysis
financial centers (OFCs); management of operational conflict of interest; data privacy and data access management; risks associatedwith external financing and mobilization activities; and management of relevant policies and procedures.
ENVIRONMENT AND SOCIAL RISK
Environment and social (E&S) risk is the risk that IFC does not effectively engage and influence clients to fulfill the requirements of thePerformance Standards on Environmental and Social Sustainability, potentially causing harm to people or the environment. ThePerformance Standards form part of IFC’s Sustainability Framework, articulating the Corporation's strategic commitment to sustainabledevelopment:
• The Performance Standards guide clients on sustainable business practices, including continually identifying and managing risksthrough analytical work such as environmental and social assessments; stakeholder engagement; and client disclosure obligationsin relation to project-level activities.
• The Policy on Environmental and Social Sustainability describes IFC's commitments, roles and responsibilities in relation toenvironmental and social sustainability.
• IFC's Access to Information Policy reflects the Corporation’s commitment to transparency and good governance and outlinesinstitutional disclosure obligations.
IFC uses the Sustainability Framework along with other strategies, policies and initiatives to focus business activities on achieving theCorporation’s development objectives. All project teams are required to record expectations of development outcomes with time-boundtargets using standard indicators. These indicators are tracked, and performance is rated on an annual basis for the duration of everyproject.
Figure 8 on page 34 shows the historic Environmental and Social Risk Rating (ESRR) distribution by fiscal year. This distribution depictsa broad E&S risk profile of IFC's portfolio. There was a measurable improvement in the last five fiscal years.
CLIENT CORPORATE GOVERNANCE RISK
Corporate governance risk is the risk that IFC’s clients have inefficient or ineffective corporate governance practices, leading to adversereputational or financial impact on IFC. IFC manages corporate governance risk primarily by conducting a structured evaluation of everynew investment project, covering the following five areas:
• Effectiveness of the Board of Directors;
• Sufficiency of internal controls, audit, risk management and compliance governance;
• Adequacy of financial and non-financial disclosures;
• Adequacy of shareholders’ rights; and
• Demonstration of the client’s commitment to implement high quality corporate governance policies and practices.
The findings from these assessments are considered in the decision on whether to proceed with the project.
INTEGRITY RISK
Integrity risk is the risk of engaging with external institutions or persons whose background or activities may have adverse reputationaland/or financial impact on IFC. IFC works with a wide range of partners in both Investment Operations and Advisory Services, frommulti‑national to small companies, and from government institutions to non-governmental organizations. Thus, each transaction or serviceopportunity presents unique integrity risks, affected by different factors, including the type of engagement, financial instrument, structure,and duration of the engagement. IFC has developed procedures for conducting Integrity Due Diligence and these are used to:
• Uncover integrity risk issues related to a prospective project or engagement and the institutions and persons involved;
• Evaluate and assess integrity risks, including deciding on how to mitigate and whether to accept the risks, and determining nextsteps, which may include escalation to IFC senior management and Board approval;
• Appropriately classify integrity risks; and
• Monitor integrity risks throughout the life of the project or engagement.
IFC conducts AML/CFT due diligence on financial institution clients to determine whether the client has arrangements to seek to ensurethat:
• Client AML/CFT procedures and controls are in compliance with relevant national AML/CFT laws and regulations;
• AML/CFT procedures and controls are appropriate for the client’s business and operating environments; and
• Implementation of the client’s AML/CFT controls is effective.
INTERNATIONAL FINANCE CORPORATION Page 32
Management’s Discussion and Analysis
IFC is required to have “due regard” for sanctions adopted by the UN Security Council. As such, IFC has developed a screening processdesigned to prevent IFC from entering into business relationships with entities or individuals sanctioned by the UN and also generallyrequires its business partners not to violate UN sanctions or conduct certain types of business related to IFC financings, with UN sanctionedentities and persons. As an international organization, IFC is not required to comply with the national sanctions regimes of individualmember countries. However, as part of its overall risk assessment of a specific transaction, IFC screens relevant parties for risks that mayarise from various national sanctions regimes.
IFC has also developed procedures for analyzing the use of OFCs by clients and sponsors by:
• Determining whether an OFC is eligible to serve as an intermediary jurisdiction for a project by referencing the Global Forum’spublished peer reviews (which provides a broad international perspective); and
• Requiring the client to provide information to support the determination that the project’s corporate structure is legitimate and hasnot been designed for tax evasion/abuse or other illegitimate purposes.
OPERATIONAL CONFLICT OF INTEREST RISK
Operational conflicts of interest can arise when IFC acts in the interests of more than one party (including IFC’s self-interest), where theinterests of those parties might be, or might be perceived to be, inconsistent. Given the nature and scope of products and services thatIFC provides to its clients in furtherance of its development mandate, including engaging Upstream, and the different roles played by otherWBG entities, actual or perceived operational conflicts of interest can arise in the normal course of its activities. IFC recognizes thatadverse legal, reputational, client relationship and other implications may arise if such conflicts are not managed. IFC hasimplemented policies and procedures to manage these risks.
DATA PRIVACY AND DATA ACCESS MANAGEMENT RISK
With the growing importance of data to its clients, partners and vendors as well as to IFC’s business operations generally, IFC is buildingout its controls and protections in the area of data privacy and data access management. For the protection of personal data, IFC hasadopted a data privacy policy reflecting global practices and is progressively rolling out appropriate procedural and technical safeguards.On data access management, IFC is developing enhanced guidance for staff on its information classification and control framework.
EXTERNAL FINANCING AND MOBILIZATION RISK
As well as using its own resources to invest in and provide advice to clients, IFC raises additional funds from public and private sectorinstitutional investors, lenders and donors through several different mechanisms. External financing risk is the risk that when entrustedwith oversight of such funds, IFC does not meet its contractual obligations to the third parties involved.
To mitigate this risk, IFC works within agreed frameworks which establish IFC's responsibilities and obligations with respect to the thirdparties. For example, where financing to clients is mobilized through B Loans or MCPP, the specialized Syndications Department followsdefined processes to identify co-financiers, advise on structuring, and monitor compliance with investment agreements. In some cases,financing from third parties, including donors, is administered through trust funds. IFC follows predefined procedures for clearing all IFCtrust fund proposals and agreements and overseeing IFC's trust fund portfolio. Finally, AMC has an independent governance process tomake decisions for the benefit of common investors in AMC-managed funds and AMC compliance matters are subject to oversight by theBusiness Risk and Compliance Department (CBR).
INTERNATIONAL FINANCE CORPORATION Page 33
Management’s Discussion and Analysis

FY20 ENVIRONMENTAL & SOCIAL RISKS COMMENTARY
Focused supervision efforts in the last four fiscal years have improved the E&S risk profile of IFC’s investment portfolio by reducing thenumber of poorly performing projects, defined as a historical ESRR of 3 and 4. The ESRR evaluates a client’s management of E&S risksand avoidance and control of adverse outcomes.
Figure 8: ESRR Distribution FY13-FY20
1 2 3 4
90%
80%
70%
60%
50%
40%
30%
20%
10%
0%
FY13 FY14 FY15 FY16 FY17 FY18 FY19 FY20
10%8% 7% 7% 6% 6% 6%
4%
67% 68%71%
74%76%
78% 79%82%
20% 21% 20%17% 16% 15% 14% 13%
3% 3% 2% 2% 2% 1% 1% 1%
ESRR distribution scale: 1) Excellent, 2) Satisfactory, 3) Partly Unsatisfactory, 4) Unsatisfactory. The score is calculated at appraisal as abaseline, and is then updated after each supervision activity.
INTERNATIONAL FINANCE CORPORATION Page 34
Management’s Discussion and Analysis
VI. CRITICAL ACCOUNTING POLICIES
IFC’s significant accounting policies, as well as estimates made by Management, are integral to its financial reporting. While all of thesepolicies require a certain level of judgment and estimates, significant policies require Management to make highly difficult, complex, andsubjective judgments as these relate to matters inherently uncertain and susceptible to change. Note A to IFC’s FY20 consolidated financialstatements contain a summary of IFC’s significant accounting policies, including a discussion of recently adopted accounting standardsand accounting and financial reporting developments. Certain of these policies are considered to be “critical” to the portrayal of IFC’sfinancial condition and results of operations, since they require management to make difficult, complex or subjective judgments, some ofwhich may relate to matters that are inherently uncertain.
These policies include:
• Determining the fair value of equity investments, debt securities, loans, liquid assets, borrowings and derivatives, which have noquoted market prices and are accounted for at fair value;
• Determining the level of reserves against losses in the loan portfolio;
• Determining the level and nature of impairment for debt securities carried at fair value with changes in fair value being reportedin other comprehensive income (OCI); and
• Determining the future pension and postretirement benefit costs and obligations using actuarial assumptions based on financialmarket interest rates, past experience, and management’s best estimate of future benefit cost changes and economic conditions.
Many of IFC’s financial instruments are classified in accordance with the fair value hierarchy established by accounting standards for fairvalue measurements and disclosures where the fair value and/or impairment is estimated based on internally developed models ormethodologies utilizing significant inputs that are non-observable.

VALUATION OF FINANCIAL INSTRUMENTS WITH NO QUOTED MARKET PRICES
IFC reports at fair value all of its derivative instruments, liquid asset trading securities, equity investments, investments in debt securitiesand certain borrowings, and loans. In addition, various investment agreements contain embedded or stand-alone derivatives that, foraccounting purposes, are separately accounted as either derivative assets or liabilities. IFC classifies all financial instruments accountedfor at fair value based on the fair value hierarchy established by accounting standards for fair value measurements and disclosures asdescribed in more detail in Notes A and R to IFC’s FY20 consolidated financial statements.
Effective July 1, 2018, upon the adoption of ASU 2016-01, the change in fair value of borrowings carried at fair value resulting from changesin instrument-specific credit risk is reported in OCI, while the remaining change in fair value is reported in Net Income.
Many of IFC’s financial instruments accounted for at fair value are valued based on unadjusted quoted market prices or using modelswhere the significant assumptions and inputs are market-observable. The fair values of financial instruments valued using models wherethe significant assumptions and inputs are not market-observable are generally estimated using complex pricing models of the net presentvalue of estimated future cash flows. Management makes numerous assumptions in developing pricing models, including an assessmentabout the counterparty’s financial position and prospects, the appropriate discount rates, interest rates, and related volatility and expectedmovement in foreign currency exchange rates. Changes in assumptions could have a significant impact on the amounts reported as assetsand liabilities and the related unrealized gains and losses reported in the income statement and OCI. The fair value computations affectboth the Investment services and Treasury segments of IFC (see Note S to the FY20 consolidated financial statements for further discussionof IFC’s business segments).
RESERVE AGAINST LOSSES ON LOANS
IFC considers a loan as impaired when, based on current information and events, it is probable that IFC will be unable to collect all amountsdue according to the loan’s contractual terms. Reserves against losses are established through a review of individual loans undertakenon a quarterly basis. Information and events, with respect to the borrower and/or the economic and political environment in which it operates,considered in determining that a loan is impaired include, but are not limited to, the borrower’s financial difficulties, breach of contract,bankruptcy/reorganization, credit rating downgrade as well as geopolitical conflict, financial/economic crisis, commodity price decline,adverse local government action and natural disaster. The reserve against losses for loans also includes an estimate of probable losseson loans inherent in the portfolio but not specifically identifiable. Unidentified probable losses are the losses incurred at the reporting datethat have not yet been specifically identified. The risks inherent in the portfolio that are considered in determining unidentified probablelosses are those proven to exist by past experience and include: country systemic risk; the risk of correlation or contagion of losses betweenmarkets; uninsured and uninsurable risks; nonperformance under guarantees and support agreements; and opacity of, or misrepresentationin, financial statements. The reserve against losses on loans is established through periodic charges to income in the form of a provisionfor losses on loans. Loans written off, as well as any subsequent recoveries, are recorded through the reserve.
The reserve against losses on loans is separately reported in the consolidated balance sheet as a reduction of IFC’s total loans. Increasesor decreases in the reserve level are reported in the income statement as provision for losses or release of provision for losses on loans,and guarantees. The reserve against losses on loans relates only to the Investment services segment of IFC (see Note S to the FY20consolidated financial statements for further discussion of IFC’s business segments).
OTHER-THAN-TEMPORARY IMPAIRMENTS ON DEBT SECURITIES
IFC assesses all debt security investments accounted for at fair value through OCI for impairment each quarter. When impairment isidentified, the entire impairment is recognized in net income if certain conditions are met (as detailed in Note A to IFC’s FY20 consolidatedfinancial statements). However, if IFC does not intend to sell the debt security and it is not more likely than not that IFC will be required tosell the security, but the security has suffered a credit loss, the credit-related impairment loss is recognized in net income and the non‑creditrelated loss is recognized in OCI.
PENSION AND OTHER POSTRETIREMENT BENEFITS
IFC participates, along with IBRD and MIGA, in pension and postretirement benefit plans that cover substantially all of their staff members.The underlying actuarial assumptions used to determine the projected benefit obligations, accumulated benefit obligations, and the fundedstatus associated with these plans are based on financial market interest rates, past experience, and management’s best estimate offuture benefit cost changes and economic conditions. All costs, assets and liabilities associated with the plans are allocated between IBRD,IFC and MIGA based upon their employees’ respective participation in the plans. IFC reimburses IBRD for their proportionate share of anycontributions made to these plans by IBRD. Contributions to the plans are calculated as a percentage of salary. For further details, pleaserefer to Note V to the FY20 consolidated financial statements.
INTERNATIONAL FINANCE CORPORATION Page 35
Management’s Discussion and Analysis

VII. RESULTS OF OPERATIONS
OVERVIEW
The overall market environment has a significant influence on IFC’s financial performance. The main elements of IFC’s net income andcomprehensive income and influences on the level and variability of net income and comprehensive income from year to year are:
Table 13: Main Elements of Net Income and Comprehensive Income
ELEMENTS SIGNIFICANT INFLUENCES
Net income:
Yield on interest earningassets
Market conditions including spread levels and degree of competition. Nonaccruals and recoveries ofinterest on loans formerly in nonaccrual status and income from participation notes on individual loansare also included in income from loans.
Liquid asset income Realized and unrealized gains and losses on the liquid asset portfolios, in particular the portion ofthe liquid assets portfolio funded by net worth, which are driven by external factors such as: the interestrate environment and liquidity of certain asset classes within the liquid asset portfolio.
Income from the equityinvestment portfolio
Global climate for emerging markets equities, fluctuations in currency and commodity markets andcompany-specific performance for equity investments. Overall performance of the equity portfolio.
Provisions for losses onloans and guarantees
Risk assessment of borrowers, probability of default, loss given default and loss emergence period.
Other income and expenses Level of advisory services provided by IFC to its clients, the level of expense from the staff retirementand other benefits plans, and the approved and actual administrative expenses and other budgetresources.
Gains and losses on othernon-trading financialinstruments accounted for atfair value
Principally, differences between changes in fair values of borrowings, excluding IFC’s credit spread(beginning in FY19, changes attributable to IFC’s credit spread are reported in other comprehensiveincome, prior to FY19, such changes were reported in net income) and associated derivativeinstruments and unrealized gains or losses associated with the investment portfolio including puts,warrants and stock options which in part are dependent on the global climate for emerging markets.These securities may be valued using internally developed models or methodologies utilizing inputsthat may be observable or non-observable.
Grants to IDA Level of the Board of Governors-approved grants to IDA.Other comprehensiveincome:Unrealized gains and losseson debt securities accountedfor as available-for-sale
Global climate for emerging markets, fluctuations in currency and commodity markets and company-specific performance and consideration of the extent to which unrealized losses are considered otherthan temporary. Debt securities may be valued using internally developed models or methodologiesutilizing inputs that may be observable or non-observable.
Unrealized gains and lossesattributable to instrument-specific credit risk onborrowings at fair valueunder the fair value option
Fluctuations in IFC’s own credit spread measured against US dollar LIBOR resulting from changesover time in market pricing of credit risk. As credit spreads widen, unrealized gains are recorded andwhen credit spreads narrow, unrealized losses are recorded.
Unrecognized net actuarialgains and losses andunrecognized prior servicecosts on benefit plans
Returns on pension plan assets and the key assumptions that underlay projected benefit obligations,including financial market interest rates, staff expenses, past experience, and management’s bestestimate of future benefit cost changes and economic conditions.
INTERNATIONAL FINANCE CORPORATION Page 36
Management’s Discussion and Analysis

IFC’s net income (loss) for each of the past five fiscal years ended June 30, 2020 is presented below (US$ millions):
Figure 9: IFC's Net Income (Loss), Fiscal Years 2016-2020
1,5001,200
900600300
0-300-600-900
-1,200-1,500-1,800
US$
mill
ions
2016 2017 2018 2019 2020
Fiscal year ended June 30,
The adoption of ASU 2016-01 impacted the comparability of IFC’s financial results between FY19 and FY18. The table below shows theadjustments to FY18 previously reported results had ASU 2016-01 been applied in FY18. The adjustments to (loss) income from equityinvestments and associated derivatives represent: 1) $610 million of lower realized gains, due to the change in the cost basis of equityinvestments from initial cash cost less write-downs to initial cash cost, 2) the removal of equity impairments of $446 million as all equityinvestments are now recorded at fair value through the consolidated statement of operations, and 3) the addition of net unrealized gainsof $322 million on equity investments previously accounted for at cost less impairment or available for sale. The $278 million adjustmentto net unrealized (losses) gains on non-trading financial instruments accounted for at fair value represents the unrealized loss on theinstrument-specific credit component of market borrowings that is now reported in the consolidated statement of comprehensive income.See Note A to the FY20 consolidated financial statements for additional details.
For the Year ended June 30,2019 As
Reported
2018 on aComparable
BasisPro-forma
Adjustments2018 As
Reported
(Loss) income from equity investments and associated derivatives $ (253) $ 1,011 $ 158 $ 853Net unrealized (losses) gains on non-trading financial instruments
accounted for at fair value (218) 366 278 88
Net Income $ 93 $ 1,716 $ 436 $ 1,280
INTERNATIONAL FINANCE CORPORATION Page 37
Management’s Discussion and Analysis
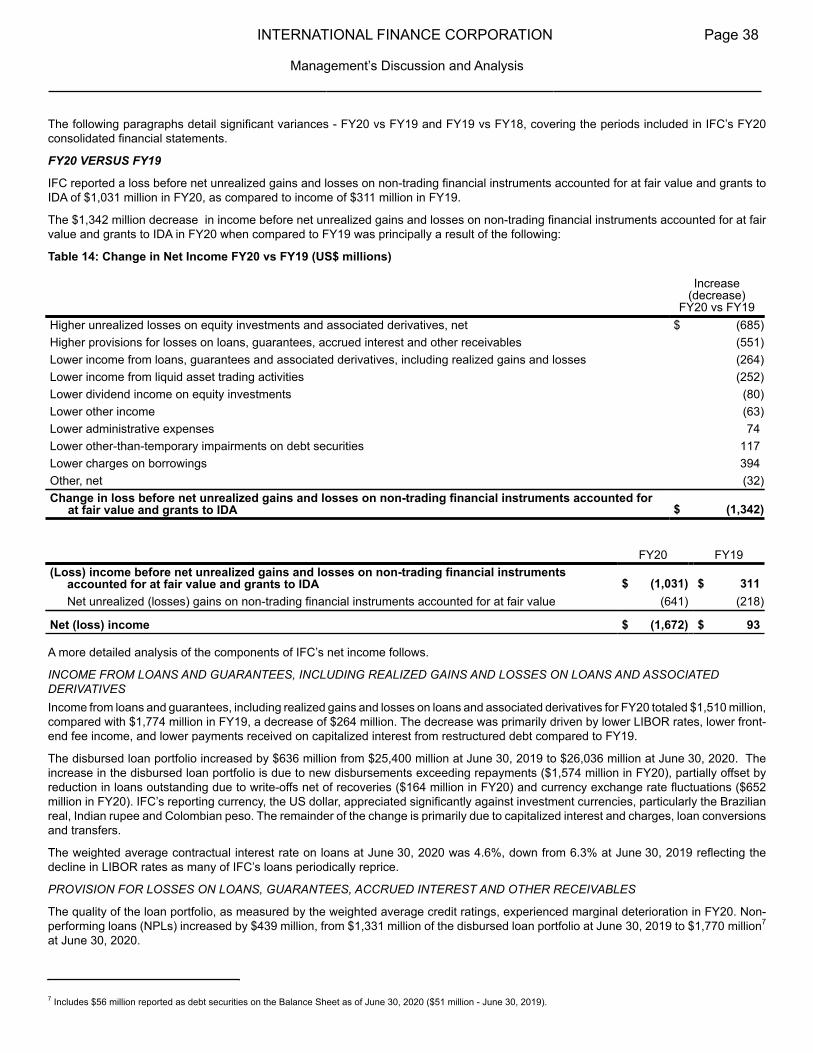
The following paragraphs detail significant variances - FY20 vs FY19 and FY19 vs FY18, covering the periods included in IFC’s FY20consolidated financial statements.
FY20 VERSUS FY19
IFC reported a loss before net unrealized gains and losses on non-trading financial instruments accounted for at fair value and grants toIDA of $1,031 million in FY20, as compared to income of $311 million in FY19.
The $1,342 million decrease in income before net unrealized gains and losses on non-trading financial instruments accounted for at fairvalue and grants to IDA in FY20 when compared to FY19 was principally a result of the following:
Table 14: Change in Net Income FY20 vs FY19 (US$ millions)
Increase(decrease)
FY20 vs FY19Higher unrealized losses on equity investments and associated derivatives, net $ (685)Higher provisions for losses on loans, guarantees, accrued interest and other receivables (551)Lower income from loans, guarantees and associated derivatives, including realized gains and losses (264)Lower income from liquid asset trading activities (252)Lower dividend income on equity investments (80)Lower other income (63)Lower administrative expenses 74Lower other-than-temporary impairments on debt securities 117Lower charges on borrowings 394Other, net (32)Change in loss before net unrealized gains and losses on non-trading financial instruments accounted for
at fair value and grants to IDA $ (1,342)
FY20 FY19(Loss) income before net unrealized gains and losses on non-trading financial instruments
accounted for at fair value and grants to IDA $ (1,031) $ 311Net unrealized (losses) gains on non-trading financial instruments accounted for at fair value (641) (218)
Net (loss) income $ (1,672) $ 93
A more detailed analysis of the components of IFC’s net income follows.
INCOME FROM LOANS AND GUARANTEES, INCLUDING REALIZED GAINS AND LOSSES ON LOANS AND ASSOCIATEDDERIVATIVESIncome from loans and guarantees, including realized gains and losses on loans and associated derivatives for FY20 totaled $1,510 million,compared with $1,774 million in FY19, a decrease of $264 million. The decrease was primarily driven by lower LIBOR rates, lower front-end fee income, and lower payments received on capitalized interest from restructured debt compared to FY19.
The disbursed loan portfolio increased by $636 million from $25,400 million at June 30, 2019 to $26,036 million at June 30, 2020. Theincrease in the disbursed loan portfolio is due to new disbursements exceeding repayments ($1,574 million in FY20), partially offset byreduction in loans outstanding due to write-offs net of recoveries ($164 million in FY20) and currency exchange rate fluctuations ($652million in FY20). IFC’s reporting currency, the US dollar, appreciated significantly against investment currencies, particularly the Brazilianreal, Indian rupee and Colombian peso. The remainder of the change is primarily due to capitalized interest and charges, loan conversionsand transfers.
The weighted average contractual interest rate on loans at June 30, 2020 was 4.6%, down from 6.3% at June 30, 2019 reflecting thedecline in LIBOR rates as many of IFC’s loans periodically reprice.
PROVISION FOR LOSSES ON LOANS, GUARANTEES, ACCRUED INTEREST AND OTHER RECEIVABLES
The quality of the loan portfolio, as measured by the weighted average credit ratings, experienced marginal deterioration in FY20. Non-performing loans (NPLs) increased by $439 million, from $1,331 million of the disbursed loan portfolio at June 30, 2019 to $1,770 million7
at June 30, 2020.
INTERNATIONAL FINANCE CORPORATION Page 38
Management’s Discussion and Analysis
7 Includes $56 million reported as debt securities on the Balance Sheet as of June 30, 2020 ($51 million - June 30, 2019).

The increase was due to $873 million of loans and loan-like debt securities being placed in NPL status partially offset by write-offs, net ofrecoveries ($293 million), positive developments such as repayments and prepayments ($125 million) and other changes ($16 million), InFY20, 21 loans greater than $10 million, totaling $821 million, were placed in NPL status.
Figure 10: Non-Performing Loans
2,200
1,900
1,600
1,300
1,000
Jun 2019 Increase inNPL balance
Positivedevelopments
Net write-offs Others Jun 2020
1,331
873
(125)
(293) (16)
1,770
IFC recorded a net provision for losses on loans, guarantees, accrued interest and other receivables of $638 million in FY20 ($375 millionof specific provisions on loans, $252 million of portfolio provisions (general provisions) on loans, and $11 million net provision on guarantees,other receivables and accrued interest) as compared to a provision of $87 million in FY19 ($105 million of specific provisions on loans,$28 million of release of portfolio provisions on loans, and $10 million net provision on guarantees, other receivables and accrued interest).
Project-specific developments on ten loans comprised 60% of the specific provision for losses on loans in FY20 (not including release ofprovisions).
Total reserve against losses on loans increased by $457 million to $1,648 million at June 30, 2020 ($1,191 million at June 30, 2019)analyzed as follows.
Figure 11: Loan Loss Reserve
1,800
1,600
1,400
1,200
1,000
June 19 SpecificProvision
GeneralProvision
Write-offs
Reco-veries
Other Jun 30
1,191
375
252
(155)
3
(18)
1,648
At June 30, 2020, reserves against losses on loans totaled $1,648 million or 6.6% of the carrying value of loans at amortized cost ($1,191million; 4.9% at June 30, 2019), an increase of $457 million from June 30, 2019. The increase in reserves against losses on loans due toprovisions of $627 million was partially offset by write-offs, net of recoveries of $152 million, and foreign exchange gains related to reservesheld against non-U.S. dollar-denominated loans ($29 million), and other adjustments $11 million.
Reserves against losses as of June 30, 2020 reflects credit risk assessments as of that date. The assessment of level of reserves againstlosses also carried a heightened degree of uncertainty and judgment in incorporating the impact of COVID-19. In evaluating theappropriateness of IFC’s reserves against losses on loans at June 30, 2020, IFC has considered the impact of COVID-19 largely throughits rating system that classifies its loans according to credit worthiness and risk. In light of COVID-19, many of the credit risk ratings ofindividual loans deteriorated at June 30, 2020 when compared to June 30, 2019 reflecting general credit considerations and specificCOVID-19 related considerations. As a result, IFC has reported higher provisions for losses in the year ended June 30, 2020 whichincluded a qualitative overlay general provision of $63 million considered necessary to reflect the impact of COVID-19.
Specific reserves against losses on loans at June 30, 2020 of $804 million ($580 million at June 30, 2019) are held against impaired loansof $1,749 million ($1,240 million at June 30, 2019), a coverage ratio of 46% (47% at June 30, 2019).
INTERNATIONAL FINANCE CORPORATION Page 39
Management’s Discussion and Analysis

INCOME (LOSS) FROM EQUITY INVESTMENTS AND ASSOCIATED DERIVATIVESIncome from the equity investment portfolio, including associated derivatives, decreased by $814 million from $253 million of losses inFY19 to losses of $1,067 million in FY20.
IFC sells equity investments where IFC’s developmental role is complete, where pre-determined sales trigger levels have been met, andwhere applicable, lock ups have expired. Gains and losses on equity investments and associated derivatives comprise both realized andunrealized gains.
IFC recognized realized net gains on equity investments and associated derivatives in FY20 of $363 million, as compared to net gains of$425 million in FY19, a decrease of $62 million. Realized gains on equity investments and associated derivatives are concentrated in asmall number of investments. In FY20, there were twelve investments that generated individual realized capital gains in excess of $20million totaling $647 million, and seven investments that generated individual realized capital losses in excess of $20 million totaling $288million, or 99% of the FY20 net realized gains, compared to eight investments that generated individual realized capital gains in excessof $20 million totaling $430 million, and three investments that generated individual realized capital losses in excess of $20 million totaling$82 million, or 82% of FY19 net realized gains. Dividend income in FY20 totaled $158 million, as compared with $238 million in FY19.COVID-19 has had a significant negative impact on the valuation of IFC’s equity investment portfolio at June 30, 2020. Recognizing thereis a heightened degree of uncertainty and judgment in incorporating the impact of COVID-19, IFC has utilized, where available, comparator,sector and country information, in addition to discounted cash flow models, in valuing its equity investment portfolio at June 30, 2020.Valuations of equity investments at June 30, 2020 were significantly lower than as of June 30, 2019. Net unrealized losses on equityinvestments and associated derivatives were $1,603 million in FY20, reflecting the significant decline in valuations due to the impact ofCOVID-19 in FY20 Q3, which was followed by a partial recovery in FY20 Q4, compared to net unrealized losses of $918 million in FY19.
INCOME FROM DEBT SECURITIES AND REALIZED GAINS AND LOSSES ON DEBT SECURITIES AND ASSOCIATED DERIVATIVES
Income from debt securities and associated derivatives increased by $105 million from income of $126 million in FY19 to income of $231million in FY20. The increase was primarily due to lower other-than temporary impairments on debt securities in FY20 as compared toFY19. Other-than-temporary impairments on debt securities totaled $130 million in FY20 and were largely credit-related in specificinvestments. Other-than-temporary impairments of $247 million in FY19 included $238 million related to cumulative foreign exchangelosses from the significant currency depreciation in a country with a large debt security exposure deemed as other than temporary. Therewas also a decrease in interest income of $25 million in FY20 when compared with FY19, driven by lower LIBOR rates (after swaps),which was largely offset by higher realized gains ($19 million).
INCOME FROM LIQUID ASSET TRADING ACTIVITIES
The liquid assets portfolio, net of derivatives and securities lending activities, increased by $1.1 billion from $39.7 billion at June 30, 2019,to $40.8 billion at June 30, 2020. The increase in FY20 was primarily due to an increase of $1.5 billion in the Net Worth Funded portfoliowith contributions from net equity divestments and net income from investment operations and liquidity management. Funded liquiditydeclined by $0.4 billion due to a shortfall of net debt issuance, both short-term and long-term, relative to net disbursements to clients. Income, net of allocated funding costs, from liquid asset trading activities totaled $506 million in FY20 compared to $538 million in FY19,a decrease of $32 million.
Interest income in FY20 totaled $686 million, compared to $775 million in FY19. The portfolio of ABS and MBS experienced fair valuelosses totaling $31 million in FY20. Holdings in other products, including US Treasuries, global government bonds, high quality corporatebonds and derivatives generated $384 million of gains in FY20, resulting in net gains of $353 million (realized and unrealized). Thiscompares to net gains (realized and unrealized) of $516 million in FY19.
In FY20, the liquid assets portfolios outperformed their benchmarks by $35 million, down from an outperformance of $141 million in FY19.The COVID-19 crisis hit the world hard in the second half of FY20 prompting a flight-to-quality and an unprecedented policy response bycentral banks and governments, globally. While there was a substantial recovery during second half of the year, some mark-to-marketlosses were realized during this period of crisis to protect the long-term interests of the Corporation at a time of heightened uncertainty. Inaddition, the Corporation raised a large amount of precautionary-liquidity during the crisis that was held in short-term deposits and TreasuryBills at a time when there was a significant steepening of the money-market yield curve. Combined with a general preference in themanagement of liquid assets for deposits and securities with short maturities and short-reset periods for floating-rate and asset-swappedsecurities, this resulted in a considerable decrease in interest earned, net of charges on borrowings, which is indexed to 6 month LIBOR.
At June 30, 2020, and June 30, 2019, trading securities classified as Level 3 securities (those with predominantly unobservable inputsused to measure the fair value of the securities) were an insignificant population of total trading securities.
CHARGES ON BORROWINGSIFC’s charges on borrowings decreased by $394 million, from $1,575 million in FY19 (net of $1 million gain on extinguishment of borrowings)to $1,181 million in FY20 (net of $7 million gain on extinguishment of borrowings), due to lower LIBOR rates over the period compared tothe same period in FY19.
The weighted average cost of IFC’s borrowings outstanding from market sources, after the effects of borrowing-related derivatives, andexcluding short-term borrowings from market and other sources, was 1.1% at June 30, 2020, a decrease from 2.8% at June 30, 2019.
INTERNATIONAL FINANCE CORPORATION Page 40
Management’s Discussion and Analysis

The size of the borrowings portfolio (excluding short-term borrowings), net of borrowing-related derivatives and before unamortizeddiscounts, net, and fair value adjustments, was $53.5 billion at FY20, unchanged from FY19.
OTHER INCOME Other income of $559 million for FY20 was $63 million lower than $622 million in FY19 primarily due to a decrease of $13 million in FY20($35 million gains in FY20 Q4) from Post-Employment Benefit Plan assets driven by lower investment returns in equity strategy and theprivate equity portfolio and a decrease of $33 million in the income from consolidated entities mainly due to lower management fees. Themanagement fee is recorded as Service fees post merger on February 1, 2020 (as opposed to Other income before merger). Advisoryservices income decreased by $31 million due to significant slowdown in spend due to the COVID-19.
OTHER EXPENSESAdministrative expenses (the principal component of other expenses) decreased by $74 million from $1,355 million in FY19 to $1,281million in FY20 primarily due to a decrease in staff costs from reduced staff hiring, a decline in operational costs due to COVID-19, and adecrease in severance costs incurred during FY19 under the work force planning initiative. This was partially offset by an increase of $44million in pension service costs due to the increase in amortization of the actuarial loss from the lower discount rate at the end of FY19and the lower expected return on net assets. Administrative expenses include the grossing-up effect of certain revenues and expensesattributable to IFC’s reimbursable program.
Advisory services expenses decreased by $43 million from $355 million in FY19 to $312 million in FY20 due to a lower spending on theAdvisory Services program, as a result of COVID-19 restrictions.
FOREIGN CURRENCY TRANSACTION GAINS AND LOSSES ON NON-TRADING ACTIVITIESForeign currency transaction gains reported in net income in FY20 totaled $144 million (gains of $159 million - FY19). Foreign currencytransaction losses of $203 million in FY20 (losses of $125 million - FY19) on debt securities accounted for as available-for-sale are reportedin other comprehensive income, while foreign currency transaction gains and losses on the derivatives economically hedging such debtsecurities are reported in net income. IFC has recorded foreign exchange related losses of $59 million (gains of $34 million - FY19) in acombination of net income and other comprehensive income.
NET UNREALIZED GAINS AND LOSSES ON NON-TRADING FINANCIAL INSTRUMENTSIFC accounts for certain financial instruments at fair value with unrealized gains and losses on such financial instruments being reportedin net income, namely: (i) market borrowings with associated currency or interest rate swaps; (ii) unrealized gains and losses on certainloans, debt securities and associated derivatives; and (iii) borrowings from IDA.
Table 15: Net Unrealized Gains and Losses on Non-Trading Financial Instruments FY20 vs FY19 (US$ millions)
FY20 FY19Unrealized gains and losses on loans, debt securities and associated derivatives $ (423) $ (203)Unrealized gains and losses on borrowings from market, IDA and associated derivatives, net (218) (15)
Net unrealized gains and losses on non-trading financial instruments accounted for at fair value $ (641) $ (218)
IFC reported net unrealized losses on loans, debt securities and associated derivatives of $423 million in FY20 ($203 million losses inFY19).
In FY20 this comprised unrealized losses of $89 million on the loan and debt securities portfolio carried at fair value, unrealized losses of$223 million on lending-related swaps, unrealized losses of $120 million on client risk management swaps and unrealized gains of $9million on other derivatives, mainly conversion features, warrants in investment contracts and interest rate and currency swaps economicallyhedging client obligations. The unrealized losses of $223 million on lending related currency and interest rate swaps economically hedgingloans is generally due to COVID-19 crisis related monetary accommodation by central banks and is concentrated in interest rate swapshedging US$ fixed rate loans, where longer tenor US$ fixed rates fell sharply in the second half of FY20, and also in Turkish lira, IndianRupee, and the Brazilian real currency swap portfolios, where longer term swap discount rates during FY20 YTD also fell. Unrealizedlosses of $120 million on client risk management swaps owed to significantly wider credit risk spreads on IFC client swaps, also due torisk aversion occasioned by the spread of COVID-19.
Changes in the fair value of IFC’s borrowings from market, IDA, and associated derivatives, net, includes the impact of changes in IFC’sown credit spread when measured against U.S. dollar LIBOR. As credit spreads widen, unrealized gains are recorded and when creditspreads narrow, unrealized losses are recorded (notwithstanding the impact of other factors, such as changes in risk-free interest andforeign currency exchange rates). The magnitude and direction (gain or loss) can be volatile from period to period but does not alter thecash flows. IFC’s policy is to generally match the currency, amount, and timing of cash flows on market borrowings with the cash flows onthe associated derivatives entered into contemporaneously.
Beginning in FY19, the portion of the total change in fair value of borrowings, accounted for at fair value, resulting from a change in IFC’sown credit spread is reported as a separate component of Other Comprehensive Income due to the adoption of Accounting StandardsUpdate 2016-01, Recognition and Measurement of Financial Assets and Financial Liabilities (ASU 2016-01) as discussed in Note A to the
INTERNATIONAL FINANCE CORPORATION Page 41
Management’s Discussion and Analysis

accompanying consolidated financial statements. ASU 2016-01 was applied through a cumulative adjustment to beginning period balanceswith no change to prior period reported results.
The yield on the benchmark 5-year U.S. Treasury bond was 1.8% at the beginning of the fiscal year and 1.65% at the end of December2019, before declining to unprecedented levels around 0.3% at the end of FY20 as the COVID-19 crisis spread and was met by concertedefforts by central banks around the world to ease liquidity. U.S. dollar LIBOR discount rates at the 5 year tenor also fell in step over FY20YTD, from 1.74% to 0.32%. As a result, In FY20, IFC recorded unrealized losses of $1,719 million through net income on medium andlong-term borrowings carried at fair value, comprising a $1,690 million unrealized loss on market borrowings and a $29 million unrealizedloss on borrowings from IDA. Unrealized gains of $1,501 million were recorded on borrowing-related derivatives. Overall, IFC has reported$218 million of unrealized losses on borrowings from market sources and associated derivatives, net and borrowings from IDA in FY20(net unrealized losses $15 million in FY19). These after swap unrealized losses were concentrated in market borrowings of Turkish liraand Mexican Peso, offset to an extent by valuation gains after swaps on other currencies where swap FX basis spread movements drivesuch unrealized gains and losses. The unrealized losses in FY20 include $47 million of unrealized losses on IFC’s Indian rupee denominatedborrowings where IFC holds Indian rupee liquid assets and loans that act as an economic hedge.
OTHER COMPREHENSIVE INCOME (OCI)UNREALIZED GAINS AND LOSSES ON DEBT SECURITIES AND BORROWINGS
Table 16: Other Comprehensive Income (Loss) - Unrealized Gains and Losses on Debt Securities and Borrowings FY20 vsFY19 (US$ millions)
FY20 FY19Net unrealized gains and losses on debt securities arising during the year:
Unrealized gains $ 377 $ 466Unrealized losses (668) (524)
Reclassification adjustment for realized gains and credit related portion of impairments which wererecognized in net income 123 243
Net unrealized losses and gains on debt securities $ (168) $ 185Net unrealized gains and losses attributable to instrument-specific credit risk on borrowings at fair value
under the fair value option arising during the period:Unrealized gains $ 782 $ 464Unrealized losses (500) (377)
Reclassification adjustment for realized gains included in net income upon derecognition of borrowings 6 1Net unrealized gains on borrowings $ 288 $ 88
Total unrealized gains on debt securities and borrowings $ 120 $ 273
In FY20, other-than-temporary impairments on debt securities of $130 million were concentrated in four investments totaling $100 million.In FY19, other-than-temporary impairments on debt securities of $247 million were reclassified to net income, which largely comprised$238 million due to the significant currency depreciation in a country with a large debt security exposure considered other than temporary.
Net unrealized gains on debt securities and borrowings were $120 million in FY20, (net unrealized gains of $273 million in FY19). Anunrealized gain on borrowings of $288 million was recognized through other comprehensive income in FY20. This was due to a wideningof 5 to 15 basis points (bps) in the instrument specific credit risk spread on IFC borrowings at fair value in FY20 that reduced the valuationof bonds relative to hedging swaps. However, year end credit spreads for IFC issuance were down from much wider levels at the end ofFY20 Q3 when concerns in the capital markets about the impact of COVID-19 were at a peak. Credit spreads widened in almost allcurrencies of issuance, but most notably in IFC's Turkish lira, Mexican peso, and Australian dollar denominated bond portfolios.
UNRECOGNIZED NET ACTUARIAL GAINS AND LOSSES AND UNRECOGNIZED PRIOR SERVICE COSTS ON BENEFIT PLANSUnrecognized pension adjustments largely represent the unrecognized net actuarial gains and losses on benefit plans. Actuarial gainsand losses occur when actual results differ from expected results in determining the funded status of the pension plans. Since the pensionplans are long term, changes in asset returns and discount rates cause volatility in comprehensive income. Given its long-term planninghorizon for pension plans, Management is focused mainly on ensuring that contributions to pension plans appropriately reflect long termassumptions about asset returns and discount rates.
During FY20, IFC experienced a loss of $872 million ($878 million of unrecognized net actuarial losses and a $6 million reduction of priorservice cost). The loss resulted largely due to lower discount rates, which declined by around 80 basis points in FY20, to determine theprojected benefit obligations at FY20-end when compared with FY19-end. The discount rate assumptions used to determine the projectedbenefit obligation for the Staff Retirement Plan and Post-Employment Benefits Plan decreased from 3.4% at June 30, 2019 to 2.6% atJune 30, 2020 and from 3.5% at June 30, 2019 to 2.6% at June 30, 2020, respectively.
INTERNATIONAL FINANCE CORPORATION Page 42
Management’s Discussion and Analysis

FY19 VERSUS FY18
IFC reported income before net unrealized gains and losses on non-trading financial instruments accounted for at fair value and grants toIDA of $311 million in FY19, as compared to income of $1,272 million in FY18.
The $961 million decrease in income before net unrealized gains and losses on non-trading financial instruments accounted for at fairvalue and grants to IDA in FY19 when compared to FY18 was principally a result of the following:
Table 17: Change in Net Income FY19 vs FY18 (US$ millions)
Increase(decrease)
FY19 vs FY18Higher unrealized losses on equity investments and associated derivatives, net $ (935)Lower realized gains on equity investments and associated derivatives, net (567)Higher charges on borrowings (534)Higher other-than-temporary impairments on debt securities (208)Lower dividend income on equity investments (44)Higher income from loans and guarantees, realized gains and losses on loans and associated derivatives 397Lower other-than-temporary impairments on equity investments 446Higher income from liquid asset trading activities 520Other, net (36)Change in income before net unrealized gains and losses on non-trading financial instruments accounted
for at fair value and grants to IDA $ (961)
FY19 FY18Income before net unrealized gains and losses on non-trading financial instruments accounted for
at fair value and grants to IDA $ 311 $ 1,272Net unrealized (losses) gains on non-trading financial instruments accounted for at fair value (218) 88
Income before grants to IDA 93 1,360Grants to IDA — (80)
Net Income $ 93 $ 1,280
A more detailed analysis of the components of IFC’s net income follows.
INCOME FROM LOANS AND GUARANTEES, INCLUDING REALIZED GAINS AND LOSSES ON LOANS AND ASSOCIATEDDERIVATIVESIFC’s primary interest earning asset is its loan portfolio. Income from loans and guarantees, including realized gains and losses on loansand associated derivatives for FY19 totaled $1,774 million, compared with $1,377 million in FY18, an increase of $397 million.
The disbursed loan portfolio increased by $228 million from $25,172 million at June 30, 2018 to $25,400 million at June 30, 2019. Theincrease in the disbursed loan portfolio is due to new disbursements exceeding repayments ($605 million in FY19), partially offset byreduction in loans outstanding due to write-offs net of recoveries ($196 million in FY19) and currency exchange rate fluctuations ($138million in FY19). IFC’s reporting currency, the US dollar, appreciated significantly against emerging market investment currencies in FY19such as the Turkish lira and Colombian peso. The remainder of the change is primarily due to capitalized interest and charges, loanconversions and transfers.
The weighted average contractual interest rate on loans at June 30, 2019 was 6.3%, up from 6.0% June 30, 2018 reflecting the rise inaverage LIBOR as many of IFC’s loans periodically reprice.
INTERNATIONAL FINANCE CORPORATION Page 43
Management’s Discussion and Analysis

Table 18: FY19 Change in Income from Loans and Guarantees, including Realized Gains and Losses on Loans andAssociated Derivatives (US$ millions)
Income from loans and guarantees, including realized gains and losses on loans and associated derivatives inFY18 $ 1,377
Increase due to increase in interest rates 179Increase due to higher income from derivatives associated with loans 79Increase due to higher realized gains on loans and associated derivatives 59Increase due to higher recognition of deferred interest 57Increase due to increase in loan portfolio 33Decrease due to higher amount of interest reversed on non-accruing loans, net (21)Increase due to higher income from participation notes, fees and other income 11Change in Income from loans and guarantees, including realized gains and losses on loans and associated
derivatives $ 397Income from loans and guarantees, including realized gains and losses on loans and associated derivatives in
FY19 $ 1,774
(LOSS) INCOME FROM EQUITY INVESTMENTS AND ASSOCIATED DERIVATIVESIncome from the equity investment portfolio, including associated derivatives, decreased by $1,106 million from $853 million of income inFY18 to losses of $253 million in FY19.
IFC sells equity investments where IFC’s developmental role is complete, where pre-determined sales trigger levels have been met, andwhere applicable, lock ups have expired. Gains and losses on equity investments and associated derivatives comprise realized andunrealized gains.
IFC recognized realized net gains on equity investments and associated derivatives in FY19 of $425 million, as compared with $992 millionin FY18, a decrease of $567 million. Realized gains on equity investments and associated derivatives are concentrated in a small numberof investments. In FY19, there were eight investments that generated individual capital gains in excess of $20 million for a total of $425million, compared to nineteen investments that generated individual capital gains in excess of $20 million for a total of $684 million in FY18.Dividend income in FY19 totaled $238 million, as compared with $282 million in FY18.
Beginning in FY19, all equity investments are accounted for at fair value through net income due to the adoption of ASU 2016-01 asdiscussed above and in Note A to the accompanying consolidated financial statements. As a result, there were no other-than-temporaryimpairments on equity investments in FY19, as compared with $446 million in FY18.
Net unrealized losses on equity investments and associated derivatives were $918 million (including reversals of unrealized gains, measuredagainst original disbursement, upon realization) in FY19 compared to net unrealized gains of $17 million in FY18 due to lower valuationscoupled with the higher balance of equity investments recorded at fair value through net income due to the adoption of ASU 2016-01. AtJune 30, 2019, $13,113 million of equity investments were accounted for at fair value with changes in fair value being reported in netincome compared to $6,794 million at June 30, 2018. Prior to FY19, the change in fair value of equity investments classified as available-for-sale were recorded in other comprehensive income, and no unrealized gains and losses were recorded on equity investments measuredat cost less impairment. ASU 2016-01 was applied through a cumulative adjustment to beginning period balances with no change to priorperiod reported results.
INCOME FROM DEBT SECURITIES AND REALIZED GAINS AND LOSSES ON DEBT SECURITIES AND ASSOCIATED DERIVATIVESIncome from debt securities and associated derivatives declined by $237 million from $363 million in FY18 to $126 million in FY19. Thedecrease was primarily due to other-than-temporary impairments on debt securities of $247 million in FY19 ($39 million in FY18), whichincluded $238 million in FY19 Q1 related to cumulative foreign exchange losses reflecting the significant currency depreciation in a countrywith a large debt security exposure deemed as other than temporary, and lower realized gains of $5 million (compared to $93 million inFY18). This was partially offset by an increase in interest income by $56 million in FY19 when compared with FY18 driven by higheraverage debt security balances.
PROVISION FOR LOSSES ON LOANS, GUARANTEES, ACCRUED INTEREST AND OTHER RECEIVABLESThe quality of the loan portfolio, as measured by the weighted average country risk ratings and the weighted average credit ratings,experienced some marginal deterioration in FY19. Non-performing loans (NPLs) decreased by $69 million, from $1,400 million of thedisbursed loan portfolio at June 30, 2018 to $1,331 million8 at June 30, 2019. The decrease of $69 million was due to write-offs, net ofrecoveries ($196 million), positive developments such as repayments and prepayments ($307 million) and other changes ($7 million),partially offset by increase in NPL balances due to $441 million of loans and loan-like debt securities being placed in NPL status. In FY19,thirteen loans greater than $10 million, and totaling $387 million, were placed in NPL status.
INTERNATIONAL FINANCE CORPORATION Page 44
Management’s Discussion and Analysis
8 Includes $51 million reported as debt securities on the Balance Sheet as of June 30, 2019 ($23 million - June 30, 2018).

IFC recorded a net provision for losses on loans, guarantees, accrued interest and other receivables of $87 million in FY19 ($105 millionof specific provisions on loans, $28 million of release of portfolio provisions on loans, $10 million net provision on guarantees, otherreceivables and accrued interest) as compared to a provision of $90 million in FY18 ($82 million of specific provisions on loans, $2 millionof portfolio provisions on loans, $6 million net provision on guarantees, other receivables and accrued interest).
Project-specific developments on ten loans comprised 65% of the specific provision for losses on loans in FY19 (excluding release ofprovisions). The release of portfolio provisions in FY19 was due to an improvement in the expected loss given default that had a greaterimpact than the higher credit ratings for loans subject to portfolio provisions.
At June 30, 2019, IFC’s total reserves against losses on loans were $1,191 million or 4.7% of the disbursed loan portfolio ($1,293 million;5.1% at June 30, 2018), a decrease of $102 million from June 30, 2018. The decrease in reserves against losses on loans due to write-offs, net of recoveries of $187 million, and foreign exchange gains related to reserves held against non-U.S. dollar-denominated loans ($5million), was partially offset by provisions of $77 million and other adjustments ($13 million).
Specific reserves against losses on loans at June 30, 2019 of $580 million ($651 million at June 30, 2018) are held against impaired loansof $1,240 million ($1,258 million at June 30, 2018), a coverage ratio of 47% (52% at June 30, 2018).
INCOME FROM LIQUID ASSET TRADING ACTIVITIES
The liquid assets portfolio, net of derivatives and securities lending activities, increased by $0.8 billion from $38.9 billion at June 30, 2018,to $39.7 billion at June 30, 2019. Income, net of allocated funding costs, from liquid asset trading activities totaled $476 million in FY19compared to $214 million in FY18, an increase of $262 million. The increase is largely attributable to income from the Net Worth FundedPortfolio, which is benchmarked to the Bloomberg 1 to 3 year U.S. Treasury index. U.S. Treasuries have rallied since November 2018 inresponse to changing U.S. and global economic conditions and in anticipation of a shift in monetary policy by the U.S. Federal Reserve.This rally along with the growth in the Net Worth Funded Portfolio both contributed substantially to the increase in income relative to FY18,when the U.S. Treasury index return was close to 0%.
Interest income in FY19 totaled $775 million, compared to $664 million in FY18. The portfolio of ABS and MBS experienced fair valuelosses totaling $21 million in FY19. Holdings in other products, including US Treasuries, global government bonds, high quality corporatebonds and derivatives generated $537 million of gains in FY19, resulting in a total gain of $516 million (realized and unrealized). Thiscompares to a total gain (realized and unrealized) of $107 million in FY18.
In FY19, the liquid assets portfolios outperformed their benchmarks by $141 million, down from $266 million in FY18. The decline waslargely attributable to a decline in income from securities held in liquidity. In part, this reflected lower yield-spreads at the outset of FY19due to prior outperformance. The Corporation also decreased its risk appetite in FY19, and holdings of securities, particularly AAA-ratedasset-backed securities, residential mortgage-backed securities, and commercial mortgage-backed securities were reduced significantly.In FY19 Q4, performance over benchmarks was primarily generated by investments in international securitized products and moneymarkets. For FY19, most fixed-income sectors outperformed the Funded Liquidity benchmarks, while heightened volatility in interest-ratesweighed on excess returns for Agency MBS. Much of the excess return was attributable to investments in instruments (bonds and moneymarkets) denominated in foreign-currencies that benefited from deviations from interest-rate parity. During FY19, decreases in investmentsin securitized products and covered bonds were partially offset by investments in developed markets’ government-related securities,emerging market sovereign bonds and money markets. Liquid asset holdings remain well diversified geographically and are concentratedin money-market instruments.
At June 30, 2019, and June 30, 2018, trading securities classified as Level 3 securities (unobservable inputs for the securities used tomeasure fair value) were an insignificant population of total trading securities.
CHARGES ON BORROWINGSIFC’s charges on borrowings increased by $534 million, from $1,041 million in FY18 (net of $2 million gain on extinguishment of borrowings)to $1,575 million in FY19 (net of $1 million gain on extinguishment of borrowings), largely attributable to higher LIBOR rates compared tothe same period in FY18.
The weighted average cost of IFC’s borrowings outstanding from market sources, after the effects of borrowing-related derivatives, andexcluding short-term borrowings from market and other sources, was 2.8% at June 30, 2019, an increase from 2.5% at June 30, 2018.The size of the borrowings portfolio (excluding short-term borrowings), net of borrowing-related derivatives and before unamortizeddiscounts, net, and fair value adjustments, increased by $0.1 billion during FY19 from $53.4 billion at June 30, 2018, to $53.5 billion atJune 30, 2019.
OTHER INCOME Other income of $622 million for FY19 was $44 million higher than $578 million in FY18 due to an increase in client risk managementincome, increase in service fees, primarily evaluation service fees, and increase in advisory services income, partially offset by decreasein total income from consolidated entities.
INTERNATIONAL FINANCE CORPORATION Page 45
Management’s Discussion and Analysis

OTHER EXPENSESAdministrative expenses (the principal component of other expenses) increased by $326 million from $1,029 million in FY18 to $1,355million in FY19 primarily due to $238 million of pension service costs included in administrative expenses in FY19 due to the prospectiveadoption of ASU 2017-07, Improving the Presentation of Net Periodic Pension Cost and Net Periodic Postretirement Benefit Cost, beginningin FY19 Q1, as disclosed in Note A to the accompanying consolidated financial statements. The remainder of the increase was driven byincrease in staff costs, primarily due to workforce planning related severance costs, increase in the cost of Shared Services Agreementswith IBRD and increase in consultant and contractual services. These increases were partially offset by decline in travel, representationand hospitality expenses and other expenses.
FOREIGN CURRENCY TRANSACTION GAINS AND LOSSES ON NON-TRADING ACTIVITIESForeign currency transaction gains reported in net income in FY19 totaled $159 million (gains of $123 million - FY18). Foreign currencytransaction losses on debt securities accounted for as available-for-sale of $125 million in FY19 (losses of $120 million ‑ FY18) are reportedin Other Comprehensive Income, while gains and losses on the derivatives economically hedging such debt securities are reported in NetIncome. IFC has recorded foreign exchange related gains of $34 million ($3 million gains - FY18) in a combination of Net Income and OtherComprehensive Income. The net foreign exchange related gain or loss is largely due to non-US dollar borrowings funding non-US dollarliquid assets with the foreign exchange gains or losses on the liquid assets presented as part of Income from liquid asset trading activitiesin net income.
NET UNREALIZED GAINS AND LOSSES ON NON-TRADING FINANCIAL INSTRUMENTSAs discussed in more detail in Note A to IFC’s FY19 consolidated financial statements, IFC accounts for certain financial instruments atfair value with unrealized gains and losses on such financial instruments being reported in net income, namely: (i) all market borrowingswith associated currency or interest rate swaps that are accounted for at fair value with changes therein reported in net income; (ii) unrealizedgains and losses on certain loans, debt securities and associated derivatives; and (iii) borrowings from IDA.
Table 19: Net Unrealized Gains and Losses on Non-Trading Financial Instruments FY19 vs FY18 (US$ millions)
FY19 FY18Unrealized gains and losses on loans, debt securities and associated derivatives $ (203) $ 181Unrealized gains and losses on borrowings from market, IDA and associated derivatives, net (15) (93)
Net unrealized gains and losses on non-trading financial instruments accounted for at fair value $ (218) $ 88
IFC reported net unrealized losses on loans, debt securities and associated derivatives of $203 million in FY19 ($181 million gains inFY18). In FY19 this comprised unrealized gains of $65 million on the loan and debt securities portfolio carried at fair value, unrealizedlosses of $177 million on lending-related swaps, unrealized losses of $83 million on client risk management swaps and unrealized lossesof $8 million on other derivatives, mainly conversion features, warrants in investment contracts and interest rate and currency swapseconomically hedging client obligations. The unrealized losses of $177 million on lending related currency and interest rate swapseconomically hedging loans other than variable rate US dollar-denominated loans is driven mainly by the US dollar, Euro, Indian rupeeand Chinese yuan swap portfolios, where lower discount rates over FY19 YTD generated unrealized losses on the fixed-pay leg of theswaps.
Changes in the fair value of IFC’s borrowings from market, IDA and associated derivatives, net, includes the impact of changes in IFC’sown credit spread when measured against US dollar LIBOR. As credit spreads widen, unrealized gains are recorded and when creditspreads narrow, unrealized losses are recorded (notwithstanding the impact of other factors, such as changes in risk-free interest andforeign currency exchange rates). The magnitude and direction (gain or loss) can be volatile from period to period but does not alter thecash flows. IFC’s policy is to generally match currency, amount and timing of cash flows on market borrowings with cash flows on associatedderivatives entered into contemporaneously.
Beginning in FY19, the portion of the total change in fair value of borrowings, accounted for at fair value, resulting from a change in IFC’sown credit spread is reported as a separate component of Other Comprehensive Income due to the adoption of ASU 2016-01 as discussedin Note A to the accompanying consolidated financial statements. ASU 2016-01 was applied through a cumulative adjustment to beginningperiod balances with no change to prior period reported results.
INTERNATIONAL FINANCE CORPORATION Page 46
Management’s Discussion and Analysis

In FY19, US Treasury yields declined further as the rally in US fixed income markets that began last October continued apace as the USFederal Reserve signaled a shift from monetary tightening to the prevailing indications of an easier monetary policy, consequent toindications of a slowing US economy. The yield on the benchmark 5-year U.S. Treasury bond stood at 1.75 percent at FY19-end, comparedto 2.75 percent at the end of FY18. As a result, In FY19, IFC recorded unrealized losses of $1,484 million through net income on mediumand long-term borrowings carried at fair value, comprising a $1,452 million loss on market borrowings and a $32 million loss on borrowingsfrom IDA. Unrealized gains of $1,469 million were recorded on borrowing-related derivatives. Overall, IFC has reported $15 million of netunrealized losses on borrowings from market sources and associated derivatives, net and borrowings from IDA in FY19 (net unrealizedlosses $93 million in FY18). The unrealized losses in FY19 include $72 million of unrealized losses on IFC’s Indian rupee denominatedborrowings where IFC holds Indian rupee liquid assets and loans that act as an economic hedge. These unrealized losses were offset byunrealized gains on borrowings in other currencies which are economically hedged with currency swaps, but where swap FX basis spreadmovements drive such unrealized gains and losses.
OCIUNREALIZED GAINS AND LOSSES ON EQUITY INVESTMENTS AND DEBT SECURITIES
Through June 30, 2018, IFC’s investments in debt securities and equity investments that were listed in markets that provide readilydeterminable fair values were classified as available-for-sale, with unrealized gains and losses on these investments being reported inOCI until realized. When realized, the gain or loss was transferred to net income. Effective July 1, 2018, all equity investments are accountedfor at fair value through net income upon adoption of ASU 2016-01, and IFC has elected the fair value option for all new investments indebt securities.
As a result, no unrealized gains and losses on equity investments were recorded in OCI in FY19. Unrealized gains and losses on debtsecurities in OCI are associated with debt securities investments made prior to July 1, 2018. Changes in unrealized gains and losses ondebt securities reported in OCI are significantly impacted by (i) the global environment for emerging market debt; (ii) the reclassificationof other-than-temporary impairments to net income; and (iii) the reclassification of realized gains on sales of debt securities accounted foras available for sale.
As discussed in Note A to the accompanying consolidated financial statements, effective July 1, 2018, the portion of the change in fairvalue of borrowings under the FVO resulting from the change of IFC’s own credit risk is recorded in OCI. In prior periods, these amountswere recognized in net income.
Table 20: Other Comprehensive Income (Loss) - Unrealized Gains and Losses on Equity Investments, Debt Securities andBorrowings FY19 vs FY18 (US$ millions)
FY19 FY18Net unrealized gains and losses on equity investments arising during the year:
Unrealized gains $ — $ 859Unrealized losses — (414)
Reclassification adjustment for realized gains and other-than-temporary impairments included in netincome — (511)
Net unrealized losses and gains on equity investments $ — $ (66)Net unrealized gains and losses on debt securities arising during the year:
Unrealized gains $ 466 $ 391Unrealized losses (524) (627)
Reclassification adjustment for realized gains and credit related portion of impairments which wererecognized in net income 243 (10)
Net unrealized losses and gains on debt securities $ 185 $ (246)Net unrealized gains and losses attributable to instrument-specific credit risk on borrowings at fair value
under the fair value option arising during the period:
Unrealized gains $ 464 $ —Unrealized losses (377) —
Reclassification adjustment for realized gains included in net income upon derecognition of borrowings 1 —
Net unrealized gains on borrowings $ 88 $ —
Total unrealized losses and gains on equity investments, debt securities and borrowings $ 273 $ (312)
INTERNATIONAL FINANCE CORPORATION Page 47
Management’s Discussion and Analysis

In FY19, other-than-temporary impairments on debt securities of $247 million ($39 million in FY18) included $238 million from a cumulativeforeign exchange loss reclassified to Net Income in FY19 Q1, reflecting the significant currency depreciation in a country considered otherthan temporary with a large debt security exposure.
Net unrealized gains on equity investments, debt securities and borrowings totaled $273 million in FY19 (net unrealized losses of $312million in FY18). A gain of $88 million was recognized through other comprehensive income in FY19 due to movements in the instrumentspecific credit risk on borrowings at fair value. This was primarily due to IFC bond issuances in US dollars where after swap credit spreadswidened by 5 basis points on average across the term structure from the end of FY18, and from issuances in Australian dollars and Turkishlira where credit spreads on IFC bonds were also higher when compared to FY18-end.
UNRECOGNIZED NET ACTUARIAL GAINS AND LOSSES AND UNRECOGNIZED PRIOR SERVICE COSTS ON BENEFIT PLANSUnrecognized pension adjustments largely represent the unrecognized net actuarial gains and losses on benefit plans. Actuarial gainsand losses occur when actual results differ from expected results in determining the funded status of the pension plans. Since the pensionplans are long term, changes in asset returns and discount rates cause volatility in comprehensive income. Given its long-term planninghorizon for pension plans, Management is focused mainly on ensuring that contributions to pension plans appropriately reflect long termassumptions about asset returns and discount rates.
During FY19, IFC experienced a loss of $410 million ($416 million of unrecognized net actuarial losses and a $6 million reduction of priorservice cost). The loss resulted largely from the decrease in the discount rates used to determine the projected benefit obligations atFY19-end when compared with FY18-end. The discount rate assumptions used to determine the projected benefit obligation for the StaffRetirement Plan and Post-Employment Benefits Plan decreased from 4.1% at June 30, 2018 to 3.4% at June 30, 2019 and from 4.1% atJune 30, 2018 to 3.5% at June 30, 2019, respectively.
INTERNATIONAL FINANCE CORPORATION Page 48
Management’s Discussion and Analysis

VIII. GOVERNANCE AND CONTROL
SENIOR MANAGEMENT AND CHANGES
The following is a list of the principal officers of IFC as of June 30, 2020:
President David MalpassChief Executive Officer Philippe Le Houérou (*)Chief Operating Officer Stephanie von FriedeburgRegional Vice President, Latin America & Caribbean and Europe & Central Asia Georgina BakerRegional Vice President, Middle-East and Africa Sérgio PimentaRegional Vice President, Asia and Pacific Nena Stoiljkovic (**)Vice President and General Counsel (***) Christopher Stephens (****)Vice President, Risk and Finance Mohamed GouledVice President, Corporate Strategy and Resources Monish MahurkarVice President, Treasury and Syndications John GandolfoVice President, Economics and Private Sector Development Hans Peter LankesVice President, IFC Asset Management Company (*****) Marcos Brujis (******)Vice President, Partnerships, Communications and Outreach Karin Finkelston
(*) Philippe Le Houérou will be leaving IFC, effective October 1, 2020.(**) Effective August 31, 2020, Nena Stoiljkovic will leave IFC. Alfonso García Mora was appointed Regional Vice President,
Asia and the Pacific effective August 10, 2020.(***) Effective July 1, 2019, the Legal, Compliance Risk & Environmental, Social and Governance (ESG) Sustainability Vice
Presidency Unit (VPU) was changed to the Legal and Compliance Risk VPU, after separating the ESG functions.(****) Ethiopis Tafara was appointed as the new Vice President, Corporate Services and Chief Risk, Legal and Administrative
Officer of MIGA and Christopher Stephens was appointed Vice President and General Counsel of IFC. Both appointmentsbecame effective on September 23, 2019.
(*****) Effective January 31, 2020, AMC was merged into IFC. The AMC business is now operated as a division within IFC.(******) Marcos Brujis left IFC on May 31, 2020.
GOVERNANCE STRUCTURE
INTERNATIONAL FINANCE CORPORATION Page 49
Management’s Discussion and Analysis

GENERAL GOVERNANCE
IFC’s decision-making structure consists of the Board of Governors, the Board of Directors (Board of Directors or Board), thePresident, the CEO, Management and staff. The Board of Governors is the highest decision-making authority. Governors areappointed by their member governments for a five-year term, which is renewable. The Board of Governors may delegate authorityto the Board of Directors to exercise any of its powers, except those reserved to the Board of Governors under IFC's Articles ofAgreement.
BOARD OF DIRECTORS
In accordance with IFC's Articles of Agreement, Directors are appointed or elected every two years by their member governments.The Board currently has 25 Directors who represent all member countries. Directors are neither officers nor staff of IFC. ThePresident is the only member of the Board from management, and he serves as a non-voting member and as Chairman of theBoard.
The Board is required to consider proposals made by the President on the use of IFC’s net income: retained earnings and designationof retained earnings and on other policies that affect its general operations. The Board is also responsible for presenting to theBoard of Governors, at the Annual meetings, audited accounts, an administrative budget, and an annual report on operations andpolicies and on other matters.
The Board and its committees are in continuous session at the main IBRD offices in Washington DC, as business requires. Eachcommittee’s terms of reference establish its respective roles and responsibilities. As committees do not vote on issues, their role isprimarily to serve the Board in discharging its responsibilities.
The committees are made up of eight members and function under their respective stipulated terms of reference. These committeesare as follows:• Audit Committee - assists the Board in overseeing IFC’s finances, accounting, risk management and internal controls (see
further explanation below).• Budget Committee - assists the Board in approving IFC’s budget and in overseeing the preparation and execution of IFC’s
strategy and business outlook. The committee provides guidance to management on strategic directions.• Committee on Development Effectiveness - supports the Board in assessing IFC’s development effectiveness, providing
guidance on strategic directions, and monitoring the quality and results of operations.• Committee on Governance and Directors’ Administrative Matters - assists the Board on issues related to governance, the
Board’s own effectiveness, and the administrative policy applicable to Directors’ offices.• Human Resources Committee - strengthens the efficiency and effectiveness of the Board in discharging its oversight
responsibility on IFC’s human resources strategy, policies and practices, and their alignment with the business needs of theorganization.
AUDIT COMMITTEE
MEMBERSHIP
The Audit Committee consists of eight Directors. Membership in the Committee is determined by the Board, based on nominationsby the Chairman of the Board, following informal consultation with Directors.
KEY RESPONSIBILITIES
The Audit Committee is appointed by the Board for the primary purpose of assisting the Board in overseeing IFC’s finances,accounting, risk management, internal controls and institutional integrity, specific responsibilities include:• Oversight of the integrity of IFC’s financial statements.• Appointment, qualifications, independence and performance of the External Auditor.• Performance of the Internal Audit Department.• Adequacy and effectiveness of financial and accounting policies and internal controls and the mechanisms to deter, prevent
and penalize fraud and corruption in IFC operations and corporate procurement.• Effective management of financial, fiduciary, and compliance risks in IFC.• Oversight of the institutional arrangements and processes for risk management across IFC.
In carrying out its role, the Audit Committee discusses financial issues and policies that affect IFC’s financial position and capitaladequacy with Management, external auditors, and internal auditors. It recommends the annual audited financial statements forapproval to the Board. The Audit Committee monitors and reviews developments in corporate governance and its own role on anongoing basis.
INTERNATIONAL FINANCE CORPORATION Page 50
Management’s Discussion and Analysis

EXECUTIVE SESSIONS
Under the Audit Committee’s terms of reference, it may convene in executive session at any time, without Management’s presence.The Audit Committee meets separately in executive session with the external and internal auditors.
ACCESS TO RESOURCES AND TO MANAGEMENT
Throughout the year, the Audit Committee receives a large volume of information to enable it to carry out its duties, and meets bothformally and informally throughout the year to discuss relevant matters. It has complete access to Management and reviews anddiscusses with Management topics considered in its terms of reference.
The Audit Committee has the authority to seek advice and assistance from outside legal, accounting, or other advisors as it deemsnecessary.
BUSINESS CONDUCT
The WBG promotes a positive work environment in which staff members understand their ethical obligations to the institutions. Insupport of this commitment, the institutions have in place a Code of Conduct. The WBG has both an Ethics HelpLine and a Fraudand Corruption hotline. A third-party service offers many methods of worldwide communication. Reporting channels includetelephone, mail, email, or confidential submission through a website.
IFC has in place procedures for receiving, retaining, and handling recommendations and concerns relating to business conductidentified during the accounting, internal control and auditing processes.
WBG staff rules clarify and codify the staff’s obligations in reporting suspected fraud, corruption, or other misconduct that maythreaten the operations or governance of the WBG. These rules also offer protection from retaliation.
AUDITOR INDEPENDENCE
The appointment of the external auditor for IFC is governed by a set of Board-approved principles. These include:• Limits on the external auditor's provision of non-audit-related services;• Requiring all audit-related services to be pre-approved on a case-by-case basis by the Board, upon recommendation of the
Audit Committee; and• Renewal of the external audit contract every five years, with a limit of two consecutive terms and mandatory rotation thereafter.The Board approved policy on the appointment of an external auditor permits the external auditor to provide non-prohibited non-audit related services subject to monetary limits. Broadly, the list of prohibited non-audit services include those that would put theexternal auditor in the roles typically performed by management or in a position of auditing their own work, such as accountingservices, internal audit services, and provision of investment advice. The total non-audit services fees over the term of the relevantexternal audit contract shall not exceed 70 percent of the audit fees over the same period.
Communication between the external auditor and the Audit Committee is ongoing and carried out as often as deemed necessaryby either party. The Audit Committee meets periodically with the external auditor and individual committee members have independentaccess to the external auditor. IFC’s external auditors also follow the communication requirements, with the Audit Committees setout under generally accepted auditing standards in the United States.
EXTERNAL AUDITORS
The external auditor is appointed to a five-year term, with a limit of two consecutive terms, and is subject to annual reappointmentbased on the recommendation of the Audit Committee and approval of a resolution by the Board. Following a mandatory rebidding of the external audit contract, IFC’s Directors approved the appointment of Deloitte & Touche, LLPas IFC’s external auditor for a five-year term commencing FY19.
INTERNAL CONTROL
INTERNAL CONTROL OVER FINANCIAL REPORTING
Each fiscal year, Management evaluates the internal controls over financial reporting to determine whether any changes made inthese controls during the fiscal year materially affect, or would be reasonably likely to materially affect IFC’s internal control overfinancial reporting. The internal control framework promulgated by COSO, “Internal Control - Integrated Framework (2013)” providesguidance for designing, implementing and conducting internal control and assessing its effectiveness. IFC uses the 2013 COSOframework to assess the effectiveness of the internal control over financial reporting. As of June 30, 2020, management maintainedeffective internal control over financial reporting. See “Management’s report regarding effectiveness of Internal Control over FinancialReporting” on Page 54.
IFC’s internal control over financial reporting was audited by Deloitte & Touche, LLP and their report expresses an unqualifiedopinion on the effectiveness of IFC's internal control over financial reporting as of June 30, 2020. See Independent Auditors’ Reporton Page 56.
INTERNATIONAL FINANCE CORPORATION Page 51
Management’s Discussion and Analysis

DISCLOSURE CONTROLS AND PROCEDURES
Disclosure controls and procedures are designed to ensure that information required to be disclosed is gathered and communicatedto Management as appropriate, to allow timely decisions regarding required disclosure by IFC. Management conducted an evaluationof the effectiveness of such controls and procedures and the President, the Chief Executive Officer, the Vice President, Risk andFinance and the Controller have concluded that these controls and procedures were effective as of June 30, 2020.
OTHERDuring FY19 Q3, the Supreme Court of the United States (Supreme Court) decided on a narrow question of US statutory law. TheUS International Organizations Immunities Act (IOIA) provides certain international organizations, including IFC, with the sameimmunity from suit in the United States as foreign states. This statutory grant of immunity is in addition to and independent of theimmunities set forth in IFC’s Articles of Agreement, as codified in a separate US statute. The Supreme Court decided that the grantof immunity under the IOIA had changed over time in line with changes in sovereign immunity, and that the IOIA now includes certainexceptions. The Supreme Court decision did not affect any of IFC’s other immunities under US law, nor did it cover other sourcesof IFC’s immunities under international law such as IFC’s Articles of Agreement and the United Nations Convention on the Privilegesand Immunities of the Specialized Agencies. There are currently two court cases in the United States that may be impacted by theSupreme Court decision. Following the Supreme Court's decision these cases restarted in United States lower courts, and IFC hascontinued to present a number of jurisdictional arguments (including immunities based arguments) for the dismissal of both cases.One of the two cases has been dismissed by the relevant lower court, subject to a pending plaintiffs’ motion seeking leave to amendtheir complaint and possible appeal. Neither of these two cases has reached a merits stage. See also Note Z to the FY20 consolidatedfinancial statements.
INTERNATIONAL FINANCE CORPORATION Page 52
Management’s Discussion and Analysis

CONSOLIDATED FINANCIAL STATEMENTS AND INTERNAL CONTROL REPORTS
June 30, 2020
INTERNATIONAL FINANCE CORPORATION Page 53
CONTENTS Page
Management’s Report regarding Effectiveness of Internal Control over Financial Reporting 54
Independent Auditors’ Report on the Effectiveness of Internal Control over Financial Reporting 56
Consolidated Balance Sheets 57
Consolidated Statements of Operations 58
Consolidated Statements of Comprehensive Income (Loss) 59
Consolidated Statements of Changes in Capital 60
Consolidated Statements of Cash Flows 61
Supplemental Information
Consolidated Statement of Capital Stock and Voting Power 63
Notes to Consolidated Financial Statements 65
Independent Auditors’ Report 132
Management's Report Regarding Effectiveness ofInternal Control over Financial Reporting
August 7, 2020
The management of the International Finance Corporation (IFC) is responsible for the preparation, integrity,and fair presentation of its published consolidated financial statements. The consolidated financialstatements have been prepared in accordance with accounting principles generally accepted in the UnitedStates of America and include amounts based on informed judgments and estimates made by management.
The consolidated financial statements have been audited by an independent audit firm, which was givenunrestricted access to all financial records and related data, including minutes of all meetings of the Boardof Directors and their Committees. Management believes that all representations made to the independentauditors during their audit of IFC's consolidated financial statements and audit of its internal control overfinancial reporting were valid and appropriate. The independent auditors’ reports accompany the auditedconsolidated financial statements.
Management is responsible for establishing and maintaining effective internal control over financialreporting for financial statement presentations in conformity with accounting principles generally acceptedin the United States of America. Management maintains a comprehensive system of controls intended toensure that transactions are executed in accordance with management's authorization, assets aresafeguarded, and financial records are reliable. The system of internal control contains monitoringmechanisms, and actions are taken to correct deficiencies identified. Management believes that internalcontrol over financial reporting supports the integrity and reliability of the external consolidated financialstatements.
There are inherent limitations in the effectiveness of any internal control, including the possibility of humanerror and the circumvention or overriding of controls. Accordingly, even effective internal controls canprovide only reasonable assurance with respect to financial statement preparation. Further, because ofchanges in conditions, the effectiveness of internal controls may vary over time.
IFC assessed its internal control over financial reporting for financial statement presentation in conformitywith accounting principles generally accepted in the United States of America as of June 30, 2020. Thisassessment was based on the criteria for effective internal control over financial reporting described inInternal Control - Integrated Framework (2013) issued by the Committee of Sponsoring Organizations ofthe Treadway Commission. Based upon this assessment, management believes that IFC maintained effectiveinternal control over financial reporting presented in conformity with accounting principles generallyaccepted in the United States of America as of June 30, 2020. The independent audit firm that audited theconsolidated financial statements has issued an Independent Auditors’ Report which expresses an opinionon IFC’s internal control over financial reporting.
Page 54

The Board of Directors have appointed an Audit Committee responsible for monitoring the accountingpractices and internal controls of IFC. The Audit Committee is comprised entirely of Directors who areindependent of IFC's management. The Audit Committee is responsible for recommending to the Boardof Directors the selection of independent auditors. It meets periodically with management, the independentauditors, and the internal auditors to ensure that they are carrying out their responsibilities. The AuditCommittee is responsible for performing an oversight role by reviewing and monitoring the financial,accounting and auditing procedures of IFC in addition to reviewing IFC's financial reports. The independentauditors and the internal auditors have full and free access to the Audit Committee, with or without thepresence of management to discuss the adequacy of internal control over financial reporting and any othermatters which they believe should be brought to the attention of the Audit Committee.
Page 55

Independent Auditors’ ReportPresident and Board of DirectorsInternational Finance Corporation:
We have audited the internal control over financial reporting of International Finance Corporation and its subsidiary ("IFC") as ofJune 30, 2020, based on the criteria established in the Internal Control - Integrated Framework (2013) issued by the Committeeof Sponsoring Organizations of the Treadway Commission.
Management's Responsibility for Internal Control over Financial Reporting
Management is responsible for designing, implementing, and maintaining effective internal control over financial reporting, andfor its assessment about the effectiveness of internal control over financial reporting, included in the accompanying Management'sReport Regarding Effectiveness of Internal Control Over Financial Reporting.
Auditors' Responsibility
Our responsibility is to express an opinion on IFC's internal control over financial reporting based on our audit. We conductedour audit in accordance with auditing standards generally accepted in the United States of America. Those standards require thatwe plan and perform the audit to obtain reasonable assurance about whether effective internal control over financial reportingwas maintained in all material respects.
An audit of internal control over financial reporting involves performing procedures to obtain audit evidence about whether amaterial weakness exists. The procedures selected depend on the auditor's judgment, including the assessment of the risks thata material weakness exists. An audit includes obtaining an understanding of internal control over financial reporting and testingand evaluating the design and operating effectiveness of internal control over financial reporting based on the assessed risk.
We believe that the audit evidence we have obtained is sufficient and appropriate to provide a basis for our audit opinion.
Definition and Inherent Limitations of Internal Control over Financial Reporting
An entity's internal control over financial reporting is a process effected by those charged with governance, management, andother personnel, designed to provide reasonable assurance regarding the preparation of reliable financial statements inaccordance with accounting principles generally accepted in the United States of America. An entity's internal control over financialreporting includes those policies and procedures that (1) pertain to the maintenance of records that, in reasonable detail, accuratelyand fairly reflect the transactions and dispositions of the assets of the entity; (2) provide reasonable assurance that transactionsare recorded as necessary to permit preparation of financial statements in accordance with accounting principles generallyaccepted in the United States of America, and that receipts and expenditures of the entity are being made only in accordancewith authorizations of management and those charged with governance; and (3) provide reasonable assurance regardingprevention, or timely detection and correction, of unauthorized acquisition, use, or disposition of the entity's assets that couldhave a material effect on the financial statements.
Because of its inherent limitations, internal control over financial reporting may not prevent, or detect and correct, misstatements.Also, projections of any assessment of effectiveness to future periods are subject to the risk that controls may become inadequatebecause of changes in conditions, or that the degree of compliance with the policies or procedures may deteriorate.
Opinion
In our opinion, IFC maintained, in all material respects, effective internal control over financial reporting as of June 30, 2020,based on the criteria established in the Internal Control - Integrated Framework (2013) issued by the Committee of SponsoringOrganizations of the Treadway Commission.
Report on Consolidated Financial Statements
We also have audited, in accordance with auditing standards generally accepted in the United States of America, consolidatedfinancial statements as of and for the year ended June 30, 2020 of IFC, and our report dated August 7, 2020 expressed anunmodified opinion on those consolidated financial statements.
August 7, 2020
Page 56

CONSOLIDATED BALANCE SHEETSas of June 30, 2020 and June 30, 2019
(US$ millions)
2020 2019AssetsCash and due from banks - Note C $ 545 $ 1,197Time deposits - Note C 14,218 17,500Trading securities - Notes C and R 30,217 28,526Securities purchased under resale agreements and receivable
for cash collateral pledged - Notes C, R and W 1,221 1,862
Investments - Notes B, D, E, F, G, R and TLoans($955 at June 30, 2020, $877 at June 30, 2019 at fair value;net of reserve against losses of $1,648 at June 30, 2020, $1,191 at June 30, 2019)- Notes D, E, R and T 24,102 23,983
Equity investments - Notes B, D, G, R and T 10,370 13,130
Debt securities - Notes D, F, R and T 6,666 6,349
Total investments 41,138 43,462
Derivative assets - Notes C, Q, R and W 4,314 2,856
Receivables and other assets - Notes C, J, T and U 4,147 3,854
Total assets $ 95,800 $ 99,257
Liabilities and capital
LiabilitiesSecurities sold under repurchase agreements and payable
for cash collateral received - Notes C and W $ 4,591 $ 8,454
Borrowings outstanding - Notes K, R and XFrom market and other sources at amortized cost 3,785 3,023From market sources at fair value 51,080 50,392From International Development Association at fair value 621 717
Total borrowings 55,486 54,132
Derivative liabilities - Notes C, Q, R and W 4,383 3,964
Payables and other liabilities - Notes C, L, U, T and V 6,158 5,101
Total liabilities 70,618 71,651
Capital
Authorized capital, shares of $1,000 par value each - Note M (25,079,991 shares at June 30, 2020 and 2,580,000 shares at June 30, 2019)
Subscribed capital 20,366 2,567Less: unpaid portion of subscriptions (799) —
Paid-in capital 19,567 2,567
Accumulated other comprehensive loss - Note O (1,984) (1,232)
Retained earnings - Note O 7,599 26,271
Total capital 25,182 27,606
Total liabilities and capital $ 95,800 $ 99,257
INTERNATIONAL FINANCE CORPORATION Page 57
The notes to consolidated financial statements are an integral part of these statements.
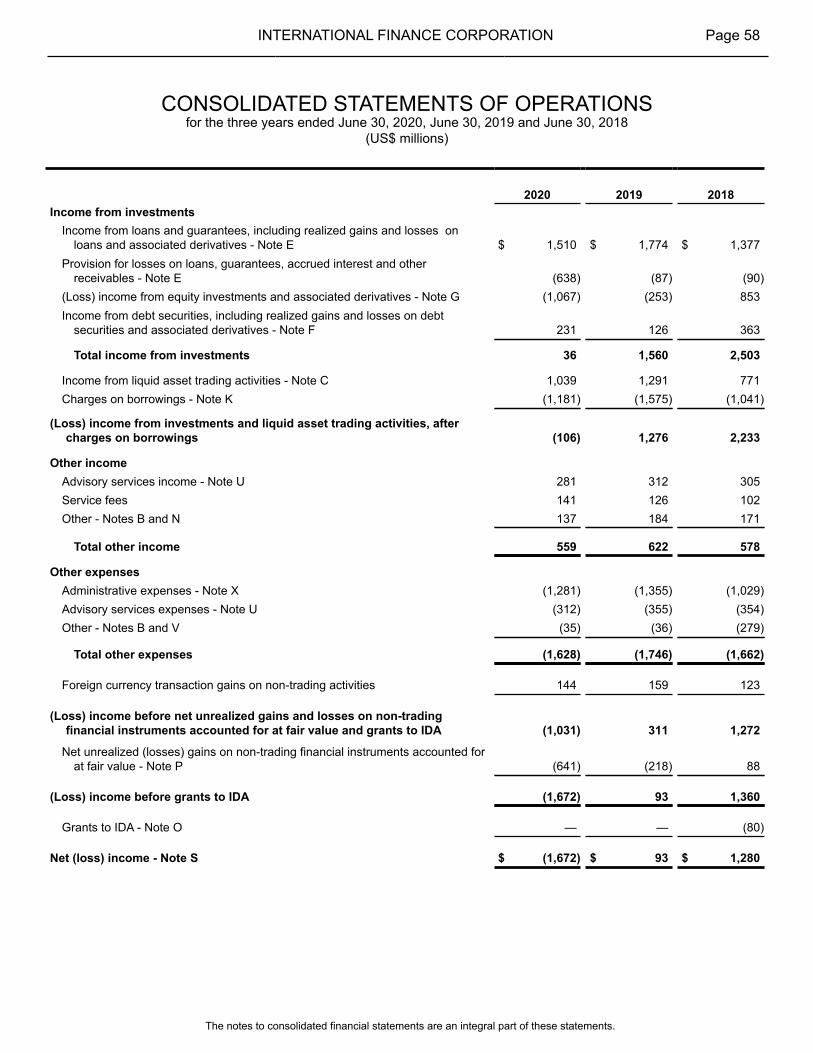
CONSOLIDATED STATEMENTS OF OPERATIONSfor the three years ended June 30, 2020, June 30, 2019 and June 30, 2018
(US$ millions)
2020 2019 2018Income from investments
Income from loans and guarantees, including realized gains and losses onloans and associated derivatives - Note E $ 1,510 $ 1,774 $ 1,377
Provision for losses on loans, guarantees, accrued interest and otherreceivables - Note E (638) (87) (90)
(Loss) income from equity investments and associated derivatives - Note G (1,067) (253) 853Income from debt securities, including realized gains and losses on debt
securities and associated derivatives - Note F 231 126 363
Total income from investments 36 1,560 2,503
Income from liquid asset trading activities - Note C 1,039 1,291 771Charges on borrowings - Note K (1,181) (1,575) (1,041)
(Loss) income from investments and liquid asset trading activities, aftercharges on borrowings (106) 1,276 2,233
Other incomeAdvisory services income - Note U 281 312 305Service fees 141 126 102Other - Notes B and N 137 184 171
Total other income 559 622 578
Other expensesAdministrative expenses - Note X (1,281) (1,355) (1,029)Advisory services expenses - Note U (312) (355) (354)Other - Notes B and V (35) (36) (279)
Total other expenses (1,628) (1,746) (1,662)
Foreign currency transaction gains on non-trading activities 144 159 123
(Loss) income before net unrealized gains and losses on non-tradingfinancial instruments accounted for at fair value and grants to IDA (1,031) 311 1,272
Net unrealized (losses) gains on non-trading financial instruments accounted forat fair value - Note P (641) (218) 88
(Loss) income before grants to IDA (1,672) 93 1,360
Grants to IDA - Note O — — (80)
Net (loss) income - Note S $ (1,672) $ 93 $ 1,280
INTERNATIONAL FINANCE CORPORATION Page 58
The notes to consolidated financial statements are an integral part of these statements.

CONSOLIDATED STATEMENTS OF COMPREHENSIVE INCOME (LOSS)for the three years ended June 30, 2020, June 30, 2019 and June 30, 2018
(US$ millions)
2020 2019 2018Net (loss) income $ (1,672) $ 93 $ 1,280
Other comprehensive income
Unrealized gains and losses on debt securitiesNet unrealized losses on available-for-sale debt securities arising during the
period (291) (58) (236)Reclassification adjustment for realized gains included in net income (income
from debt securities and realized gains and losses on debt securities andassociated derivatives) (7) (4) (49)
Reclassification adjustment for other-than-temporary impairments included innet income (income from debt securities and realized gains and losses ondebt securities and associated derivatives) 130 247 39
Net unrealized (losses) gains on debt securities (168) 185 (246)
Unrealized gains and losses on equity investmentsNet unrealized gains on equity investments arising during the period — — 445Reclassification adjustment for realized gains included in net income (income
from equity investments and associated derivatives) — — (693)Reclassification adjustment for other-than-temporary impairments included in
net income (income from equity investments and associated derivatives) — — 182
Net unrealized losses on equity investments — — (66)
Unrealized gains and losses on borrowingsNet unrealized gains arising during the period attributable to instrument-specific
credit risk on borrowings at fair value under the fair value option 282 87 —Reclassification adjustment for realized gains included in net income upon
derecognition of borrowings 6 1 —
Net unrealized gains on borrowings 288 88 —
Net unrecognized net actuarial (losses) gains and unrecognized priorservice (cost) credits on benefit plans - Note V (872) (410) 118
Total other comprehensive loss (752) (137) (194)
Total comprehensive (loss) income $ (2,424) $ (44) $ 1,086
INTERNATIONAL FINANCE CORPORATION Page 59
The notes to consolidated financial statements are an integral part of these statements.

CONSOLIDATED STATEMENTS OF CHANGES IN CAPITALfor the three years ended June 30, 2020, June 30, 2019 and June 30, 2018
(US$ millions)
Attributable to IFC
Undesignatedretainedearnings
DesignatedretainedEarnings
Totalretainedearnings
Accumulatedother
comprehensiveincome (loss) -
Note OCapitalstock
TotalIFC
capital
Non-controllinginterests
Totalcapital
At June 30, 2017 $ 21,901 $ 125 $ 22,026 $ 458 $ 2,566 $25,050 $ 3 $ 25,053
Year ended June 30, 2018
Net income attributable to IFC 1,280 1,280 1,280 1,280Other comprehensive loss (194) (194) (194)Designation of retained
earnings - Note O (205) 205 — — —Expenditures against
designated retained earnings- Note O 140 (140) — — —
Non-controlling interestsredeemed (3) (3)
At June 30, 2018 $ 23,116 $ 190 $ 23,306 $ 264 $ 2,566 $26,136 $ — $ 26,136Cumulative effect of adoption of
ASU 2016-01, effective July 1,2018 - Note A 2,872 2,872 (1,359) 1,513 1,513
Year ended June 30, 2019
Net income 93 93 93 93Other comprehensive loss (137) (137) (137)Payments received for IFC
capital stock Subscribed 1 1 1Designations of retained
earnings - Note O (230) 230 — — —Expenditures against
designated retained earnings- Note O 54 (54) — — —
At June 30, 2019 $ 25,905 $ 366 $ 26,271 $ (1,232) $ 2,567 $27,606 $ — $ 27,606
Year ended June 30, 2020
Net loss (1,672) (1,672) (1,672) (1,672)
Other comprehensive loss (752) (752) (752)Designations of retained
earnings - Note O (122) 122 — — —Expenditures against
designated retained earnings- Note O 55 (55) — — —
Conversion of a portion ofretained earnings into paid-incapital (17,000) (17,000) 17,000 — —
At June 30, 2020 $ 7,166 $ 433 $ 7,599 $ (1,984) $19,567 $25,182 $ — $ 25,182
INTERNATIONAL FINANCE CORPORATION Page 60
The notes to consolidated financial statements are an integral part of these statements.

CONSOLIDATED STATEMENTS OF CASH FLOWSfor the three years ended June 30, 2020, June 30, 2019 and June 30, 2018
(US$ millions)
2020 2019 2018Cash flows from investing activitiesLoan disbursements $ (8,185) $ (7,083) $ (7,919)Investments in equity securities (803) (908) (1,270)Investments in debt securities (1,175) (1,083) (1,961)Loan repayments 6,611 6,478 6,358Debt securities repayments 397 324 514Proceeds from sales of loan investments 10 22 43Proceeds from sales of equity investments 2,395 1,914 2,369Proceeds from sales of debt securities 82 46 20Loan origination fee received 51 — —Investment in Fixed Assets (57) (41) (29)
Net cash used in investing activities (674) (331) (1,875)Cash flows from financing activitiesMedium and long-term borrowingsIssuance 15,241 15,805 16,524Retirement (14,586) (14,657) (16,755)
Medium and long-term borrowings related derivatives, net (676) (279) (551)Short-term borrowings, net 792 (901) 1,577Capital subscriptions — 1 —Non-controlling interests redeemed — — (3)
Net cash provided by (used in) financing activities 771 (31) 792Cash flows from operating activitiesNet (loss) income (1,672) 93 1,280Adjustments to reconcile net income or loss to net cash (used in) provided by operating activities:Realized losses (gains) on loans and associated derivatives, net 12 (40) 19Realized gains on debt securities and associated derivatives, net (24) (5) (93)Losses (gains) on equity investments and related derivatives, net 1,240 493 (1,009)Provision for losses on loans, guarantees, accrued interest and other receivables 638 87 90Amortization expenses (12) (18) (17)Other-than-temporary impairments on debt securities 130 247 39Other-than-temporary impairments on equity investments — — 446Net premiums received at issuance of borrowings (net of swaps) — 16 2Net discounts paid on retirement of borrowings (46) (56) (33)Net realized gains on extinguishment of borrowings (7) (1) (2)Foreign currency transaction gains on non-trading activities (144) (159) (123)Net unrealized losses (gains) on non-trading financial instruments accounted for at fair value 641 218 (88)Depreciation expenses 62 — —Change in accrued income on loans and trading portfolios (after swaps), net 99 (59) (63)Change in accrued expenses on borrowings (after swaps), net (135) 109 145Change in trading securities and time deposits with maturities greater than three months 579 (4,589) 1,251Change in securities purchased under resale agreements and receivable for cash collateral
pledged 641 128 (1,057)Change in other derivatives, net 243 1,051 749Change in payables and other liabilities 428 (374) (740)Change in receivables and other assets 15 (279) (531)Change in securities sold under repurchase agreements and payable for cash collateral received (3,863) 2,091 963
Net cash (used in) provided by operating activities (1,175) (1,047) 1,228Change in cash and cash equivalents (1,078) (1,409) 145Effect of exchange rate changes on cash and cash equivalents (138) 974 (423)Net change in cash and cash equivalents (1,216) (435) (278)Beginning cash and cash equivalents 13,970 14,405 14,683Ending cash and cash equivalents $ 12,754 $ 13,970 $ 14,405Composition of cash and cash equivalentsCash and due from banks 545 1,197 1,249Time deposits with maturities under three months 12,209 12,773 13,156
Total cash and cash equivalents $ 12,754 $ 13,970 $ 14,405
INTERNATIONAL FINANCE CORPORATION Page 61
The notes to consolidated financial statements are an integral part of these statements.
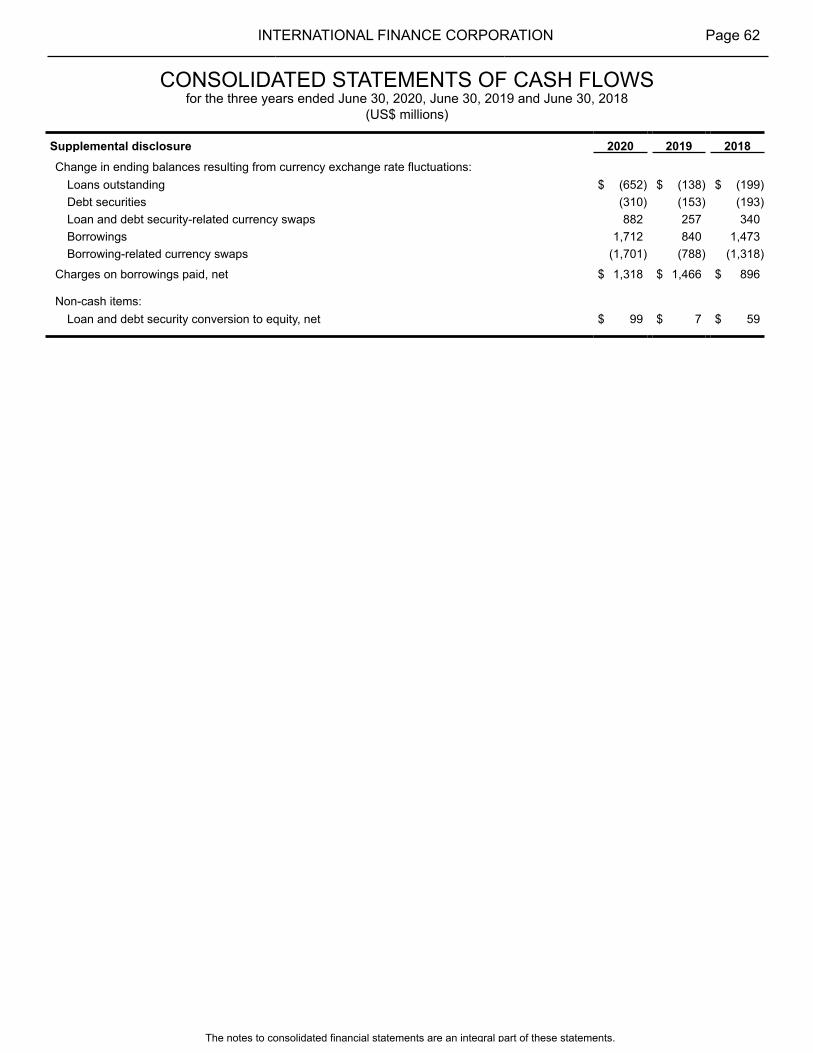
CONSOLIDATED STATEMENTS OF CASH FLOWSfor the three years ended June 30, 2020, June 30, 2019 and June 30, 2018
(US$ millions)
Supplemental disclosure 2020 2019 2018Change in ending balances resulting from currency exchange rate fluctuations:
Loans outstanding $ (652) $ (138) $ (199)Debt securities (310) (153) (193)Loan and debt security-related currency swaps 882 257 340Borrowings 1,712 840 1,473Borrowing-related currency swaps (1,701) (788) (1,318)
Charges on borrowings paid, net $ 1,318 $ 1,466 $ 896
Non-cash items:Loan and debt security conversion to equity, net $ 99 $ 7 $ 59
INTERNATIONAL FINANCE CORPORATION Page 62
The notes to consolidated financial statements are an integral part of these statements.

CONSOLIDATED STATEMENT OF CAPITAL STOCKAND VOTING POWER
as of June 30, 2020 (US$ thousands)Capital Stock Voting Power Capital Stock Voting Power
MembersAmount
paidPercentof total
Numberof votes
Percentof total Members
Amountpaid
Percentof total
Number ofvotes
Percentof total
Afghanistan 846 * 7,061 0.03 Egypt, Arab Republic of 102,017 0.52 108,232 0.52
Albania 9,927 0.05 16,142 0.08 El Salvador 221 * 6,436 0.03
Algeria 44,101 0.23 50,316 0.24 Equatorial Guinea 328 * 6,543 0.03
Angola 11,292 0.06 17,507 0.08 Eritrea 7,129 0.04 13,344 0.06
Antigua and Barbuda 99 * 6,314 0.03 Estonia 10,934 0.06 17,149 0.08
Argentina 323,320 1.65 329,535 1.59 Eswatini 5,215 0.03 11,430 0.06
Armenia 7,564 0.04 13,779 0.07 Ethiopia 968 * 7,183 0.03
Australia 360,864 1.84 367,079 1.77 Fiji 2,188 0.01 8,403 0.04
Austria 150,517 0.77 156,732 0.76 Finland 119,683 0.61 125,898 0.61
Azerbaijan 18,047 0.09 24,262 0.12 France 922,689 4.72 928,904 4.48
Bahamas, The 2,554 0.01 8,769 0.04 Gabon 9,668 0.05 15,883 0.08
Bahrain 13,313 0.07 19,528 0.09 Gambia, The 717 * 6,932 0.03
Bangladesh 73,440 0.38 79,655 0.38 Georgia 10,522 0.05 16,737 0.08
Barbados 2,752 0.01 8,967 0.04 Germany 982,870 5.02 989,085 4.77
Belarus 40,159 0.21 46,374 0.22 Ghana 42,286 0.22 48,501 0.23
Belgium 385,880 1.97 392,095 1.89 Greece 52,594 0.27 58,809 0.28
Belize 770 * 6,985 0.03 Grenada 564 * 6,779 0.03
Benin 907 * 7,122 0.03 Guatemala 8,265 0.04 14,480 0.07
Bhutan 5,490 0.03 11,705 0.06 Guinea 2,585 0.01 8,800 0.04
Bolivia 14,502 0.07 20,717 0.10 Guinea-Bissau 137 * 6,352 0.03
Bosnia and Herzegovina 4,727 0.02 10,942 0.05 Guyana 10,613 0.05 16,828 0.08
Botswana 862 * 7,077 0.03 Haiti 6,267 0.03 12,482 0.06
Brazil 423,812 2.17 430,027 2.08 Honduras 3,774 0.02 9,989 0.05
Bulgaria 37,620 0.19 43,835 0.21 Hungary 89,749 0.46 95,964 0.46
Burkina Faso 6,374 0.03 12,589 0.06 Iceland 320 * 6,535 0.03
Burundi 762 * 6,977 0.03 India 784,928 4.01 791,143 3.82
Cabo Verde 114 * 6,329 0.03 Indonesia 240,952 1.23 247,167 1.19
Cambodia 2,585 0.01 8,800 0.04 Iran, Islamic Republic of 11,010 0.06 17,225 0.08
Cameroon 6,748 0.03 12,963 0.06 Iraq 1,121 0.01 7,336 0.04
Canada 620,199 3.17 626,414 3.02 Ireland 9,836 0.05 16,051 0.08
Central African Republic 907 * 7,122 0.03 Israel 16,278 0.08 22,493 0.11
Chad 10,400 0.05 16,615 0.08 Italy 620,199 3.17 626,414 3.02
Chile 96,428 0.49 102,643 0.50 Jamaica 32,648 0.17 38,863 0.19
China 470,864 2.41 477,079 2.30 Japan 1,239,254 6.33 1,245,469 6.01
Colombia 104,137 0.53 110,352 0.53 Jordan 7,175 0.04 13,390 0.06
Comoros 107 * 6,322 0.03 Kazakhstan 35,355 0.18 41,570 0.20
Congo, Democratic Republic of 16,461 0.08 22,676 0.11 Kenya 30,811 0.16 37,026 0.18
Congo, Republic of 999 0.01 7,214 0.03 Kiribati 91 * 6,306 0.03
Costa Rica 7,259 0.04 13,474 0.07 Korea, Republic of 214,617 1.10 220,832 1.07
Cote d'Ivoire 27,022 0.14 33,237 0.16 Kosovo 11,086 0.06 17,301 0.08
Croatia 21,974 0.11 28,189 0.14 Kuwait 114,925 0.59 121,140 0.58
Cyprus 16,309 0.08 22,524 0.11 Kyrgyz Republic 13,114 0.07 19,329 0.09
Czech Republic 67,958 0.35 74,173 0.36 Lao People's DemocraticRepublic 2,120 0.01 8,335 0.04
Denmark 141,467 0.72 147,682 0.71 Latvia 16,393 0.08 22,608 0.11
Djibouti 160 * 6,375 0.03 Lebanon 1,029 0.01 7,244 0.03
Dominica 320 * 6,535 0.03 Lesotho 541 * 6,756 0.03
Dominican Republic 9,050 0.05 15,265 0.07 Liberia 633 * 6,848 0.03
Ecuador 16,477 0.08 22,692 0.11 Libya 419 * 6,634 0.03
INTERNATIONAL FINANCE CORPORATION Page 63
The notes to consolidated financial statements are an integral part of these statements.

CONSOLIDATED STATEMENT OF CAPITAL STOCKAND VOTING POWER
as of June 30, 2020 (US$ thousands)Capital Stock Voting Power Capital Stock Voting Power
MembersAmount
paidPercentof total
Numberof votes
Percentof total Members
Amountpaid
Percentof total
Number ofvotes
Percentof total
Lithuania 17,849 0.09 24,064 0.12 Saudi Arabia 389,144 1.99 395,359 1.91
Luxembourg 16,309 0.08 22,524 0.11 Senegal 17,529 0.09 23,744 0.11
Madagascar 3,294 0.02 9,509 0.05 Serbia 13,747 0.07 19,962 0.10
Malawi 13,892 0.07 20,107 0.10 Seychelles 206 * 6,421 0.03
Malaysia 126,614 0.65 132,829 0.64 Sierra Leone 1,700 0.01 7,915 0.04
Maldives 122 * 6,337 0.03 Singapore 1,350 0.01 7,565 0.04
Mali 3,439 0.02 9,654 0.05 Slovak Republic 33,983 0.17 40,198 0.19
Malta 12,314 0.06 18,529 0.09 Slovenia 12,085 0.06 18,300 0.09
Marshall Islands 5,055 0.03 11,270 0.05 Solomon Islands 282 * 6,497 0.03
Mauritania 1,632 0.01 7,847 0.04 Somalia 633 * 6,848 0.03
Mauritius 12,695 0.06 18,910 0.09 South Africa 132,805 0.68 139,020 0.67
Mexico 232,794 1.19 239,009 1.15 South Sudan 14,334 0.07 20,549 0.10
Micronesia, Federated States of 5,673 0.03 11,888 0.06 Spain 282,308 1.44 288,523 1.39
Moldova 9,089 0.05 15,304 0.07 Sri Lanka 57,116 0.29 63,331 0.31
Mongolia 1,098 0.01 7,313 0.04 St. Kitts and Nevis 4,864 0.02 11,079 0.05
Montenegro 7,891 0.04 14,106 0.07 St. Lucia 564 * 6,779 0.03
Morocco 73,463 0.38 79,678 0.38 Sudan 846 * 7,061 0.03
Mozambique 2,455 0.01 8,670 0.04 Suriname 4,727 0.02 10,942 0.05
Myanmar 5,078 0.03 11,293 0.05 Sweden 204,918 1.05 211,133 1.02
Namibia 3,080 0.02 9,295 0.04 Switzerland 335,962 1.72 342,177 1.65
Nepal 6,267 0.03 12,482 0.06 Syrian Arab Republic 1,479 0.01 7,694 0.04
Netherlands 427,976 2.19 434,191 2.10 Tajikistan 9,241 0.05 15,456 0.07
New Zealand 27,319 0.14 33,534 0.16 Tanzania 7,647 0.04 13,862 0.07
Nicaragua 5,452 0.03 11,667 0.06 Thailand 89,825 0.46 96,040 0.46
Niger 1,121 0.01 7,336 0.04 Timor-Leste 5,924 0.03 12,139 0.06
Nigeria 210,987 1.08 217,202 1.05 Togo 6,161 0.03 12,376 0.06
North Macedonia 4,087 0.02 10,302 0.05 Tonga 259 * 6,474 0.03
Norway 134,185 0.69 140,400 0.68 Trinidad and Tobago 31,352 0.16 37,567 0.18
Oman 9,050 0.05 15,265 0.07 Tunisia 27,189 0.14 33,404 0.16
Pakistan 162,343 0.83 168,558 0.81 Turkey 120,751 0.62 126,966 0.61
Palau 191 * 6,406 0.03 Turkmenistan 6,176 0.03 12,391 0.06
Panama 7,678 0.04 13,893 0.07 Tuvalu 520 * 6,735 0.03
Papua New Guinea 8,745 0.04 14,960 0.07 Uganda 5,604 0.03 11,819 0.06
Paraguay 3,324 0.02 9,539 0.05 Ukraine 77,458 0.40 83,673 0.40
Peru 63,841 0.33 70,056 0.34 United Arab Emirates 30,750 0.16 36,965 0.18
Philippines 104,137 0.53 110,352 0.53 United Kingdom 922,689 4.72 928,904 4.48
Poland 57,985 0.30 64,200 0.31 United States 4,341,278 22.19 4,347,493 20.99
Portugal 63,467 0.32 69,682 0.34 Uruguay 27,212 0.14 33,427 0.16
Qatar 12,581 0.06 18,796 0.09 Uzbekistan 29,530 0.15 35,745 0.17
Romania 32,618 0.17 38,833 0.19 Vanuatu 419 * 6,634 0.03
Russian Federation 784,211 4.01 790,426 3.82 Venezuela, RepublicaBolivariana de 210,347 1.08 216,562 1.05
Rwanda 2,333 0.01 8,548 0.04 Vietnam 3,401 0.02 9,616 0.05
Samoa 267 * 6,482 0.03 Yemen, Republic of 5,452 0.03 11,667 0.06
Sao Tome and Principe 3,347 0.02 9,562 0.05 Zambia 9,805 0.05 16,020 0.08
* Less than 0.005 percent Zimbabwe 24,513 0.13 30,728 0.15
** May differ from the sum of individual percentages shown because of rounding Total June 30, 2020 19,566,717 100.00** 20,716,492 100.00**
Total June 30, 2019 2,566,199 100.00** 2,717,079 100.00**
INTERNATIONAL FINANCE CORPORATION Page 64
The notes to consolidated financial statements are an integral part of these statements.

INTERNATIONAL FINANCE CORPORATION Page 65
NOTES TO CONSOLIDATED FINANCIAL STATEMENTS
PURPOSE
The International Finance Corporation (IFC), an international organization, was established in 1956 to further economic development in its member countriesby encouraging the growth of private enterprise. IFC is a member of the World Bank Group (WBG), which also comprises the International Bank forReconstruction and Development (IBRD), the International Development Association (IDA), the Multilateral Investment Guarantee Agency (MIGA), and theInternational Centre for Settlement of Investment Disputes (ICSID). Each member is legally and financially independent. Transactions with other WBGmembers are disclosed in the notes that follow. IFC’s activities are closely coordinated with and complement the overall development objectives of the otherWBG institutions. IFC, together with private investors, assists in financing the establishment, improvement and expansion of private sector enterprises bymaking loans, equity investments and investments in debt securities where sufficient private capital is not otherwise available on reasonable terms. IFC’sshare capital is provided by its member countries. It raises most of the funds for its investment activities through the issuance of notes, bonds and otherdebt securities in the international capital markets. IFC also plays a catalytic role in mobilizing additional funding from other investors and lenders throughparallel loans, loan participations, partial credit guarantees, securitizations, loan sales, risk sharing facilities, and fund investments through the AMC9 andother IFC crisis initiatives. In addition to project finance and mobilization, IFC offers an array of financial and technical advisory services to private businessesin the developing world to increase their chances of success. It also advises governments on how to create an environment hospitable to the growth ofprivate enterprise and foreign investment.
NOTE A - SUMMARY OF SIGNIFICANT ACCOUNTING AND RELATED POLICIES
The consolidated financial statements include the financial statements of IFC and its consolidated subsidiary as detailed in Note B. Theaccounting and reporting policies of IFC conform with accounting principles generally accepted in the United States of America (US GAAP).In the opinion of management, the consolidated financial statements reflect all adjustments necessary for the fair presentation of IFC’sfinancial position and results of operations.
Consolidated Financial Statements presentation - Certain amounts in prior years have been changed to conform to the current year’spresentation. IFC classifies cash and due from banks and time deposits (collectively, cash and cash equivalents) as cash and as cashequivalents in the consolidated statement of cash flows because they are generally readily convertible to known amounts of cash withinthree months of acquisition generally when the original maturities for such instruments are under three months (or in some cases are undersix months when the time deposit is optionally redeemable within three months). IFC has revised the presentation of certain time depositsin the amount of $4,727 million to exclude from “Cash and cash equivalents” and include in “Change in trading securities and time depositswith maturities greater than three months” in the statement of cash flows for the year ended June 30, 2019 to correct the classification ofsuch time deposits with maturities greater than three months as “cash equivalents". The correction also changed the net cash (used in)provided by operating activities, the change in cash and cash equivalents, the net change in cash and cash equivalents and the endingcash and cash equivalents by $4,727 million in the consolidated statement of cash flows for that period.
Functional currency - IFC’s functional currency is the United States dollar (US dollars or $).
Use of estimates - The preparation of the consolidated financial statements requires management to make estimates and assumptionsthat affect the reported amounts of assets and liabilities and disclosure of contingent assets and liabilities at the date of the consolidatedfinancial statements and the reported amounts of income and expense during the reporting periods. Actual results could differ from theseestimates. A significant degree of judgment has been used in the determination of: the reserve against losses on loans and impairmentof debt securities; estimated fair values of financial instruments accounted for at fair value (including equity investments, debt securities,loans, trading securities and derivative instruments); projected pension benefit obligations, fair value of pension and other postretirementbenefit plan assets, and net periodic pension income or expense. There are inherent risks and uncertainties related to IFC’s operations.The possibility exists that changing economic conditions could have an adverse effect on the financial position of IFC.
IFC uses internal models to determine the fair values of derivative and other financial instruments and the aggregate level of the reserveagainst losses on loans and impairment of debt securities. IFC undertakes continuous review and analysis of these models with theobjective of refining its estimates, consistent with evolving best practices appropriate to its operations. Changes in estimates resulting fromrefinements in the assumptions and methodologies incorporated in the models are reflected in net income in the period in which theenhanced models are first applied.
Consolidation, non-controlling interests and variable interest entities - IFC consolidates:i) all majority-owned subsidiaries;ii) limited partnerships in which it is the general partner, unless the presumption of control is overcome by certain management participation
or other rights held by minority shareholders/limited partners; andiii) variable interest entities (VIEs) for which IFC is deemed to be the VIE's primary beneficiary (together, consolidated subsidiaries).
Significant intercompany accounts and transactions are eliminated in consolidation.
An entity is a VIE if:i) its equity is not sufficient to permit the entity to finance its activities without additional subordinated financial support from other parties;ii) its equity investors do not have decision-making rights about the entity's operations; or
9 Effective January 31, 2020, IFC Asset Management Company, LLC (AMC) was merged into IFC. IFC, as the successor to AMC, has assumed all the assets, rights, liabilitiesand obligations of AMC. The AMC business is now operated as a division within IFC. This change did not have a significant impact on IFC's financial position, results ofoperations or cash flows.

iii) its equity investors do not absorb the expected losses or receive the expected returns of the entity proportionally to their voting rights.
A variable interest is a contractual, ownership or other interest whose value changes as the fair value of the VIE's net assets change. IFC'svariable interests in VIEs arise from financial instruments, service contracts, guarantees, leases or other monetary interests in thoseentities.
IFC is considered to be the primary beneficiary of a VIE if it has the power to direct the VIE's activities that most significantly impact itseconomic performance and the obligation to absorb losses of or the right to receive benefits from the VIE that could potentially be significantto the VIE.
Fair Value Option - IFC has elected the Fair Value Option under the subsections of ASC Topic 825, Financial Instruments (ASC 825 orthe Fair Value Option) for several of its financial assets and financial liabilities. ASC 825 permits the measurement of eligible financialassets, financial liabilities and firm commitments at fair value on an instrument-by-instrument basis, that are not otherwise permitted to beaccounted for at fair value under other accounting standards. The election to use the Fair Value Option is available when an entity firstrecognizes a financial asset or liability or upon entering into a firm commitment.
IFC has elected the Fair Value Option (FVO) for the following financial assets and financial liabilities:i) direct equity investments which give IFC significant influence, which in the absence of FVO, would have to be accounted for under
equity method and all other all other financial interests in the investee (e.g., guarantees, loans)ii) all market borrowings that are economically hedged with financial instruments accounted for at fair value with changes therein reported
in earnings;iii) borrowings from IDA;
effective July 1, 2018:iv) substantially all investments in debt securities; andv) substantially all hybrid instruments in the loan investment portfolio;
All borrowings for which the Fair Value Option has been elected are economically hedged with derivative or other financial instrumentsaccounted for at fair value with changes in fair value reported in earnings as such changes occur. Measuring at fair value those borrowingsfor which the Fair Value Option has been elected mitigates the earnings volatility that would otherwise occur, due to measuring the borrowingsand related economic hedges differently, without having to apply ASC Topic 815, Derivatives and Hedging (ASC 815)'s complex hedgeaccounting requirements.
Measuring at fair value those equity investments that would otherwise require equity method accounting simplifies the accounting andrenders a carrying amount on the consolidated balance sheet based on a measure (fair value) that IFC considers preferable to equitymethod accounting. For the investments that otherwise would require equity method accounting for which the Fair Value Option is elected,ASC 825 requires the Fair Value Option to also be applied to all eligible financial interests in the same entity. IFC has disbursed loans andissued guarantees to some of those investees; therefore, the Fair Value Option is also applied to those loans and issued guarantees. IFCelected the Fair Value Option for equity investments, through June 30, 2018, with 20% or more ownership where it did not have significantinfluence so that the same measurement method (fair value) was applied to all equity investments with more than 20% ownership.
The FVO was elected through June 30, 2018, for certain hybrid instruments in the investment portfolio that would have otherwise requiredbifurcation of the host and embedded derivative. Election of the FVO for these instruments eliminated the bifurcation requirement.
The FVO has been elected for substantially all investments in debt securities and hybrid loan instruments recognized after June 30, 2018.Among other things, measuring all investments in debt securities and hybrid loan instruments at fair value eliminates the requirement tobifurcate the host and embedded derivative that may have otherwise applied in certain instances, results in more accounting consistencyacross IFC’s investment portfolio and results in a measurement method that is consistent with the manner in which the portfolio is managed.
Fair Value Measurements
IFC has adopted FASB Accounting Standards Codification (ASC) Topic 820, Fair Value Measurements and Disclosures (ASC 820). ASC820 defines fair value, establishes a framework for measuring fair value and a fair value hierarchy that prioritizes the inputs to valuationtechniques used to measure fair value into three broad levels and applies to all items measured at fair value, including items for whichimpairment measures are based on fair value.ASC 820 defines fair value as the price that would be received to sell an asset or transfer a liability (i.e., an exit price) in an orderlytransaction between independent, knowledgeable and willing market participants at the measurement date assuming the transaction occursin the entity’s principal (or most advantageous) market. Fair value must be based on assumptions market participants would use (inputs)in determining the price and measured assuming that market participants act in their economic best interest, therefore, their fair valuesare determined based on a transaction to sell or transfer the asset or liability on a standalone basis. Under ASC 820, fair value measurementsare not adjusted for transaction costs.
INTERNATIONAL FINANCE CORPORATION Page 66
NOTES TO CONSOLIDATED FINANCIAL STATEMENTS
NOTE A – SUMMARY OF SIGNIFICANT ACCOUNTING AND RELATED POLICIES (continued)

ASC 820 established a fair value hierarchy which gives the highest priority to unadjusted quoted prices in active markets for identicalunrestricted assets and liabilities (Level 1), the next highest priority to observable market based inputs or unobservable inputs that arecorroborated by market data from independent sources (Level 2) and the lowest priority to unobservable inputs that are not corroboratedby market data (Level 3). Fair value measurements are required to maximize the use of available observable inputs.
Level 1: Unadjusted quoted prices in active markets for identical assets or liabilities accessible to the reporting entity at the measurementdate.
Level 2: Other than quoted prices included in Level 1, inputs that are observable for the asset or liability, either directly or indirectly forsubstantially the full term of the asset or liability. It includes quoted prices for similar assets or liabilities in active markets, quoted pricesfor identical or similar assets or liabilities in markets that are not active, and financial instruments that are valued using models and othervaluation methodologies. These models consider various assumptions and inputs, including time value, yield curves, volatility factors,prepayment speeds, default rates, loss severity and current market and contractual pricing for the underlying asset, as well as other relevanteconomic measures. Substantially all of these inputs are observable in the market place, can be derived from observable data or aresupported by observable levels at which market transactions are executed.
Level 3: Unobservable inputs for the asset or liability used to measure fair value to the extent that observable inputs are not available,thereby allowing for situations in which there is little, if any, market activity for the asset or liability at the measurement date. It consists offinancial instruments whose fair value is estimated based on internally developed models or methodologies utilizing significant inputs thatare non-observable. It also includes financial instruments whose fair value is estimated based on price information from independentsources that cannot be corroborated by observable market data.
IFC’s policy is to recognize transfers in and transfers out of levels as of the end of the reporting period in which they occur.
IFC estimates the fair value of its investments in private equity funds that do not have readily determinable fair value based on the funds’net asset values (NAVs) per share as a practical expedient to the extent that a fund reports its investment assets at fair value and has allthe attributes of an investment company, pursuant to ASC Topic 946, Financial Services - Investment Companies (ASC 946). If the NAVis not as of IFC’s measurement date, IFC adjusts the most recent NAV, as necessary, to estimate a NAV for the investment that is calculatedin a manner consistent with the fair value measurement principles established by ASC 820.
Remeasurement of foreign currency transactions - Monetary assets and liabilities not denominated in US dollars, are expressed inUS dollars at the exchange rates prevailing at June 30, 2020 and June 30, 2019. Income and expenses are recorded based on the ratesof exchange prevailing at the time of the transaction. Transaction gains and losses are credited or charged to income.
Loans - IFC originates loans to facilitate project finance, restructuring, refinancing, corporate finance, and/or other developmental objectives.Loans are recorded as assets when disbursed. Loans are generally carried at the principal amounts outstanding adjusted for net unamortizedloan origination costs and fees. It is IFC’s practice to obtain collateral security such as, but not limited to, mortgages and third-partyguarantees.
Certain loans are carried at fair value in accordance with the Fair Value Option as discussed above. Unrealized gains and losses on loansaccounted for at fair value under the Fair Value Option are reported in Net unrealized gains and losses on non-trading financial instrumentsaccounted for at fair value on the consolidated statement of operations.
Certain loans originated by IFC contain income participation, prepayment and conversion features. These features are bifurcated andseparately accounted for in accordance with ASC 815 if IFC has not elected the Fair Value Option for the loan host contracts and thefeatures meet the definition of a derivative and are not considered to be clearly and closely related to their host loan contracts. Otherwise,these features are accounted for as part of their host loan contracts in accordance with IFC’s accounting policies for loans as indicatedherein.
Revenue recognition on loans - Interest income and commitment fees on loans are recorded as income on an accrual basis. Loanorigination fees and direct loan origination costs are deferred and amortized over the estimated life of the originated loan; such amortizationis determined using the interest method unless the loan is a revolving credit facility in which case amortization is determined using thestraight-line method. Prepayment fees are recorded as income when received.
IFC does not recognize income on loans where collectability is in doubt or payments of interest or principal are past due more than 60days unless management anticipates that collection of interest will occur in the near future. Any interest accrued on a loan placed innonaccrual status is reversed out of income and is thereafter recognized as income only when the actual payment is received. Interestnot previously recognized but capitalized as part of a debt restructuring is recorded as deferred income, included in the consolidatedbalance sheet in payables and other liabilities, and credited to income only when the related principal is received. Such capitalized interestis considered in the computation of the reserve against losses on loans in the consolidated balance sheet.
Reserve against losses on loans - IFC recognizes impairment on loans not carried at fair value in the consolidated balance sheet throughthe reserve against losses on loans, recording a provision or release of provision for losses on loans in net income, which increases or
INTERNATIONAL FINANCE CORPORATION Page 67
NOTES TO CONSOLIDATED FINANCIAL STATEMENTS
NOTE A – SUMMARY OF SIGNIFICANT ACCOUNTING AND RELATED POLICIES (continued)

decreases the reserve against losses on loans. Individually impaired loans are measured based on the present value of expected futurecash flows to be received, observable market prices, or for loans that are dependent on collateral for repayment, the estimated fair valueof the collateral.
The reserve against losses on loans reflects management’s estimates of both identified probable losses on individual loans (specificreserves) and probable losses inherent in the portfolio but not specifically identifiable (portfolio reserves). The determination of identifiedprobable losses represents management’s judgment of the creditworthiness of the borrower. Reserves against losses are establishedthrough a review of individual loans undertaken on a quarterly basis. IFC considers a loan as impaired when, based on current informationand events, it is probable that IFC will be unable to collect all amounts due according to the loan’s contractual terms. Information andevents, with respect to the borrower and/or the economic and political environment in which it operates, considered in determining that aloan is impaired include, but are not limited to, the borrower’s financial difficulties, breach of contract, bankruptcy/reorganization, creditrating downgrade as well as geopolitical conflict, financial/economic crisis, commodity price decline, adverse local government action andnatural disaster. Unidentified probable losses are the losses incurred at the reporting date that have not yet been specifically identified.The risks inherent in the portfolio that are considered in determining unidentified probable losses are those proven to exist by past experienceand include: country systemic risk; the risk of correlation or contagion of losses between markets; uninsured and uninsurable risks;nonperformance under guarantees and support agreements; and opacity of, or misrepresentation in, financial statements.
For purposes of providing certain disclosures about IFC’s entire reserve against losses on loans, IFC considers its entire loan portfolio tocomprise one portfolio segment. A portfolio segment is the level at which the method for estimating the reserve against losses on loans isdeveloped and documented.
Loans are written-off when IFC has exhausted all possible means of recovery, by reducing the reserve against losses on loans. Suchreductions in the reserve are partially offset by recoveries, if any, associated with previously written-off loans.
Equity investments - IFC invests primarily for developmental impact; IFC does not seek to take operational, controlling, or strategic equitypositions within its investees. Equity investments are acquired through direct ownership of equity instruments of investees, as a limitedpartner in LLPs and LLCs, and/or as an investor in private equity funds.
Pursuant to Accounting Standards Update 2016-01, Recognition and Measurement of Financial Assets and Financial Liabilities (ASU2016-01) and ASC Topic 321, Investments - Equity Securities (ASC 321), effective July 1, 2018 all equity investments are measured atfair value, with unrealized gains and losses reported in earnings.
IFC’s investments in certain private equity funds in which IFC is deemed to have a controlling financial interest, are consolidated by IFC,as the presumption of control by the fund manager or the general partner has been overcome. Certain equity investments, for whichrecovery of invested capital is uncertain, are accounted for under the cost recovery method, such that receipts are first applied to recoveryof invested capital and then to income from equity investments. The cost recovery method is applied to IFC's investments in its naturalresources unincorporated joint ventures (UJVs). IFC’s share of conditional asset retirement obligations related to investments in UJVsare recorded when the fair value of the obligations can be reasonably estimated. The obligations are capitalized and systematicallyamortized over the estimated economic useful lives.
Unrealized gains and losses on equity investments accounted for at fair value are reported in income from equity investments and associatedderivatives on the consolidated statements of operations. Unrealized gains and losses on equity investments which were accounted foras available-for-sale were reported in other comprehensive income. Realized gains on the sale or redemption of equity investments aremeasured against the average cost of the investments sold.
Dividends on listed equity investments are recorded on the ex-dividend date, and dividends on unlisted equity investments are recordedupon receipt of notice of declaration. Realized gains on listed equity investments are recorded upon trade date, and realized gains onunlisted equity investments are recorded upon incurring the obligation to deliver the applicable shares. Losses are recognized whenincurred.
IFC enters into put options, call options and warrant agreements in connection with equity investments; these are accounted for in accordancewith ASC 815 to the extent they meet the definition of a derivative. Put options, call options and warrant agreements that do not meet thedefinition of a derivative are measured at fair value with unrealized gains and losses recognized in earnings in accordance with ASU2016-01 and included in “Equity investments” on the consolidated balance sheets.
Gains and losses on debt conversions and exchanges of equity interests - Loan and debt security conversions to equity interestsare based on the fair value of the equity interests received. Transfers of equity interests in exchange for equity interests in other entitiesand other non-cash transactions are generally accounted for based on the fair value of the asset relinquished unless the fair value of theasset received is more clearly evident in which case the accounting is based on the fair value of the asset received. The difference betweenthe fair value of the asset received and the recorded amount of the asset relinquished is recorded as a gain or loss in the consolidatedstatements of operations.
INTERNATIONAL FINANCE CORPORATION Page 68
NOTES TO CONSOLIDATED FINANCIAL STATEMENTS
NOTE A – SUMMARY OF SIGNIFICANT ACCOUNTING AND RELATED POLICIES (continued)
Debt securities - Debt securities in the investment portfolio classified as available-for-sale are carried at fair value on the consolidatedbalance sheets with unrealized gains and losses included in accumulated other comprehensive income until realized.
Unrealized gains and losses on debt securities accounted for at fair value under the Fair Value Option are reported in “Net unrealizedgains and losses on non-trading financial instruments accounted for at fair value” on the consolidated statements of operations.
IFC invests in certain debt securities with conversion features; if the hybrid instrument is not measured at fair value with unrealized gainsand losses reported in earnings, these features are accounted for in accordance with ASC 815 to the extent they meet the definition of aderivative.
Impairment of debt securities - In determining whether an unrealized loss on debt securities classified as available-for-sale is other-than-temporary, IFC considers all relevant information including the length of time and the extent to which fair value has been less thanamortized cost, whether IFC intends to sell the debt security or whether it is more likely than not that IFC will be required to sell the debtsecurity, the payment structure of the obligation and the ability of the issuer to make scheduled interest or principal payments, any changesto the ratings of a security, and relevant adverse conditions specifically related to the security, an industry or geographic sector.
Debt securities in the investment portfolio classified as available-for-sale are assessed for impairment each quarter. When impairment isidentified, the entire impairment is recognized in net income if (1) IFC intends to sell the security, or (2) it is more likely than not that IFCwill be required to sell the security before recovery. However, if IFC does not intend to sell the security and it is not more likely than notthat IFC will be required to sell the security but the security has a credit loss, the impairment charge will be separated into the credit losscomponent, which is recognized in net income, and the remainder which is recorded in other comprehensive income. The impaired valuebecomes the new amortized cost basis of the debt security. Subsequent fair value increases and decreases in the fair value of debtsecurities, if not an additional other-than-temporary impairment, are included in other comprehensive income.
The difference between the new amortized cost basis of debt securities for which an other-than-temporary impairment has been recognizedin net income and the cash flows expected to be collected is accreted to interest income using the effective yield method. Significantsubsequent increases in the expected or actual cash flows previously expected are recognized as a prospective adjustment of the yield.
Guarantees - IFC extends financial guarantee facilities to its clients to provide credit enhancement for their debt security issuances andloan obligations. As part of these financial guarantee facilities, IFC offers partial credit guarantees to clients covering, on a risk-sharingbasis, client obligations on bonds or loans. Under the terms of IFC's guarantees, IFC agrees to assume responsibility for the client’sfinancial obligations in the event of default by the client (i.e., failure to pay when payment is due). Guarantees are regarded as issuedwhen IFC commits to the guarantee. Guarantees are regarded as outstanding when the underlying financial obligation of the client isincurred, and this date is considered to be the “inception” of the guarantee. Guarantees are regarded as called when IFC’s obligationunder the guarantee has been invoked. There are two liabilities associated with the guarantees: (i) the stand-ready obligation to performand (ii) the contingent liability. The fair value of the stand-ready obligation to perform is recognized at the inception of the guarantee unlessa contingent liability exists at that time or is expected to exist in the near term. The contingent liability associated with the financial guaranteeis recognized when it is probable the guarantee will be called and when the amount of guarantee called can be reasonably estimated.Guarantee fees are recorded in income as the stand-ready obligation to perform is fulfilled. Commitment fees on guarantees are recordedas income on an accrual basis. All liabilities associated with guarantees are included in payables and other liabilities, and the receivablesare included in other assets on the consolidated balance sheet.
Designations of retained earnings - IFC establishes funding mechanisms for specific Board approved purposes through designationsof retained earnings. Designations of retained earnings for grants to IDA are recorded as a transfer from undesignated retained earningsto designated retained earnings when the designation is noted with approval by the Board of Governors. All other designations are recordedas a transfer from undesignated retained earnings to designated retained earnings when the designation is approved by the Board ofDirectors.
Expenditures resulting from such designations are recorded as expenses in IFC’s consolidated statement of operations in the year in whichthey are incurred and reduces the respective designated retained earnings for such purposes. Expenditures are deemed to have beenincurred when IFC has ceded control of the funds to the recipient.
Liquid asset portfolio - The liquid asset portfolio, as defined by IFC, consists of: time deposits and securities; related derivative instruments;securities purchased under resale agreements and receivable for cash collateral pledged, securities sold under repurchase agreementsand payable for cash collateral received; receivables from sales of securities and payables for purchases of securities; and related accruedincome and charges. IFC’s liquid funds are invested in government, agency and government-sponsored agency obligations, time depositsand asset-backed, including mortgage-backed, securities. Government and agency obligations include positions in high quality fixed ratebonds, notes, bills, and other obligations issued or unconditionally guaranteed by governments of countries or other official entities includinggovernment agencies and instrumentalities or by multilateral organizations. Asset-backed and mortgage-backed securities include agencyand non-agency residential mortgage-backed securities, commercial mortgage-backed securities, consumer, auto and student loan-backedsecurities, commercial real estate collateralized debt obligations and collateralized loan obligations.
INTERNATIONAL FINANCE CORPORATION Page 69
NOTES TO CONSOLIDATED FINANCIAL STATEMENTS
NOTE A – SUMMARY OF SIGNIFICANT ACCOUNTING AND RELATED POLICIES (continued)
Securities and related derivative instruments within IFC’s liquid asset portfolio are classified as trading and are carried at fair value withany changes in fair value reported in income from liquid asset trading activities. Interest on securities and amortization of premiums andaccretion of discounts are also reported in income from liquid asset trading activities. Gains and losses realized on the sale of tradingsecurities are computed on a specific security basis.
IFC classifies cash and due from banks and time deposits (collectively, cash and cash equivalents) as cash and as cash equivalents inthe consolidated statement of cash flows because they are generally readily convertible to known amounts of cash within three monthsof acquisition generally when the original maturities for such instruments are under three months (or in some cases are under six monthswhen the time deposit is optionally redeemable within three months). Time deposits with maturities greater than three months and thereforenot considered cash equivalents as of June 30, 2020 and 2019, total $2,009 million and $4,727 million, respectively, and are included inthe “Change in trading securities and time deposits with maturities greater than three months” line in the consolidated statements of cashflows.
Repurchase, resale and securities lending agreements - Repurchase agreements are contracts under which a party sells securitiesand simultaneously agrees to repurchase the same securities at a specified future date at a fixed price. Resale agreements are contractsunder which a party purchases securities and simultaneously agrees to resell the same securities at a specified future date at a fixed price.Securities lending agreements are similar to repurchase agreements except that the securities loaned are securities that IFC has receivedas collateral under unrelated agreements and allowed by contract to rehypothecate. Amounts due under securities lending agreementsare included in securities sold under repurchase agreements and payable for cash collateral received on the consolidated balance sheet.
It is IFC’s policy to take possession of securities purchased under resale agreements, which are primarily liquid government securities.The market value of these securities is monitored and, within parameters defined in the agreements, additional collateral is obtained whentheir value declines. IFC also monitors its exposure with respect to securities sold under repurchase agreements and, in accordance withthe terms of the agreements, requests the return of excess securities held by the counterparty when their value increases.
Repurchase, resale and securities lending agreements are accounted for as collateralized financing transactions and recorded at theamount at which the securities were acquired or sold plus accrued interest.
Borrowings - To diversify its access to funding, and reduce its borrowing costs, IFC borrows in a variety of currencies and uses a numberof borrowing structures, including foreign exchange rate-linked, inverse floating rate and zero coupon notes. In managing the currencyexposure inherent in borrowing in a variety of currencies, generally, IFC either simultaneously converts such borrowings into variable rateUS dollar borrowings through the use of currency and interest rate swap transactions or utilizes liquid asset portfolio or debt investmentsdenominated in the same currency to economically hedge changes in the fair value of certain borrowings. Under certain outstandingborrowing agreements, IFC is not permitted to mortgage or allow a lien to be placed on its assets (other than purchase money securityinterests) without extending equivalent security to the holders of such borrowings. Interest on borrowings and amortization of premiumsand accretion of discounts are reported in charges on borrowings.
Substantially all borrowings are carried at fair value under the Fair Value Option. All changes in the fair value of such borrowings throughJune 30, 2018 were reported in “Net unrealized gains and losses on non-trading financial instruments accounted for at fair value” in theconsolidated statement of operations. Effective July 1, 2018, in accordance with ASU 2016-01, the change in the fair value of theseborrowings resulting from changes in instrument-specific credit risk is reported in other comprehensive income, while the remaining changein fair value is reported in “Net unrealized gains and losses on non-trading financial instruments accounted for at fair value” in the consolidatedstatement of operations.
Risk management and use of derivative instruments - IFC enters into transactions in various derivative instruments primarily for financialrisk management purposes in connection with its principal business activities, including lending, investing in debt securities and equityinvestments, client risk management, borrowing, liquid asset portfolio management and asset and liability management. There are noderivatives designated as accounting hedges.
All derivative instruments are recorded on the consolidated balance sheet at fair value as derivative assets or derivative liabilities. Wherethey are not clearly and closely related to the host contract, certain derivative instruments embedded in loans, debt securities and equityinvestments are bifurcated from the host contract and recorded at fair value as derivative assets or liabilities unless the hybrid instrumentis accounted for at fair value with any changes in fair value reported in income. The fair value at inception of such embedded derivativesis excluded from the carrying amount of the host contracts on the consolidated balance sheet. Changes in fair values of derivative instrumentsused in the liquid asset portfolio are recorded in income from liquid asset trading activities. Changes in fair values of derivative instrumentsother than those in the liquid asset portfolio are recorded in net unrealized gains and losses on non-trading financial instruments accountedfor at fair value. The risk management policy for each of IFC’s principal business activities and the accounting policies particular to themare described below.
Lending activities IFC’s policy is to closely match the currency, interest rate basis, and maturity of its loans and borrowings. Derivativeinstruments are used to convert the cash flows from fixed rate US dollar or non-US dollar loans into variable rate US dollars. Changes infair value of all derivatives associated with these activities are reported in net income in ”Net unrealized gains and losses on non-trading
INTERNATIONAL FINANCE CORPORATION Page 70
NOTES TO CONSOLIDATED FINANCIAL STATEMENTS
NOTE A – SUMMARY OF SIGNIFICANT ACCOUNTING AND RELATED POLICIES (continued)

financial instruments accounted for at fair value,” in the consolidated statements of operations. Realized gains and losses associated withthese activities are reported in “Income from loans and guarantees, including realized gains and losses on loans and associated derivatives.
Client risk management activities IFC enters into derivatives transactions with its clients to help them hedge their own currency, interestrate, or commodity risk, which, in turn, improves the overall quality of IFC’s loan portfolio. To hedge the market risks that arise from thesetransactions with clients, IFC enters into offsetting derivative transactions with matching terms with authorized market counterparties.Changes in fair value of all derivatives associated with these activities are reported in net income in "Net unrealized gains and losses onnon-trading financial instruments accounted for at fair value", in the consolidated statements of operations.” Realized gains and lossesassociated with these activities are reported in “Other Income”, in the consolidated statements of operations.
Borrowing activities IFC issues debt securities in various capital markets with the objectives of minimizing its borrowing costs, diversifyingfunding sources, and developing member countries’ capital markets, sometimes using complex structures. These structures includeborrowings payable in multiple currencies, or borrowings with principal and/or interest determined by reference to a specified index suchas a stock market index, a reference interest rate, a commodity index, or one or more foreign exchange rates. IFC generally uses derivativeinstruments with matching terms, primarily currency and interest rate swaps, to convert certain of such borrowings into variable rate USdollar obligations, consistent with IFC’s matched funding policy. IFC elects to carry at fair value, under the Fair Value Option, all marketborrowings for which a derivative instrument, liquid asset portfolio investment or debt investment is used to create an economic hedge.Changes in the fair value of such borrowings and the associated derivatives are reported in "Net unrealized gains and losses on non-trading financial instruments accounted for at fair value" in the consolidated statements of operations. Realized gains and losses associatedwith these activities are reported in “Charges on borrowings”, in the consolidated statements of operations.
Liquid asset portfolio management activities IFC manages the interest rate, currency and other market risks associated with certain ofthe time deposits and securities in its liquid asset portfolio by entering into derivative transactions to convert the cash flows from thoseinstruments into variable rate US dollars or by utilizing market borrowings denominated in the same currency to economically hedgechanges in the fair value of certain liquid asset portfolio investments. The derivative instruments used include short-term, over-the-counterforeign exchange forwards (covered forwards), interest rate and currency swaps, and exchange-traded interest rate futures and options.As the entire liquid asset portfolio is classified as trading portfolio, all securities (including derivatives) are carried at fair value with changesin fair value reported in "Income from liquid asset trading activities" in the consolidated statements of operations.
Asset and liability management In addition to the risk managed in the context of its business activities detailed above, IFC faces residualmarket risk in its overall asset and liability management. Residual currency risk is managed by monitoring the aggregate position in eachlending currency and reducing the net excess asset or liability position through sales or purchases of currency. Interest rate risk arisingfrom mismatches due to write-downs, prepayments and reschedulings, and residual reset date mismatches is monitored by measuringthe sensitivity of the present value of assets and liabilities in each currency to each basis point change in interest rates.
IFC monitors the credit risk associated with these activities by careful assessment and monitoring of prospective and actual clients andcounterparties. In respect of liquid assets and derivatives transactions, credit risk is managed by establishing exposure limits based onthe credit rating and size of the individual counterparty. In addition, IFC has entered into master agreements with its derivative marketcounterparties governing derivative transactions that contain close-out and netting provisions and collateral arrangements. Under theseagreements, if the credit exposure to one of the parties to the agreement, on a mark-to-market basis, exceeds a specified level, that partymust post collateral to cover the excess, generally in the form of liquid government securities or cash. IFC does not offset the fair valueamounts of derivatives and obligations to return, or rights to receive, cash collateral associated with these master-netting agreements.Changes in fair value of all derivatives associated with these activities are reported in net income in ”Net unrealized gains and losses onnon-trading financial instruments accounted for at fair value,” in the consolidated statements of operations. Realized gains and lossesassociated with these activities are reported in “Other income”, in the consolidated statements of operations.
Loan participations - IFC mobilizes funds from commercial banks and other financial institutions (Participants) by facilitating loanparticipations, without recourse. These loan participations are administered and serviced by IFC on behalf of the Participants. Thedisbursed and outstanding balances of loan participations that meet the applicable accounting criteria are accounted for as sales and arenot included in IFC’s consolidated balance sheet. All other loan participations are accounted for as secured borrowings; the participatedloans are included in loans on IFC’s consolidated balance sheets, with the related secured borrowings included in payables and otherliabilities on IFC’s consolidated balance sheets.
Advisory services - Funding received for IFC advisory services from governments and other donors are recognized as contributionrevenue when the conditions on which they depend are substantially met. Advisory services expenses are recognized in the period incurred.Advisory client fees and administration fees are recognized as income when earned. See Notes S and U.
Pension and other postretirement benefits - IBRD sponsors a Staff Retirement Plan (SRP), a Retired Staff Benefits Plan (RSBP) anda Post-Employment Benefits Plan (PEBP) that are defined benefit plans and cover substantially all of its staff members as well as the staffof IFC and of MIGA.
INTERNATIONAL FINANCE CORPORATION Page 71
NOTES TO CONSOLIDATED FINANCIAL STATEMENTS
NOTE A – SUMMARY OF SIGNIFICANT ACCOUNTING AND RELATED POLICIES (continued)

The SRP provides regular pension benefits and includes a cash balance plan. The RSBP provides certain health and life insurance benefitsto eligible retirees. The PEBP provides pension benefits administered outside the SRP. All costs associated with these plans are allocatedbetween IBRD, IFC, and MIGA based upon their employees’ respective participation in the plans. In addition, IFC and MIGA reimburseIBRD for their share of any contributions made to these plans by IBRD.
In accordance with ASU 2017-07, the service cost component of the net periodic benefit costs allocated to IFC is included in “Administrativeexpenses” in the consolidated statement of operations. The remaining components of the net periodic benefit costs allocated to IFC areincluded in “Other” in the consolidated statement of operations. IFC includes a receivable from IBRD in receivables and other assets,representing prepaid pension and other postretirement benefit costs.
Recently adopted accounting standards - In May 2014, the FASB issued ASU 2014-09, Revenue from Contracts with Customers (ASU2014-09). ASU 2014-09 replaces most existing revenue recognition guidance by establishing a single recognition model for revenue arisingfrom contracts with customers to deliver goods and services and requires additional disclosure regarding those revenues - it does notchange current accounting guidance for derivative contracts, investments in and transfers of financial instruments or guarantees. In March2016, the FASB issued ASU 2016-08, Principal versus Agent Considerations (Reporting Revenue Gross versus Net), that amends ASU2014-09’s principal-versus-agent guidance. It requires a reporting entity to evaluate whether it is a principal or agent for each specifiedgood or service in a contract with a customer and clarifies the application of the related indicators in accordance with ASU 2014-09’s controlprinciple. IFC adopted ASU 2016-08 and ASU 2014-09 effective July 1, 2018 with no material impact on IFC’s financial statements.
In January 2016, the FASB issued ASU 2016-01. ASU 2016-01 requires all investments in equity securities to be accounted for at fairvalue through net income (except investments accounted for under the equity method and those that result in consolidation of the investee),and separate presentation in other comprehensive income (OCI) of the portion of the total change in fair value resulting from a change inthe instrument-specific credit risk when the entity has elected to measure a liability at fair value under the FVO. Given the magnitude ofits investments in equity securities and the inherent volatility of prices for equity securities, the adoption of ASU 2016-01 introduced andwill continue to cause a significant volatility in IFC’s reported net earnings. IFC adopted this ASU on July 1, 2018 by means of a cumulative-effect adjustment to the consolidated balance sheet, and a summary of the impact is listed below:
Increase (decrease)Cumulative effect of adoption of ASU 2016-01,
effective July 1, 2018 (US$ millions)
Equityinvestments
Accumulatedother
comprehensiveincome
Retainedearnings Total Capital
Recognizing cumulative unrealized gains on equity securities that werepreviously accounted for at cost less impairment $ 1,433 $ — $ 1,433 $ 1,433
Reclassifying cumulative unrealized gains on equity securitiespreviously classified as available-for-sale — (1,402) 1,402 —
Recognizing the fair value of other equity-related financial instruments 80 — 80 80Reclassifying cumulative gains on borrowings measured at fair value
under FVO due to changes in Instrument specific credit risk — 43 (43) —
Total $ 1,513 $ (1,359) $ 2,872 $ 1,513
In February 2016, the FASB issued ASU 2016-02, Leases (ASU 2016-02). ASU 2016-02 introduced a new accounting model that resultedin lessees recording most leases on the balance sheet. IFC adopted ASU 2016-02 effective July 1, 2019 with no material impact on IFC’sfinancial statements.
In August 2016, the FASB issued ASU 2016-15, Statement of Cash Flows (Topic 230): Classification of Certain Cash Receipts and CashPayments (ASU 2016-05). In November 2016, the FASB issued ASU 2016-18, Statement of Cash Flows (Topic 230): Restricted Cash(ASU 2016-08). ASU 2016-15 and ASU 2016-18 clarify guidance in ASC 230. IFC adopted ASU 2016-15 and ASU 2016-18 effective July1, 2018 with no material impact on IFC’s financial statements.
In March 2017, the FASB issued ASU 2017-07, Improving the Presentation of Net Periodic Pension Cost and Net Periodic PostretirementBenefit Cost (ASU 2017-07). ASU 2017-07 requires an entity to report the service cost component of net periodic benefit costs in the sameline item as other compensation costs. The other components of net periodic benefit cost are required to be presented in the statementof operations separately from the service cost component, and are not eligible for capitalization. For IFC, this ASU became effective fromthe quarter ended September 30, 2018. Given the immateriality of the amounts subject to reclassification under the ASU, IFC has appliedthe requirements prospectively from the quarter ended September 30, 2018.
INTERNATIONAL FINANCE CORPORATION Page 72
NOTES TO CONSOLIDATED FINANCIAL STATEMENTS
NOTE A – SUMMARY OF SIGNIFICANT ACCOUNTING AND RELATED POLICIES (continued)

In March 2017, the FASB issued ASU 2017-08, Premium Amortization on Purchased Callable Debt Securities (ASU 2017-08). ASU2017-08 shortens the amortization period for certain investments in callable debt securities purchased at a premium by requiring thepremium to be amortized to the earliest call date. IFC adopted ASU 2017-08 effective July 1, 2019 with no material impact on IFC’s financialstatements.
In June 2018, the FASB issued ASU 2018-08, Clarifying the Scope and Accounting Guidance for Contributions made and ContributionsReceived (ASU 2018-08). ASU 2018-08 provides guidance to assist entities in evaluating whether transactions are contributions andwhether a contribution is conditional. For contributions received, ASU 2018-08 is effective for annual periods beginning after June 15,2018, including interim periods within those annual periods (which is the year ended June 30, 2019 for IFC). For contributions paid, ASU2018-08 is effective for annual periods beginning after December 15, 2018, including interim periods within those annual periods (whichis the year ended June 30, 2020 for IFC). IFC adopted ASU 2018-08 effective July 1, 2018 and July 1, 2019 for contributions receivedand contributions paid, respectively, with no material impact on IFC’s financial statements.
FASB has confirmed the interagency guidance from the Federal Reserve and the Federal Deposit Insurance Corporation that short-termmodifications made on a good faith basis in response to COVID-19 to borrowers who were current prior to any relief, are not consideredTDRs. During FY20 Q4, IFC implemented a COVID-19 related loan modification program which meets the interagency guidance. IFCadopted this guidance with no material impact on IFC’s financial statements.
In March 2020, the FASB issued ASU 2020-04, Reference Rate Reform (Topic 848) - Facilitation of the Effects of Reference Rate Reformon Financial Reporting. The ASU provides temporary optional expedients and exceptions to the US GAAP guidance on contract modificationsand hedge accounting to ease the financial reporting burden of the expected market transition from LIBOR and other interbank offeredrates. To be eligible for the optional expedients, modifications of contractual terms that change (or have the potential to change) the amountor timing of contractual cash flows must be related to replacement of a reference rate. The amendments in this ASU are effective uponissuance of ASU for all entities and can be implemented any time before December 31, 2022. IFC adopted the standard effective June30, 2020 and the adoption did not have a material impact on IFC’s financial statements.
Accounting standards and regulations under evaluation
In June 2016, the FASB issued ASU 2016-13, Measurement of Credit Losses on Financial Instruments (ASU 2016-13). ASU 2016-13requires the measurement of estimated credit losses on financial instruments and unfunded commitments measured at amortized costheld at the balance sheet date, based on historical loss experience, current conditions, and reasonable and supportable forecasts of futureeconomic conditions. Contrary to the incurred impairment loss accounting model currently in place, this forward-looking approach isintended to result in the immediate recognition of all estimated credit losses expected to occur over the remaining life of the instruments.The resulting allowance for current expected credit losses reduces the amortized cost basis of a financial asset to an amount expected tobe collected.
IFC will use a probability of default and loss given default approach in estimating expected credit losses. The forecast of economic variableswill be credit loss drivers that produce a macro-economic response estimate of loss over a three-year period that IFC deems to be reasonableand supportable. Subsequently, IFC will revert to longer term historical loss experience to estimate expected credit losses over theremaining contractual life. ASU 2016-13 also modified the accounting for available-for-sale debt securities whereby credit losses will berecorded through an allowance for credit losses rather than a write-down to the security’s cost basis, which allows for reversals of creditlosses when estimated credit losses decline.
Upon adoption of ASU 2016-13 on July 1, 2020, IFC currently expects to recognize a total increase in the reserve against losses for loans(a contra-asset) and a reserve against losses for unfunded commitments (a liability) of approximately $0.2 billion, with a one-time cumulativeeffect adjustment that decreases retained earnings by the same amount. The increase in reserve against losses for loans is primarilyrelated to the reserve on unfunded commitments (not required under the current incurred loss model) and the difference between the lossemergence period currently utilized, as compared to estimating lifetime credit losses as required by ASU 2016-13. IFC anticipates that theimpact to the allowance for credit losses for available-for-sale debt securities, will not be material, upon adoption of ASU 2016-13.
In August 2018, the FASB issued ASU 2018-13, Changes to the Disclosure Requirements for Fair Value Measurement (ASU 2018-13).ASU 2018-13 amends the fair value disclosure requirements to include: (a) the amount of gain or loss for the period included in othercomprehensive income attributable to fair value changes in Level 3 assets or liabilities, and (b) for Level 3 fair value measurements, therange and weighted average used to develop significant unobservable inputs and the method of calculating the weighted average. Existingfair value disclosure requirements eliminated by ASU 2018-13 include: (a) the amounts and reasons for transfers between Level 1 andLevel 2 fair value measurements, and (b) the policy for determining when transfers between fair value measurement Levels occur. ASU2018-13 modifies existing fair value disclosure requirements by (a) requiring a narrative description of the uncertainty of fair valuemeasurements from the use of significant unobservable inputs if those inputs reasonable could have been different at reporting date, and(b) requiring disclosure of the estimate of the timing of liquidation events for investments measured using the Net Asset Value practicalexpedient only if such information has been communicated to the investor or announced publicly by the investee. ASU 2018-13 is effectivefor annual periods, and interim periods within those annual periods, beginning after December 15, 2019 (which is the quarter endingSeptember 30, 2020 for IFC). Early adoption is permitted. The amendments that result in additional requirements and the narrative
INTERNATIONAL FINANCE CORPORATION Page 73
NOTES TO CONSOLIDATED FINANCIAL STATEMENTS
NOTE A – SUMMARY OF SIGNIFICANT ACCOUNTING AND RELATED POLICIES (continued)
description with respect to uncertainty must be applied prospectively. All other amendments must be retrospectively applied to all periodspresented. IFC is currently evaluating the impact of ASU 2018-13.
In August 2018, the FASB issued ASU 2018-14, Changes to the Disclosure Requirements for Defined Benefit Plans (ASU 2018-14). ASU2018-14 amends the disclosure requirements for defined benefit pension and other postretirement benefit plans. The added disclosuresinclude the weighted-average interest crediting rates used in the reporting entity’s cash balance pension plans and a narrative descriptionfor the reasons for significant gains or losses affecting the benefit obligation and any other significant changes in the benefit obligationsor plan assets during the period that are not otherwise apparent in the other required disclosures. The disclosures removed include, amongother things, the amounts in accumulated other comprehensive income expected to be recognized as part of net periodic benefit costsover the next year and the effects of a one-percent change in the assumed health care costs on service cost, interest cost, and thepostretirement benefit obligation. ASU 2018-14 is effective for fiscal years ending after December 15, 2020 (which is the quarter endingSeptember 30, 2021 for IFC). Earlier adoption is permitted. IFC is currently evaluating the impact of ASU 2018-14.
In August 2018, the FASB issued ASU 2018-15, Intangibles - Goodwill and Other - Internal-Use Software: Customer’s Accounting forImplementation Costs Incurred in a Cloud Computing Arrangement that is a Service Contract (ASU 2018-15). ASU 2018-15 amends ASC350-40 to address a customer’s accounting for implementation costs incurred in a cloud computing arrangement that is a service contract.ASU 2018-15 is effective for fiscal years ending after December 15, 2019 (which is the quarter ending September 30, 2020 for IFC). ASU2018-15 is not expected to have a material impact on IFC’s financial statements.
In October 2018, the FASB issued ASU 2018-17, Consolidation: Targeted Improvements to Related Party Guidance for Variable InterestEntities (ASU 2018-17). ASU 2018-17 amends the guidance for how a decision maker or service provider must determine whether its feeis a variable interest in a VIE when a related party also has an interest in the VIE. Under the amendment, the decision maker must considerinterests held be its related parties on a proportionate basis when determining if such interests could absorb more than an insignificantamount of the VIE’s variability. Current guidance requires the decision maker to consider such interests in their entirety. ASU 2018-17 iseffective for annual periods (and interim periods within those annual periods) beginning after December 15, 2019 (which is the quarterending September 30, 2020 for IFC). ASU 2018-17 is not expected to have a material impact on IFC’s financial statements.
In April 2019, the FASB issued ASU 2019-04, Codification Improvements to Topic 815, Derivatives and Hedging, and Topic 825, FinancialInstruments (ASU 2019-04). ASU 2019-04 amends its standards on Derivatives and Hedging, and Financial Instruments to addressimplementation issues. With respect to Hedge Accounting, the amendments address partial-term fair value hedges and fair value hedgebasis adjustments. The amendment to the Hedging standard has the same effective date as the original standard (that is quarter endingSeptember 30, 2019 for IFC). The amendments to Financial Instruments recognition and measurement guidance are effective for fiscalyears beginning after December 15, 2019 (which is the quarter ending September 30, 2020 for IFC). The amendments to the Derivativesand Hedging standards do not impact IFC because IFC does not utilize accounting hedges. IFC is currently evaluating the impact of theFinancial Instruments standard.
In January 2020, the FASB issued ASU 2020-01, Investments - Equity Securities (Topic 321), Investments - Equity Method and JointVentures (Topic 323), and Derivatives and Hedging (Topic 815) - Clarifying the Interactions between Topic 321, Topic 323, and Topic 815.The amendments on the interactions between Topic 321 and Topic 323 clarify that an entity should consider observable transactions thatrequire it to either apply or discontinue the equity method of accounting for the purposes of applying the measurement alternative inaccordance with Topic 321 immediately before applying or upon discontinuing the equity method. These amendments do not impact IFCbecause IFC has elected an FVO for direct equity investments which give IFC significant influence, which in the absence of FVO, wouldhave to be accounted for under equity method. The amendments on the interactions between Topic 323 and Topic 815, clarify that anentity should not consider whether, upon the settlement of a nonderivative forward contract or exercise of a nonderivative purchased option,individually or with existing investments, the underlying securities would be accounted for under the equity method in Topic 323 or the fairvalue option in accordance with the financial instruments guidance in Topic 825. The impact of this amendment is not expected to bematerial for IFC, because IFC is already accounting for non-derivative contracts on equity securities in accordance with ASC 321. ASU2020-01 is effective for fiscal years and interim periods within those fiscal years beginning after December 15, 2020 (which is the quarterending September 30, 2021 for IFC).
In February 2020, the FASB issued ASU 2020-02, Leases (Topic 842) Amendments to SEC Paragraphs Pursuant to SEC Staff AccountingBulletin No. 119 and Update to SEC Section on Effective Date Related to Accounting Standards Update No. 2016-02, Leases (Topic 842)(ASU 2020-02). ASU 2020-02 was effective upon its issuance. ASU 2020-02 extends the effective date for Topic 842 Leases (Topic 842)for certain public entities. This extension is not relevant for IFC because IFC has already implemented Topic 842.
In March 2020, the FASB issued ASU 2020-03, Codification Improvements to Financial Instruments (ASU 2020-03) as part of its ongoingproject for improving the Codification or correcting its unintended application. The items addressed in that project generally are not expectedto have a significant effect on current accounting practice or create a significant administrative cost for most entities. The amendmentsASU 2020-03 are similar to those items and are therefore not expected to have a material impact on IFC.
INTERNATIONAL FINANCE CORPORATION Page 74
NOTES TO CONSOLIDATED FINANCIAL STATEMENTS
NOTE A – SUMMARY OF SIGNIFICANT ACCOUNTING AND RELATED POLICIES (continued)

IFC managed AMC Funds
Effective January 31, 2020, IFC Asset Management Company, LLC (AMC) was merged into IFC. IFC, as the successor to AMC, hasassumed all the assets, rights, liabilities and obligations of AMC. IFC continues the operations of the AMC as a division, which is to mobilizecapital from outside IFC’s traditional investor pool and manage third-party capital.
As of the date of the merger, AMC’s cash, receivables and other assets were $45 million, equity investments were less than $0.5 million,and payables and other liabilities were $7 million. Until the merger, AMC had been consolidated into IFC’s financial statements. AMC’sassets and liabilities that had been consolidated into IFC’s financial statements at June 30, 2019 are shown in the following table (US$millions):
June 30, 2019Cash, receivables and other assets $ 49Equity investments —*Payables and other liabilities 2
* Less than $0.5 million.
As a result of the consolidation of AMC prior to January 31, 2020, amounts included in IFC’s consolidated statements of operations for theyears ended June 30, 2020, June 30, 2019 and June 30, 2018 comprise (US$ millions):
2020* 2019 2018Other income $ 31 $ 64 $ 80Other expenses 14 25 24
*Income and expenses reported until AMC merged with IFC on January 31, 2020.
At June 30, 2020, IFC managed twelve funds (collectively referred to as the AMC Funds), none of which requires consolidation by IFC.All AMC Funds are investment companies and are required to report their investment assets at fair value through net income. IFC’sInvestments in AMC Funds are accounted at fair value. IFC's ownership interests in these AMC Funds are shown in the following table:
AMC Funds IFC’s ownership interestIFC Capitalization (Equity) Fund, L.P. 61%*IFC Capitalization (Subordinated Debt) Fund, L.P. 13%IFC African, Latin American and Caribbean Fund, LP 20%Africa Capitalization Fund, Ltd. —IFC Catalyst Funds 18%**IFC Global Infrastructure Fund, LP 17%China-Mexico Fund, LP —IFC Financial Institutions Growth Fund, LP 30%IFC Global Emerging Markets Fund of Funds 19%***IFC Middle East and North Africa Fund, LP 37%Women Entrepreneurs Debt Fund, LP 26%IFC Emerging Asia Fund, LP 22%
* By virtue of certain rights granted to non-IFC limited partner interests, IFC does not control or consolidate this fund.** The ownership interest of 18% reflects IFC’s ownership interest taking into consideration the overall commitments for the IFC Catalyst Funds, which iscomprised of IFC Catalyst Fund, LP, IFC Catalyst Fund (UK), LP and IFC Catalyst Fund (Japan), LP (collectively, IFC Catalyst Funds). IFC does not havean ownership interest in either the IFC Catalyst Fund (UK), LP or the IFC Catalyst Fund (Japan), LP.*** The ownership interest of 19% reflects IFC’s ownership interest taking into consideration the current committed amounts for the IFC Global EmergingMarkets Fund of Funds, which are comprised of IFC Global Emerging Markets Fund of Funds, LP and IFC Global Emerging Markets Fund of Funds, (JapanParallel) LP. IFC does not have an ownership interest in the IFC Global Emerging Markets Fund of Funds, (Japan Parallel) LP.
INTERNATIONAL FINANCE CORPORATION Page 75
NOTES TO CONSOLIDATED FINANCIAL STATEMENTS
NOTE B - SCOPE OF CONSOLIDATION

Other Consolidated entities
In August 2015, IFC created a special purpose vehicle, IFC Sukuk Company, to facilitate a $100 million Sukuk under IFC’s borrowingsprogram. The Sukuk is scheduled to mature in September 2020. IFC Sukuk Company is a VIE and has been consolidated into theseconsolidated financial statements because IFC is the VIE’s primary beneficiary. The collective impact of this and other entities consolidatedinto these consolidated financial statements under the VIE or voting interest model is insignificant.
INTERNATIONAL FINANCE CORPORATION Page 76
NOTES TO CONSOLIDATED FINANCIAL STATEMENTS
NOTE B – SCOPE OF CONSOLIDATION (continued)
NOTE C – LIQUID ASSET PORTFOLIO
Income from liquid asset trading activities
Income from liquid asset trading activities for the years ended June 30, 2020, June 30, 2019 and June 30, 2018 comprises (US$millions):
2020 2019 2018Interest income, net $ 686 $ 775 $ 664Net gains and losses on trading activities (realized and unrealized) 353 516 107
Total income from liquid asset trading activities $ 1,039 $ 1,291 $ 771
Net gains and losses on trading activities comprise net losses on asset-backed and mortgage-backed securities of $31 million for the yearended June 30, 2020 ($21 million net losses - year ended June 30, 2019; $27 million net losses – year ended June 30, 2018) and netgains on other trading securities of $384 million for the year ended June 30, 2020 ($537 million net gains - year ended June 30, 2019;$134 million net gains - year ended June 30, 2018).
The annualized rate of return on the liquid asset trading portfolio, calculated as total income from the liquid asset trading activities dividedby fair value average daily balance of total trading securities, during the year ended June 30, 2020, was 3.4% (4.4% - year ended June 30,2019; 2.6% - year ended June 30, 2018). After the effect of associated derivative instruments, the liquid asset portfolio generally repriceswithin one year.
Composition of liquid asset portfolio
The composition of IFC’s liquid asset portfolio included in the consolidated balance sheet captions is as follows (US$ millions):
June 30, 2020 June 30, 2019AssetsCash and due from banks $ 128 $ 790Time deposits 14,218 17,500Trading securities 30,217 28,526Securities purchased under resale agreements and receivable for cash collateral pledged 1,221 1,862Derivative assets 230 154Receivables and other assets:Receivables from unsettled security trades 831 499Accrued interest income on time deposits and securities 133 153Accrued income on derivative instruments 19 36
Total assets 46,997 49,520LiabilitiesSecurities sold under repurchase agreements and payable for cash collateral received 4,591 8,454Derivative liabilities 333 358Payables and other liabilities:
Payables for purchase of securities 1,236 960Accrued charges on derivative instruments 46 35
Total liabilities 6,206 9,807
Total net liquid asset portfolio $ 40,791 $ 39,713
The liquid asset portfolio is denominated primarily in US dollars; investments in other currencies, net of the effect of associated derivativeinstruments that convert non-US dollar securities into US dollar securities, represent 1.0% of the portfolio at June 30, 2020 (0.9% - June 30,2019).
Trading securities comprises
Year ended June 30,2020 At June 30, 2020
Fair value averagedaily balance (US$ million)
Fair value (US$ millions)
Weighted averagecontractual maturity
(years)Government, agency and government-sponsored agency obligations $ 21,052 $ 21,146 1.7Asset-backed securities 5,983 5,123 14.5Corporate securities 3,925 3,948 0.7Money market funds — — n/a
Total trading securities $ 30,960 $ 30,217
Year ended June 30,2019 At June 30, 2019
Fair value averagedaily balance (US$ million)
Fair value (US$ millions)
Weighted averagecontractual maturity
(years)Government, agency and government-sponsored agency obligations $ 16,633 $ 18,614 2.0Asset-backed securities 5,520 5,045 18.1Corporate securities 6,978 4,716 0.9Money market funds 118 151 n/a
Total trading securities $ 29,249 $ 28,526
The expected maturity of the asset-backed securities may be significantly shorter than the contractual maturity, as reported above, dueto prepayment features.
INTERNATIONAL FINANCE CORPORATION Page 77
NOTES TO CONSOLIDATED FINANCIAL STATEMENTS
NOTE C – LIQUID ASSET PORTFOLIO (continued)

The carrying amount of investments at June 30, 2020 and June 30, 2019 comprises (US$ millions):
June 30, 2020 June 30, 2019Loans
Loans at amortized cost $ 24,795 $ 24,297Less: Reserve against losses on loans (1,648) (1,191)
Loans at amortized cost less reserve against losses 23,147 23,106Loans accounted for at fair value under the Fair Value Option
(outstanding principal balance $1,113 at June 30, 2020, $968 - June 30, 2019) 955 877
Total loans 24,102 23,983Equity investments
Equity investments accounted for at fair value*(cost $11,744 at June 30, 2020, $12,885 - June 30, 2019) 10,370** 13,130**
Total equity investments 10,370 13,130Debt securities
Debt securities accounted for at fair value as available-for-sale(amortized cost $3,862 at June 30, 2020, $4,495 - June 30, 2019) 3,687 4,488
Debt securities accounted for at fair value under the Fair Value Option(amortized cost $2,925 at June 30, 2020, $1,784 - June 30, 2019) 2,979 1,861
Total debt securities 6,666 6,349
Total carrying amount of investments $ 41,138 $ 43,462
* Equity investments at fair value as of June 30, 2020 are comprised of investments in common or preferred shares of $6,433 million ($8,910 million as ofJune 30, 2019), equity interests in private equity funds of $3,777 million ($4,191 million as of June 30, 2019), and equity-related options and other financialinstruments of $160 million ($29 million as of June 30, 2019).** Includes $4 million and $17 million for June 30, 2020 and June 30, 2019 of equity investments primarily accounted for under the cost recovery method.As the recovery of invested capital is uncertain, the fair value measurement is not applicable to these investments.
INTERNATIONAL FINANCE CORPORATION Page 78
NOTES TO CONSOLIDATED FINANCIAL STATEMENTS
NOTE D - INVESTMENTS

The distribution of the investment portfolio by geographical region and by industry sector and a reconciliation of total disbursed portfolioto carrying amount of investments is as follows (US$ millions):
June 30, 2020 June 30, 2019
Sector LoansEquity
investmentsDebt
securities Total LoansEquity
investmentsDebt
securities TotalAsia
Manufacturing, agribusiness and services $ 1,812 $ 1,314 $ 421 $ 3,547 $ 1,795 $ 1,248 $ 347 $ 3,390Financial markets 3,541 1,361 2,095 6,997 3,253 1,464 2,085 6,802 Infrastructure and natural resources 1,970 707 309 2,986 2,260 771 213 3,244Disruptive technologies and funds 7 1,048 101 1,156 6 946 131 1,083
Total Asia 7,330 4,430 2,926 14,686 7,314 4,429 2,776 14,519Europe, Middle East and North Africa
Manufacturing, agribusiness and services 1,723 782 221 2,726 1,845 1,016 233 3,094Financial markets 1,419 926 1,494 3,839 1,553 1,171 1,605 4,329Infrastructure and natural resources 1,828 589 261 2,678 1,990 881 239 3,110Disruptive technologies and funds — 375 — 375 — 394 — 394
Total Europe, Middle East and NorthAfrica 4,970 2,672 1,976 9,618 5,388 3,462 2,077 10,927
Sub-Saharan Africa, Latin America andCaribbeanManufacturing, agribusiness and services 3,057 890 26 3,973 2,923 865 56 3,844Financial markets 4,408 733 917 6,058 4,063 809 696 5,568Infrastructure and natural resources 3,559 1,062 121 4,742 3,921 1,199 92 5,212Disruptive technologies and funds — 929 8 937 2 881 8 891
Total Sub-Saharan Africa, LatinAmerica and Caribbean 11,024 3,614 1,072 15,710 10,909 3,754 852 15,515
OtherManufacturing, agribusiness and services 696 154 — 850 664 155 — 819Financial markets 1,881 421 514 2,816 862 478 491 1,831Infrastructure and natural resources 135 31 — 166 194 27 10 231Disruptive technologies and funds — 463 — 463 69 624 — 693
Total Other 2,712 1,069 514 4,295 1,789 1,284 501 3,574
Total disbursed investment portfolio $ 26,036 $ 11,785 $ 6,488 $ 44,309 $ 25,400 $ 12,929 $ 6,206 $ 44,535Reserve against losses on loans (1,648) — — (1,648) (1,191) — — (1,191)Unamortized deferred loan origination fees,
net and other (128) — — (128) (133) — — (133)Disbursed amount allocated to a related
financial instrument reported separatelyin other assets or derivative assets — (37) — (37) (2) (39) — (41)
Adjustments to disbursed investmentportfolio — — — — — (2) (24) (26)
Unrealized losses on equity investmentsheld by consolidated VIEs — (4) — (4) — (3) — (3)
Unrealized gains on investments accountedfor at fair value as available-for-sale — — 123 123 — — 89 89
Unrealized gains (losses) on investmentsaccounted for under the fair value option (158) (1,374) 55 (1,477) (91) 245 78 232
Carrying amount of investments $ 24,102 $ 10,370 $ 6,666 $ 41,138 $ 23,983 $ 13,130 $ 6,349 $ 43,462
INTERNATIONAL FINANCE CORPORATION Page 79
NOTES TO CONSOLIDATED FINANCIAL STATEMENTS
NOTE D - INVESTMENTS (continued)
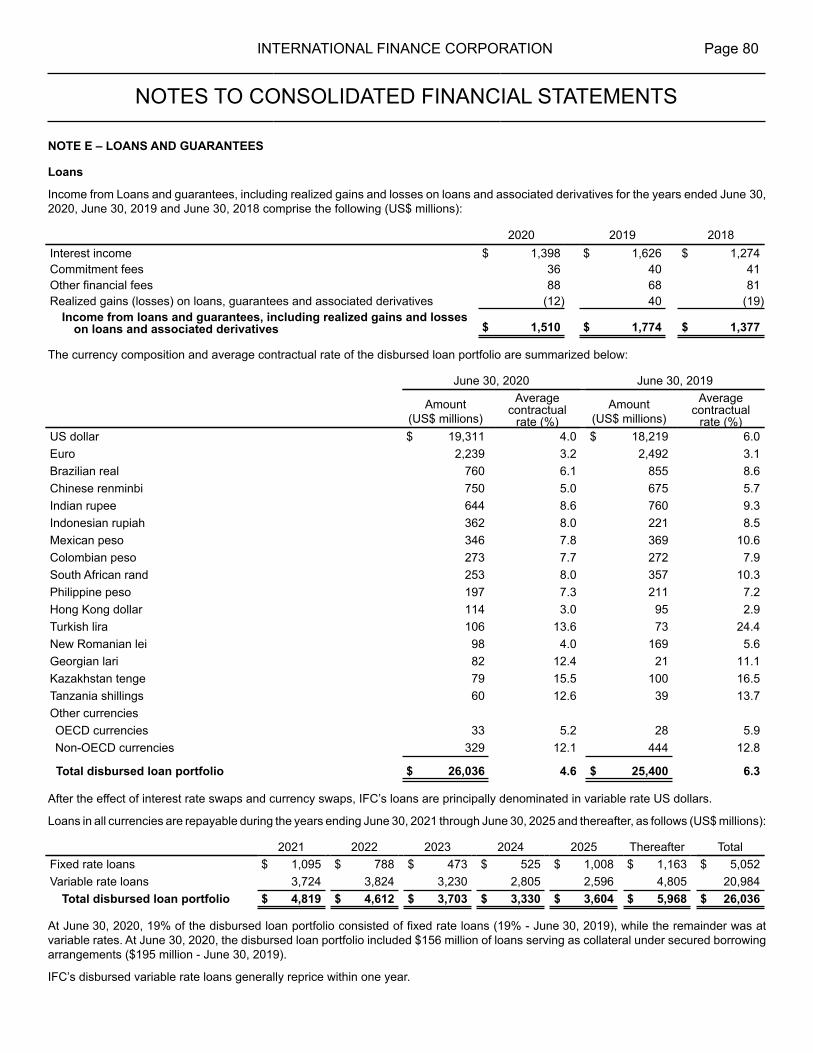
Loans
Income from Loans and guarantees, including realized gains and losses on loans and associated derivatives for the years ended June 30,2020, June 30, 2019 and June 30, 2018 comprise the following (US$ millions):
2020 2019 2018Interest income $ 1,398 $ 1,626 $ 1,274Commitment fees 36 40 41Other financial fees 88 68 81Realized gains (losses) on loans, guarantees and associated derivatives (12) 40 (19)
Income from loans and guarantees, including realized gains and losseson loans and associated derivatives $ 1,510 $ 1,774 $ 1,377
The currency composition and average contractual rate of the disbursed loan portfolio are summarized below:
June 30, 2020 June 30, 2019
Amount (US$ millions)
Averagecontractual
rate (%)Amount
(US$ millions)
Averagecontractual
rate (%)US dollar $ 19,311 4.0 $ 18,219 6.0Euro 2,239 3.2 2,492 3.1Brazilian real 760 6.1 855 8.6Chinese renminbi 750 5.0 675 5.7Indian rupee 644 8.6 760 9.3Indonesian rupiah 362 8.0 221 8.5Mexican peso 346 7.8 369 10.6Colombian peso 273 7.7 272 7.9South African rand 253 8.0 357 10.3Philippine peso 197 7.3 211 7.2Hong Kong dollar 114 3.0 95 2.9Turkish lira 106 13.6 73 24.4New Romanian lei 98 4.0 169 5.6Georgian lari 82 12.4 21 11.1Kazakhstan tenge 79 15.5 100 16.5Tanzania shillings 60 12.6 39 13.7Other currenciesOECD currencies 33 5.2 28 5.9Non-OECD currencies 329 12.1 444 12.8
Total disbursed loan portfolio $ 26,036 4.6 $ 25,400 6.3
After the effect of interest rate swaps and currency swaps, IFC’s loans are principally denominated in variable rate US dollars.
Loans in all currencies are repayable during the years ending June 30, 2021 through June 30, 2025 and thereafter, as follows (US$ millions):
2021 2022 2023 2024 2025 Thereafter TotalFixed rate loans $ 1,095 $ 788 $ 473 $ 525 $ 1,008 $ 1,163 $ 5,052Variable rate loans 3,724 3,824 3,230 2,805 2,596 4,805 20,984
Total disbursed loan portfolio $ 4,819 $ 4,612 $ 3,703 $ 3,330 $ 3,604 $ 5,968 $ 26,036
At June 30, 2020, 19% of the disbursed loan portfolio consisted of fixed rate loans (19% - June 30, 2019), while the remainder was atvariable rates. At June 30, 2020, the disbursed loan portfolio included $156 million of loans serving as collateral under secured borrowingarrangements ($195 million - June 30, 2019).
IFC’s disbursed variable rate loans generally reprice within one year.
INTERNATIONAL FINANCE CORPORATION Page 80
NOTES TO CONSOLIDATED FINANCIAL STATEMENTS
NOTE E – LOANS AND GUARANTEES

Reserve against losses on loans and provision for losses on loans
Reserves against losses as of June 30, 2020 reflects credit risk assessments as of June 30, 2020. The assessment of level of reservesagainst losses also carried a heightened degree of uncertainty and judgment in incorporating the impact of COVID-19. In evaluating theappropriateness of IFC’s reserves against losses on loans at June 30, 2020, IFC has considered the impact of COVID-19 largely throughits rating system that classifies its loans according to credit worthiness and risk. In light of COVID-19, many of the credit risk ratings ofindividual loans deteriorated at June 30, 2020 when compared to June 30, 2019 reflecting general credit considerations and specificCOVID-19 related considerations. As a result, IFC has reported higher provisions for losses in the year ended June 30, 2020 whichincluded a qualitative overlay general provision of $63 million considered necessary to reflect the impact of COVID-19.
Changes in the reserve against losses on loans for the years ended June 30, 2020, June 30, 2019 and June 30, 2018, as well as therelated recorded investment in loans evaluated for impairment individually (specific reserves) and on a pool basis (portfolio reserves)respectively, are summarized below (US$ millions):
Year ended June 30, 2020Specificreserves
Portfolioreserves Total reserves
Beginning balance $ 580 $ 611 $ 1,191Provision (release of provision) for losses on loans, net 375 252 627Write-offs (155) — (155)Recoveries of previously written-off loans 3 — 3Foreign currency transaction adjustments (11) (18) (29)Other adjustments* 12 (1) 11
Ending balance $ 804 $ 844 $ 1,648Related recorded investment in loans at June 30, 2020 evaluated for
impairment** $ 24,795 $ 23,046 $ 24,795Recorded investment in loans with specific reserves $ 1,749
Year ended June 30, 2019Specificreserves
Portfolioreserves Total reserves
Beginning balance $ 651 $ 642 $ 1,293Provision (release of provision) for losses on loans, net 105 (28) 77Write-offs (221) — (221)Recoveries of previously written-off loans 34 — 34Foreign currency transaction adjustments (2) (3) (5)Other adjustments* 13 — 13
Ending balance $ 580 $ 611 $ 1,191Related recorded investment in loans at June 30, 2019 evaluated for
impairment** $ 24,297 $ 23,057 $ 24,297Recorded investment in loans with specific reserves $ 1,240
INTERNATIONAL FINANCE CORPORATION Page 81
NOTES TO CONSOLIDATED FINANCIAL STATEMENTS
NOTE E – LOANS AND GUARANTEES (continued)

Year ended June 30, 2018Specificreserves
Portfolioreserves Total reserves
Beginning balance $ 841 $ 642 $ 1,483Provision (release of provision) for losses on loans, net 82 2 84Write-offs (304) — (304)Recoveries of previously written-off loans 19 — 19Foreign currency transaction adjustments (2) (3) (5)Other adjustments* 15 1 16
Ending balance $ 651 $ 642 $ 1,293Related recorded investment in loans at June 30, 2018 evaluated for
impairment** $ 23,975 $ 22,717 $ 23,975Recorded investment in loans with specific reserves $ 1,258
* Other adjustments comprise reserves against interest capitalized as part of a debt restructuring.** IFC individually evaluates all loans for impairment. Portfolio reserves are established for losses incurred, but not specifically identifiable, on loans for
which no specific reserve is established.
Reserve for losses on guarantees, accrued interest and other receivables and provision for losses on guarantees and otherreceivables
Changes in the reserve against losses on guarantees for the years ended June 30, 2020, June 30, 2019 and June 30, 2018, are summarizedbelow (US$ millions):
2020 2019 2018Beginning balance $ 25 $ 15 $ 12
Provision (release of provision) for losses on guarantees 4 10 3
Ending balance $ 29 $ 25 $ 15
Changes in the reserve against losses on other receivables and accrued interest for the years ended June 30, 2020, June 30, 2019 andJune 30, 2018, are summarized below (US$ millions):
2020 2019 2018Beginning balance $ 8 $ 8 $ 8Provision (release of provision) for losses on other receivables and accrued interest 7 —* 3
Write-offs — — (2)
Foreign currency transaction adjustments —* — (1)
Ending balance $ 15 $ 8 $ 8
* Less than $0.5 million.
Impaired loans
The average recorded investment and the recorded investment in loans at amortized cost that are impaired with specific reserves atJune 30, 2020 and June 30, 2019 are as follows (US$ millions):
June 30, 2020 June 30, 2019Average recorded investment in loans at amortized cost that are impaired with specific reserves $ 1,839 $ 1,294Recorded investment in loans at amortized cost that are impaired with specific reserves 1,749 1,240
INTERNATIONAL FINANCE CORPORATION Page 82
NOTES TO CONSOLIDATED FINANCIAL STATEMENTS
NOTE E – LOANS AND GUARANTEES (continued)

Loans at amortized cost that are impaired with specific reserves are summarized by geographic region and industry sector as follows(US$ millions):
As of June 30, 2020
For the yearended June
30, 2020
Recordedinvestment
Unpaidprincipalbalance
Relatedspecificreserve
Averagerecorded
investment
Interestincome
recognizedAsia
Manufacturing, agribusiness and services $ 109 $ 178 $ 59 $ 115 $ 2Financial markets 76 80 48 78 1Infrastructure and natural resources** 83 152 40 96 7
Total Asia 268 410 147 289 10
Europe, Middle East and North AfricaManufacturing, agribusiness and services 217 251 70 238 6Financial markets 161 161 101 163 8Infrastructure and natural resources** 261 379 110 276 12
Total Europe, Middle East and North Africa 639 791 281 677 26
Sub-Saharan Africa, Latin America and CaribbeanManufacturing, agribusiness and services 385 411 187 391 12Financial markets 46 87 17 51 4Infrastructure and natural resources** 411 454 172 431 21
Total Sub-Saharan Africa, Latin America and Caribbean 842 952 376 873 37
OtherManufacturing, agribusiness and services —* 15 —* —* —
Total Other —* 15 —* —* —
Total $ 1,749 $ 2,168 $ 804 $ 1,839 $ 73
* Less than $0.5 million.** Effective FY20, Telecom, Media and Technology (TMT) has been grouped in Infrastructure and natural resources resulting from an organizational change.
As of June 30, 2020
For the yearended June
30, 2020
Recordedinvestment
Unpaidprincipalbalance
Relatedspecificreserve
Averagerecorded
investment
Interestincome
recognized
Loans at amortized cost that are impaired with nospecific reserves (US$ millions) $ 198 $ 198 $ — $ 218 $ 12
INTERNATIONAL FINANCE CORPORATION Page 83
NOTES TO CONSOLIDATED FINANCIAL STATEMENTS
NOTE E – LOANS AND GUARANTEES (continued)
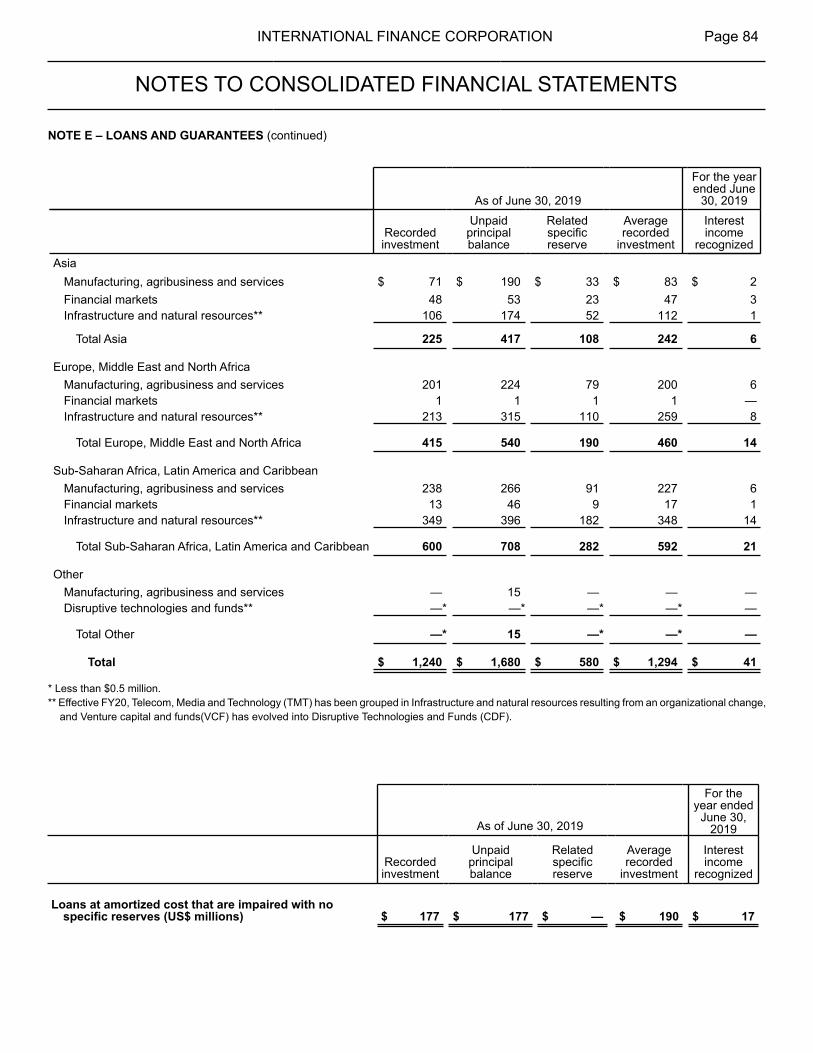
As of June 30, 2019
For the yearended June
30, 2019
Recordedinvestment
Unpaidprincipalbalance
Relatedspecificreserve
Averagerecorded
investment
Interestincome
recognizedAsia
Manufacturing, agribusiness and services $ 71 $ 190 $ 33 $ 83 $ 2Financial markets 48 53 23 47 3Infrastructure and natural resources** 106 174 52 112 1
Total Asia 225 417 108 242 6
Europe, Middle East and North AfricaManufacturing, agribusiness and services 201 224 79 200 6Financial markets 1 1 1 1 —Infrastructure and natural resources** 213 315 110 259 8
Total Europe, Middle East and North Africa 415 540 190 460 14
Sub-Saharan Africa, Latin America and CaribbeanManufacturing, agribusiness and services 238 266 91 227 6Financial markets 13 46 9 17 1Infrastructure and natural resources** 349 396 182 348 14
Total Sub-Saharan Africa, Latin America and Caribbean 600 708 282 592 21
OtherManufacturing, agribusiness and services — 15 — — —Disruptive technologies and funds** —* —* —* —* —
Total Other —* 15 —* —* —
Total $ 1,240 $ 1,680 $ 580 $ 1,294 $ 41
* Less than $0.5 million.** Effective FY20, Telecom, Media and Technology (TMT) has been grouped in Infrastructure and natural resources resulting from an organizational change, and Venture capital and funds(VCF) has evolved into Disruptive Technologies and Funds (CDF).
As of June 30, 2019
For theyear ended
June 30,2019
Recordedinvestment
Unpaidprincipalbalance
Relatedspecificreserve
Averagerecorded
investment
Interestincome
recognized
Loans at amortized cost that are impaired with nospecific reserves (US$ millions) $ 177 $ 177 $ — $ 190 $ 17
INTERNATIONAL FINANCE CORPORATION Page 84
NOTES TO CONSOLIDATED FINANCIAL STATEMENTS
NOTE E – LOANS AND GUARANTEES (continued)

Nonaccruing loans
Loans on which the accrual of interest has been discontinued amounted to $1,714 million at June 30, 2020 ($1,280 million – June 30,2019). The interest income on such loans for the years ended June 30, 2020, June 30, 2019 and June 30, 2018 is summarized as follows(US$ millions):
2020 2019 2018Interest income not recognized on nonaccruing loans $ 153 $ 135 $ 201Interest income recognized on loans in nonaccrual
status related to current and prior years, on cash basis $ 70 $ 56 $ 48
The recorded investment in nonaccruing loans at June 30, 2020 and June 30, 2019 summarized by geographic region and industrysector as follows (US$ millions):
June 30, 2020
Manufacturing,agribusinessand services
Financialmarkets
Infrastructureand naturalresources***
Disruptivetechnologiesand funds***
Total recordedinvestment innon-accruing
loansAsia $ 90 $ 132 $ 84 $ — $ 306Europe, Middle East and North Africa 161 179 251 — 591Sub-Saharan Africa, Latin America and
Caribbean 435 36 402 — 873Other —* — — — —
Total disbursed loans $ 686 $ 347 $ 737 $ — $ 1,770**
June 30, 2019
Manufacturing,agribusinessand services
Financialmarkets
Infrastructureand naturalresources***
Disruptivetechnologiesand funds***
Total recordedinvestment innon-accruing
loansAsia $ 54 $ 82 $ 120 $ — $ 256Europe, Middle East and North Africa 128 1 271 — 400Sub-Saharan Africa, Latin America and
Caribbean 359 23 292 — 674Other — — 1 —* 1
Total disbursed loans $ 541 $ 106 $ 684 $ —* $ 1,331**
* Less than $0.5 million.** Includes $56 million reported as debt securities on the Balance Sheet as of June 30, 2020 ($51 million - June 30, 2019).*** Effective FY20, Telecom, Media and Technology (TMT) has been grouped in Infrastructure and natural resources resulting from an organizationalchange, and Venture capital and funds (VCF) has evolved into Disruptive Technologies and Funds (CDF).
INTERNATIONAL FINANCE CORPORATION Page 85
NOTES TO CONSOLIDATED FINANCIAL STATEMENTS
NOTE E – LOANS AND GUARANTEES (continued)

Past due loans
An age analysis, based on contractual terms, of IFC’s loans at amortized cost by geographic region and industry sector follows (US$millions):
June 30, 2020
31-60 dayspast due
61-90 dayspast due
Greaterthan 90
days pastdue
Total pastdue Current Total loans
AsiaManufacturing, agribusiness and services $ 2 $ — $ 64 $ 66 $ 1,720 $ 1,786Financial markets — 16 35 51 3,444 3,495Infrastructure and natural resources** — — 83 83 1,729 1,812
Total Asia 2 16 182 200 6,893 7,093Europe, Middle East and North Africa
Manufacturing, agribusiness and services — — 128 128 1,582 1,710Financial markets — 38 1 39 1,380 1,419Infrastructure and natural resources** 134 — 84 218 1,395 1,613
Total Europe, Middle East and North Africa 134 38 213 385 4,357 4,742Sub-Saharan Africa, Latin America and
CaribbeanManufacturing, agribusiness and services 75 — 338 413 2,551 2,964Financial markets — — 4 4 4,000 4,004Infrastructure and natural resources** 101 — 59 160 3,321 3,481Disruptive technologies and funds** — — — — —* —*
Total Sub-Saharan Africa, Latin Americaand Caribbean 176 — 401 577 9,872 10,449
OtherManufacturing, agribusiness and services — — — — 679 679Financial markets — — — — 1,825 1,825Infrastructure and natural resources** — — — — 135 135
Total Other — — — — 2,639 2,639Total disbursed loans at amortized
cost $ 312 $ 54 $ 796 $ 1,162 $ 23,761 $ 24,923Unamortized deferred loan origination fees, net
and other (128)Disbursed amount allocated to a related
financial instrument reported separately inother assets or derivative assets —*
Recorded investment in loans at amortizedcost $ 24,795
At June 30, 2020, loans 90 days or greater past due still accruing were insignificant.* Less than $0.5 million.** Effective FY20, Telecom, Media and Technology (TMT) has been grouped in Infrastructure and natural resources resulting from an organizational change,and Venture capital and funds (VCF) has evolved into Disruptive Technologies and Funds (CDF).
INTERNATIONAL FINANCE CORPORATION Page 86
NOTES TO CONSOLIDATED FINANCIAL STATEMENTS
NOTE E – LOANS AND GUARANTEES (continued)
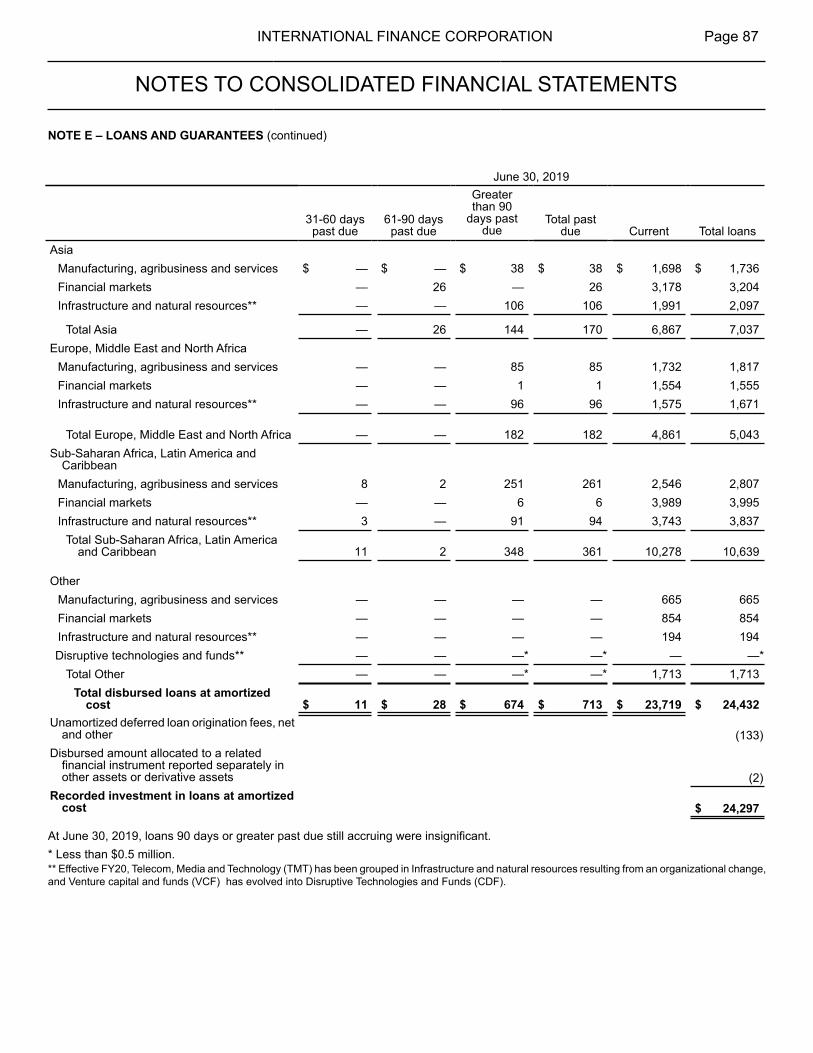
June 30, 2019
31-60 dayspast due
61-90 dayspast due
Greaterthan 90
days pastdue
Total pastdue Current Total loans
AsiaManufacturing, agribusiness and services $ — $ — $ 38 $ 38 $ 1,698 $ 1,736Financial markets — 26 — 26 3,178 3,204Infrastructure and natural resources** — — 106 106 1,991 2,097
Total Asia — 26 144 170 6,867 7,037Europe, Middle East and North Africa
Manufacturing, agribusiness and services — — 85 85 1,732 1,817Financial markets — — 1 1 1,554 1,555Infrastructure and natural resources** — — 96 96 1,575 1,671
Total Europe, Middle East and North Africa — — 182 182 4,861 5,043Sub-Saharan Africa, Latin America and
CaribbeanManufacturing, agribusiness and services 8 2 251 261 2,546 2,807Financial markets — — 6 6 3,989 3,995Infrastructure and natural resources** 3 — 91 94 3,743 3,837
Total Sub-Saharan Africa, Latin Americaand Caribbean 11 2 348 361 10,278 10,639
OtherManufacturing, agribusiness and services — — — — 665 665Financial markets — — — — 854 854Infrastructure and natural resources** — — — — 194 194Disruptive technologies and funds** — — —* —* — —*
Total Other — — —* —* 1,713 1,713Total disbursed loans at amortized
cost $ 11 $ 28 $ 674 $ 713 $ 23,719 $ 24,432Unamortized deferred loan origination fees, net
and other (133)Disbursed amount allocated to a related
financial instrument reported separately inother assets or derivative assets (2)
Recorded investment in loans at amortizedcost $ 24,297
At June 30, 2019, loans 90 days or greater past due still accruing were insignificant. * Less than $0.5 million.** Effective FY20, Telecom, Media and Technology (TMT) has been grouped in Infrastructure and natural resources resulting from an organizational change,and Venture capital and funds (VCF) has evolved into Disruptive Technologies and Funds (CDF).
INTERNATIONAL FINANCE CORPORATION Page 87
NOTES TO CONSOLIDATED FINANCIAL STATEMENTS
NOTE E – LOANS AND GUARANTEES (continued)

Loan Credit Quality Indicators
IFC utilizes a rating system to classify loans according to credit worthiness and risk. A description of each credit rating and categorizationin terms of the attributes of the borrower, the business environment in which the borrower operates or the loan itself under the rating systemfollows:
CreditRisk
Rating
IndicativeExternalRating Category Description
CR-1 AAA, AA+,AA, AA- Very Strong An obligor rated CR-1 is the highest rating assigned by IFC. The obligor's ability to meet its financial
obligations is very strong.
CR-2 A+, A, A- StrongAn obligor rated CR-2 is slightly more susceptible to the negative effects of changes in circumstancesand economic conditions than obligors rated CR-1. The obligor's ability to meet its financialobligations remains strong.
CR-3 BBB+
Adequate
An obligor rated CR-3 exhibits an adequate financial profile, even though at a weaker level than"CR-1" and "CR-2."
CR-4 BBBAn obligor rated CR-4 exhibits an adequate financial profile. However, adverse economic conditionsor changing circumstances are more likely to lead to a deterioration of the obligor’s ability to meetits financial obligations.
CR-5 BBB-An obligor rated CR-5, as the lowest of the investment grade ratings, exhibits an adequate financialprofile. However, adverse economic conditions and/or changing circumstances are more likely tolead to a weaker financial profile and a deterioration of the obligor’s ability to meet its financialobligations.
CR-6 BB+
Moderate
An obligor rated CR-6, as the first non-investment grade rating, is less vulnerable to default thanother non-investment obligors.
CR-7 BBAn obligor rated CR-7 can face major uncertainties. Exposure to negative business, financial, oreconomic conditions could lead to the obligor's insufficient financial profile and a deterioration ofthe obligor’s ability to meet its financial obligations.
CR-8 BB-An obligor rated CR-8 faces major ongoing uncertainties. Exposure to negative business, financial,or economic conditions could lead to the obligor's insufficient financial profile and a deteriorationof the obligor’s ability to meet its financial obligations.
CR-9 B+
Weak
An obligor rated CR-9 is less vulnerable to default than obligors rated 'CR-10’ or ‘CR-11'. Significantlynegative business, financial, or economic conditions will likely weaken the obligor's financial profileand ability to meet its financial obligations.
CR-10 BAn obligor rated CR-10 is more vulnerable to default than obligors rated 'CR-9’ but the obligor stillhas the capacity to meet its financial obligations. Negative business, financial, or economicconditions will likely weaken the obligor's financial profile and ability to meet its financial obligations.
CR-11 B-An obligor rated CR-11 is more vulnerable to default than obligors rated 'CR-9’ or ‘CR-10’. Theobligor still has the capacity to meet its obligations but slightly negative business, financial, oreconomic conditions are more likely to weaken the obligor's financial profile and ability to meet itsfinancial obligations than a company rated CR-10.
CR-12 CCC+Very Weak/SpecialAttention
An obligor rated CR-12 faces significant challenges. While such obligors will likely have somepositive characteristics, these may be outweighed by large uncertainties or major exposures toadverse conditions. The obligor is dependent upon favorable business, financial, and economicconditions to meet its financial obligations.
CR-13 CCC Very Weak/Substandard
An obligor rated CR-13 is currently vulnerable to default, and is dependent upon significantlyfavorable business, financial, and economic conditions to meet its financial obligations. In the eventof negative business, financial, or economic conditions, the obligor is not likely to meet its financialobligations and rescheduling and/or restructuring is likely to be required.
CR-14 CCC-ExtremelyWeak/Doubtful
An obligor rated CR-14 is highly vulnerable to default. It is highly likely that a rescheduling and/orrestructuring are required without which a default under IFC’s accounting definition would ensue.In some cases, even though default has not occurred yet, cash flow may be insufficient to servicedebt in full.
CR-15 Worsethan CCC-
and D
ImminentDefault/Default
An obligor rated CR-15 is currently extremely vulnerable to nonpayment and there are indicationsthat the next payment will not be made before meeting IFC’s accounting definition of default.
D An obligor rated D is in payment default according to IFC’s accounting definition of default.
INTERNATIONAL FINANCE CORPORATION Page 88
NOTES TO CONSOLIDATED FINANCIAL STATEMENTS
NOTE E – LOANS AND GUARANTEES (continued)

A summary of IFC’s disbursed loans at amortized cost by credit quality indicator effective June 30, 2020 and June 30, 2019 respectively,as well as by industry sector and geographic region follows (US$ millions):
VeryStrong Strong Adequate Moderate Weak
VeryWeak/Special
AttentionVery Weak/
Substandard
ExtremelyWeak/
Doubtful
ImminentDefault/ Default Total
Total disbursed loans atamortized cost at June30, 2020 $ 38 $ 891 $ 3,457 $ 7,475 $ 8,862 $ 1,355 $ 699 $ 952 $ 1,194 $24,923
Total disbursed loans atamortized cost at June30, 2019 $ 52 $ 825 $ 3,626 $ 9,020 $ 8,885 $ 227 $ 563 $ 296 $ 938 $24,432
June 30, 2020
VeryStrong Strong Adequate Moderate Weak
VeryWeak/Special
AttentionVery Weak/
Substandard
ExtremelyWeak/
Doubtful
ImminentDefault/ Default Total
Geographic RegionAsia $ — $ 165 $ 1,541 $ 2,411 $ 2,303 $ 218 $ 143 $ 124 $ 188 $ 7,093Europe, Middle East
and North Africa — 317 415 1,209 1,778 223 143 296 361 4,742Sub-Saharan Africa,
Latin America andCaribbean — 408 1,268 2,683 3,586 914 413 532 645 10,449
Other 38 1 233 1,172 1,195 — — — —* 2,639Total geographic
region $ 38 $ 891 $ 3,457 $ 7,475 $ 8,862 $ 1,355 $ 699 $ 952 $ 1,194 $24,923
June 30, 2020
VeryStrong Strong Adequate Moderate Weak
VeryWeak/Special
AttentionVery Weak/
Substandard
ExtremelyWeak/
Doubtful
ImminentDefault/ Default Total
Industry SectorManufacturing,
agribusiness andservices $ 38 $ 576 $ 1,175 $ 2,419 $ 1,358 $ 684 $ 179 $ 162 $ 548 $ 7,139
Financial markets — 39 1,752 4,377 4,066 174 80 174 81 10,743Infrastructure and
natural resources** — 276 530 679 3,438 497 440 616 565 7,041Disruptive
technologies andfunds** — — — — —* — — — — —*Total industry
sector $ 38 $ 891 $ 3,457 $ 7,475 $ 8,862 $ 1,355 $ 699 $ 952 $ 1,194 $24,923
* Less than $0.5 million.** Effective FY20, Telecom, Media and Technology (TMT) has been grouped in Infrastructure and natural resources resulting from an organizational change,and Venture capital and funds (VCF) has evolved into Disruptive Technologies and Funds (CDF).
INTERNATIONAL FINANCE CORPORATION Page 89
NOTES TO CONSOLIDATED FINANCIAL STATEMENTS
NOTE E – LOANS AND GUARANTEES (continued)
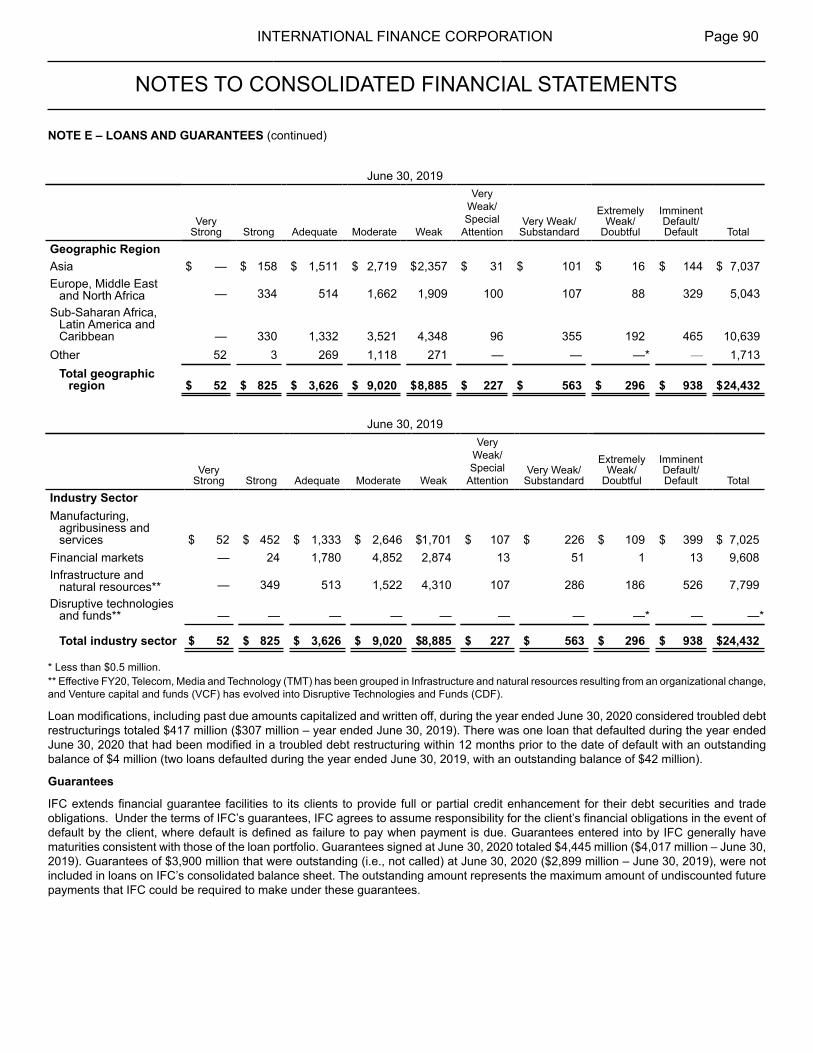
June 30, 2019
VeryStrong Strong Adequate Moderate Weak
VeryWeak/Special
AttentionVery Weak/
Substandard
ExtremelyWeak/
Doubtful
ImminentDefault/ Default Total
Geographic RegionAsia $ — $ 158 $ 1,511 $ 2,719 $2,357 $ 31 $ 101 $ 16 $ 144 $ 7,037Europe, Middle East
and North Africa — 334 514 1,662 1,909 100 107 88 329 5,043Sub-Saharan Africa,
Latin America andCaribbean — 330 1,332 3,521 4,348 96 355 192 465 10,639
Other 52 3 269 1,118 271 — — —* — 1,713Total geographic
region $ 52 $ 825 $ 3,626 $ 9,020 $8,885 $ 227 $ 563 $ 296 $ 938 $24,432
June 30, 2019
VeryStrong Strong Adequate Moderate Weak
VeryWeak/Special
AttentionVery Weak/
Substandard
ExtremelyWeak/
Doubtful
ImminentDefault/ Default Total
Industry SectorManufacturing,
agribusiness andservices $ 52 $ 452 $ 1,333 $ 2,646 $1,701 $ 107 $ 226 $ 109 $ 399 $ 7,025
Financial markets — 24 1,780 4,852 2,874 13 51 1 13 9,608Infrastructure and
natural resources** — 349 513 1,522 4,310 107 286 186 526 7,799Disruptive technologies
and funds** — — — — — — — —* — —*
Total industry sector $ 52 $ 825 $ 3,626 $ 9,020 $8,885 $ 227 $ 563 $ 296 $ 938 $24,432
* Less than $0.5 million.** Effective FY20, Telecom, Media and Technology (TMT) has been grouped in Infrastructure and natural resources resulting from an organizational change,and Venture capital and funds (VCF) has evolved into Disruptive Technologies and Funds (CDF).
Loan modifications, including past due amounts capitalized and written off, during the year ended June 30, 2020 considered troubled debtrestructurings totaled $417 million ($307 million – year ended June 30, 2019). There was one loan that defaulted during the year endedJune 30, 2020 that had been modified in a troubled debt restructuring within 12 months prior to the date of default with an outstandingbalance of $4 million (two loans defaulted during the year ended June 30, 2019, with an outstanding balance of $42 million).
Guarantees
IFC extends financial guarantee facilities to its clients to provide full or partial credit enhancement for their debt securities and tradeobligations. Under the terms of IFC’s guarantees, IFC agrees to assume responsibility for the client’s financial obligations in the event ofdefault by the client, where default is defined as failure to pay when payment is due. Guarantees entered into by IFC generally havematurities consistent with those of the loan portfolio. Guarantees signed at June 30, 2020 totaled $4,445 million ($4,017 million – June 30,2019). Guarantees of $3,900 million that were outstanding (i.e., not called) at June 30, 2020 ($2,899 million – June 30, 2019), were notincluded in loans on IFC’s consolidated balance sheet. The outstanding amount represents the maximum amount of undiscounted futurepayments that IFC could be required to make under these guarantees.
INTERNATIONAL FINANCE CORPORATION Page 90
NOTES TO CONSOLIDATED FINANCIAL STATEMENTS
NOTE E – LOANS AND GUARANTEES (continued)

Income from debt securities, including realized gains and losses on debt securities and associated derivatives for the years ended June 30,2020, June 30, 2019 and June 30, 2018 comprise the following (US$ millions):
2020 2019 2018Interest income $ 337 $ 362 $ 306Dividends — 6 3Realized gains on debt securities and associated derivatives 24 5 93Other-than-temporary impairments (130) (247)* (39)
Total income from debt securities, including realized gains on debt securitiesand associated derivatives $ 231 $ 126 $ 363
* Includes impairments of available-for-sale debt securities of $238 million for the year ended June 30, 2019 to write down cumulative foreign exchangelosses due to significant currency depreciation, as IFC considers the foreign exchange losses associated with those debt securities as other-than-temporary.
Debt securities accounted for as available-for-sale at June 30, 2020 and June 30, 2019 comprise (US$ millions):
June 30, 2020
Amortizedcost
Unrealizedgains
Unrealizedlosses
Foreign currencytransaction
losses Fair valueCorporate debt securities $ 3,190 $ 91 $ (67) $ (265) $ 2,949Preferred shares 70 81 (2) — 149Asset-backed securities 602 20 — (33) 589
Total $ 3,862 $ 192 $ (69) $ (298) $ 3,687
June 30, 2019
Amortizedcost
Unrealizedgains
Unrealizedlosses
Foreign currencytransaction
losses Fair valueCorporate debt securities $ 3,686 $ 104 $ (98) $ (93) $ 3,599Preferred shares 117 101 (1) — 217Asset-backed securities 692 — (17) (3) 672
Total $ 4,495 $ 205 $ (116) $ (96) $ 4,488
The following table shows the unrealized losses and fair value of debt securities at June 30, 2020 and June 30, 2019 by length of timethat individual securities had been in a continuous loss position where the fair value of securities declined below their cost basis (US$millions):
June 30, 2020Less than 12 months 12 months or greater TotalFair
valueUnrealized
lossesFair
valueUnrealized
lossesFair
valueUnrealized
lossesCorporate debt securities $ 168 $ (27) $ 415 $ (40) $ 583 $ (67)Preferred shares 1 (1) 1 (1) 2 (2)Asset-backed securities — — — — — —
Total $ 169 $ (28) $ 416 $ (41) $ 585 $ (69)
INTERNATIONAL FINANCE CORPORATION Page 91
NOTES TO CONSOLIDATED FINANCIAL STATEMENTS
NOTE F – DEBT SECURITIES

June 30, 2019Less than 12 months 12 months or greater TotalFair
valueUnrealized
lossesFair
valueUnrealized
lossesFair
valueUnrealized
lossesCorporate debt securities $ 301 $ (25) $ 893 $ (73) $ 1,194 $ (98)Preferred shares — — 8 (1) 8 (1)Asset-backed securities — — 107 (17) 107 (17)
Total $ 301 $ (25) $ 1,008 $ (91) $ 1,309 $ (116)
Corporate debt securities comprise investments in bonds and notes. Fair value associated with corporate debt securities is primarilyattributable to movements in the credit default swap spread curve applicable to the issuer, and also impacted by movements in the risk-free rates and foreign currency exchange rates. Based upon IFC’s assessment of expected credit losses, IFC has determined that theissuer is expected to make all contractual principal and interest payments. Accordingly, IFC expects to recover the cost basis of thesesecurities.
Preferred shares comprise investments in preferred equity investments that are redeemable at the option of IFC or mandatorily redeemableby the issuer. Unrealized losses associated with preferred shares are primarily driven by changes in discount rates associated with changesin credit spreads or interest rates, minor changes in exchange rates and comparable market valuations in the applicable sector. Basedupon IFC’s assessment of the expected credit losses, IFC expects to recover the cost basis of these securities.
Debt securities with contractual maturities that are accounted for as available-for-sale have contractual maturities during the years endingJune 30, 2021 through June 30, 2025 and thereafter, as follows (US$ millions):
2021 2022 2023 2024 2025 Thereafter TotalCorporate debt securities $ 496 $ 395 $ 455 $ 304 $ 551 $ 724 $ 2,925Asset-backed securities 38 72 108 245 70 36 569
Total disbursed portfolio of debtsecurities with contractualmaturities $ 534 $ 467 $ 563 $ 549 $ 621 $ 760 $ 3,494
The expected maturity of asset-backed securities may differ from the contractual maturity, as reported above, due to prepayment features.In addition, IFC has $70 million of redeemable preferred shares and other debt securities with undefined maturities ($117 million - June 30,2019).
The currency composition and average contractual rate of debt securities with contractual maturities that are accounted for as available-for-sale are summarized below:
June 30, 2020 June 30, 2019
Amount (US$ millions)
Averagecontractual
rate (%)Amount
(US$ millions)
Averagecontractual
rate (%)Indian rupee 1,251 8.4 1,505 8.4US dollar 936 3.8 1,240 5.1Euro 705 3.3 759 3.2Turkish lira 248 13.8 307 13.2Colombian peso 225 5.0 301 6.8Swiss franc 40 2.0 39 2.0South African rand 31 11.3 41 11.3Chilean peso 25 7.6 30 7.7Vietnamese dong 15 6.0 15 6.0Mexican peso 11 10.9 20 13.7Other currencies 7 6.0 49 9.5
Total disbursed portfolio of debt securities with contractualmaturities $ 3,494 6.2 $ 4,306 6.8
After the effect of interest rate swaps and currency swaps, IFC’s debt securities with contractual maturities that are accounted for asavailable-for-sale are principally denominated in variable rate US dollars.
INTERNATIONAL FINANCE CORPORATION Page 92
NOTES TO CONSOLIDATED FINANCIAL STATEMENTS
NOTE F – DEBT SECURITIES (continued)

Nonaccruing debt securities
Debt securities on which the accrual of interest has been discontinued amounted to $56 million at June 30, 2020 ($51 million – June 30,2019). The interest income on such debt securities for the year ended June 30, 2020, June 30, 2019 and June 30, 2018 is summarizedas follows (US$ millions):
2020 2019 2018Interest income not recognized on nonaccruing debt securities $ 9 $ 4 $ 1Interest income recognized on debt securities in nonaccrual status related to current and prior
years, on a cash basis $ 7 $ 1 $ —*
* Less than $0.5 million.
INTERNATIONAL FINANCE CORPORATION Page 93
NOTES TO CONSOLIDATED FINANCIAL STATEMENTS
NOTE F – DEBT SECURITIES (continued)
NOTE G – EQUITY INVESTMENTS AND ASSOCIATED DERIVATIVES
Income from equity investments and associated derivatives for the years ended June 30, 2020, June 30, 2019 and June 30, 2018 comprisesthe following (US$ millions):
2020 2019 2018Unrealized (losses) gains on equity investments and associated derivatives* $ (1,603) $ (918) $ 17Realized gains on equity investments and associated derivatives, net $ 363 $ 425 $ 992
(Losses) gains on equity investments and associated derivatives, net $ (1,240) $ (493) $ 1,009Dividends 158 238 282Other-than-temporary impairments:
Equity investments at cost less impairment — — (264)Equity investments available-for-sale — — (182)
Total other-than-temporary impairments — — (446)
Custody, fees and other 15 2 8
Total (loss) income from equity investments and associated derivatives $ (1,067) $ (253) $ 853
* Including unrealized gains and losses related to equity securities still held at June 30, 2020 - net losses of $1,159 million for the year ended June 30,2020.
Equity investments include several private equity funds that invest primarily in emerging markets across a range of sectors and that areaccounted for at fair value under the Fair Value Option. The fair values of these funds have been determined using the net asset value ofIFC’s ownership interest in partners’ capital as a practical expedient and totaled $3,777 million as of June 30, 2020 ($4,191 million - June 30,2019). These investments cannot be redeemed. Instead distributions are received through the liquidation of the underlying assets of thefunds. IFC estimates that the underlying assets of the funds will be liquidated over five to eight years. As of June 30, 2020, the maximumunfunded commitments subject to capital calls for these funds are $1,347 million ($1,121 million - June 30, 2019). As of June 30, 2020,IFC invested $565 million ($840 million - June 30, 2019) as a limited partner in funds managed by AMC. The sale of IFC’s limited partnerinterests in these funds needs prior consent from the other limited partners.
NOTE H – INVESTMENT TRANSACTIONS COMMITTED BUT NOT DISBURSED OR UTILIZED
Loan, equity and debt security commitments signed but not yet disbursed, and guarantee and client risk management facilities signed butnot yet utilized are summarized below (US$ millions):
June 30, 2020 June 30, 2019Investment transactions committed but not disbursed:
Loans, equity investments and debt securities $ 10,034 $ 9,195Investment transactions committed but not utilized:
Guarantees 545 1,118Client risk management facilities 191 150
Total investment transactions committed but not disbursed or utilized $ 10,770 $ 10,463
The disbursements of investment transactions committed but not disbursed or utilized are generally subject to fulfillment of conditions ofdisbursement.

Loan participations signed as commitments for which disbursement has not yet been made and loan participations disbursed and outstandingwhich are serviced by IFC for participants are as follows (US$ millions):
June 30, 2020 June 30, 2019Loan participations signed as commitments but not disbursed $ 1,419 $ 1,504Loan participations disbursed and outstanding which are serviced by IFC $ 7,878 $ 8,166
INTERNATIONAL FINANCE CORPORATION Page 94
NOTES TO CONSOLIDATED FINANCIAL STATEMENTS
NOTE I - LOAN PARTICIPATIONS
NOTE J – RECEIVABLES AND OTHER ASSETS
Receivables and other assets are summarized below (US$ millions):
June 30, 2020 June 30, 2019Receivables from unsettled security trades $ 831 $ 499Accrued income on derivative instruments 556 704Accrued interest income on loans 294 352Accrued interest income on time deposits and securities 133 153
Fixed assets 1,211 1,167Less: Accumulated depreciation (664) (615)
Fixed assets, net 547 552
Deferred charges and other assets 1,786 1,594
Total receivables and other assets $ 4,147 $ 3,854

Market borrowings and associated derivativesIFC's borrowings outstanding from market sources and currency and interest rate swaps, net of unamortized issue premiums anddiscounts, are summarized below:
June 30, 2020
Market borrowingsCurrency swaps payable
(receivable)Interest rate swaps notional
principal payable (receivable) Net currency obligation
Amount (US$
millions)
Weightedaverage rate
(%)
Amount (US$
millions)
Weightedaverage rate
(%)Notional amount (US$ millions)
Weightedaverage rate
(%)
Amount (US$
millions)
Weightedaveragerate (%)
US dollar $ 24,350 1.7 $ 27,158 0.9 $ 24,983 1.0 $ 51,613 0.9— — — — (24,878) (1.7) — —
Australian dollar 7,687 3.3 (7,687) 3.3 — — — —— — — — — — — —
Mexican peso 3,324 7.6 (3,324) 7.7 — — — —Pounds sterling 3,024 1.2 (3,024) 1.2 — — — —New Turkish lira 2,112 11.8 (2,075) 12.0 — — 37 0.5Japanese yen 1,785 1.7 (1,785) 1.7 — — — —Swedish kronor 1,785 0.6 (1,785) 0.6 — — — —Indian rupee 1,422 6.6 — — — — 1,422 6.6New Zealand dollar 1,316 2.5 (1,316) 2.5 — — — —Brazilian real 1,154 4.7 (1,154) 4.7 — — — —Canadian dollar 914 1.8 (914) 1.8 — — — —Euro 849 2.2 (849) 2.2 — — — —South African rand 748 6.6 (748) 7.3 — — — —Russian ruble 730 5.8 (730) 5.8 — — — —Chinese renminbi 325 2.6 (325) 2.6 — — — —Norwegian kroner 240 2.5 (240) 2.5 — — — —Kazakhstan tenge 203 9.6 (180) 9.7 — — 23 8.3Indonesian rupiah 140 8.0 — — — — 140 8.0Peruvian Soles nuevo 95 2.7 (95) 2.7 — — — —Philippine peso 86 6.3 — — — — 86 6.3Colombian peso 84 4.9 (84) 4.9 — — — —Ukraine hrivnya 72 15.1 (61) 15.4 — — 11 13.6Georgian lari 65 9.4 — — — — 65 9.4Peso uruguayo 49 12.0 (49) 12.0 — — — —New Romanian lei 44 2.7 (32) 2.7 — — 12 2.7Costa Rican colon 44 6.6 (34) 6.0 — — 10 8.4Hong Kong dollar 39 2.2 (39) 2.2 — — — —Uzbekistan sum 29 9.3 (28) 9.3 — — 1 8.9Nigerian naira 28 7.9 (28) 7.9 — — — —Chilean peso 24 2.8 (24) 2.8 — — — —Czech koruna 23 1.1 (23) 1.1 — — — —Botswana pula 22 3.3 — — — — 22 3.3New Ghanaian cedi 21 13.1 (21) 13.1 — — — —Bangladeshi taka 19 6.7 — — — — 19 6.7Namibia dollar 10 9.8 — — — — 10 9.8Dominican peso 7 7.7 (4) 7.1 — — 3 8.5New Serbian dinar 1 3.8 — — — — 1 3.8
Principal at face value $ 52,870 $ 500 $ 105 $ 53,475 1.1Short-term borrowings from
market and other sources 2,994
55,864Unamortized discounts, net (2,456)Total market borrowings 53,408Fair value adjustments 1,457Carrying amount of market
borrowings $ 54,865
INTERNATIONAL FINANCE CORPORATION Page 95
NOTES TO CONSOLIDATED FINANCIAL STATEMENTS
NOTE K – BORROWINGS

June 30, 2019
Market borrowingsCurrency swaps payable
(receivable)Interest rate swaps notional
principal payable (receivable) Net currency obligation
Amount (US$
millions)
Weightedaverage rate
(%)
Amount (US$
millions)
Weightedaverage rate
(%)Notional amount (US$ millions)
Weightedaverage rate
(%)
Amount(US$
millions)
Weightedaverage rate
(%)
US dollar $ 25,137 2.3 $ 26,083 2.5 $ 25,940 2.7 $ 51,301 2.6(25,859) (2.3)
Australian dollar 7,910 3.5 (7,910) 3.5 — — — —— —
Mexican peso 4,272 7.7 (4,272) 7.7 — — — —Turkish lira 2,868 11.8 (2,825) 12.0 — — 43 0.8Japanese yen 2,406 3.1 (2,406) 3.1 — — — —Pounds sterling 2,208 1.3 (2,208) 1.4 — — — —Indian rupee 1,582 6.6 — — — — 1,582 6.6Brazilian real 1,528 4.8 (1,528) 4.8 — — — —New Zealand dollar 1,501 3.3 (1,501) 3.3 — — — —Russian ruble 1,024 6.9 (1,024) 6.9 — — — —Euro 800 2.3 (800) 2.3 — — — —Swedish kronor 666 1.0 (666) 1.0 — — — —South African rand 513 5.8 (513) 7.2 — — — —Canadian dollar 382 2.4 (382) 2.4 — — — —Chinese renminbi 380 3.4 (234) 3.5 — — 146 3.1Indonesian rupiah 142 8.0 — — — — 142 8.0New Romanian lei 133 2.9 (105) 2.7 — — 28 3.4Hong Kong dollar 128 1.6 (128) 1.6 — — — —Kazakhstan tenge 105 8.6 (78) 8.7 — — 27 8.3Peruvian Soles nuevo 91 2.6 (91) 2.6 — — — —Philippine peso 90 6.3 — — — — 90 6.3Colombian peso 83 5.1 (83) 5.1 — — — —Peso uruguayo 82 11.4 (82) 11.4 — — — —Ukraine hrivnya 66 15.3 (52) 15.8 — — 14 13.6Uzbekistan sum 56 9.5 (41) 9.6 — — 15 9.5Georgian lari 38 8.0 — — — — 38 8.0Chilean peso 32 2.7 (32) 2.7 — — — —Nigerian naira 26 8.7 (26) 8.7 — — — —Costa Rican colon 26 7.0 (16) 6.1 — — 10 8.4Botswana pula 24 4.0 — — — — 24 4.0New Ghanaian cedi 23 9.7 (23) 9.7 — — — —Namibia dollar 13 9.8 — — — — 13 9.8Polish zloty 7 1.3 (7) 1.3 — — — —Dominican peso 4 8.7 — — — — 4 8.7New Serbian dinar 3 3.8 — — — — 3 3.8
Principal at face value $ 54,349 $ (950) $ 81 $ 53,480 2.8Short-term borrowings from
market and othersources 2,207
56,556Unamortized discounts, net (3,127)Total market borrowings 53,429Fair value adjustments (14)Carrying amount of
market borrowings $ 53,415
INTERNATIONAL FINANCE CORPORATION Page 96
NOTES TO CONSOLIDATED FINANCIAL STATEMENTS
NOTE K – BORROWINGS (continued)

The net currency obligations not fully hedged by borrowings related swaps have generally been invested and/or on-lent to clients in suchcurrencies.
The weighted average remaining maturity of IFC’s borrowings from market sources was 7.4 years at June 30, 2020 (8.2 years - June 30,2019).
Charges on borrowings for the year ended June 30, 2020 include $13 million of interest expense on secured borrowings ($16 million –year ended June 30, 2019 and $6 million – year ended June 30, 2018) and is net of $7 million of gains on buybacks of market borrowings($1 million – year ended June 30, 2019; $2 million - year ended June 30, 2018).
The net nominal amount payable from currency swaps of $500 million and the net notional amount payable from interest rate swaps of$105 million at June 30, 2020 (receivable of $950 million from currency swaps and payable of $81 million from interest rate swaps - June 30,2019), shown in the above table, are represented by currency and interest rate swap assets at fair value of $1,624 million and currencyand interest rate swap liabilities at fair value of $2,867 million ($896 million and $2,858 million - June 30, 2019), included in derivativeassets and derivative liabilities, respectively, on the consolidated balance sheet.
Short-term market borrowings
IFC’s short-term Discount Note Program has maturities ranging from overnight to one year. The amount outstanding under the programat June 30, 2020 is $2,994 million ($2,207 million - June 30, 2019). Charges on borrowings for the year ended June 30, 2020, include$39 million in respect of this program ($63 million - June 30, 2019 and $38 million – June 30, 2018).
Borrowings from IDA
Borrowings outstanding from IDA are summarized below:
June 30, 2020
IDA Borrowings
Interest rate swap notionalprincipal
payable (receivable) Net currency obligationPrincipalamount
(US$ millions)
Weightedaveragecost (%)
Notionalamount
(US$ millions)
Weightedaveragecost (%)
Notionalamount (US$ millions)
Weightedaveragecost (%)
US dollar $ 597 1.8 $ 597 0.3 $ 597 0.3(597) (1.8)
Total IDA borrowings outstanding $ 597 $ — $ 597 0.3Fair value adjustments 24
Carrying amount of IDA borrowings $ 621
June 30, 2019
IDA Borrowings
Interest rate swap notionalprincipal
payable (receivable) Net currency obligationPrincipalamount
(US$ millions)
Weightedaveragecost (%)
Notionalamount
(US$ millions)
Weightedaveragecost (%)
Notionalamount (US$ millions)
Weightedaveragecost (%)
US dollar $ 721 1.8 $ 721 1.9 $ 721 1.9(721) (1.8)
Total IDA borrowings outstanding $ 721 $ — $ 721 1.9Fair value adjustments (4)
Carrying amount of IDA borrowings $ 717
The weighted average remaining maturity of borrowings from IDA was 3.6 years at June 30, 2020 (3.9 years - June 30, 2019). Chargeson borrowings for the year ended June 30, 2020, includes $12 million ($14 million - year ended June 30, 2019; $17 million - year endedJune 30, 2018) in respect of borrowings from IDA.
INTERNATIONAL FINANCE CORPORATION Page 97
NOTES TO CONSOLIDATED FINANCIAL STATEMENTS
NOTE K – BORROWINGS (continued)

Maturity of borrowings
The principal amounts repayable on borrowings outstanding in all currencies during the years ending June 30, 2021, through June 30,2025, and thereafter are summarized below (US$ millions):
2021 2022 2023 2024 2025 Thereafter TotalBorrowings from market sources $ 10,871 $ 7,868 $ 7,512 $ 5,086 $ 7,879 $ 13,654 $ 52,870Short-term borrowings from
market and other sources 2,994 — — — — — 2,994Borrowings from IDA 125 114 96 77 61 124 597
Total borrowings, gross $ 13,990 $ 7,982 $ 7,608 $ 5,163 $ 7,940 $ 13,778 $ 56,461Unamortized discounts, net (2,456)Fair value adjustments 1,481
Carrying amount of borrowings $ 55,486
After the effect of interest rate and currency swaps, IFC’s borrowings generally reprice within one year.
INTERNATIONAL FINANCE CORPORATION Page 98
NOTES TO CONSOLIDATED FINANCIAL STATEMENTS
NOTE K – BORROWINGS (continued)
NOTE L – PAYABLES AND OTHER LIABILITIESPayables and other liabilities are summarized below (US$ millions):
June 30, 2020 June 30, 2019Liabilities under retirement benefit plans $ 1,981 $ 967Accounts payable, accrued expenses and other liabilities 1,810 1,753Payables for unsettled security trades 1,236 960Accrued charges on borrowings 579 623Accrued charges on derivative instruments 320 516Secured borrowings & short sold securities 156 195Deferred income 76 87
Total payables and other liabilities $ 6,158 $ 5,101
NOTE M – CAPITAL TRANSACTIONS
Following the Spring Meetings in April 2018, a financing package was endorsed by the Board of Governors that included a three-stepcapital raising process: conversion of a portion of retained earnings into paid-in capital, a Selective Capital Increase (SCI) and a GeneralCapital Increase (GCI) that would provide up to $5.5 billion in additional paid-in capital. The SCI and GCI Resolutions were adopted andbecame effective on April 16, 2020 and the subscription process was formally launched on April 22, 2020. The member countries maysubscribe to the increased authorized capital stock as per the SCI and GCI not later than three years from the date of effectiveness of theincrease in the authorized capital stock. The member countries shall make payment of the subscription price of shares subscribed for allsuch shares at any time or for some such shares from time to time prior to April 15, 2023 for SCI and prior April 15, 2025 for GCI.The authorized capital stock was increased by the creation of 16,999,998 additional shares each having a par value of $1,000 afterconverting a portion of the retained earnings into paid-in capital. The authorized capital stock was increased by 919,998 and 4,579,995shares of capital stock each having a par value of $1,000 as per the SCI and GCI respectively. The authorized capital stock as on June30, 2020 consists of 25,079,991 shares of $1,000 par value each (2,580,000 shares at June 30, 2019). During the year ended June 30, 2020, nine countries subscribed a total of $799 million (GCI of $621 million and SCI of $178 million). Asof June 30, 2020, no payment was received. Subsequent to June 30,2020, total capital worth $525 million was subscribed by five countriesand total payment of $57 million was received from three countries. For the year ended June 30, 2019, $0.5 million was subscribed andpaid by a new member country (no shares were subscribed or paid by member countries during the year ended June 30, 2018). Under IFC’s Articles of Agreement, in the event a member withdraws from IFC, IFC and the member may negotiate on the repurchase ofthe member’s capital stock on such terms as may be appropriate under the circumstances. Such agreement may provide, among otherthings, for a final settlement of all obligations of the member to IFC. If such an agreement is not made within six months after the memberwithdraws or such other time as IFC and the member may agree, the repurchase price of the member’s capital stock shall be the valuethereof shown by the books of IFC on the day when the member withdraws. The repurchase of capital stock is subject to certain conditionsincluding payments in installments, at such times and in such available currency or currencies as IFC reasonably determines, taking intoaccount the financial position of IFC. IFC’s Articles of Agreement also provide for the withdrawing member to repay losses on loans andequity investments in excess of reserves provided on the date of withdrawal.

NOTE N – OTHER INCOME
Other income for the years ended June 30, 2020, June 30, 2019 and June 30, 2018 comprise the following (US$ millions):
June 30, 2020 June 30, 2019 June 30, 2018Income from AMC consolidated entities* $ 31 $ 64 $ 80Other reimbursable arrangements 24 25 26Fees collected from clients 18 23 22Investment gain on PEBP assets 11 24 25Others 53 48 18
Total Other Income $ 137 $ 184 $ 171
* Income reported until AMC merged with IFC on January 31, 2020.
INTERNATIONAL FINANCE CORPORATION Page 99
NOTES TO CONSOLIDATED FINANCIAL STATEMENTS
NOTE O – RETAINED EARNINGS DESIGNATIONS AND RELATED EXPENDITURES AND ACCUMULATED OTHERCOMPREHENSIVE INCOME
Designated retained earnings
The components of designated retained earnings and related expenditures are summarized below (US$ millions):
Grants toIDA
AdvisoryServices
CreatingMarketsAdvisoryWindow
Performance-basedGrants
SMEVentures for
IDAcountries
TotalDesignatedRetainedEarnings
At June 30, 2017 $ — $ 99 $ — $ 8 $ 18 $ 125Year ended June 30, 2018
Designations of retained earnings 80 40 85 — — 205Reallocation of prior year designations — (49) 49 — — —Expenditures against designated retained
earnings (80) (44) (12) (3) (1) (140)
At June 30, 2018 $ — $ 46 $ 122 $ 5 $ 17 $ 190Year ended June 30, 2019
Designations of retained earnings 115 45 70 — — 230Expenditures against designated retained
earnings — (25) (26) (2) (1) (54)
At June 30, 2019 $ 115 $ 66 $ 166 $ 3 $ 16 $ 366Year ended June 30, 2020
Designations of retained earnings 98 24 — — — 122Expenditures against designated retained
earnings — (21) (31) (2) (1) (55)
At June 30, 2020 $ 213 $ 69 $ 135 $ 1 $ 15 $ 433
On August 8, 2019, the Board of Directors approved a designation of $24 million of IFC’s retained earnings for Advisory Services, and,subject to the conditions detailed on page 24, a designation of $98 million of IFC’s retained earnings for grants to IDA. These designationswere noted with approval by the Board of Governors on October 18, 2019.
IFC did not recognize expenditures against designations for grants to IDA in FY19 from FY18 designation and the transfer was deferredto FY20 due to IFC's net loss for the nine months ended March 31, 2019 in accordance with the Board of Directors approved frameworkfor designations.
IFC did not recognize expenditures against designations for grants to IDA in FY20 from FY18 and FY19 designations, and both transferswere deferred to FY21, due to IFC's net loss for the nine months ended March 31, 2020.

Accumulated other comprehensive loss
The components of accumulated other comprehensive loss at June 30, 2020 and June 30, 2019 are summarized as follows (US$ millions):
June 30, 2020 June 30, 2019Net unrealized losses on available-for-sale debt securities $ (175) $ (7)Net unrealized gains on borrowings at fair value under the fair value option due to changes in instrument-
specific credit risk 419 131Unrecognized net actuarial losses and unrecognized prior service costs on benefit plans (2,228) (1,356)
Total accumulated other comprehensive loss $ (1,984) $ (1,232)
INTERNATIONAL FINANCE CORPORATION Page 100
NOTES TO CONSOLIDATED FINANCIAL STATEMENTS
NOTE O – RETAINED EARNINGS DESIGNATIONS AND RELATED EXPENDITURES AND ACCUMULATED OTHERCOMPREHENSIVE INCOME (continued)
NOTE P – NET UNREALIZED GAINS AND LOSSES ON NON-TRADING FINANCIAL INSTRUMENTS ACCOUNTED FOR AT FAIRVALUE
Net unrealized gains and losses on non-trading financial instruments accounted for at fair value for the years ended June 30, 2020, June 30,2019 and June 30, 2018 comprise (US$ millions):
2020 2019 2018Unrealized gains and losses on loans, debt securities and associated derivatives:
Unrealized (losses) gains on loans and associated derivatives $ (302) $ (209) $ 108Unrealized (losses) gains on debt securities and associated derivatives (121) 6 73
Total net unrealized (losses) gains on loans, debt securities and associatedderivatives (423) (203) 181
Unrealized gains and losses on borrowings from market, IDA and associatedderivatives:Unrealized gains and losses on market borrowings accounted for at fair value:
Credit spread component* — — (278)Interest rate, foreign exchange and other components (1,690) (1,452) 1,353Total unrealized (losses) gains on market borrowings (1,690) (1,452) 1,075
Unrealized gains (losses) on derivatives associated with market borrowings 1,501 1,469 (1,189)Unrealized (losses) gains on borrowings from IDA accounted for at fair value (29) (32) 21
Total net unrealized (losses) on borrowings from market, IDA and associatedderivatives (218) (15) (93)
Net unrealized gains and losses on non-trading financial instruments accounted for atfair value $ (641) $ (218) $ 88
* As discussed in Note A, “Summary of significant accounting and related policies”, effective July 1, 2018, the portion of the change in fair value of borrowingsunder the FVO resulting from the change of IFC’s own credit risk is recorded in other comprehensive income. In prior periods, these amounts were recognizedin net income. Market borrowings economically hedged with financial instruments, including derivatives, accounted for at fair value under the Fair ValueOption. Differences arise between the movement in the fair value of market borrowings and the fair value of the associated derivativesprimarily due to movements in IFC's own credit risk spread, foreign currency exchange risk premiums and accrued interest balances. Themagnitude and direction (gain or loss) can be volatile from period to period but they do not alter the timing of cash flows on marketborrowings. Changes in the fair value of borrowings resulting from changes in IFC’s own credit risk spread are recorded through othercomprehensive income whereas changes in fair value due to other factors, and all fair value changes on hedging derivatives, are accountedthrough earnings.

As discussed in Note A, “Summary of significant accounting and related policies”, IFC enters into transactions in various derivativeinstruments for financial risk management purposes in connection with its principal business activities, including lending, investing in debtsecurities, equity investments, client risk management, borrowing, liquid asset management and asset and liability management. None ofthese derivative instruments are designated as hedging instruments under ASC Topic 815. Note A describes IFC’s risk management anduse of derivative instruments.
The fair value of derivative instrument assets and liabilities by risk type at June 30, 2020 and June 30, 2019 is summarized as follows (US$ millions):
Consolidated Balance Sheet location June 30, 2020 June 30, 2019Derivative assetsInterest rate $ 1,366 $ 505Foreign exchange 176 93Interest rate and currency 2,577 2,097Equity 153 161Credit and other 42 —
Total derivative assets $ 4,314 $ 2,856Derivative liabilitiesInterest rate $ 1,052 $ 699Foreign exchange 123 189Interest rate and currency 3,185 3,065Equity 4 11
Credit and other 19 —
Total derivative liabilities $ 4,383 $ 3,964
INTERNATIONAL FINANCE CORPORATION Page 101
NOTES TO CONSOLIDATED FINANCIAL STATEMENTS
NOTE Q – DERIVATIVES

The effect of derivative instrument contracts on the consolidated statement of operations for the years ended June 30, 2020, June 30,2019 and June 30, 2018 is summarized as follows (US$ millions):
Derivative riskcategory Consolidated Statement of Operations location 2020 2019 2018Interest rate Loss from loans and guarantees, including realized gains and losses on
loans and associated derivatives $ (6) $ — $ (3)(Loss) income from debt securities, including realized gains and losses on
debt securities and associated derivatives (3) 5 4Loss from liquid asset trading activities (201) (88) (2)Charges on borrowings 41 (65) 101Other income 22 22 (6)Net unrealized gains (losses) on non-trading financial instruments
accounted for at fair value 594 659 (478)Foreign exchange Income from liquid asset trading activities 656 306 158
Foreign currency transaction losses on non-trading activities (5) (320) (182)Net unrealized (losses) gains on non-trading financial instruments
accounted for at fair value — (2) 1Interest rate andcurrency
Loss from loans and guarantees, including realized gains and losses onloans and associated derivatives (81) (71) (147)
Loss from debt securities, including realized gains and losses on debtsecurities and associated derivatives (31) (4) (31)
Income from liquid asset trading activities 204 191 139Charges on borrowings 639 535 731Foreign currency transaction losses on non-trading activities (818) (474) (1,071)Other income 3 2 —Net unrealized gains (losses) on non-trading financial instruments
accounted for at fair value 565 549 (507)Equity Income (loss) from equity investments and associated derivatives 14 (64) 4
Income (loss) from loans and guarantees, including realized gains andlosses on loans and associated derivatives — 39 (10)
Net unrealized (losses) gains on non-trading financial instrumentsaccounted for at fair value (14) (5) 9
Other derivativecontracts
Net unrealized gains on non-trading financial instruments accounted forat fair value 23 — —
Total $ 1,602 $ 1,215 $ (1,290)
The income related to each derivative risk category includes realized and unrealized gains and losses.
At June 30, 2020, the outstanding volume, measured by US$ equivalent notional, of interest rate contracts was $50,683 million ($51,273million at June 30, 2019), foreign exchange contracts was $18,668 million ($21,509 million at June 30, 2019) and interest rate and currencycontracts was $43,825 million ($43,225 million at June 30, 2019). At June 30, 2020, there were 168 equity contracts related to IFC’s loanand equity investment portfolio and 21 other derivative contract recognized as derivatives assets or liabilities under ASC Topic 815 (187equity risk and no other contracts at June 30, 2019).
INTERNATIONAL FINANCE CORPORATION Page 102
NOTES TO CONSOLIDATED FINANCIAL STATEMENTS
NOTE Q – DERIVATIVES (continued)

Many of IFC’s financial instruments are not actively traded in any market. Accordingly, estimates and present value calculations of futurecash flows are used to estimate the fair values. Determining future cash flows for fair value estimation is subjective and imprecise, andminor changes in assumptions or methodologies may materially affect the estimated values. The excess or deficit resulting from thedifference between the carrying amounts and the fair values presented does not necessarily reflect the values which will ultimately berealized, since IFC generally holds loans, borrowings and other financial instruments with contractual maturities with the aim of realizingtheir contractual cash flows.
The estimated fair values as of June 30, 2020 and June 30, 2019 reflect multiple factors such as interest rates, credit risk, foreign currencyexchange rates and commodity prices. Reasonable comparability of fair values among financial institutions is not likely because of thewide range of permitted valuation techniques and numerous estimates that must be made in the absence of secondary market prices.This lack of objective pricing standard in the market introduces a greater degree of subjectivity and volatility to these derived or estimatedfair values. Therefore, while disclosure of estimated fair values of financial instruments is required, readers are cautioned in using thesedata for purposes of evaluating the financial condition of IFC. The fair values of the individual financial instruments do not represent thefair value of IFC taken as a whole.
COVID-19 has had a significant negative impact on the valuation of IFC’s equity investment portfolio at June 30, 2020. Recognizing thereis a heightened degree of uncertainty and judgment in incorporating the impact of COVID-19, IFC has utilized, where available, comparator,sector and country information, in addition to discounted cash flow models, in valuing its equity investment portfolio at June 30, 2020.Valuations of equity investments at June 30, 2020 were significantly lower than as of June 30, 2019. Debt securities and loans accountedfor at fair value that do not have available market prices were primarily valued using discounted cash flow approaches and reflected spreadsat June 30, 2020.
All of IFC’s financial instruments in its liquid assets portfolio are managed according to an investment authority approved by the Board ofDirectors and investment guidelines approved by IFC’s Corporate Risk Committee, a subcommittee of IFC’s Management Team. Thirdparty independent vendor prices are used to price the vast majority of the liquid assets. The vendor prices are evaluated by IFC’s Treasurydepartment and IFC’s Corporate and Portfolio Risk Management department maintains oversight for the pricing of liquid assets.
IFC’s regional and industry departments are primarily responsible for fair valuing IFC’s investment portfolio (equity investments, debtsecurities, loan investments and related derivatives). The Investment Valuation Unit in IFC's Corporate Risk Management department inthe Risk and Finance Vice Presidency provides oversight over the fair valuation process by monitoring and reviewing the fair values ofIFC’s investment portfolio. IFC's Operations Committee, a subcommittee of IFC’s management team, is also responsible for oversight ofcomplex or high risk projects, Debt and Equity portfolio performance and asset allocation.
IFC’s borrowings are fair valued by the Quantitative Analysis department in IFC’s Treasury and Syndications Vice Presidency under theoversight of the Corporate Risk Management department.
The significant unobservable input used in the fair value measurement of certain IFC local currency borrowings is the IFC yield curve ineach currency which defines the discount curve. Increases (decreases) in yield curve in isolation would have resulted in a lower (higher)fair value measurement. The portion of the total change in fair value of borrowings, accounted for at fair value, resulting from a change inIFC’s own credit spread is reported as a separate component of OCI.
The significant unobservable inputs used in the fair value measurement of interest rate swaps are yield curve points. Increases (decreases)in yield curve points in isolation would have resulted in a lower (higher) fair value measurement. The significant unobservable inputs usedin the fair value measurement of currency swaps are yield curve points and exchange rates. Increases (decreases) in yield curve pointsand local exchange rates against US$ in isolation would have resulted in a lower (higher) fair value measurement.
The significant unobservable inputs used in the fair value measurement of debt securities and loans are discount rates, valuation multiples,credit default spreads and recovery rates. Increases (decreases) in discount rates, credit default spreads in isolation would have resultedin a lower (higher) fair value measurement. Increases (decreases) in any of the valuation multiples and recovery rates in isolation wouldhave resulted in a higher (lower) fair value measurement.
The significant unobservable inputs used in the fair value measurement of equity securities and equity related derivatives are cost of equity,growth rates, return on assets, perpetual growth rates, discounts for lack of marketability, weighted average cost of capital, EV/EBITDA,price to book value and other valuation multiples and volatilities. Increases (decreases) in any of cost of equity, weighted average cost ofcapital and discount for lack of marketability in isolation could have resulted in a lower (higher) fair value measurement. Increases (decreases)in any of growth rate, return on assets, perpetual growth rate, volatility, EV/EBITDA, price to book value and other multiples in isolationcould have resulted in a higher (lower) fair value measurement.
The methodologies used and key assumptions made to estimate fair values as of June 30, 2020, and June 30, 2019, are summarizedbelow.
Liquid assets - The primary pricing source for the liquid assets is valuations obtained from external pricing services (vendor prices). Themost liquid securities in the liquid asset portfolio are exchange traded futures, options, and US Treasuries. US Treasuries and USGovernment agency bonds are classified as Level 1. The remaining liquid assets valued using vendor prices are classified as Level 2 orLevel 3 based on the results of IFC’s evaluation of the vendor’s pricing methodologies and individual security facts and circumstances.
INTERNATIONAL FINANCE CORPORATION Page 103
NOTES TO CONSOLIDATED FINANCIAL STATEMENTS
NOTE R – FAIR VALUE MEASUREMENTS

Most vendor prices use some form of matrix pricing methodology to derive the inputs for projecting cash flows or to derive prices. Whenvendor prices are not available, liquid assets are valued internally by IFC using yield-pricing approach or comparables model approachand these are classified as Level 2 or Level 3 depending on the degree that the inputs are observable in the market.
The critical factors in valuing liquid assets in both Level 2 and Level 3 are the estimation of cash flows and yield. Other significant inputsfor valuing corporate securities, quasi-government securities and sovereign or sovereign-guaranteed securities include reported trades,broker/dealer quotes, benchmark securities, option adjusted spread curve, volatilities, and other reference data. In addition to these inputs,valuation models for securitized or collateralized securities use collateral performance inputs, such as weighted average coupon rate,weighted average maturity, conditional prepayment rate, constant default rate, vintage, and credit enhancements.
Loans and debt securities - Loans and debt securities in IFC’s investment portfolio that do not have available market prices are primarilyvalued using discounted cash flow approaches. The majority of loans measured at fair value are classified as Level 3. Certain loans containembedded conversion and/or income participation features. If not bifurcated as standalone derivatives, these features are considered indetermining the loans’ fair value based on the quoted market prices or other calculated values of the equity investments into which theloans are convertible and the discounted cash flows of the income participation features. The significant unobservable inputs used in thefair value measurement of loans and debt securities are discount rates, credit default swap spreads, and expected recovery rates. Thevaluation techniques and significant unobservable inputs for loans and debt securities classified as Level 3 as of June 30, 2020 and foravailable-for-sale debt securities classified as Level 3 as of June 30, 2019 are presented below respectively. Valuation techniques andsignificant inputs for loans and debt securities accounted for at fair value under the fair value option are materially consistent with available-for-sale debt securities.
June 30, 2020
Valuation techniqueFair value (US
$ millions) Significant inputs Range (%)
Weightedaverage
(%)Debt securities – preferred shares Discounted cash flows $ 53 Discount rate 6.7 - 30.0 12.3
Market comparables 216 Valuation multiples*Recent transactions 69Other techniques 52
Total preferred shares 390
Other debt securities Discounted cash flows 3,883Credit default swap
spreads 0.8 - 18.9 2.9Expected recovery rates 35.0 - 85.0 47.8
Recent transactions 1,151Other techniques 486
Total other debt securities 5,520
Total $ 5,910
* including price/book value ratio, price/sales ratio, enterprise value/sales ratio and enterprise value/earnings before interest, taxes, depreciation andamortization ratio, the range and weighted average are not provided due to the immaterial amounts.
INTERNATIONAL FINANCE CORPORATION Page 104
NOTES TO CONSOLIDATED FINANCIAL STATEMENTS
NOTE R – FAIR VALUE MEASUREMENTS (continued)

June 30, 2019
Valuation techniqueFair value (US
$ millions) Significant inputs Range (%)
Weightedaverage
(%)Debt securities – preferred shares Discounted cash flows $ 53 Discount rate 6.6 - 29.2 12.6
Market comparables 59 Valuation multiples*Recent transactions 97Other techniques 8
Total preferred shares 217
Other debt securities Discounted cash flows 2,172Credit default swap
spreads 1.1 - 5.4 2.4Expected recovery rates 0.0 - 85.0 48.2
Recent transactions 804Other techniques 57
Total other debt securities 3,033
Total $ 3,250
* Including price/earnings ratio, enterprise value/sales ratio and enterprise value/earnings before interest, taxes, depreciation and amortization ratio, therange and weighted average are not provided due to the immaterial amounts.
Borrowings – Fair values derived by determining the present value of estimated future cash flows using appropriate discount rates andoption specific models where appropriate are classified as Level 2. Fair values derived from market source pricing are also classified asLevel 2. The significant inputs used in valuing borrowings classified as Level 2 are presented below:
Classes Significant Inputs
Structured bonds Foreign exchange rate and inter-bank yield curves, IFC’s credit curve and swaption volatility matrix,foreign exchange rate volatility, equity spot price, volatility and dividend yield.
Unstructured bonds Inter-bank yield curve and IFC’s credit curve.
As of June 30, 2020, IFC had bond issuances with a total fair value of $152 million classified as level 3 in Costa Rican colon,Dominican peso, Kazakhstan tenge, Uzbekistan sum and Uruguayan peso where the significant unobservable inputs were yield curvedata. As of June 30, 2020, the weighted average effective interest rate on medium and long-term borrowings carried at amortized costwas 6.5% and the effective interest rate on short-term borrowings carried at amortized cost was 1.5%.
Derivative instruments – The various classes of derivative instruments include interest rate contracts, foreign exchange contracts, interestrate and currency contracts, equity contracts and other derivative contracts. Certain over the counter derivatives in the liquid asset portfoliopriced in-house are classified as Level 2, while certain over the counter derivatives priced using external manager prices are classified asLevel 3. Fair values for derivative instruments are derived by determining the present value of estimated future cash flows using appropriatediscount rates and option specific models where appropriate.
The significant inputs used in valuing the various classes of derivative instruments classified as Level 2 and significant unobservable inputsfor derivative instruments classified as Level 3 as of June 30, 2020 and June 30, 2019 are presented below:
Level 2 derivatives Significant Inputs
Interest rate Inter-bank yield curves, foreign exchange basis curve and yield curves specified to index floating rates.Foreign exchange Foreign exchange rate, inter-bank yield curves and foreign exchange basis curve.
Interest rate and currency Foreign exchange rate, inter-bank yield curves, foreign exchange basis curve and yield curves specifiedto index floating rates.
INTERNATIONAL FINANCE CORPORATION Page 105
NOTES TO CONSOLIDATED FINANCIAL STATEMENTS
NOTE R – FAIR VALUE MEASUREMENTS (continued)
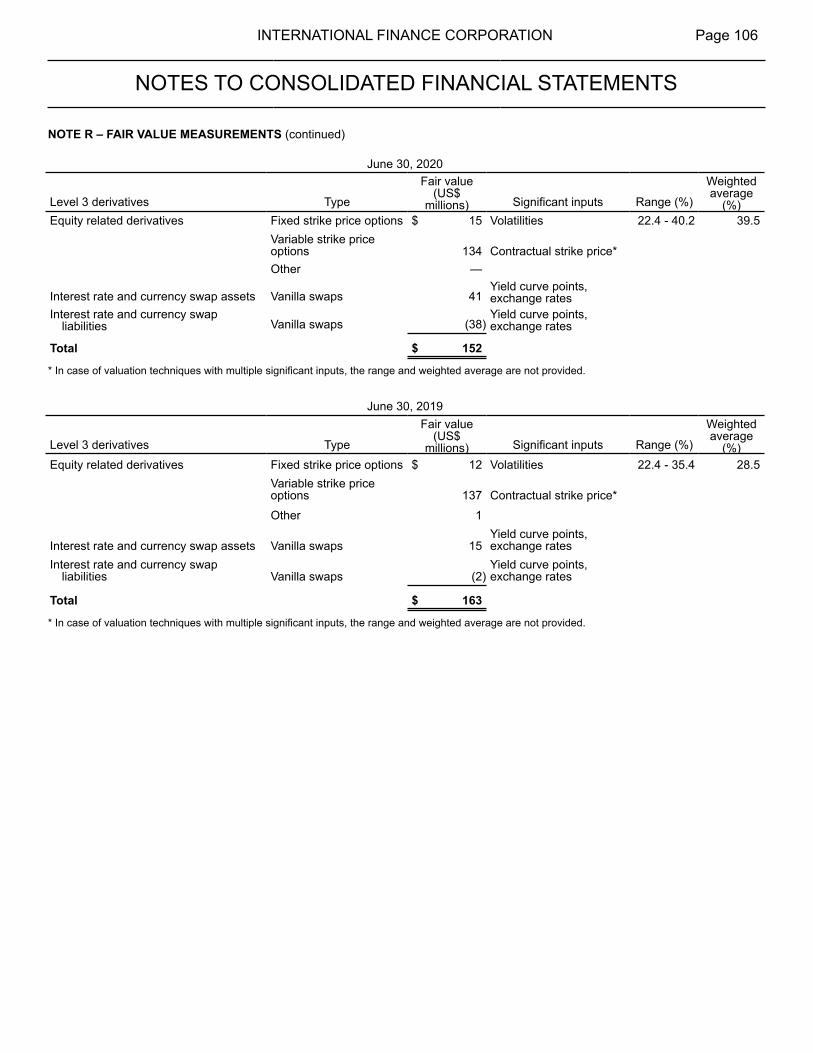
June 30, 2020
Level 3 derivatives Type
Fair value(US$
millions) Significant inputs Range (%)
Weightedaverage
(%)Equity related derivatives Fixed strike price options $ 15 Volatilities 22.4 - 40.2 39.5
Variable strike priceoptions 134 Contractual strike price*Other —
Interest rate and currency swap assets Vanilla swaps 41Yield curve points,exchange rates
Interest rate and currency swapliabilities Vanilla swaps (38)
Yield curve points,exchange rates
Total $ 152
* In case of valuation techniques with multiple significant inputs, the range and weighted average are not provided.
June 30, 2019
Level 3 derivatives Type
Fair value(US$
millions) Significant inputs Range (%)
Weightedaverage
(%)Equity related derivatives Fixed strike price options $ 12 Volatilities 22.4 - 35.4 28.5
Variable strike priceoptions 137 Contractual strike price*
Other 1
Interest rate and currency swap assets Vanilla swaps 15Yield curve points,exchange rates
Interest rate and currency swapliabilities Vanilla swaps (2)
Yield curve points,exchange rates
Total $ 163
* In case of valuation techniques with multiple significant inputs, the range and weighted average are not provided.
INTERNATIONAL FINANCE CORPORATION Page 106
NOTES TO CONSOLIDATED FINANCIAL STATEMENTS
NOTE R – FAIR VALUE MEASUREMENTS (continued)

Equity investments – Equity investments valued using quoted prices in active markets are classified as Level 1. Equity investmentsclassified as Level 2 are valued using quoted prices in inactive markets. Equity investments classified as Level 3 are primarily valued usingdiscounted cash flow and market comparable approaches. The significant unobservable inputs include cost of equity, weighted averagecost of capital, asset growth rate, return on assets, perpetual growth rate, and market multiples. The valuation techniques and significantunobservable inputs used in fair value measurements categorized within Level 3 of the fair value hierarchy for equity investments thatwere measured at fair value through net income as of June 30, 2020 and for equity investments that were required to be measured at fairvalue as of June 30, 2019 are presented below. Valuation techniques and significant inputs for equity investments accounted for at fairvalue under the fair value option are materially consistent with equity investments required to be measured at fair value.
June 30, 2020
Sector Valuation technique
Fair value(US$
millions) Significant inputs Range
Weightedaverage
(%)Banking and other financial Discounted cash flows $ 753 Cost of equity (%) 10.2 - 24.3 14.3Institutions Asset growth rate (%) (19.4) - 146.0 7.0
Return on assets (%) (10.1) - 8.5 1.8Perpetual growth rate (%) 2.0 - 14.0 5.3
Market comparables 50 Valuation multiples*
Listed price (adjusted) 315Discount for lack ofmarketability (%) ** 35.0
Recent transactions 277Other techniques 227Associated options*** 143
Total banking and other financialinstitutions 1,765
Funds Recent transactions 112Other techniques 3
Total funds 115
Others Discounted cash flows 1,385Weighted average
cost of capital (%) 7.3 - 22.5 11.0Cost of equity (%) 9.7 - 17.5 13.1
Market comparables 498 EV/EBITDA 3.8 - 21.0 11.4Price to book value 0.6 - 2.1 1.0Other valuationmultiples*
Recent transactions 553Other techniques 106Associated options*** 78
Total others 2,620
Total $ 4,500* Including price/book value ratio, price/earnings ratio, price/sales ratio, enterprise value/sales ratio, and enterprise value/earnings before interest, taxes,depreciation, and amortization ratio, the range and weighted average are not provided due to the immaterial amounts.** No range is provided as all of the projects that use this valuation technique are with the same institution and have the same lock-up discount percentage.*** Fair values for associated options are derived by determining the present value of estimated future cash flows using appropriate discount rates andoption specific models where appropriate.
INTERNATIONAL FINANCE CORPORATION Page 107
NOTES TO CONSOLIDATED FINANCIAL STATEMENTS
NOTE R – FAIR VALUE MEASUREMENTS (continued)

June 30, 2019
Sector Valuation technique
Fair value(US$
millions) Significant inputs Range
Weightedaverage
(%)Banking and other financial Discounted cash flows $ 676 Cost of equity (%) 10.4 - 24.9 14.5Institutions Asset growth rate (%) (24.0) - 82.1 3.5
Return on assets (%) (8.9) - 9.8 1.3Perpetual growth rate (%) 2.1 - 15.0 4.8
Market comparables 60 Valuation multiples**
Listed price (adjusted) 578Discount for lack ofmarketability (%) *** 35.0
Recent transactions 343Other techniques 159
Associated options**** 18Total banking and other financial
institutions 1,834
Others Discounted cash flows 1,273Weighted average
cost of capital (%) 6.6 - 22.5 11.3Cost of equity (%) 10.9 - 16.7 11.3
Market comparables 325 EV/EBITDA 3.4 - 24.4 11.8Price to book value 0.6 - 2.0 1.1
Other valuation multiples**
Listed price (adjusted) —*Discount for lack ofmarketability (%) *** 10.0
Recent transactions 505Other techniques 81Associated options**** 49
Total others 2,233
Total $ 4,067* Less than $0.5 million.** Including price/book value ratio, enterprise value/sales ratio, and enterprise value/earnings before interest, taxes, depreciation, and amortization ratio, the range and weightedaverage are not provided due to the immaterial amounts.*** No range is provided as all of the projects that use this valuation technique are with the same institution and have the same lock-up discount percentage.**** Fair values for associated options are derived by determining the present value of estimated future cash flows using appropriate discount rates and option specific modelswhere appropriate.
INTERNATIONAL FINANCE CORPORATION Page 108
NOTES TO CONSOLIDATED FINANCIAL STATEMENTS
NOTE R – FAIR VALUE MEASUREMENTS (continued)

Fair value of assets and liabilities
Estimated fair values of IFC’s financial assets and liabilities and off-balance sheet financial instruments at June 30, 2020 and June 30,2019 are summarized below (US$ millions):
June 30, 2020 June 30, 2019Carryingamount
Fair value
Carryingamount
Fair value
Financial assetsCash and due from banks, time deposits, trading securities and
securities purchased under resale agreements and receivablefor cash collateral pledged $ 46,201 $ 46,201 $ 49,085 $ 49,085
Investments:Loans at amortized cost, net of reserves against losses 23,147 23,781 23,106 24,349Loans accounted for at fair value under the Fair Value Option 955 955 877 877
Total loans 24,102 24,736 23,983 25,226Equity investments accounted for at fair value 10,370* 10,366 13,130* 13,113Debt securities accounted for at fair value as available-for-sale 3,687 3,687 4,488 4,488Debt securities accounted for at fair value under the Fair Value
Option 2,979 2,979 1,861 1,861
Total debt securities 6,666 6,666 6,349 6,349
Total investments 41,138 41,768 43,462 44,688Derivative assets:
Borrowings-related 1,624 1,624 896 896Liquid asset portfolio-related and other 230 230 154 154Investment-related 1,815 1,815 1,417 1,417Client risk management-related 645 645 389 389
Total derivative assets 4,314 4,314 2,856 2,856Other investment-related financial assets — 4 — 8Financial liabilitiesSecurities sold under repurchase agreements and payable for cash
collateral received $ 4,591 $ 4,591 $ 8,454 $ 8,454Market, IBRD, IDA and other borrowings outstanding 55,486 55,514 54,132 54,138Derivative liabilities:
Borrowings-related 2,867 2,867 2,857 2,857Liquid asset portfolio-related and other 334 334 370 370Investment-related 354 354 285 285Client risk management-related 828 828 452 452
Total derivative liabilities 4,383 4,383 3,964 3,964
* For $4 million as of June 30, 2020 ($17 million- June 30, 2019) of equity investments primarily accounted for under the cost recovery method, no fair valuemeasurement is provided since the recovery of invested capital is uncertain.
The fair value of loan commitments amounted to $41 million at June 30, 2020 ($39 million - June 30, 2019). Fair values of loan commitmentsare based on present value of loan commitment fees.
INTERNATIONAL FINANCE CORPORATION Page 109
NOTES TO CONSOLIDATED FINANCIAL STATEMENTS
NOTE R – FAIR VALUE MEASUREMENTS (continued)
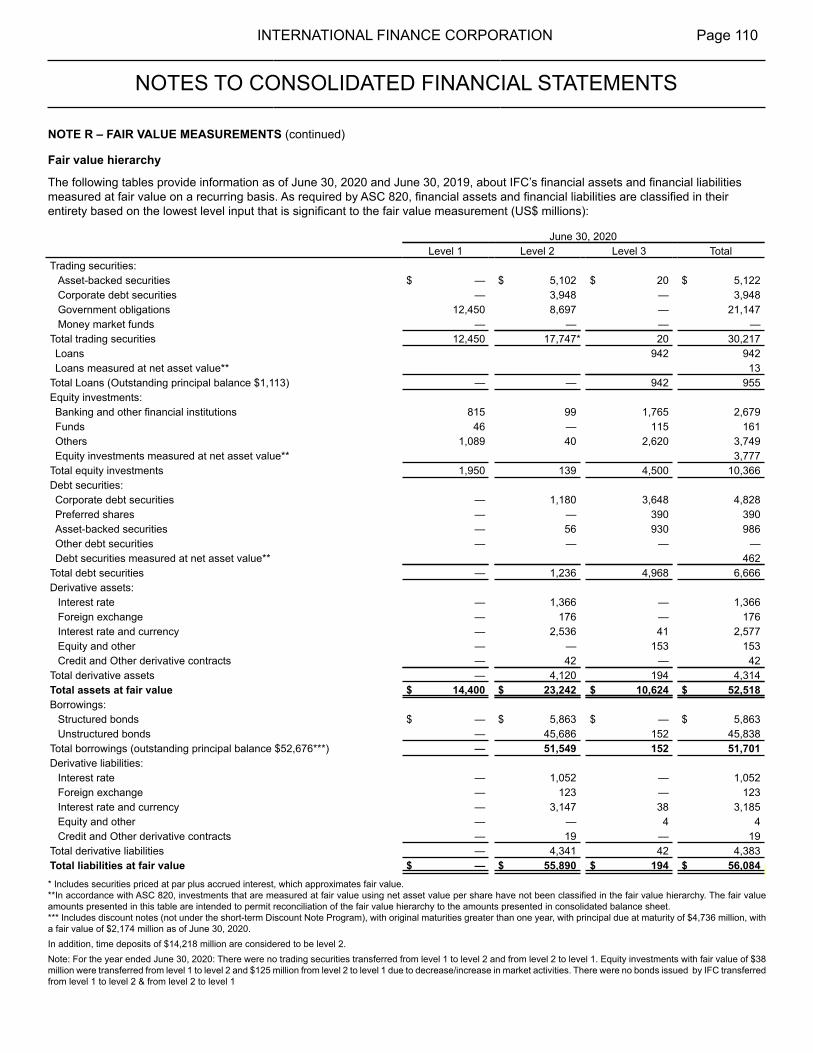
Fair value hierarchy
The following tables provide information as of June 30, 2020 and June 30, 2019, about IFC’s financial assets and financial liabilitiesmeasured at fair value on a recurring basis. As required by ASC 820, financial assets and financial liabilities are classified in theirentirety based on the lowest level input that is significant to the fair value measurement (US$ millions):
June 30, 2020Level 1 Level 2 Level 3 Total
Trading securities:Asset-backed securities $ — $ 5,102 $ 20 $ 5,122Corporate debt securities — 3,948 — 3,948Government obligations 12,450 8,697 — 21,147Money market funds — — — —
Total trading securities 12,450 17,747* 20 30,217Loans 942 942Loans measured at net asset value** 13
Total Loans (Outstanding principal balance $1,113) — — 942 955Equity investments:Banking and other financial institutions 815 99 1,765 2,679Funds 46 — 115 161Others 1,089 40 2,620 3,749Equity investments measured at net asset value** 3,777
Total equity investments 1,950 139 4,500 10,366Debt securities:Corporate debt securities — 1,180 3,648 4,828Preferred shares — — 390 390Asset-backed securities — 56 930 986Other debt securities — — — —Debt securities measured at net asset value** 462
Total debt securities — 1,236 4,968 6,666Derivative assets:
Interest rate — 1,366 — 1,366Foreign exchange — 176 — 176Interest rate and currency — 2,536 41 2,577Equity and other — — 153 153Credit and Other derivative contracts — 42 — 42
Total derivative assets — 4,120 194 4,314Total assets at fair value $ 14,400 $ 23,242 $ 10,624 $ 52,518Borrowings:
Structured bonds $ — $ 5,863 $ — $ 5,863Unstructured bonds — 45,686 152 45,838
Total borrowings (outstanding principal balance $52,676***) — 51,549 152 51,701Derivative liabilities:
Interest rate — 1,052 — 1,052Foreign exchange — 123 — 123Interest rate and currency — 3,147 38 3,185Equity and other — — 4 4Credit and Other derivative contracts — 19 — 19
Total derivative liabilities — 4,341 42 4,383Total liabilities at fair value $ — $ 55,890 $ 194 $ 56,084 * Includes securities priced at par plus accrued interest, which approximates fair value.**In accordance with ASC 820, investments that are measured at fair value using net asset value per share have not been classified in the fair value hierarchy. The fair valueamounts presented in this table are intended to permit reconciliation of the fair value hierarchy to the amounts presented in consolidated balance sheet. *** Includes discount notes (not under the short-term Discount Note Program), with original maturities greater than one year, with principal due at maturity of $4,736 million, witha fair value of $2,174 million as of June 30, 2020. In addition, time deposits of $14,218 million are considered to be level 2.Note: For the year ended June 30, 2020: There were no trading securities transferred from level 1 to level 2 and from level 2 to level 1. Equity investments with fair value of $38million were transferred from level 1 to level 2 and $125 million from level 2 to level 1 due to decrease/increase in market activities. There were no bonds issued by IFC transferredfrom level 1 to level 2 & from level 2 to level 1
INTERNATIONAL FINANCE CORPORATION Page 110
NOTES TO CONSOLIDATED FINANCIAL STATEMENTS
NOTE R – FAIR VALUE MEASUREMENTS (continued)

June 30, 2019Level 1 Level 2 Level 3 Total
Trading securities:Asset-backed securities $ — $ 5,044 $ 1 $ 5,045Corporate debt securities — 4,715 — 4,715Government obligations 10,853 7,762 — 18,615Money market funds — 151 — 151
Total trading securities 10,853 17,672* 1 28,526Loans — 1 850 851Loans measured at net asset value** 26Total Loans (Outstanding principal balance $968) — 1 850 877Equity investments:Banking and other financial institutions 1,445 148 2,422 4,015Funds 23 29 61 113Others 1,062 127 3,605 4,794Equity investments measured at net asset value** 4,191
Total equity investments 2,530 304 6,088 13,113Debt securities:Corporate debt securities — 1,390 2,994 4,384Preferred shares — — 495 495Asset-backed securities — 57 887 944Other debt securities — — —**** —****Debt securities measured at net asset value** 526
Total debt securities — 1,447 4,376 6,349Derivative assets:
Interest rate — 505 — 505Foreign exchange — 93 — 93Interest rate and currency — 2,082 15 2,097Equity and other — — 161 161
Total derivative assets — 2,680 176 2,856Total assets at fair value $ 13,383 $ 22,104 $ 11,491 $ 51,721Borrowings:
Structured bonds $ — $ 7,044 $ — $ 7,044Unstructured bonds — 43,982 83 44,065
Total borrowings (outstanding principal balance $54,255***) — 51,026 83 51,109Derivative liabilities:
Interest rate — 699 — 699Foreign exchange — 189 — 189Interest rate and currency — 3,063 2 3,065Equity and other — — 11 11
Total derivative liabilities — 3,951 13 3,964Total liabilities at fair value $ — $ 54,977 $ 96 $ 55,073
IFC reassessed market data inputs for estimating whether its trading securities, debt securities, and borrowings are traded in an activemarket as defined by ASC 820. Based on market data as of June 30, 2019, trading securities (except US Treasuries and Agency securities),debt securities, and borrowings were transferred from level 1 to level 2.* Includes securities priced at par plus accrued interest, which approximates fair value. **In accordance with ASC 820, investments that are measured at fair value using net asset value per share have not been classified in the fair value hierarchy. The fair valueamounts presented in this table are intended to permit reconciliation of the fair value hierarchy to the amounts presented in consolidated balance sheet.*** Includes discount notes (not under the short-term Discount Note Program), with original maturities greater than one year, with principal due at maturity of $5,571 million, witha fair value of $2,233 million as of June 30, 2019 **** Less than $0.5 million.In addition, time deposits of $17,500 million are considered to be level 2.Note: For the year ended June 30, 2019: Trading securities with fair value of $5,149 million were transferred from level 1 to level 2 and $12 million from level 2 to level 1 due todecrease/increase in market activities. Equity investments with fair value of $119 million transferred from level 1 to level 2 and $112 million from level 2 to level 1 due to decrease/increase in market activities and reassessment of market data inputs. Debt securities with a fair value of $417 million and bonds issued by IFC with a fair value of $$28,326 milliontransferred from level 1 to level 2 due to reassessment of market data inputs. There were no bonds or debt securities transferred from level 2 to level1.
INTERNATIONAL FINANCE CORPORATION Page 111
NOTES TO CONSOLIDATED FINANCIAL STATEMENTS
NOTE R – FAIR VALUE MEASUREMENTS (continued)

The following tables present the changes in the carrying value of IFC’s Level 3 financial assets and financial liabilities for the years endedJune 30, 2020 and 2019 (US$ millions). IFC’s policy is to recognize transfers in and transfers out at the beginning of the reporting period.
Year ended June 30, 2020
Balance asof July 1,
2019
Net gains and losses(realized and unrealized)
included inPurchases,issuances,
sales,settlementsand others
Transfersinto
Level 3(*)
Transfersout of
Level 3(**)
Balance asof June 30,
2020
Netunrealized
gains/lossesincluded innet incomerelated toassets /
liabilities heldat year end
NetIncome
Othercomprehensive
income
Trading securities:Asset-backed securities $ 1 $ (48) $ — $ 486 $ 83 $ (502) $ 20 $ (1)Corporate debt securities — — — — — — — —Government and agency
obligations — — — — — — — —Total trading securities 1 (48) — 486 83 (502) 20 (1)Loans 850 (95) — 187 — — 942 (99)Equity investments:
Banking and otherfinancial institutions 2,422 (387) — (257) 64 (77) 1,765 (467)
Funds 61 (1) — 55 — — 115 (2)Others 3,605 (380) — (581) — (24) 2,620 (494)
Total equity investments 6,088 (768) — (783) 64 (101) 4,500 (963)Debt securities:
Corporate debt securities 2,994 (140) (84) 733 1,136 (991) 3,648 (61)Preferred shares 495 (8) (22) (75) — — 390 (16)Asset-backed securities 887 (76) 7 114 57 (59) 930 (31)Other debt securities —*** —*** — — — — —*** —
Total debt securities 4,376 (224) (99) 772 1,193 (1,050) 4,968 (108)Derivative assets:
Interest rate and currency 15 5 — 7 42 (28) 41 21Equity and other 161 2 — (10) — — 153 2
Total derivative assets 176 7 — (3) 42 (28) 194 23
Total assets at fair value $ 11,491 $(1,128) $ (99) $ 659 $ 1,382 $ (1,681) $10,624 $ (1,148)Borrowings:
Structured bonds $ — $ — $ — $ — $ — $ — $ — $ —Unstructured bonds (83) 26 — (129) (60) 94 (152) 26
Total borrowings (83) 26 — (129) (60) 94 (152) 26Derivative liabilities:
Interest rate — — — — — — — —Interest rate and currency (2) (5) — (4) (62) 35 (38) (22)Equity and other (11) — — 7 — — (4) —
Total derivative liabilities (13) (5) — 3 (62) 35 (42) (22)Total liabilities at fair value $ (96) $ 21 $ — $ (126) $ (122) $ 129 $ (194) $ 4
(*) Transfers into Level 3 are due to lack of observable market data resulting from a decrease in market activity for these securities as of June 30, 2020. (**) Transfers out of Level 3 are due to availability of observable market data resulting from an increase in market activity for these securities that were partof July 1, 2019 beginning balance as of June 30, 2020. *** Less than $0.5 million.
INTERNATIONAL FINANCE CORPORATION Page 112
NOTES TO CONSOLIDATED FINANCIAL STATEMENTS
NOTE R – FAIR VALUE MEASUREMENTS (continued)

Year ended June 30, 2019
Balanceas of
July 01,2018
Adoption ofnew
accountingpronounce
ments
Net gains and losses(realized and
unrealized) included in Purchases,issuances,
sales,settlementsand others
Transfersinto
Level 3 (*)
Transfersout of
Level 3 (**)
Balanceas of
June 30,2019
Net unrealizedgains/losses
included in netincome related
to assets /liabilities heldat year end
NetIncome
Othercomprehensive income
Trading securities:Asset-backed
securities $ — $ — $ — $ — $ 1 $ — $ — $ 1 $ —Corporate debt
securities — — — — — — — — —Government and
agency obligations 18 — (1) — (17) — — — —Total trading securities 18 — (1) — (16) — — 1 —Loans 894 — 9 — (52) — (1) 850 4Equity investments:
Banking and otherfinancial institutions 1,326 1,985 (124) — (194) 74 (645) 2,422 (201)
Funds 83 — 3 — 25 — (50) 61 —Others 1,688 2,219 (83) — (90) — (129) 3,605 (151)
Total equityinvestments 3,097 4,204 (204) — (259) 74 (824) 6,088 (352)Debt securities:Corporate debtsecurities 2,590 — (24) (5) 570 1,505 (1,642) 2,994 3Preferred shares 383 — 53 37 22 — — 495 44Asset-backedsecurities 840 — (6) (38) 71 80 (60) 887 11Other debt securities 2 — (2) — — — — — (1)
Total debt securities 3,815 — 21 (6) 663 1,585 (1,702) 4,376 57Derivative assets:
Interest rate andcurrency 8 — 6 — 5 — (4) 15 10Equity and other 235 — (30) — (44) — — 161 (17)
Total derivative assets 243 — (24) — (39) — (4) 176 (7)Total assets at fairvalue $ 8,067 $ 4,204 $ (199) $ (6) $ 297 $ 1,659 $ (2,531) $ 11,491 $ (298)Borrowings:
Structured bonds $ — $ — $ — $ — $ — $ — $ — $ — $ —Unstructured bonds (46) — 4 — (83) — 42 (83) 4
Total borrowings (46) — 4 — (83) — 42 (83) 4Derivative liabilities:
Interest rate — — — — — — — — —Interest rate andcurrency (7) — — — — (4) 9 (2) (2)Equity and other (11) — — — — — — (11) —
Total derivativeliabilities (18) — — — — (4) 9 (13) (2)Total liabilities at fair
value $ (64) $ — $ 4 $ — $ (83) $ (4) $ 51 $ (96) $ 2
(*) Transfers into Level 3 are due to lack of observable market data resulting from a decrease in market activity for these securities as of June 30, 2019. (**) Transfers out of Level 3 are due to availability of observable market data resulting from an increase in market activity for these securities that were partof July 1, 2018 beginning balance as of June 30, 2019.
INTERNATIONAL FINANCE CORPORATION Page 113
NOTES TO CONSOLIDATED FINANCIAL STATEMENTS
NOTE R – FAIR VALUE MEASUREMENTS (continued)

The following tables present gross purchases, sales, issuances and settlements related to the changes in the carrying value of IFC’s Level3 financial assets and financial liabilities for the years ended June 30, 2020 and 2019 (US$ millions).
Year ended June 30, 2020
Purchases Sales IssuancesSettlements and others Net
Trading securities:Asset-backed securities $ 551 $ (40) $ — $ (25) $ 486Corporate debt securities — — — — —
Government and agency obligations — — — — —
Total trading securities 551 (40) — (25) 486Loans — — 544 (357) 187Equity investments:Banking and other financial institutions 66 (231) — (92) (257)Funds 199 — — (144) 55Others 179 (740) — (20) (581)
Total equity investments 444 (971) — (256) (783)Debt securities:Corporate debt securities 943 — — (210) 733Preferred shares 7 (61) — (21) (75)Asset-backed securities 203 (1) — (88) 114
Total debt securities 1,153 (62) — (319) 772Derivative assets:
Interest rate and currency — — 7 — 7Equity and other — — — (10) (10)
Total derivative assets — — 7 (10) (3)
Total assets at fair value $ 2,148 $ (1,073) $ 551 $ (967) $ 659Borrowings:
Structured Bonds $ — $ — $ — $ — $ —Unstructured Bonds — — (129) — (129)
Total Borrowings — — (129) — (129)Derivative liabilities:
Interest rate — — — — —Interest rate and currency — — (4) — (4)Equity and other — — — 7 7
Total derivative liabilities — — (4) 7 3
Total liabilities at fair value $ — $ — $ (133) $ 7 $ (126)
INTERNATIONAL FINANCE CORPORATION Page 114
NOTES TO CONSOLIDATED FINANCIAL STATEMENTS
NOTE R – FAIR VALUE MEASUREMENTS (continued)

Year ended June 30, 2019
Purchases Sales IssuancesSettlementsand others Net
Trading securities:Asset-backed securities $ 1 $ — $ — $ — $ 1Corporate debt securities — — — — —Government and agency obligations — (17) — — (17)
Total trading securities 1 (17) — — (16)Loans — — 259 (311) (52)Equity investments:Banking and other financial institutions 129 (309) — (14) (194)Funds 65 — — (40) 25Others 252 (302) — (40) (90)
Total equity investments 446 (611) — (94) (259)Debt securities:Corporate debt securities 832 (35) — (227) 570Preferred shares 50 (12) — (16) 22Asset-backed securities 74 — — (3) 71
Total debt securities 956 (47) — (246) 663Derivative assets:Interest rate and currency — — 5 — 5Equity and other — — — (44) (44)
Total derivative assets — — 5 (44) (39)
Total assets at fair value $ 1,403 $ (675) $ 264 $ (695) $ 297Borrowings:
Structured Bonds $ — $ — $ — $ — $ —Unstructured Bonds — — (83) — (83)
Total Borrowings — — (83) — (83)Derivative liabilities:
Interest rate — — — — —Interest rate and currency — — — — —Equity and other — — — — —
Total derivative liabilities — — — — —
Total liabilities at fair value $ — $ — $ (83) $ — $ (83)
Gains and losses (realized and unrealized) from trading securities, loans, equity investments and debt securities included in net incomefor the period are reported on the consolidated statements of operations in income from liquid asset trading activities, Income from Loansand guarantees, including realized gains and losses on loans and associated derivatives, income from equity investments and associatedderivatives, income from debt securities and realized gains and losses on debt securities and associated derivatives and net unrealizedgains and losses on non-trading financial instruments accounted for at fair value.
INTERNATIONAL FINANCE CORPORATION Page 115
NOTES TO CONSOLIDATED FINANCIAL STATEMENTS
NOTE R – FAIR VALUE MEASUREMENTS (continued)

For management purposes, IFC’s business comprises three segments: investment services, treasury services and advisory services. Theinvestment services segment consists primarily of lending and investing in debt and equity securities. The investment services segmentalso includes AMC, which is not separately disclosed due to its immaterial impact. Further information about the impact of AMC on IFC’sconsolidated balance sheets and statements of operations can be found in Note B. Operationally, the treasury services segment consistsof the borrowing, liquid asset management, asset and liability management and client risk management activities. Advisory services provideconsultation services to governments and the private sector. Consistent with internal reporting, net income or expense from asset andliability management and client risk management activities in support of investment services is allocated from the treasury segment to theinvestment services segment.
The performance of investment services, treasury services and advisory services is assessed by senior management on the basis of netincome for each segment, return on assets, and return on capital employed. Advisory services are primarily assessed based on the leveland adequacy of its funding sources (See Note U). IFC’s management reporting system and policies are used to determine revenues andexpenses attributable to each segment. Consistent with internal reporting, administrative expenses are allocated to each segment basedlargely upon personnel costs and segment headcounts. Transactions between segments are immaterial and, thus, are not a factor inreconciling to the consolidated data.
The assets of the investment, treasury, and advisory services segments are detailed in Notes D, C, and U, respectively. An analysis ofIFC’s major components of income and expense by business segment for the years ended June 30, 2020, June 30, 2019 and June 30,2018, is provided below (US$ millions):
June 30, 2020Investment
servicesTreasuryservices
Advisoryservices Total
Income from loans and guarantees, including realized gains andlosses on loans associated derivatives $ 1,510 $ — $ — $ 1,510
Provision for losses on loans, guarantees, accrued interest andother receivables (638) — — (638)
Loss from equity investments and associated derivatives (1,067) — — (1,067)Income from debt securities, including and realized gains and
losses on debt securities and associated derivatives 231 — — 231Income from liquid asset trading activities — 1,039 — 1,039Charges on borrowings (648) (533) — (1,181)Advisory services income — — 281 281Service fees and other income 278 — — 278Administrative expenses (1,104) (46) (131) (1,281)Advisory services expenses — — (312) (312)Expense from pension and other postretirement benefit plans (12) (1) (5) (18)Other expenses (17) — — (17)Foreign currency transaction gains and losses on non-trading
activities 144 — — 144(Loss) income before net unrealized gains and losses on
non-trading financial instruments accounted for at fairvalue and grants to IDA (1,323) 459 (167) (1,031)
Net unrealized (losses) gains on non-trading financial instrumentsaccounted for at fair value (423) (218) — (641)
Net (loss) income $ (1,746) $ 241 $ (167) $ (1,672)
INTERNATIONAL FINANCE CORPORATION Page 116
NOTES TO CONSOLIDATED FINANCIAL STATEMENTS
NOTE S - SEGMENT REPORTING

June 30, 2019Investment
servicesTreasuryservices
Advisoryservices Total
Income from loans and guarantees, including realized gains andlosses on loans associated derivatives $ 1,774 $ — $ — $ 1,774
Provision for losses on loans, guarantees, accrued interest andother receivables (87) — — (87)
Loss from equity investments and associated derivatives (253) — — (253)Income from debt securities, including realized gains and losses
on debt securities and associated derivatives 126 — — 126Income from liquid asset trading activities — 1,291 — 1,291Charges on borrowings (738) (837) — (1,575)Advisory services income — — 312 312Service fees and other income 310 — — 310Administrative expenses (1,175) (45) (135) (1,355)Advisory services expenses — — (355) (355)Expense from pension and other postretirement benefit plans (4) —* (2) (6)Other expenses (30) — — (30)Foreign currency transaction gains and losses on non-trading
activities 137 22 — 159Income (loss) before net unrealized gains and losses on non-
trading financial instruments accounted for at fair valueand grants to IDA 60 431 (180) 311
Net unrealized (losses) gains on non-trading financial instrumentsaccounted for at fair value (203) (15) — (218)
Net (loss) income $ (143) $ 416 $ (180) $ 93
* Less than $0.5 million.
INTERNATIONAL FINANCE CORPORATION Page 117
NOTES TO CONSOLIDATED FINANCIAL STATEMENTS
NOTE S – SEGMENT REPORTING (continued)

June 30, 2018Investment
servicesTreasuryservices
Advisoryservices Total
Income from loans and guarantees, including realized gains andlosses on loans associated derivatives $ 1,377 $ — $ — $ 1,377
Provision for losses on loans, guarantees, accrued interest andother receivables (90) — — (90)
Income from equity investments and associated derivatives 853 — — 853Income from debt securities, including and realized gains and
losses on debt securities and associated derivatives 363 — — 363Income from liquid asset trading activities — 771 — 771Charges on borrowings (451) (590) — (1,041)Advisory services income — — 305 305Service fees and other income 273 — — 273Administrative expenses (938) (27) (64) (1,029)Advisory services expenses — — (354) (354)Expense from pension and other postretirement benefit plans (171) (11) (62) (244)Other expenses (35) — — (35)Foreign currency transaction gains and losses on non-trading
activities 90 33 — 123Income (loss) before net unrealized gains and losses on non-
trading financial instruments accounted for at fair valueand grants to IDA 1,271 176 (175) 1,272
Net unrealized gains (losses) on non-trading financial instrumentsaccounted for at fair value 181 (93) — 88
Income (loss) before grants to IDA 1,452 83 (175) 1,360Grants to IDA (80) — — (80)
Net income (loss) $ 1,372 $ 83 $ (175) $ 1,280
INTERNATIONAL FINANCE CORPORATION Page 118
NOTES TO CONSOLIDATED FINANCIAL STATEMENTS
NOTE S – SEGMENT REPORTING (continued)
NOTE T – VARIABLE INTEREST ENTITIES
Significant variable interests
IFC has identified investments in 214 VIEs which are not consolidated by IFC but in which it is deemed to hold significant variable interestsat June 30, 2020 (223 investments - June 30, 2019).
The majority of these VIEs do not involve securitizations or other types of structured financing. IFC is usually the minority investor in theseVIEs. These VIEs are mainly: (a) investment funds, where the general partner or fund manager does not have substantive equity at risk,which IFC does not consolidate because it does not have the power to direct the activities of the VIEs that most significantly impact theireconomic performance and (b) entities whose total equity investment is considered insufficient to permit such entity to finance its activitieswithout additional subordinated financial support or whose activities are so narrowly defined by contracts that equity investors are consideredto lack decision making ability, which IFC does not consolidate because it does not have the power to control the activities that mostsignificantly impact their economic performance. IFC’s involvement with these VIEs includes investments in equity interests and senior orsubordinated interests, guarantees and risk management arrangements. IFC’s interests in these VIEs are recorded on IFC’s consolidatedbalance sheet primarily in equity investments, loans, debt securities, and other liabilities, as appropriate.
Based on the most recent available data of these VIEs, the balance sheet size, including committed funding, in which IFC is deemed tohold significant variable interests, totaled $30,736 million at June 30, 2020 ($36,698 million - June 30, 2019). IFC’s maximum exposureto loss as a result of its investments in these VIEs, comprising both carrying value of investments and amounts committed but not yetdisbursed, was $5,510 million at June 30, 2020 ($5,911 million - June 30, 2019).
IFC transacted with a VIE, of which IFC is the primary beneficiary, to construct an office building at 2100 K Street on land owned by IFCadjacent to its current office premise. IFC commenced occupying the building in March 2019. The building and land, totaling $123 millionare included in Receivables and other assets on IFC's consolidated balance sheet.

The industry sector and geographical regional analysis of IFC’s maximum exposures as a result of its investment in these VIEs at June 30,2020 and June 30, 2019 is as follows (US$ millions):
June 30, 2020
LoansEquity
investmentsDebt
securitiesRisk
management Total
AsiaManufacturing, agribusiness and services $ 159 $ 24 $ 18 $ — $ 201Financial markets 163 100 — — 263Infrastructure and natural resources 427 97 15 28 567Disruptive technologies and funds 6 271 — — 277
Total Asia 755 492 33 28 1,308
Europe, Middle East and North AfricaManufacturing, agribusiness and services 218 59 — — 277Financial markets 174 — 25 — 199Infrastructure and natural resources 546 70 16 163 795Disruptive technologies and funds — 81 — — 81
Total Europe, Middle East and North Africa 938 210 41 163 1,352
Sub-Saharan Africa, Latin America and CaribbeanManufacturing, agribusiness and services 29 82 — — 111Financial markets 219 45 31 — 295Infrastructure and natural resources 887 370 — 210 1,467Disruptive technologies and funds — 227 — — 227
Total Sub-Saharan Africa, Latin America and Caribbean 1,135 724 31 210 2,100
OtherManufacturing, agribusiness and services — — — — —Financial markets 472 86 — 6 564Infrastructure and natural resources 135 7 — — 142Disruptive technologies and funds — 44 — — 44
Total Other 607 137 — 6 750
Maximum exposure to VIEs $ 3,435 $ 1,563 $ 105 $ 407 $ 5,510of which:
Carrying value $ 2,702 $ 1,011 $ 104 $ 356 $ 4,173Committed but not disbursed $ 733 $ 552 $ 1 $ 51 $ 1,337
INTERNATIONAL FINANCE CORPORATION Page 119
NOTES TO CONSOLIDATED FINANCIAL STATEMENTS
NOTE T – VARIABLE INTEREST ENTITIES (continued)

June 30, 2019
LoansEquity
investmentsDebt
securitiesRisk
management Total
AsiaManufacturing, agribusiness and services $ 161 $ 30 $ 23 $ — $ 214Financial markets 81 106 2 — 189Infrastructure and natural resources 545 104 16 11 676Disruptive technologies and funds 6 306 — — 312
Total Asia 793 546 41 11 1,391
Europe, Middle East and North AfricaManufacturing, agribusiness and services 312 59 — — 371Financial markets 113 — 108 — 221Infrastructure and natural resources 619 242 22 71 954Disruptive technologies and funds — 93 — — 93
Total Europe, Middle East and North Africa 1,044 394 130 71 1,639
Sub-Saharan Africa, Latin America and CaribbeanManufacturing, agribusiness and services 111 144 16 — 271Financial markets 152 59 40 — 251Infrastructure and natural resources 965 330 — 83 1,378Disruptive technologies and funds — 183 — — 183
Total Sub-Saharan Africa, Latin America and Caribbean 1,228 716 56 83 2,083
OtherManufacturing, agribusiness and services — 11 — — 11Financial markets 402 60 76 7 545Infrastructure and natural resources 194 8 — — 202Disruptive technologies and funds — 40 — — 40
Total Other 596 119 76 7 798
Maximum exposure to VIEs $ 3,661 $ 1,775 $ 303 $ 172 $ 5,911of which:
Carrying value $ 2,836 $ 1,331 $ 294 $ 128 $ 4,589Committed but not disbursed $ 825 $ 444 $ 9 $ 44 $ 1,322
INTERNATIONAL FINANCE CORPORATION Page 120
NOTES TO CONSOLIDATED FINANCIAL STATEMENTS
NOTE T – VARIABLE INTEREST ENTITIES (continued)

IFC provides advisory services to government and private sector clients. IFC's advisory services to governments on private sector enablingenvironment and financial sector development are delivered in partnership with IBRD through WBG Global Practices. IFC funds thisbusiness line by a combination of cash received from government and other development partners, IFC’s operations via retained earningsand operating budget allocations, as well as fees received from the recipients of the services. IFC administers development partner fundsthrough trust funds in accordance with donor administration agreements.
As of June 30, 2020, other assets include undisbursed donor funds of $551 million ($484 million - June 30, 2019) and IFC’s advisoryservices funding of $284 million ($311 million - June 30, 2019). Included in other liabilities as of June 30, 2020 is $551 million ($484 million- June 30, 2019) of refundable undisbursed donor funds.
INTERNATIONAL FINANCE CORPORATION Page 121
NOTES TO CONSOLIDATED FINANCIAL STATEMENTS
NOTE U – ADVISORY SERVICES
NOTE V – PENSION AND OTHER POSTRETIREMENT BENEFITS
IBRD, IFC and MIGA participate in a defined benefit Staff Retirement Plan (SRP), a Retired Staff Benefits Plan and Trust (RSBP) and aPost-Employment Benefits Plan (PEBP) that cover substantially all of their staff members.
All costs, assets and liabilities associated with these plans are allocated between IBRD, IFC and MIGA based upon their employees’respective participation in the plans. Costs allocated to IBRD are then shared between IBRD and IDA based on an agreed cost-sharingmethodology.
The following table summarizes the benefit costs associated with the SRP, RSBP, and PEBP allocated to IFC for the years ended June 30,2020, June 30, 2019 and June 30, 2018 (US$ millions). For the years ended June 30, 2020, June 30, 2019 and June 30, 2018, the servicecosts of $270 million ($238 million and $230 million) are included in “Administrative expenses” respectively. The components of net periodicpension cost, other than the service cost component, are included in “Other” in the consolidated statement of operations.
SRP RSBP PEBP2020 2019 2018 2020 2019 2018 2020 2019 2018
Benefit costService cost $ 190 $ 167 $ 162 $ 43 $ 37 $ 37 $ 37 $ 34 $ 31Other components:
Interest cost 164 170 145 26 25 24 25 25 20
Expected return on plan assets (214) (211) (186) (39) (36) (31) — — —Amortization of unrecognized
prior service cost 1 1 1 3 3 3 2 2 2Amortization of unrecognized
net actuarial losses 21 5 17 — — — 29 22 19
Sub total (28) (35) (23) (10) (8) (4) 56 49 41
Net periodic pension cost $ 162 $ 132 $ 139 $ 33 $ 29 $ 33 $ 93 $ 83 $ 72
The following table summarizes the Projected Benefit Obligations (PBO), fair value of plan assets, and funded status associated with theSRP, RSBP and PEBP for IFC for the years ended June 30, 2020 and June 30, 2019 (US$ millions). Since the assets for the PEBP arenot held in an irrevocable trust separate from the assets of IBRD, they do not qualify for off-balance sheet accounting and are thereforeincluded in IBRD's investment portfolio. IFC has recognized a receivable (prepaid asset) from IBRD and a payable (liability) to IBRD equalto the amount required to support the plan. The assets of the PEBP are mostly invested in fixed income, equity instruments and alternativeinvestments.

SRP RSBP PEBP2020 2019 2020 2019 2020 2019
Projected benefit obligationsBeginning of year $ 4,876 $ 4,249 $ 755 $ 636 $ 729 $ 606Service cost 190 167 43 37 37 34Interest cost 164 170 26 26 25 25Net entity transfers —* (27) (2) (8) — —Participant contributions 54 54 3 3 6 6Benefits paid (187) (162) (12) (11) (6) (12)Actuarial loss (gain) 701 425 99 72 (3) 70
End of year 5,798 4,876 912 755 788 729Fair value of plan assetsBeginning of year 3,965 3,719 699 635 — —Net entity transfers —* (27) (2) (8) — —Participant contributions 54 54 3 3 — —Actual return on assets 100 310 22 61 — —Employer contributions 68 71 19 19 — —Benefits paid (187) (162) (12) (11) — —
End of year 4,000 3,965 729 699 — —Funded status** (1,798) (911) (183) (56) (788) (729)
Accumulated benefit obligations $ 5,206 $ 4,321 $ 912 $ 755 $ 651 $ 598
* Less than $0.5 million.** Negative funded status is included in Payables and other liabilities under liabilities under retirement benefits plans, in Note L.
During the fiscal years ended June 30, 2020, and June 30, 2019, there were no amendments made to the retirement benefit plans.
The following tables present the amounts included in Accumulated Other Comprehensive Loss relating to Pension and Other PostretirementBenefits (US$ millions):
Amounts included in Accumulated other comprehensive loss in the year ended June 30, 2020:
SRP RSBP PEBP TotalNet actuarial loss $ 1,788 $ 159 $ 258 $ 2,205Prior service cost 5 11 7 23
Net amount recognized in accumulated other comprehensive loss $ 1,793 $ 170 $ 265 $ 2,228
Amounts included in Accumulated other comprehensive loss in the year ended June 30, 2019:
SRP RSBP PEBP TotalNet actuarial loss $ 994 $ 43 $ 290 $ 1,327Prior service cost 6 14 9 29
Net amount recognized in accumulated other comprehensive loss $ 1,000 $ 57 $ 299 $ 1,356
The estimated amounts that will be amortized from Accumulated Other Comprehensive Loss into net periodic benefit cost in the fiscal yearending June 30, 2021 are as follows (US$ millions):
SRP RSBP PEBP TotalNet actuarial loss $ 76 $ 3 $ 20 $ 99Prior service cost 1 3 2 6Net amount recognized in accumulated other comprehensive loss $ 77 $ 6 $ 22 $ 105
INTERNATIONAL FINANCE CORPORATION Page 122
NOTES TO CONSOLIDATED FINANCIAL STATEMENTS
NOTE V – PENSION AND OTHER POSTRETIREMENT BENEFITS (continued)

Assumptions
The actuarial assumptions used are based on financial market interest rates, inflation expectations, past experience, and Management’sbest estimate of future benefit changes and economic conditions. Changes in these assumptions will impact future benefit costs andobligations.
The expected long-term rate of return for the SRP assets is a weighted average of the expected long-term (10 years or more) returns forthe various asset classes, weighted by the portfolio allocation. Asset class returns are developed using a forward-looking building blockapproach and are not strictly based on historical returns. Equity returns are generally developed as the sum of expected inflation, expectedreal earnings growth and expected long-term dividend yield. Bond returns are generally developed as the sum of expected inflation, realbond yield, duration-adjusted change in yields and risk premium/spread (as appropriate). Other asset class returns are derived from theirrelationship to equity and bond markets. The expected long-term rate of return for the RSBP is computed using procedures similar to thoseused for the SRP. The discount rate used in determining the benefit obligation is selected by reference to the year-end yield of AA corporatebonds.
Actuarial gains and losses occur when actual results are different from expected results. Amortization of these unrecognized gains andlosses will be included in income if, at the beginning of the fiscal year, they exceed 10 percent of the greater of the projected benefitobligation or the market-related value of plan assets. If required, the unrecognized gains and losses are amortized over the expectedaverage remaining service lives of the employee group.
The following tables present the weighted-average assumptions used in determining the projected benefit obligations and the net periodicpension costs for the years ended June 30, 2020, June 30, 2019, and June 30, 2018:
Weighted average assumptions used to determine projected benefit obligationIn percent, except years
SRP RSBP PEBP2020 2019 2018 2020 2019 2018 2020 2019 2018
Discount rate 2.60 3.40 4.10 2.70 3.50 4.10 2.60 3.50 4.10Rate of compensation increase 4.60 4.90 5.50 4.60 4.90 5.50Health care growth rates - at end offiscal year 5.40 6.20 6.00
Ultimate health care growth rate 3.70 3.90 4.20Year in which ultimate rate is reached 2031 2030 2030
Weighted average assumptions used to determine net periodic pension costIn percent, except years
SRP RSBP PEBP2020 2019 2018 2020 2019 2018 2020 2019 2018
Discount rate 3.40 4.10 3.70 3.50 4.10 3.90 3.50 4.10 3.80Expected return on plan assets 5.40 5.70 5.50 5.50 5.70 5.50Rate of compensation increase 4.90 5.50 5.20 4.90 5.50 5.20Health care growth rates - at end offiscal year 6.20 6.00 5.50
Ultimate health care growth rate 3.90 4.20 4.00Year in which ultimate rate is reached 2030 2030 2030
The medical cost trend rate can significantly affect the reported postretirement benefit income or costs and benefit obligations for the RSBP.The following table shows the effects of a one-percentage-point change in the assumed healthcare cost trend rate (US$ millions):
One-percentage-point increase One-percentage-point decreaseEffect on total service and interest cost $24 $(17)Effect on postretirement benefit obligation $256 $(190)
INTERNATIONAL FINANCE CORPORATION Page 123
NOTES TO CONSOLIDATED FINANCIAL STATEMENTS
NOTE V – PENSION AND OTHER POSTRETIREMENT BENEFITS (continued)
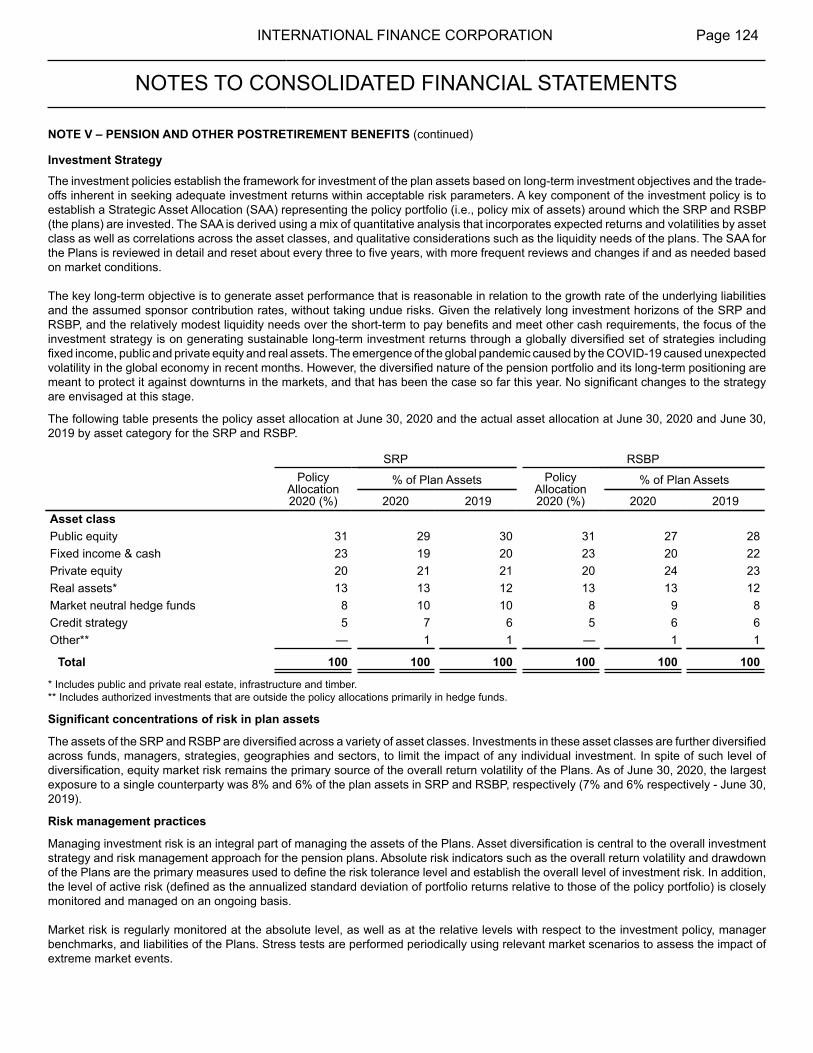
Investment Strategy
The investment policies establish the framework for investment of the plan assets based on long-term investment objectives and the trade-offs inherent in seeking adequate investment returns within acceptable risk parameters. A key component of the investment policy is toestablish a Strategic Asset Allocation (SAA) representing the policy portfolio (i.e., policy mix of assets) around which the SRP and RSBP(the plans) are invested. The SAA is derived using a mix of quantitative analysis that incorporates expected returns and volatilities by assetclass as well as correlations across the asset classes, and qualitative considerations such as the liquidity needs of the plans. The SAA forthe Plans is reviewed in detail and reset about every three to five years, with more frequent reviews and changes if and as needed basedon market conditions.
The key long-term objective is to generate asset performance that is reasonable in relation to the growth rate of the underlying liabilitiesand the assumed sponsor contribution rates, without taking undue risks. Given the relatively long investment horizons of the SRP andRSBP, and the relatively modest liquidity needs over the short-term to pay benefits and meet other cash requirements, the focus of theinvestment strategy is on generating sustainable long-term investment returns through a globally diversified set of strategies includingfixed income, public and private equity and real assets. The emergence of the global pandemic caused by the COVID-19 caused unexpectedvolatility in the global economy in recent months. However, the diversified nature of the pension portfolio and its long-term positioning aremeant to protect it against downturns in the markets, and that has been the case so far this year. No significant changes to the strategyare envisaged at this stage.
The following table presents the policy asset allocation at June 30, 2020 and the actual asset allocation at June 30, 2020 and June 30,2019 by asset category for the SRP and RSBP.
SRP RSBPPolicy
Allocation2020 (%)
% of Plan Assets PolicyAllocation2020 (%)
% of Plan Assets
2020 2019 2020 2019Asset classPublic equity 31 29 30 31 27 28Fixed income & cash 23 19 20 23 20 22Private equity 20 21 21 20 24 23Real assets* 13 13 12 13 13 12Market neutral hedge funds 8 10 10 8 9 8Credit strategy 5 7 6 5 6 6Other** — 1 1 — 1 1
Total 100 100 100 100 100 100
* Includes public and private real estate, infrastructure and timber.** Includes authorized investments that are outside the policy allocations primarily in hedge funds.
Significant concentrations of risk in plan assets
The assets of the SRP and RSBP are diversified across a variety of asset classes. Investments in these asset classes are further diversifiedacross funds, managers, strategies, geographies and sectors, to limit the impact of any individual investment. In spite of such level ofdiversification, equity market risk remains the primary source of the overall return volatility of the Plans. As of June 30, 2020, the largestexposure to a single counterparty was 8% and 6% of the plan assets in SRP and RSBP, respectively (7% and 6% respectively - June 30,2019).
Risk management practices
Managing investment risk is an integral part of managing the assets of the Plans. Asset diversification is central to the overall investmentstrategy and risk management approach for the pension plans. Absolute risk indicators such as the overall return volatility and drawdownof the Plans are the primary measures used to define the risk tolerance level and establish the overall level of investment risk. In addition,the level of active risk (defined as the annualized standard deviation of portfolio returns relative to those of the policy portfolio) is closelymonitored and managed on an ongoing basis.
Market risk is regularly monitored at the absolute level, as well as at the relative levels with respect to the investment policy, managerbenchmarks, and liabilities of the Plans. Stress tests are performed periodically using relevant market scenarios to assess the impact ofextreme market events.
INTERNATIONAL FINANCE CORPORATION Page 124
NOTES TO CONSOLIDATED FINANCIAL STATEMENTS
NOTE V – PENSION AND OTHER POSTRETIREMENT BENEFITS (continued)

Monitoring of performance (at both manager and asset class levels) against benchmarks, and compliance with investment guidelines, arecarried out on a regular basis as part of the risk monitoring process. Risk management for different asset classes is tailored to their specificcharacteristics and is an integral part of the external managers’ due diligence and monitoring processes.
Credit risk is monitored on a regular basis and assessed for possible credit event impacts. The liquidity position of the Plans is analyzedat regular intervals and periodically tested using various stress scenarios to ensure that the Plans have sufficient liquidity to meet allcash flow requirements. In addition, the long-term cash flow needs of the Plans are considered during the SAA exercise and are one ofthe main drivers in determining maximum allocation to the illiquid investment vehicles. The plans mitigate operational risk bymaintaining a system of internal controls along with other checks and balances at various levels.
Fair value measurements and disclosures
All plan assets are measured at fair value on a recurring basis. The following table presents the fair value hierarchy of major categoriesof plan assets as of June 30, 2020 and June 30, 2019 (US$ millions):
June 30, 2020SRP RSBP
Level 1 Level 2 Level 3 Total Level 1 Level 2 Level 3 TotalDebt securitiesDiscount notes and time deposits $ 1 $ 11 $ — $ 12 $ —* $ 2 $ — $ 2Securities purchased under resaleagreements 14 — — 14 3 — — 3
Government and agency securities 419 64 — 483 84 14 — 98Corporate and convertible bonds — 106 — 106 — 19 — 19Asset-backed securities — 32 — 32 — 6 — 6Mortgage-backed securities — 72 — 72 — 14 — 14
Total debt securities 434 285 — 719 87 55 — 142
Equity securitiesUS common stocks 127 — — 127 31 — — 31Non-US common stocks 487 — — 487 77 — — 77Mutual funds 4 — — 4 1 — — 1Real estate investment trusts 33 — — 33 6 — — 6
Total equity securities 651 — — 651 115 — — 115
Other funds at NAV**Commingled funds — — — 563 — — — 91Private equity funds — — — 1,117 — — — 217Hedge funds — — — 461 — — — 73Real estate funds (includinginfrastructure and timber) — — — 460 — — — 89
Total other funds — — — 2,601 — — — 470Derivative assets/ liabilities —* (1) — (1) —* —* — —*Other assets/ liabilities***, net — — — 30 — — — 2
Total Assets $ 1,085 $ 284 $ — $ 4,000 $ 202 $ 55 $ — $ 729
* Less than $0.5 million.** Investments measured at fair value using NAV, have not been classified under the fair value hierarchy.*** Includes receivables and payables carried at amounts that approximate fair value.
INTERNATIONAL FINANCE CORPORATION Page 125
NOTES TO CONSOLIDATED FINANCIAL STATEMENTS
NOTE V – PENSION AND OTHER POSTRETIREMENT BENEFITS (continued)

June 30, 2019SRP RSBP
Level 1 Level 2 Level 3 Total Level 1 Level 2 Level 3 TotalDebt securitiesDiscount notes and time deposits $ 5 $ 11 $ — $ 16 $ 1 $ 2 $ — $ 3Securities purchased under resale
agreements 26 — — 26 4 — — 4Government and agency securities 447 97 — 544 86 18 — 104Corporate and convertible bonds — 96 — 96 — 17 — 17Asset-backed securities — 33 — 33 — 6 — 6Mortgage-backed securities — 68 — 68 — 12 — 12
Total debt securities 478 305 — 783 91 55 — 146Equity securitiesUS common stocks 94 — — 94 19 — — 19Non-US common stocks 465 — — 465 68 — — 68Mutual funds 3 — — 3 6 — — 6
Real estate investment trusts 30 — — 30 5 — — 5Total equity securities 592 — — 592 98 — — 98Other funds at NAV**Commingled funds — — — 650 — — — 106Private equity funds — — — 1,056 — — — 203Hedge funds — — — 415 — — — 62Real estate funds (including
infrastructure and timber) — — — 445 — — — 79Total other funds — — — 2,566 — — — 450Derivative assets/ liabilities 1 —* — 1 —* —* — —*Other assets/ liabilities***, net — — — 23 — — — 5
Total Assets $ 1,071 $ 305 $ — $ 3,965 $ 189 $ 55 $ — $ 699
* Less than $0.5 million.** Investments measured at fair value using NAV, have not been classified under the fair value hierarchy.*** Includes receivables and payables carried at amounts that approximate fair value.
Valuation methods and assumptionsThe following are general descriptions of asset categories, as well as the valuation methodologies and inputs used to determine the fairvalue of each major category of Plan assets. It is important to note that the investment amounts in the asset categories shown in the tableabove may be different from the asset category allocation shown in the Investment Strategy section of the note. Asset classes in the tableabove are grouped by the characteristics of the investments held. The asset class break-down in the Investment Strategy section is basedon Management’s view of the economic exposures after considering the impact of derivatives and certain trading strategies.
Debt securitiesDebt securities include discount notes and time deposits, U.S. treasuries and agencies, debt obligations of foreign governments, sub-sovereigns and debt obligations in corporations of domestic and foreign issuers. Debt securities also includes investments in ABS suchas collateralized mortgage obligations and MBS. These securities are valued by independent pricing vendors at quoted market prices forthe same or similar securities, where available. If quoted market prices are not available, fair values are based on discounted cash flowmodels using market-based parameters such as yield curves, interest rates, volatilities, foreign exchange rates and credit curves. Somedebt securities can be valued using techniques which require significant unobservable inputs. The selection of these inputs may involvesome judgment. Management believes its estimates of fair value are reasonable given its processes for obtaining securities prices frommultiple independent third-party vendors, ensuring that valuation models are reviewed and validated, and applying its approach consistentlyfrom period to period. Unless quoted prices are available, money market instruments and securities purchased under resale agreementsare reported at face value which approximates fair value.
INTERNATIONAL FINANCE CORPORATION Page 126
NOTES TO CONSOLIDATED FINANCIAL STATEMENTS
NOTE V – PENSION AND OTHER POSTRETIREMENT BENEFITS (continued)

Equity securitiesEquity securities (including Real Estate Investment Trusts) represent investments in entities in various industries and countries. Investmentsin public equity listed on securities exchanges are valued at the last reported sale price on the last business day of the fiscal year.Commingled fundsCommingled funds are typically collective investment vehicles, such as trusts that are reported at NAV as provided by the investmentmanager or sponsor of the fund based on valuation of underlying investments.Private equity fundsPrivate equity funds include investments primarily in leveraged buyouts, distressed investments and venture capital funds across NorthAmerica, Europe and Asia in a variety of sectors. A large number of these funds are in the investment phase of their life cycle. PrivateEquity investments do not have a readily determinable fair market value and are reported at NAV provided by the fund managers, takinginto consideration the latest audited financial statements of the funds. Private equity funds also include private credit investments whichcomprise direct lending and opportunistic credit funds. Direct lending funds provide private financing to performing medium-size companiesprimarily owned by private equity sponsors. Opportunistic credit strategies (including distressed debt and multi-strategy funds) have flexiblemandates to invest across both public and private markets globally. Private credit investments do not have a readily determinable fairmarket value and are reported at NAV provided by the fund managers, taking into consideration the latest audited financial statements ofthe funds. Real estate funds (including infrastructure and timber) Real estate funds include investments in core real estate, non-core real estate investments (such as debt, value add, and opportunisticequity investments), infrastructure and timber. Real estate investments do not have a readily determinable fair market value and arereported at NAV provided by the fund managers, taking into consideration the latest audited financial statements of the funds.Hedge fundsHedge fund investments include those seeking to maximize absolute returns using a broad range of strategies to enhance returns andprovide additional diversification. Hedge Funds include investments in equity, event driven, fixed income, multi strategy and macro relativevalue strategies. These investments do not have a readily determinable fair market value and are reported at NAV provided by externalmanagers or fund administrators (based on the valuations of underlying investments) on a monthly basis, taking into consideration thelatest audited financial statements of the funds.Investments in hedge funds and commingled funds can typically be redeemed at NAV within the near term while investments in privateequity and most real estate are inherently long term and illiquid in nature with a quarter lag in reporting by the fund managers. Reportingof those asset classes with a reporting lag, Management estimates are based on the latest available information taking into accountunderlying market fundamentals and significant events through the balance sheet date.Investment in derivativesInvestment in derivatives such as equity or bond futures, TBA securities, swaps, options and currency forwards are used to achieve avariety of objectives that include hedging interest rates and currency risks, gaining desired market exposure of a security, an index orcurrency exposure and rebalancing the portfolio. Over-the-counter derivatives are reported using valuations based on discounted cashflow methods incorporating market observable inputs.Estimated future benefits paymentsThe following table shows the benefit payments expected to be paid in each of the next five years and subsequent five years. The expectedbenefit payments are based on the same assumptions used to measure the benefit obligation at June 30, 2020 (US$ millions):
SRP RSBP PEBPJuly 1, 2020 - June 30, 2021 $ 166 $ 11 $ 14July 1, 2021 - June 30, 2022 173 12 15July 1, 2022 - June 30, 2023 180 14 16July 1, 2023 - June 30, 2024 187 15 18July 1, 2024 - June 30, 2025 199 16 20July 1, 2025 - June 30, 2030 1,198 108 132
Expected contributionsIFC’s contribution to the SRP and RSBP varies from year to year, as determined by the Pension Finance Committee, which bases itsjudgment on the results of annual actuarial valuations of the assets and liabilities of the SRP and RSBP. The best estimate of the amountof contributions expected to be paid to the SRP and RSBP by IFC during the fiscal year beginning July 1, 2020 is $71 million and $18million, respectively.
INTERNATIONAL FINANCE CORPORATION Page 127
NOTES TO CONSOLIDATED FINANCIAL STATEMENTS
NOTE V – PENSION AND OTHER POSTRETIREMENT BENEFITS (continued)
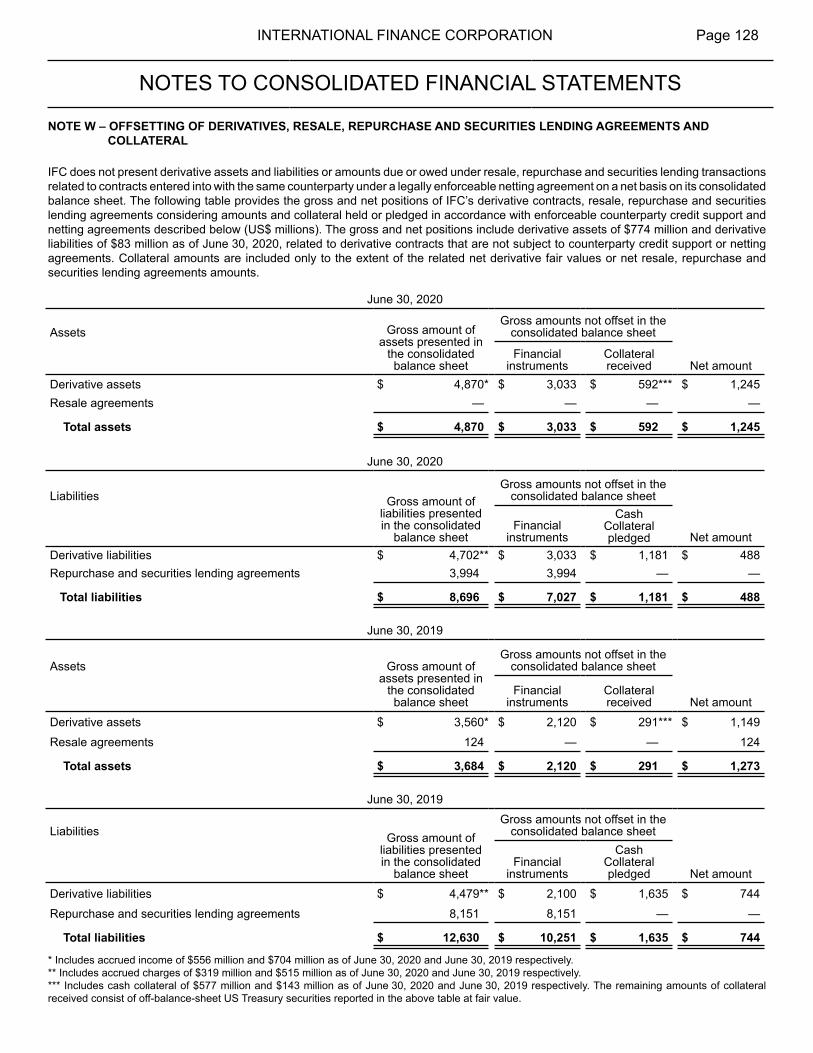
IFC does not present derivative assets and liabilities or amounts due or owed under resale, repurchase and securities lending transactionsrelated to contracts entered into with the same counterparty under a legally enforceable netting agreement on a net basis on its consolidatedbalance sheet. The following table provides the gross and net positions of IFC’s derivative contracts, resale, repurchase and securitieslending agreements considering amounts and collateral held or pledged in accordance with enforceable counterparty credit support andnetting agreements described below (US$ millions). The gross and net positions include derivative assets of $774 million and derivativeliabilities of $83 million as of June 30, 2020, related to derivative contracts that are not subject to counterparty credit support or nettingagreements. Collateral amounts are included only to the extent of the related net derivative fair values or net resale, repurchase andsecurities lending agreements amounts.
June 30, 2020
Assets Gross amount ofassets presented in
the consolidatedbalance sheet
Gross amounts not offset in theconsolidated balance sheet
Financialinstruments
Collateralreceived Net amount
Derivative assets $ 4,870* $ 3,033 $ 592*** $ 1,245Resale agreements — — — —
Total assets $ 4,870 $ 3,033 $ 592 $ 1,245
June 30, 2020
Liabilities Gross amount ofliabilities presentedin the consolidated
balance sheet
Gross amounts not offset in theconsolidated balance sheet
Financialinstruments
CashCollateralpledged Net amount
Derivative liabilities $ 4,702** $ 3,033 $ 1,181 $ 488Repurchase and securities lending agreements 3,994 3,994 — —
Total liabilities $ 8,696 $ 7,027 $ 1,181 $ 488
June 30, 2019
Assets Gross amount ofassets presented in
the consolidated balance sheet
Gross amounts not offset in theconsolidated balance sheet
Financialinstruments
Collateralreceived Net amount
Derivative assets $ 3,560* $ 2,120 $ 291*** $ 1,149
Resale agreements 124 — — 124
Total assets $ 3,684 $ 2,120 $ 291 $ 1,273
June 30, 2019
Liabilities Gross amount ofliabilities presentedin the consolidated
balance sheet
Gross amounts not offset in theconsolidated balance sheet
Financialinstruments
CashCollateralpledged Net amount
Derivative liabilities $ 4,479** $ 2,100 $ 1,635 $ 744
Repurchase and securities lending agreements 8,151 8,151 — —
Total liabilities $ 12,630 $ 10,251 $ 1,635 $ 744
* Includes accrued income of $556 million and $704 million as of June 30, 2020 and June 30, 2019 respectively.** Includes accrued charges of $319 million and $515 million as of June 30, 2020 and June 30, 2019 respectively.*** Includes cash collateral of $577 million and $143 million as of June 30, 2020 and June 30, 2019 respectively. The remaining amounts of collateralreceived consist of off-balance-sheet US Treasury securities reported in the above table at fair value.
INTERNATIONAL FINANCE CORPORATION Page 128
NOTES TO CONSOLIDATED FINANCIAL STATEMENTS
NOTE W – OFFSETTING OF DERIVATIVES, RESALE, REPURCHASE AND SECURITIES LENDING AGREEMENTS ANDCOLLATERAL

IFC’s derivative contracts with market counterparties are entered into under standardized master agreements published by the InternationalSwaps and Derivatives Association (“ISDA” Agreements). ISDA Agreements provide for a single lump sum settlement amount upon theearly termination of transactions following a default or termination event whereby amounts payable by the non-defaulting party to the otherparty may be applied to reduce any amounts that the other party owes the non-defaulting party. This setoff effectively reduces any amountpayable by the non-defaulting party to the defaulting party.
IFC’s ISDA Agreements are appended by a Credit Support Annex (“CSA”) that provides for the receipt, and in some cases, posting, ofcollateral in the form of cash, U.S. Treasury securities or U.K. gilts to reduce mark-to market exposure among derivative marketcounterparties. IFC recognizes cash collateral received and a corresponding liability on its balance sheet for the obligation to return it.Securities received as collateral are not recognized on IFC’s balance sheet. As of June 30, 2020, $1,221 million of cash collateral wasposted under CSAs ($1,734 million June 30, 2019). IFC recognizes a receivable on its balance sheet for its rights to cash collateral posted.In accordance with the CSAs, IFC may rehypothecate securities received as collateral, subject to the obligation to return such collateraland any related distributions received. In the event of a counterparty default, IFC may exercise certain rights and remedies, including theright to set off any amounts payable by the counterparty against any collateral held by IFC and the right to liquidate any collateral held. Asof June 30, 2020, IFC had $597 million ($178 million at June 30, 2019) of outstanding obligations to return cash collateral under CSAs.The estimated fair value of all securities received and held as collateral under CSAs as of June 30, 2020, all of which may be rehypothecatedwas $24 million ($162 million - June 30, 2019). As of June 30, 2020, $0 of such collateral was rehypothecated under securities lendingagreements ($0 - June 30, 2019).
Collateral posted by IFC in connection with repurchase agreements approximates the amounts classified as Securities sold underrepurchase agreements. At June 30, 2020, no trading securities were pledged in connection with borrowings under a short-term discountnote program, the carrying amount of which was $2,994 million ($2,207 million - June 30, 2019) (At June 30, 2019, trading securities witha carrying amount (fair value) of $197 million were pledged to secure this program).
Under certain CSA’s IFC is not required to pledge collateral unless its credit rating is downgraded from its current AAA/Aaa. The aggregatefair value of derivatives containing such a credit risk-linked contingent feature in a net liability position was $6 million at June 30, 2020($71 million at June 30, 2019). At June 30, 2020, IFC had no collateral posted under these agreements. If IFC’s credit rating were to bedowngraded from its current AAA/Aaa to AA+/Aa1 or below, then collateral in the amount of $0 would be required to be posted against netliability positions with counterparties at June 30, 2020 ($0 at June 30, 2019).
IFC’s resale, repurchase and securities lending transactions are entered into with counterparties under industry standard master nettingagreements which generally provide the right to offset amounts owed one another with respect to multiple transactions under such masternetting agreement and liquidate the purchased or borrowed securities in the event of counterparty default. The estimated fair value of allsecurities received and held as collateral under these master netting agreements as of June 30, 2020 was $0 ($124 million - June 30,2019).
The following table presents an analysis of IFC’s repurchase and securities lending transactions by (1) class of collateral pledged and (2)their remaining contractual maturity as of June 30, 2020 and June 30, 2019 (US$ millions):
Remaining Contractual Maturity of the Agreements - June 30, 2020Overnight and
ContinuousUp to 30
days 30-90 days Greater than90 days Total
Repurchase agreementsU.S. Treasury securities $ 250 $ 998 $ 1,254 $ 1,493 $ 3,995
Agency securities — — — — —
Municipal securities and other — — — — —
Total Repurchase agreements 250 998 1,254 1,493 3,995Securities lending transactions
U.S. Treasury securities $ — $ — $ — $ — $ —
Total Securities lending transactions — — — — —Total Repurchase agreements and Securities
lending transactions $ 250 $ 998 $ 1,254 $ 1,493 $ 3,995*
As of June 30, 2020, IFC has no repurchase-to-maturity transactions outstanding.* Includes accrued interest.
INTERNATIONAL FINANCE CORPORATION Page 129
NOTES TO CONSOLIDATED FINANCIAL STATEMENTS
NOTE W – OFFSETTING OF DERIVATIVES, RESALE, REPURCHASE AND SECURITIES LENDING AGREEMENTS ANDCOLLATERAL (continued)

Remaining Contractual Maturity of the Agreements - June 30, 2019Overnight and
ContinuousUp to 30
days 30-90 days Greater than90 days Total
Repurchase agreementsU.S. Treasury securities $ — $ 6,263 $ 1,913 $ — $ 8,176
Agency securities — — — — —
Municipal securities and other — — — — —
Total Repurchase agreements — 6,263 1,913 — 8,176Securities lending transactions
U.S. Treasury securities $ — $ — $ — $ — $ —
Total Securities lending transactions — — — — —Total Repurchase agreements and Securities
lending transactions $ — $ 6,263 $ 1,913 $ — $ 8,176*
As of June 30, 2019, IFC has no repurchase-to-maturity transactions outstanding.*Includes accrued interest
INTERNATIONAL FINANCE CORPORATION Page 130
NOTES TO CONSOLIDATED FINANCIAL STATEMENTS
NOTE W – OFFSETTING OF DERIVATIVES, RESALE, REPURCHASE AND SECURITIES LENDING AGREEMENTS ANDCOLLATERAL (continued)
NOTE X – RELATED PARTY TRANSACTIONS
IFC transacts with related parties including by providing grants to IDA (see Note O - Retained Earnings Designation and Related Expendituresand Accumulated Other Comprehensive Income), receiving loans (see Note K - Borrowings), participating in shared service arrangements,as well as through cost sharing of IBRD’s sponsored pension and other postretirement plans.
IFC's receivables from (payables to) its related parties are presented in the following table (US$ millions):
June 30, 2020 June 30, 2019
IBRD IDA Total IBRD IDA TotalServices and Support Payables $ (63) $ — $ (63) $ (67) $ — $ (67)PSW - Local Currency Facility — 7 7 — 1 1PSW - Blended Finance Facility — (7) (7) — (1) (1)Borrowings — (621) (621) — (717) (717)Pension and Other Postretirement Benefits 477 — 477 414 — 414Share of Investments* 140 — 140 114 — 114
$ 554 $ (621) $ (67) $ 461 $ (717) $ (256)* Represents receivable from IBRD for IFC's share of investments associated with Post-Retirement Contribution Reserve Fund (PCRF), which is a fundestablished to stabilize contributions made to the pension plans.
The receivables from (payables to) these related parties are reported in the Balance Sheet as follows:
Receivables / Payables related to: Reported as:Receivable for pension and other postretirement benefits, and share of investments Receivables and other assetsPayable for services and support Payables and other liabilities
Services and Support Payments
IFC obtains certain administrative and overhead services from IBRD in those areas where common services can be efficiently providedby IBRD. This includes shared costs of the Boards of Governors and Directors, and other services such as communications, internalauditing, administrative support, supplies, and insurance. IFC makes payments for these services to IBRD based on negotiated fees,chargebacks and allocated charges, where chargeback is not feasible. Expenses allocated to IFC for the year ended June 30, 2020, were$139 million ($128 million - year ended June 30, 2019; $110 million - year ended June 30, 2018). Other chargebacks include $24 millionfor the year ended June 30, 2020 ($24 million - year ended June 30, 2019; $22 million - year ended June 30, 2018).

IDA Private Sector Window (IDA-PSW)
As part of the IDA 18 Replenishment, a $2.5 billion IDA-PSW has been created to mobilize private sector investment in IDA-only and IDA-eligible fragile and conflict-affected states. Under the fee arrangement for the IDA-PSW, IDA will receive a fee for transactions executedunder this window and will reimburse IFC and MIGA for the related costs incurred in administering transactions below.
IDA-PSW transactions (in US$ millions)
Facility USD Notional
Net Asset/(Liability)position Description
Balance SheetLocation
Localcurrency 64 7
Currency swaps with IDA to support local currency denominatedloans
Derivative assets/liabilities
Facility Commitments
Net Asset/(Liability)position Description
Balance SheetLocation
BlendedFinance 41 (7) Funding for IFC's IDA-PSW equity investments
Payables and otherliabilities
BlendedFinance 677* —
Guarantee from IDA that shares the first loss to support IFC'sGuarantee Programs in IDA-PSW eligible countries
Off-balance sheetitem
* Includes $162 million that has been approved but not committed as of June 30, 2020.
Borrowings
During the quarter ended September 30, 2014, IFC issued an amortizing, non-interest bearing promissory note, maturing September 15,2039, to IDA (the Note) in exchange for $1,179 million. The Note requires payments totaling $1,318 million, resulting in an effective interestrate of 1.84%. With IFC’s consent, IDA may redeem the Note after September 2, 2019, upon an adverse change in its financial conditionor outlook. The amount due to IDA upon such redemption is equal to the present value of the all unpaid amounts discounted at the effectiveinterest rate. IDA may transfer the Note; however, its redemption right is not transferrable. IFC has elected the Fair Value Option for theNote.
IFC has investments where IFC has significant influence, direct equity investments representing 20 percent or more ownership but in whichIFC does not have significant influence, and equity interests in private equity funds. However, IFC’s transactions with its investment affiliatesare limited to IFC’s equity and debt investments and disclosed in other footnotes.
Pension and Other Postretirement Benefits
The receivable from IBRD represents IFC’s net share of prepaid costs for pension and other postretirement benefit plans and Post-Employment Benefits Plan (PEBP) assets. These will be realized over the lives of the plan participants.
INTERNATIONAL FINANCE CORPORATION Page 131
NOTES TO CONSOLIDATED FINANCIAL STATEMENTS
NOTE X – RELATED PARTY TRANSACTIONS (continued)
NOTE Y – SUBSEQUENT EVENTS
The fair value of IFC’s listed equity investments is based on market prices of such investments as of June 30, 2020. Changes in marketprices subsequent to June 30, 2020 will be reported in the period in which such change occurs.
NOTE Z – CONTINGENCIES
In the normal course of its business, IFC is from time to time named as a defendant or co-defendant in various legal actions on differentgrounds in various jurisdictions. Although there can be no assurances, based on the information currently available, IFC’s Managementdoes not believe the outcome of any of the various existing legal actions will have a material adverse effect on IFC’s financial position,results of operations or cash flows.
Independent Auditors’ ReportPresident and Board of DirectorsInternational Finance Corporation:
We have audited the accompanying consolidated financial statements of International Finance Corporation and its subsidiary("IFC") which comprise the consolidated balance sheets as of June 30, 2020 and 2019, and the related consolidated statementsof operations, comprehensive income (loss), changes in capital and cash flows, for the years then ended, and the related notesto the consolidated financial statements.Management's Responsibility for the Consolidated Financial StatementsManagement is responsible for the preparation and fair presentation of these consolidated financial statements in accordancewith accounting principles generally accepted in the United States of America; this includes the design, implementation, andmaintenance of internal control relevant to the preparation and fair presentation of consolidated financial statements that are freefrom material misstatement, whether due to fraud or error.Auditors' ResponsibilityOur responsibility is to express an opinion on these consolidated financial statements based on our audits. We conducted ouraudits in accordance with auditing standards generally accepted in the United States of America. Those standards require thatwe plan and perform the audit to obtain reasonable assurance about whether the consolidated financial statements are free frommaterial misstatement.An audit involves performing procedures to obtain audit evidence about the amounts and disclosures in the consolidated financialstatements. The procedures selected depend on the auditor's judgment, including the assessment of the risks of materialmisstatement of the consolidated financial statements, whether due to fraud or error. In making those risk assessments, theauditor considers internal control relevant to IFC’s preparation and fair presentation of the consolidated financial statements inorder to design audit procedures that are appropriate in the circumstances. An audit also includes evaluating the appropriatenessof accounting policies used and the reasonableness of significant accounting estimates made by management, as well asevaluating the overall presentation of the consolidated financial statements.We believe that the audit evidence we have obtained is sufficient and appropriate to provide a basis for our audit opinion.OpinionIn our opinion, the consolidated financial statements referred to above present fairly, in all material respects, the financial positionof IFC as of June 30, 2020 and 2019, and the results of its operations and its cash flows for the years then ended in accordancewith accounting principles generally accepted in the United States of America.Predecessor Auditors' Opinion on 2018 Financial StatementsThe consolidated statements of operations, comprehensive income, changes in capital and cash flows of IFC for the year endedJune 30, 2018, and the related notes, were audited by other auditors whose report, dated August 9, 2018, expressed an unmodifiedopinion on those statements.Report on Supplemental InformationOur audit was conducted for the purpose of forming an opinion on the consolidated financial statements as a whole. Theconsolidated statement of capital stock and voting power as of June 30, 2020 ("supplemental information") listed in the table ofcontents is presented for the purpose of additional analysis and is not a required part of the consolidated financial statements.This supplemental information is the responsibility of management and was derived from and relates directly to the underlyingaccounting and other records used to prepare the consolidated financial statements. Such information has been subjected to theauditing procedures applied in our audits of the consolidated financial statements and certain additional procedures, includingcomparing and reconciling such information directly to the underlying accounting and other records used to prepare theconsolidated financial statements or to the consolidated financial statements themselves, and other additional procedures inaccordance with auditing standards generally accepted in the United States of America. In our opinion, such information is fairlystated in all material respects in relation to the consolidated financial statements as a whole. Report on Internal Control over Financial ReportingWe have also audited, in accordance with auditing standards generally accepted in the United States of America, IFC's internalcontrol over financial reporting as of June 30, 2020, based on criteria established in Internal Control – Integrated Framework(2013) issued by the Committee of Sponsoring Organizations of the Treadway Commission and our report dated August 7, 2020,expressed an unmodified opinion on IFC’s internal control over financial reporting.
August 7, 2020
Page 132