management’s discussion and analysis · 30/6/2018 · touchstone exploration inc. q2 2018...
TRANSCRIPT
Touchstone Exploration Inc.
Management’s Discussion and Analysis
June 30, 2018
Touchstone Exploration Inc. Q2 2018 Management’s Discussion & Analysis
2
Management’s Discussion and Analysis For the three and six months ended June 30, 2018
The following Management’s Discussion and Analysis (“MD&A”) of the financial condition and results of operations of Touchstone Exploration Inc. (“Touchstone”, “we”, “our”, “us” or the “Company”) for the three and six months ended June 30, 2018 is dated August 13, 2018 and should be read in conjunction with the Company’s unaudited interim consolidated financial statements for the three and six months ended June 30, 2018, as well as the Company’s audited consolidated financial statements for the year ended December 31, 2017. The unaudited interim consolidated financial statements and the audited consolidated financial statements have been prepared in accordance with International Financial Reporting Standards (“IFRS” or “GAAP”) as issued by the International Accounting Standards Board. This MD&A should also be read in conjunction with Touchstone’s MD&A for the year ended December 31, 2017, as disclosure which is unchanged from December 31, 2017 may not be duplicated herein. Additional information related to Touchstone and factors that could affect the Company’s operations and financial results are included with reports on file with the Canadian securities regulatory authorities, including the Company’s 2017 Annual Information Form dated March 26, 2018, which can be found on the Company’s SEDAR profile (www.sedar.com). Unless otherwise stated, tabular amounts herein are in thousands of Canadian dollars (“$” or “Cdn$”), and amounts in text are rounded to thousands of Canadian dollars. The Company may also reference United States dollars (“US$”) and Trinidad and Tobago dollars (“TT$”) herein, which are the functional and operational currencies of the Company’s subsidiaries. All production volumes disclosed herein are sales volumes. Certain prior year amounts have been reclassified to conform to current year presentation. This MD&A contains forward-looking statements and non-GAAP measures. Readers are cautioned that the MD&A should be read in conjunction with Touchstone’s disclosure under the headings “Forward-looking Statements,” “Non-GAAP Measures,” and “Abbreviations” included at the end of this MD&A. About Touchstone Exploration Inc.
Touchstone is incorporated under the laws of Alberta, Canada with its head office located in Calgary, Alberta. The Company is an oil and gas exploration and production company active in the Republic of Trinidad and Tobago (“Trinidad”). Touchstone is one of the largest independent onshore oil producers in Trinidad, with assets in several large, high-quality reservoirs that have significant internally estimated total petroleum initially-in-place and an extensive inventory of low-risk development opportunities. The Company’s common shares are traded on the Toronto Stock Exchange and the AIM market of the London Stock Exchange (“AIM”) under the symbol “TXP”. Touchstone’s strategy is to leverage western Canadian enhanced oil recovery experience and capability to international onshore properties to create shareholder value. Outside of its core Trinidad portfolio, the Company will continue to examine opportunities in jurisdictions that have stable political and fiscal regimes coupled with large defined original oil in place.
Touchstone Exploration Inc. Q2 2018 Management’s Discussion & Analysis
3
Second Quarter 2018 Highlights
• Achieved quarterly average crude oil production of 1,717 bbls/d, representing increases of 11% and 29% from the first quarter of 2018 and the second quarter of 2017, respectively.
• Continued our 2018 development program with total drilling and development capital expenditures of $4,520,000, drilling three wells and performing four well recompletions.
• Realized $12,508,000 in petroleum sales, a 68% increase from the prior year second quarter.
• Generated an operating netback of $38.19 per barrel, a 92% increase relative to the $19.88 per barrel generated in the prior year comparative quarter.
• Delivered funds flow from operations of $3,258,000 ($0.03 per basic share) compared to $438,000 ($0.01 per basic share) in the second quarter of 2017.
• Recognized a reduced net loss of $692,000 ($0.01 per basic share) compared to a net loss of $1,848,000 ($0.02 per basic share) realized in the equivalent quarter of 2017.
• Extended our $15 million term loan maturity date and initial principal repayments by one year.
• Maintained balance sheet strength with second quarter cash of $10,556,000 and net debt of $11,266,000, representing 1.0 times net debt to first half 2018 annualized funds flow from operations.
Financial and Operating Results Summary
Three months ended Six months ended
June 30,
2018 March 31,
2018 June 30,
2017 June 30,
2018 June 30,
2017
Operating Average daily oil production (bbls/d) 1,717 1,543 1,334 1,631 1,307 Net wells drilled 3 2 3 5 3 Net wells recompleted 4 5 5 9 10 Brent benchmark price (US$/bbl) 74.53 66.86 49.55 70.67 51.57 Operating netback(1) ($/bbl) Realized sales price 80.04 74.76 61.26 77.55 62.67 Royalties (22.59) (21.27) (16.03) (21.97) (18.46) Operating expenses (19.26) (19.96) (25.35) (19.59) (22.49)
38.19 33.53 19.88 35.99 21.72
Financial ($000’s except share and per share amounts) Petroleum sales 12,508 10,384 7,436 22,892 14,827 Funds flow from operations 3,258 2,601 438 5,859 831 Per share – basic and diluted(1) 0.03 0.02 0.01 0.05 0.01
Net (loss) earnings (692) 125 (1,848) (567) (3,397) Per share – basic and diluted (0.01) 0.01 (0.02) (0.01) (0.04)
Capital expenditures Exploration 434 228 520 662 708 Development 4,520 3,621 4,940 8,141 5,486
4,954 3,849 5,460 8,803 6,194
Net debt(1) – end of period Working capital surplus (3,734) (4,922) (1,186) (3,734) (1,186) Principal long-term balance of loan 15,000 14,190 15,000 15,000 15,000
11,266 9,268 13,814 11,266 13,814 Note: (1) See “Non-GAAP Measures”.
Touchstone Exploration Inc. Q2 2018 Management’s Discussion & Analysis
4
Three months ended Six months ended
June 30,
2018 March 31,
2018 June 30,
2017 June 30,
2018 June 30,
2017
Weighted average shares outstanding Basic 129,021,428 129,021,428 84,236,044 129,021,428 83,689,629 Diluted 129,021,428 129,691,693 84,236,044 129,021,428 83,689,629
Outstanding shares – end of period 129,021,428 129,021,428 103,137,143 129,021,428 103,137,143
Operating Results Our operating results in the second quarter were consistent with our expectations, as we continued with our ten well drilling campaign by successfully drilling three development wells and spudding the sixth well of the program on June 15, 2018. Capital expenditures totaled $4,954,000, of which $4,520,000 related to drilling and development activities. We recompleted four wells in the quarter, with an aggregate nine wells recompleted in the first half of 2018. Second quarter 2018 crude oil production averaged 1,717 bbls/d, a 29% increase relative to the 1,334 bbls/d produced in the second quarter of 2017 and a 11% increase relative to the 1,543 bbls/d produced in the first quarter of 2018. The five wells drilled to date in 2018 combined to add 183 bbls/d of incremental production in the second quarter. Our four well 2017 program continued to perform above internal expectations, contributing approximately 351 bbls/day of production in the quarter. Financial Results Our second quarter operating netback improved 92% to $38.19 per barrel, as compared to $19.88 per barrel in the second quarter of 2017. Realized second quarter 2018 crude oil pricing was $80.04 (US$61.79) per barrel, 31% greater than the $61.26 (US$45.51) per barrel received in the equivalent quarter of 2017. In comparison to the second quarter of 2017, royalty expenses per barrel increased 41% based on the rising scale effect of increased commodity prices to royalty rates. Second quarter 2018 operating costs per barrel decreased 24% from the corresponding quarter of 2017, predominantly from increased production over a fixed operating cost base and increased operating efficiencies. We generated funds flow from operations of $3,258,000 ($0.03 per basic share) in the second quarter of 2018 versus $438,000 ($0.01 per basic share) in the second quarter of 2017. The increase in funds flow was largely attributed to stronger oil price realizations and operating netbacks. Excluding realized financial derivative gains, our second quarter 2018 funds flow was the highest since the third quarter of 2014. As a result, the Company decreased its net loss by 63% from the prior year second quarter, recording a net loss of $692,000 ($0.01 per basic share) during the three months ended June 30, 2018. We maintained strong financial liquidity, exiting the quarter with a cash balance of $10,556,000, a working capital surplus of $3,734,000 and a $15,000,000 principal term loan balance. Our June 30, 2018 net debt of $11,266,000 represented net debt to trailing twelve-month funds flow from operations of 1.4 times and net debt to year to date second quarter 2018 annualized funds flow from operations of 1.0 times. We expect our liquidity position to be stable going forward as the new wells drilled in the quarter are placed onto production and optimized. On June 13, 2018, we extended the maturity of our $15 million term loan by one year to November 23, 2022, with no mandatory principal payments until January 1, 2020. In addition, the amended agreement removed the minimum $5 million quarterly cash reserves financial covenant. The credit facility is covenant based and does not require annual or semi-annual reviews. We were well within the financial covenants as at June 30, 2018. The one-year deferral of principal payments will allow us to continue our near-term development strategy into 2019. On June 21, 2018, we entered an agreement to dispose of our 50% operating working interest in our non-core Icacos block to our third-party partner for minimum consideration of US$500,000. Consideration will
Touchstone Exploration Inc. Q2 2018 Management’s Discussion & Analysis
5
be paid based on the Company’s working interest net revenue it would have received had it retained such interest through December 2021. The property averaged 10 bbls/d of net crude oil production in the second quarter of 2018. The agreement was effective April 1, 2018 and remains subject to local regulatory approvals. Principal Properties
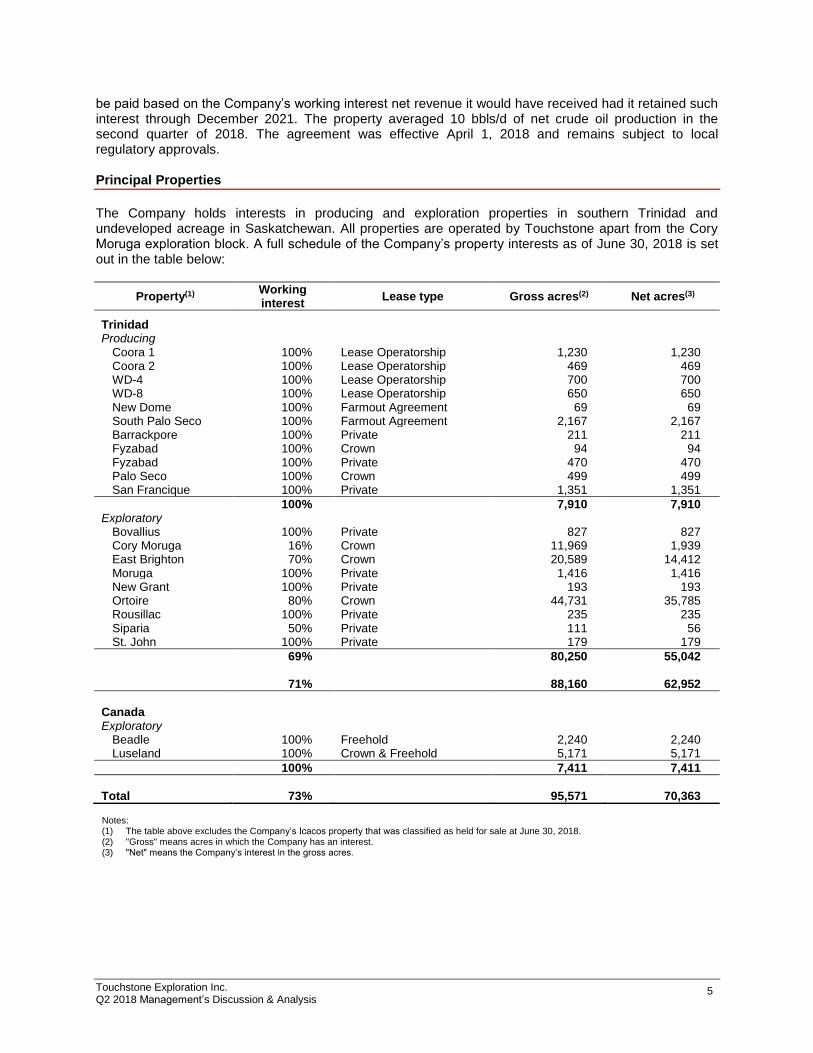
The Company holds interests in producing and exploration properties in southern Trinidad and undeveloped acreage in Saskatchewan. All properties are operated by Touchstone apart from the Cory Moruga exploration block. A full schedule of the Company’s property interests as of June 30, 2018 is set out in the table below:
Property(1) Working interest
Lease type Gross acres(2) Net acres(3)
Trinidad Producing
Coora 1 100% Lease Operatorship 1,230 1,230 Coora 2 100% Lease Operatorship 469 469 WD-4 100% Lease Operatorship 700 700 WD-8 100% Lease Operatorship 650 650 New Dome 100% Farmout Agreement 69 69 South Palo Seco 100% Farmout Agreement 2,167 2,167 Barrackpore 100% Private 211 211 Fyzabad 100% Crown 94 94 Fyzabad 100% Private 470 470 Palo Seco 100% Crown 499 499 San Francique 100% Private 1,351 1,351
100% 7,910 7,910 Exploratory
Bovallius 100% Private 827 827 Cory Moruga 16% Crown 11,969 1,939 East Brighton 70% Crown 20,589 14,412 Moruga 100% Private 1,416 1,416 New Grant 100% Private 193 193 Ortoire 80% Crown 44,731 35,785 Rousillac 100% Private 235 235 Siparia 50% Private 111 56 St. John 100% Private 179 179
69% 80,250 55,042 71% 88,160 62,952
Canada Exploratory
Beadle 100% Freehold 2,240 2,240 Luseland 100% Crown & Freehold 5,171 5,171
100% 7,411 7,411
Total 73% 95,571 70,363 Notes: (1) The table above excludes the Company’s Icacos property that was classified as held for sale at June 30, 2018. (2) "Gross" means acres in which the Company has an interest. (3) "Net" means the Company’s interest in the gross acres.
Touchstone Exploration Inc. Q2 2018 Management’s Discussion & Analysis
6
Operating Agreements
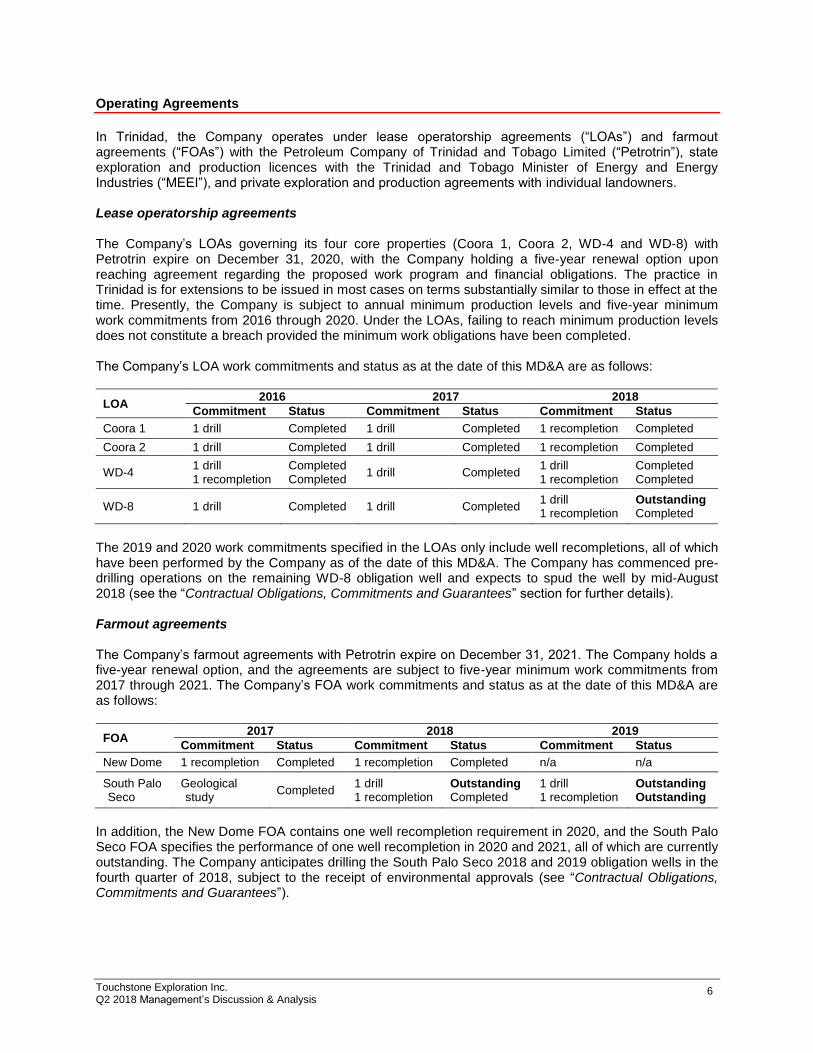
In Trinidad, the Company operates under lease operatorship agreements (“LOAs”) and farmout agreements (“FOAs”) with the Petroleum Company of Trinidad and Tobago Limited (“Petrotrin”), state exploration and production licences with the Trinidad and Tobago Minister of Energy and Energy Industries (“MEEI”), and private exploration and production agreements with individual landowners. Lease operatorship agreements The Company’s LOAs governing its four core properties (Coora 1, Coora 2, WD-4 and WD-8) with Petrotrin expire on December 31, 2020, with the Company holding a five-year renewal option upon reaching agreement regarding the proposed work program and financial obligations. The practice in Trinidad is for extensions to be issued in most cases on terms substantially similar to those in effect at the time. Presently, the Company is subject to annual minimum production levels and five-year minimum work commitments from 2016 through 2020. Under the LOAs, failing to reach minimum production levels does not constitute a breach provided the minimum work obligations have been completed. The Company’s LOA work commitments and status as at the date of this MD&A are as follows:
LOA 2016 2017 2018
Commitment Status Commitment Status Commitment Status
Coora 1 1 drill Completed 1 drill Completed 1 recompletion Completed
Coora 2 1 drill Completed 1 drill Completed 1 recompletion Completed
WD-4 1 drill 1 recompletion
Completed Completed
1 drill Completed 1 drill 1 recompletion
Completed Completed
WD-8 1 drill Completed 1 drill Completed 1 drill 1 recompletion
Outstanding Completed
The 2019 and 2020 work commitments specified in the LOAs only include well recompletions, all of which have been performed by the Company as of the date of this MD&A. The Company has commenced pre-drilling operations on the remaining WD-8 obligation well and expects to spud the well by mid-August 2018 (see the “Contractual Obligations, Commitments and Guarantees” section for further details). Farmout agreements The Company’s farmout agreements with Petrotrin expire on December 31, 2021. The Company holds a five-year renewal option, and the agreements are subject to five-year minimum work commitments from 2017 through 2021. The Company’s FOA work commitments and status as at the date of this MD&A are as follows:
FOA 2017 2018 2019
Commitment Status Commitment Status Commitment Status
New Dome 1 recompletion Completed 1 recompletion Completed n/a n/a
South Palo Seco
Geological study
Completed 1 drill 1 recompletion
Outstanding Completed
1 drill 1 recompletion
Outstanding Outstanding
In addition, the New Dome FOA contains one well recompletion requirement in 2020, and the South Palo Seco FOA specifies the performance of one well recompletion in 2020 and 2021, all of which are currently outstanding. The Company anticipates drilling the South Palo Seco 2018 and 2019 obligation wells in the fourth quarter of 2018, subject to the receipt of environmental approvals (see “Contractual Obligations, Commitments and Guarantees”).
Touchstone Exploration Inc. Q2 2018 Management’s Discussion & Analysis
7
MEEI exploration and production licences The Company has exploration and production licences with the MEEI for its Fyzabad and Palo Seco producing properties and its Cory Moruga, East Brighton and Ortoire exploration properties. The licences typically are for an initial six-year term, with the option to extend a further 19 years upon a commercial discovery. Under its East Brighton and Ortoire licences, the Company is subject to work commitments through 2020 (see the “Contractual Obligations, Commitments and Guarantees” section for further details). The Company’s Fyzabad and Palo Seco agreements with the MEEI contain no major work obligations or covenants; however both licences expired on August 19, 2013. The Company is currently negotiating licence renewals and has permission from the MEEI to operate in the interim period. The Company has no indication that the two licences will not be renewed. During the three and six months ended June 30, 2018, production volumes produced under expired MEEI production licences represented 3.6% and 3.6% of total production, respectively (2017 – 4.6% and 5.0%). As at June 30, 2018, the estimated net book value of the properties operating under expired MEEI production licences was approximately $1,891,000, representing 2.6% of the Company’s property and equipment balance (December 31, 2017 – $1,866,000 and 3.0%). Private lease agreements Touchstone also negotiates private lease agreements with individual land owners. Lease terms are typically 35 years in duration and contain no minimum work obligations. The Company is operating under a number of Trinidad private lease agreements which have expired and are currently being renewed. Based on legal opinions received, Touchstone is continuing to recognize revenue on the producing properties because the Company is the operator, is paying all associated royalties and taxes, and no title to the revenue has been disputed. The Company currently has no indication that any of the producing expired leases will not be renewed. The continuation of production from expired private leases during the renegotiation process is common in Trinidad. During the three and six months ended June 30, 2018, production volumes produced under expired private lease agreements represented 2.4% and 2.5% of total production, respectively (2017 – 3.2% and 3.0%). Crude oil marketing agreement On January 14, 1974, Premier Consolidated Oilfields Limited, the Company’s predecessor in interest, and the Trinidad and Tobago Oil Company Limited, Petrotrin’s predecessor, entered into a Crude Oil Agreement whereby Petrotrin committed to purchase all petroleum crude oil produced by Primera Oil and Gas Limited from producing Trinidad properties. The agreement has an indefinite term and may be terminated by either party on three months notice. The price was historically based upon a Venezuelan posted price; however, the index has been discontinued. The price currently paid is a premium to the Petrotrin indexed price, paid in US$. The Company is currently renegotiating this agreement with Petrotrin.
Touchstone Exploration Inc. Q2 2018 Management’s Discussion & Analysis
8
Economic Environment
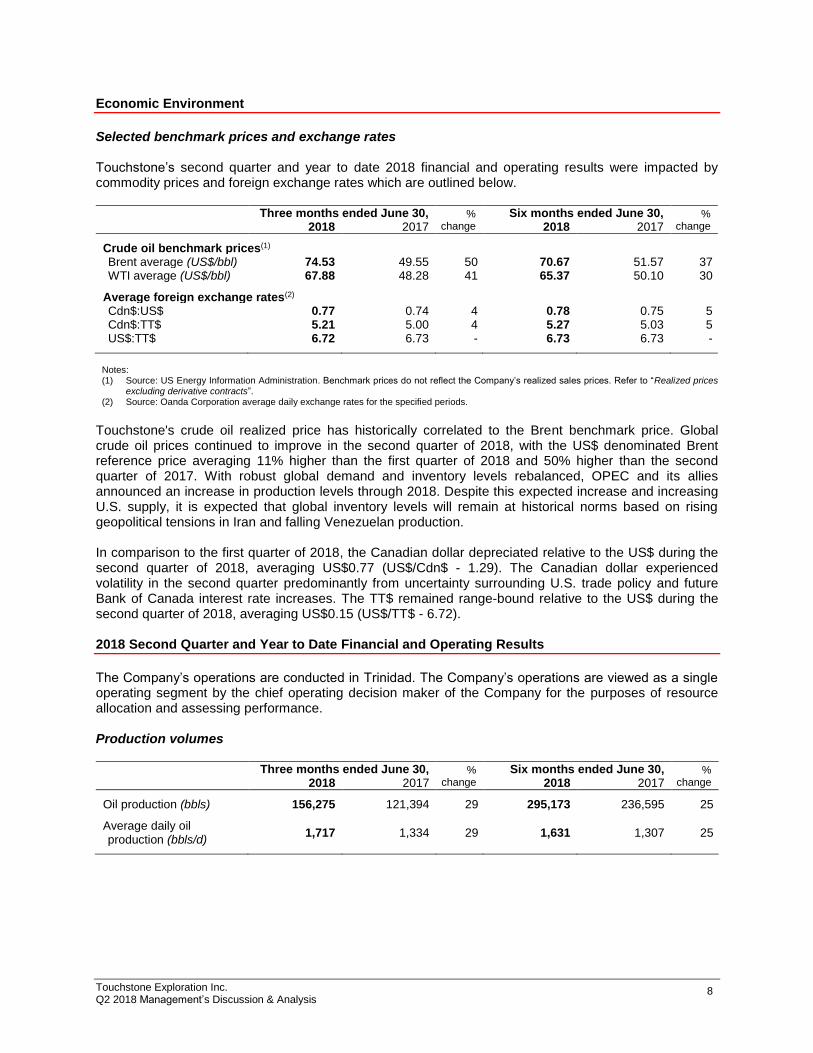
Selected benchmark prices and exchange rates Touchstone’s second quarter and year to date 2018 financial and operating results were impacted by commodity prices and foreign exchange rates which are outlined below.
Three months ended June 30, % change
Six months ended June 30, % change 2018 2017 2018 2017
Crude oil benchmark prices(1) Brent average (US$/bbl) 74.53 49.55 50 70.67 51.57 37 WTI average (US$/bbl) 67.88 48.28 41 65.37 50.10 30
Average foreign exchange rates(2) Cdn$:US$ 0.77 0.74 4 0.78 0.75 5 Cdn$:TT$ 5.21 5.00 4 5.27 5.03 5 US$:TT$ 6.72 6.73 - 6.73 6.73 -
Notes: (1) Source: US Energy Information Administration. Benchmark prices do not reflect the Company’s realized sales prices. Refer to “Realized prices
excluding derivative contracts”. (2) Source: Oanda Corporation average daily exchange rates for the specified periods.
Touchstone's crude oil realized price has historically correlated to the Brent benchmark price. Global crude oil prices continued to improve in the second quarter of 2018, with the US$ denominated Brent reference price averaging 11% higher than the first quarter of 2018 and 50% higher than the second quarter of 2017. With robust global demand and inventory levels rebalanced, OPEC and its allies announced an increase in production levels through 2018. Despite this expected increase and increasing U.S. supply, it is expected that global inventory levels will remain at historical norms based on rising geopolitical tensions in Iran and falling Venezuelan production. In comparison to the first quarter of 2018, the Canadian dollar depreciated relative to the US$ during the second quarter of 2018, averaging US$0.77 (US$/Cdn$ - 1.29). The Canadian dollar experienced volatility in the second quarter predominantly from uncertainty surrounding U.S. trade policy and future Bank of Canada interest rate increases. The TT$ remained range-bound relative to the US$ during the second quarter of 2018, averaging US$0.15 (US$/TT$ - 6.72). 2018 Second Quarter and Year to Date Financial and Operating Results
The Company’s operations are conducted in Trinidad. The Company’s operations are viewed as a single operating segment by the chief operating decision maker of the Company for the purposes of resource allocation and assessing performance. Production volumes
Three months ended June 30, % change
Six months ended June 30, % change 2018 2017 2018 2017
Oil production (bbls) 156,275 121,394 29 295,173 236,595 25 Average daily oil production (bbls/d)
1,717 1,334 29 1,631 1,307 25
Touchstone Exploration Inc. Q2 2018 Management’s Discussion & Analysis
9
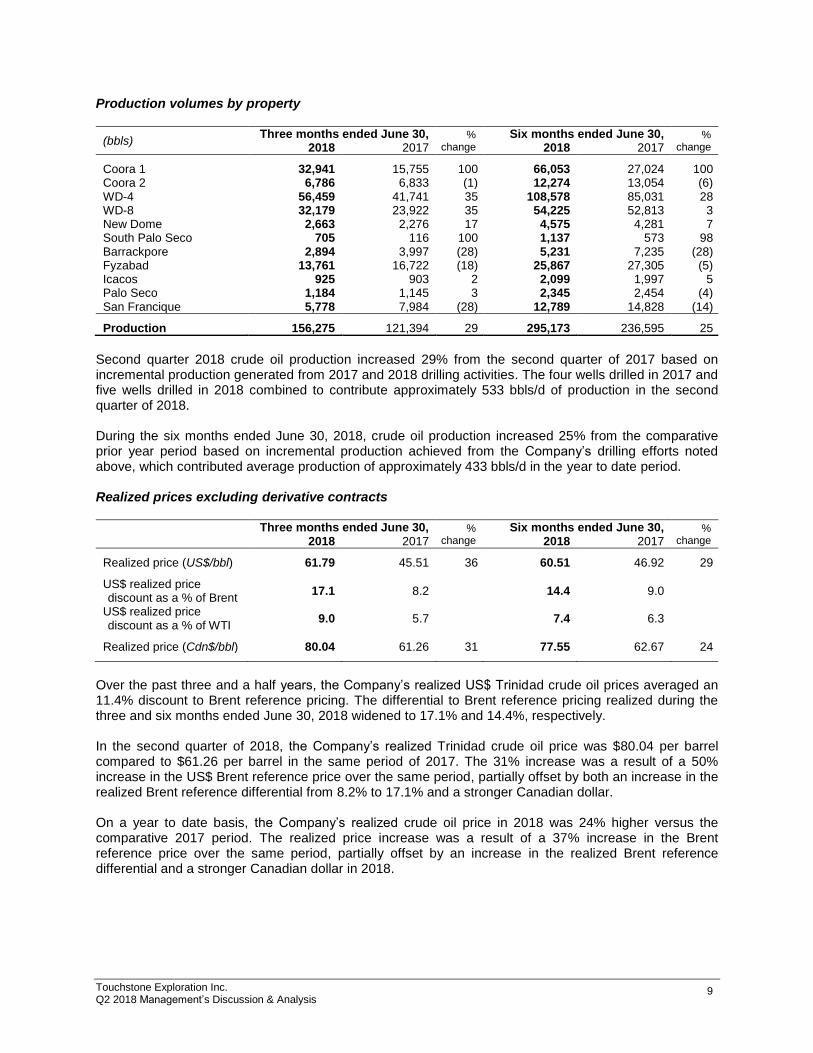
Production volumes by property
(bbls) Three months ended June 30, %
change
Six months ended June 30, % change 2018 2017 2018 2017
Coora 1 32,941 15,755 100 66,053 27,024 100 Coora 2 6,786 6,833 (1) 12,274 13,054 (6) WD-4 56,459 41,741 35 108,578 85,031 28 WD-8 32,179 23,922 35 54,225 52,813 3 New Dome 2,663 2,276 17 4,575 4,281 7 South Palo Seco 705 116 100 1,137 573 98 Barrackpore 2,894 3,997 (28) 5,231 7,235 (28) Fyzabad 13,761 16,722 (18) 25,867 27,305 (5) Icacos 925 903 2 2,099 1,997 5 Palo Seco 1,184 1,145 3 2,345 2,454 (4) San Francique 5,778 7,984 (28) 12,789 14,828 (14)
Production 156,275 121,394 29 295,173 236,595 25
Second quarter 2018 crude oil production increased 29% from the second quarter of 2017 based on incremental production generated from 2017 and 2018 drilling activities. The four wells drilled in 2017 and five wells drilled in 2018 combined to contribute approximately 533 bbls/d of production in the second quarter of 2018. During the six months ended June 30, 2018, crude oil production increased 25% from the comparative prior year period based on incremental production achieved from the Company’s drilling efforts noted above, which contributed average production of approximately 433 bbls/d in the year to date period. Realized prices excluding derivative contracts
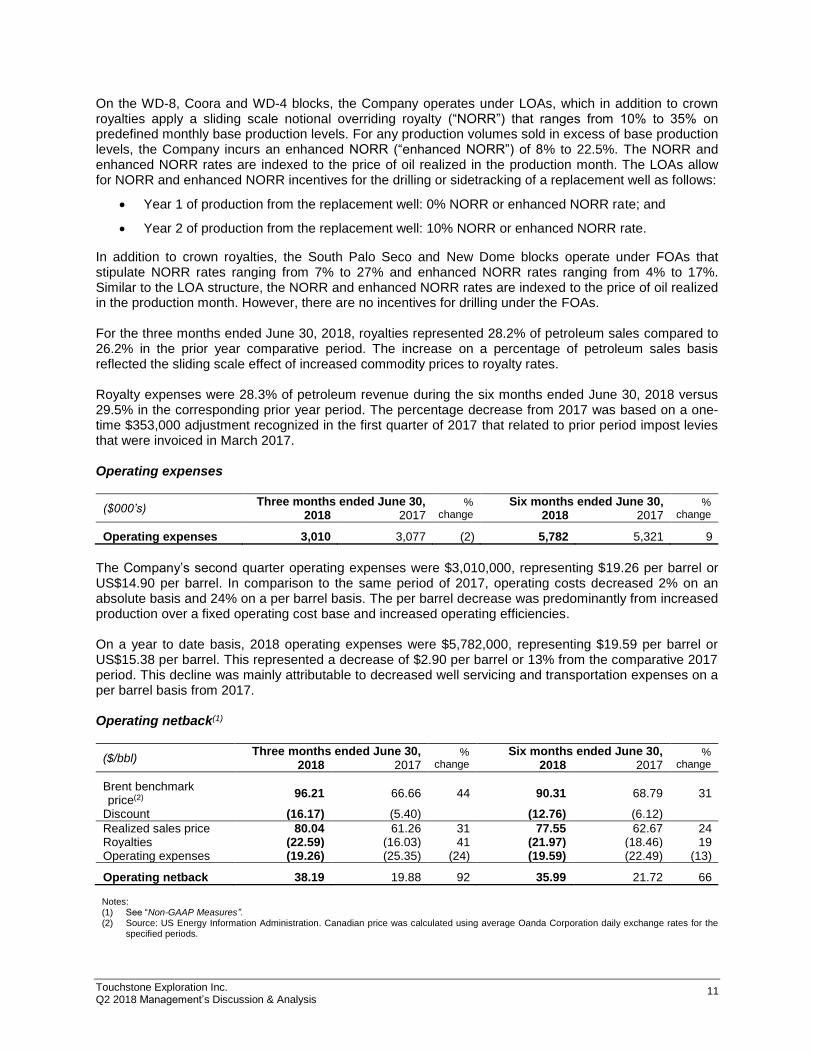
Three months ended June 30, %
change
Six months ended June 30, % change 2018 2017 2018 2017
Realized price (US$/bbl) 61.79 45.51 36 60.51 46.92 29 US$ realized price discount as a % of Brent
17.1 8.2 14.4 9.0
US$ realized price discount as a % of WTI
9.0 5.7 7.4 6.3
Realized price (Cdn$/bbl) 80.04 61.26 31 77.55 62.67 24
Over the past three and a half years, the Company’s realized US$ Trinidad crude oil prices averaged an 11.4% discount to Brent reference pricing. The differential to Brent reference pricing realized during the three and six months ended June 30, 2018 widened to 17.1% and 14.4%, respectively. In the second quarter of 2018, the Company’s realized Trinidad crude oil price was $80.04 per barrel compared to $61.26 per barrel in the same period of 2017. The 31% increase was a result of a 50% increase in the US$ Brent reference price over the same period, partially offset by both an increase in the realized Brent reference differential from 8.2% to 17.1% and a stronger Canadian dollar. On a year to date basis, the Company’s realized crude oil price in 2018 was 24% higher versus the comparative 2017 period. The realized price increase was a result of a 37% increase in the Brent reference price over the same period, partially offset by an increase in the realized Brent reference differential and a stronger Canadian dollar in 2018.
Touchstone Exploration Inc. Q2 2018 Management’s Discussion & Analysis
10
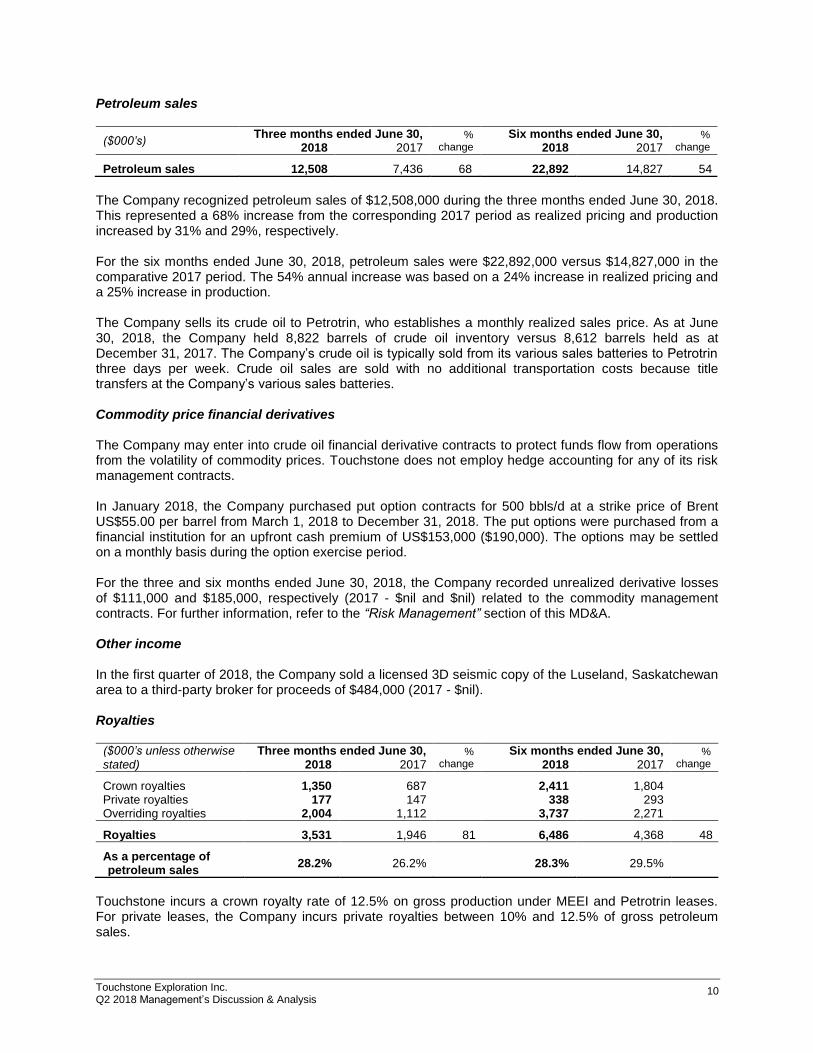
Petroleum sales
($000’s) Three months ended June 30, %
change
Six months ended June 30, % change 2018 2017 2018 2017
Petroleum sales 12,508 7,436 68 22,892 14,827 54
The Company recognized petroleum sales of $12,508,000 during the three months ended June 30, 2018. This represented a 68% increase from the corresponding 2017 period as realized pricing and production increased by 31% and 29%, respectively. For the six months ended June 30, 2018, petroleum sales were $22,892,000 versus $14,827,000 in the comparative 2017 period. The 54% annual increase was based on a 24% increase in realized pricing and a 25% increase in production. The Company sells its crude oil to Petrotrin, who establishes a monthly realized sales price. As at June 30, 2018, the Company held 8,822 barrels of crude oil inventory versus 8,612 barrels held as at December 31, 2017. The Company’s crude oil is typically sold from its various sales batteries to Petrotrin three days per week. Crude oil sales are sold with no additional transportation costs because title transfers at the Company’s various sales batteries. Commodity price financial derivatives The Company may enter into crude oil financial derivative contracts to protect funds flow from operations from the volatility of commodity prices. Touchstone does not employ hedge accounting for any of its risk management contracts. In January 2018, the Company purchased put option contracts for 500 bbls/d at a strike price of Brent US$55.00 per barrel from March 1, 2018 to December 31, 2018. The put options were purchased from a financial institution for an upfront cash premium of US$153,000 ($190,000). The options may be settled on a monthly basis during the option exercise period. For the three and six months ended June 30, 2018, the Company recorded unrealized derivative losses of $111,000 and $185,000, respectively (2017 - $nil and $nil) related to the commodity management contracts. For further information, refer to the “Risk Management” section of this MD&A. Other income In the first quarter of 2018, the Company sold a licensed 3D seismic copy of the Luseland, Saskatchewan area to a third-party broker for proceeds of $484,000 (2017 - $nil). Royalties
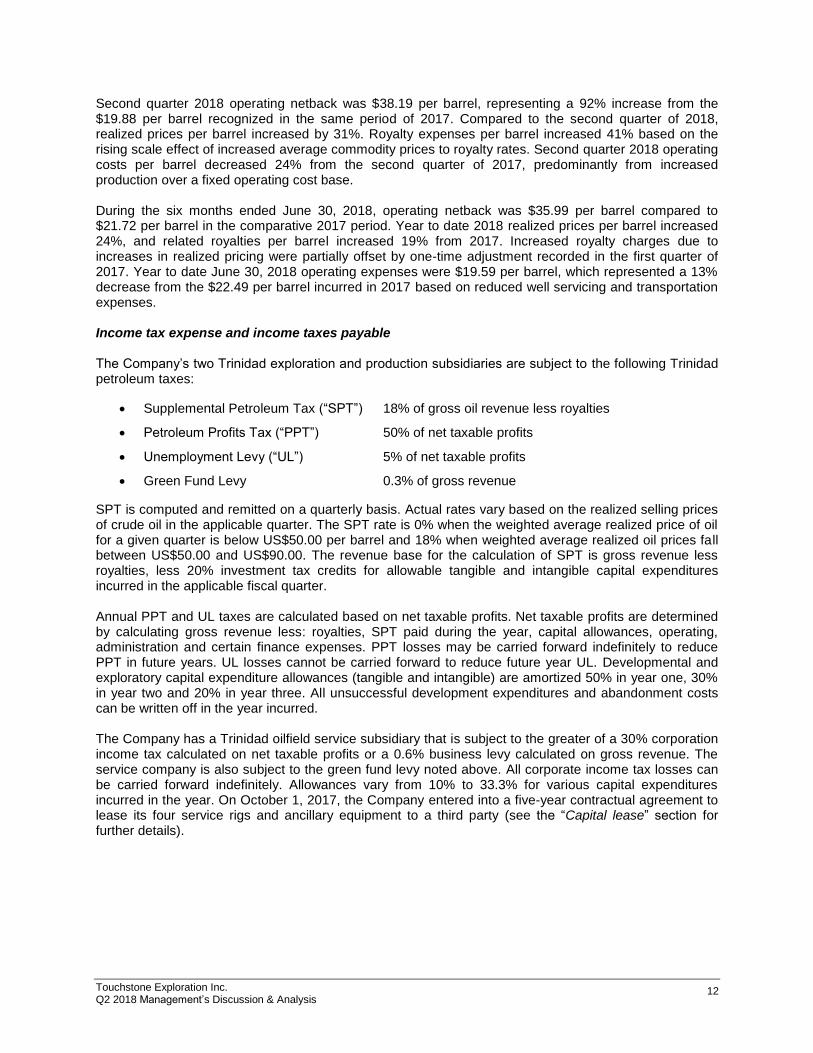
($000’s unless otherwise stated)
Three months ended June 30, % change
Six months ended June 30, % change 2018 2017 2018 2017
Crown royalties 1,350 687 2,411 1,804 Private royalties 177 147 338 293 Overriding royalties 2,004 1,112 3,737 2,271
Royalties 3,531 1,946 81 6,486 4,368 48
As a percentage of petroleum sales
28.2% 26.2% 28.3% 29.5%
Touchstone incurs a crown royalty rate of 12.5% on gross production under MEEI and Petrotrin leases. For private leases, the Company incurs private royalties between 10% and 12.5% of gross petroleum sales.
Touchstone Exploration Inc. Q2 2018 Management’s Discussion & Analysis
11
On the WD-8, Coora and WD-4 blocks, the Company operates under LOAs, which in addition to crown royalties apply a sliding scale notional overriding royalty (“NORR”) that ranges from 10% to 35% on predefined monthly base production levels. For any production volumes sold in excess of base production levels, the Company incurs an enhanced NORR (“enhanced NORR”) of 8% to 22.5%. The NORR and enhanced NORR rates are indexed to the price of oil realized in the production month. The LOAs allow for NORR and enhanced NORR incentives for the drilling or sidetracking of a replacement well as follows:
• Year 1 of production from the replacement well: 0% NORR or enhanced NORR rate; and
• Year 2 of production from the replacement well: 10% NORR or enhanced NORR rate.
In addition to crown royalties, the South Palo Seco and New Dome blocks operate under FOAs that stipulate NORR rates ranging from 7% to 27% and enhanced NORR rates ranging from 4% to 17%. Similar to the LOA structure, the NORR and enhanced NORR rates are indexed to the price of oil realized in the production month. However, there are no incentives for drilling under the FOAs. For the three months ended June 30, 2018, royalties represented 28.2% of petroleum sales compared to 26.2% in the prior year comparative period. The increase on a percentage of petroleum sales basis reflected the sliding scale effect of increased commodity prices to royalty rates. Royalty expenses were 28.3% of petroleum revenue during the six months ended June 30, 2018 versus 29.5% in the corresponding prior year period. The percentage decrease from 2017 was based on a one-time $353,000 adjustment recognized in the first quarter of 2017 that related to prior period impost levies that were invoiced in March 2017. Operating expenses
($000’s) Three months ended June 30, %
change Six months ended June 30, %
change 2018 2017 2018 2017
Operating expenses 3,010 3,077 (2) 5,782 5,321 9
The Company’s second quarter operating expenses were $3,010,000, representing $19.26 per barrel or US$14.90 per barrel. In comparison to the same period of 2017, operating costs decreased 2% on an absolute basis and 24% on a per barrel basis. The per barrel decrease was predominantly from increased production over a fixed operating cost base and increased operating efficiencies. On a year to date basis, 2018 operating expenses were $5,782,000, representing $19.59 per barrel or US$15.38 per barrel. This represented a decrease of $2.90 per barrel or 13% from the comparative 2017 period. This decline was mainly attributable to decreased well servicing and transportation expenses on a per barrel basis from 2017. Operating netback(1)
($/bbl) Three months ended June 30, %
change
Six months ended June 30, % change 2018 2017 2018 2017
Brent benchmark price(2)
96.21 66.66 44 90.31 68.79 31
Discount (16.17) (5.40) (12.76) (6.12)
Realized sales price 80.04 61.26 31 77.55 62.67 24 Royalties (22.59) (16.03) 41 (21.97) (18.46) 19 Operating expenses (19.26) (25.35) (24) (19.59) (22.49) (13)
Operating netback 38.19 19.88 92 35.99 21.72 66 Notes: (1) See “Non-GAAP Measures”.
(2) Source: US Energy Information Administration. Canadian price was calculated using average Oanda Corporation daily exchange rates for the specified periods.
Touchstone Exploration Inc. Q2 2018 Management’s Discussion & Analysis
12
Second quarter 2018 operating netback was $38.19 per barrel, representing a 92% increase from the $19.88 per barrel recognized in the same period of 2017. Compared to the second quarter of 2018, realized prices per barrel increased by 31%. Royalty expenses per barrel increased 41% based on the rising scale effect of increased average commodity prices to royalty rates. Second quarter 2018 operating costs per barrel decreased 24% from the second quarter of 2017, predominantly from increased production over a fixed operating cost base. During the six months ended June 30, 2018, operating netback was $35.99 per barrel compared to $21.72 per barrel in the comparative 2017 period. Year to date 2018 realized prices per barrel increased 24%, and related royalties per barrel increased 19% from 2017. Increased royalty charges due to increases in realized pricing were partially offset by one-time adjustment recorded in the first quarter of 2017. Year to date June 30, 2018 operating expenses were $19.59 per barrel, which represented a 13% decrease from the $22.49 per barrel incurred in 2017 based on reduced well servicing and transportation expenses. Income tax expense and income taxes payable The Company’s two Trinidad exploration and production subsidiaries are subject to the following Trinidad petroleum taxes:
• Supplemental Petroleum Tax (“SPT”) 18% of gross oil revenue less royalties
• Petroleum Profits Tax (“PPT”) 50% of net taxable profits
• Unemployment Levy (“UL”) 5% of net taxable profits
• Green Fund Levy 0.3% of gross revenue
SPT is computed and remitted on a quarterly basis. Actual rates vary based on the realized selling prices of crude oil in the applicable quarter. The SPT rate is 0% when the weighted average realized price of oil for a given quarter is below US$50.00 per barrel and 18% when weighted average realized oil prices fall between US$50.00 and US$90.00. The revenue base for the calculation of SPT is gross revenue less royalties, less 20% investment tax credits for allowable tangible and intangible capital expenditures incurred in the applicable fiscal quarter. Annual PPT and UL taxes are calculated based on net taxable profits. Net taxable profits are determined by calculating gross revenue less: royalties, SPT paid during the year, capital allowances, operating, administration and certain finance expenses. PPT losses may be carried forward indefinitely to reduce PPT in future years. UL losses cannot be carried forward to reduce future year UL. Developmental and exploratory capital expenditure allowances (tangible and intangible) are amortized 50% in year one, 30% in year two and 20% in year three. All unsuccessful development expenditures and abandonment costs can be written off in the year incurred. The Company has a Trinidad oilfield service subsidiary that is subject to the greater of a 30% corporation income tax calculated on net taxable profits or a 0.6% business levy calculated on gross revenue. The service company is also subject to the green fund levy noted above. All corporate income tax losses can be carried forward indefinitely. Allowances vary from 10% to 33.3% for various capital expenditures incurred in the year. On October 1, 2017, the Company entered into a five-year contractual agreement to lease its four service rigs and ancillary equipment to a third party (see the “Capital lease” section for further details).
Touchstone Exploration Inc. Q2 2018 Management’s Discussion & Analysis
13
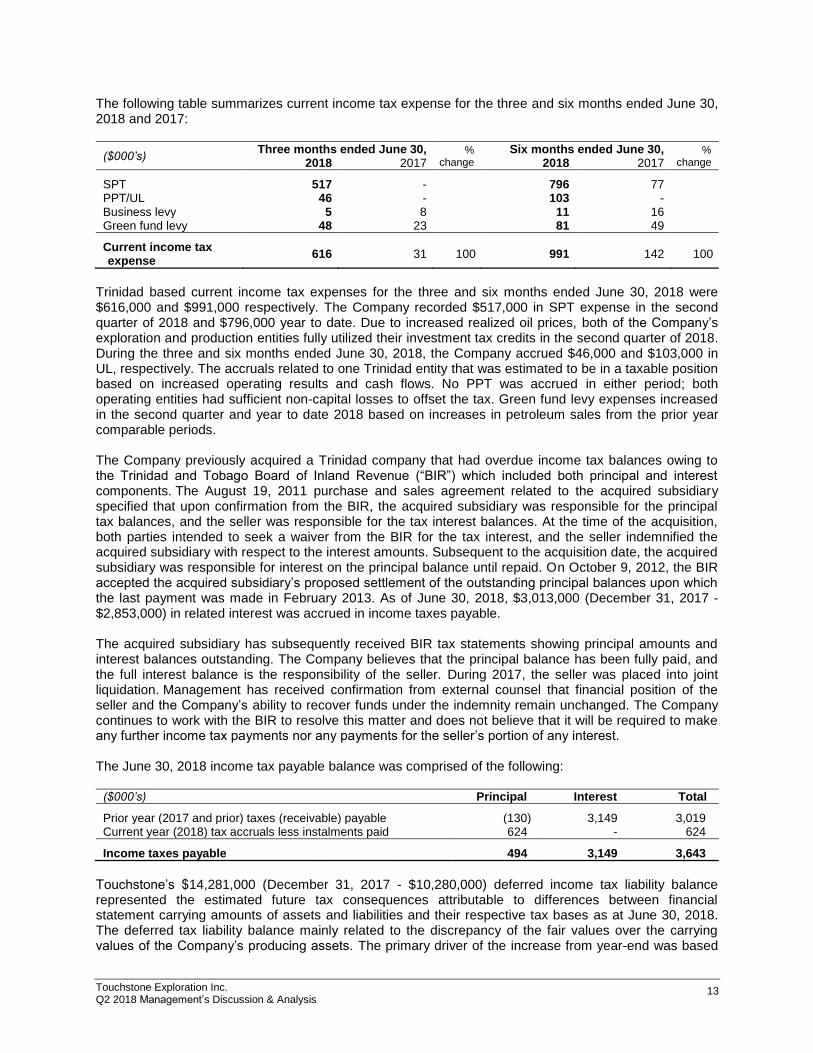
The following table summarizes current income tax expense for the three and six months ended June 30, 2018 and 2017:
($000’s) Three months ended June 30, %
change
Six months ended June 30, % change 2018 2017 2018 2017
SPT 517 - 796 77 PPT/UL 46 - 103 - Business levy 5 8 11 16 Green fund levy 48 23 81 49
Current income tax expense
616 31 100 991 142 100
Trinidad based current income tax expenses for the three and six months ended June 30, 2018 were $616,000 and $991,000 respectively. The Company recorded $517,000 in SPT expense in the second quarter of 2018 and $796,000 year to date. Due to increased realized oil prices, both of the Company’s exploration and production entities fully utilized their investment tax credits in the second quarter of 2018. During the three and six months ended June 30, 2018, the Company accrued $46,000 and $103,000 in UL, respectively. The accruals related to one Trinidad entity that was estimated to be in a taxable position based on increased operating results and cash flows. No PPT was accrued in either period; both operating entities had sufficient non-capital losses to offset the tax. Green fund levy expenses increased in the second quarter and year to date 2018 based on increases in petroleum sales from the prior year comparable periods. The Company previously acquired a Trinidad company that had overdue income tax balances owing to the Trinidad and Tobago Board of Inland Revenue (“BIR”) which included both principal and interest components. The August 19, 2011 purchase and sales agreement related to the acquired subsidiary specified that upon confirmation from the BIR, the acquired subsidiary was responsible for the principal tax balances, and the seller was responsible for the tax interest balances. At the time of the acquisition, both parties intended to seek a waiver from the BIR for the tax interest, and the seller indemnified the acquired subsidiary with respect to the interest amounts. Subsequent to the acquisition date, the acquired subsidiary was responsible for interest on the principal balance until repaid. On October 9, 2012, the BIR accepted the acquired subsidiary’s proposed settlement of the outstanding principal balances upon which the last payment was made in February 2013. As of June 30, 2018, $3,013,000 (December 31, 2017 - $2,853,000) in related interest was accrued in income taxes payable. The acquired subsidiary has subsequently received BIR tax statements showing principal amounts and interest balances outstanding. The Company believes that the principal balance has been fully paid, and the full interest balance is the responsibility of the seller. During 2017, the seller was placed into joint liquidation. Management has received confirmation from external counsel that financial position of the seller and the Company’s ability to recover funds under the indemnity remain unchanged. The Company continues to work with the BIR to resolve this matter and does not believe that it will be required to make any further income tax payments nor any payments for the seller’s portion of any interest. The June 30, 2018 income tax payable balance was comprised of the following:
($000’s) Principal Interest Total
Prior year (2017 and prior) taxes (receivable) payable (130) 3,149 3,019 Current year (2018) tax accruals less instalments paid 624 - 624
Income taxes payable 494 3,149 3,643
Touchstone’s $14,281,000 (December 31, 2017 - $10,280,000) deferred income tax liability balance represented the estimated future tax consequences attributable to differences between financial statement carrying amounts of assets and liabilities and their respective tax bases as at June 30, 2018. The deferred tax liability balance mainly related to the discrepancy of the fair values over the carrying values of the Company’s producing assets. The primary driver of the increase from year-end was based
Touchstone Exploration Inc. Q2 2018 Management’s Discussion & Analysis
14
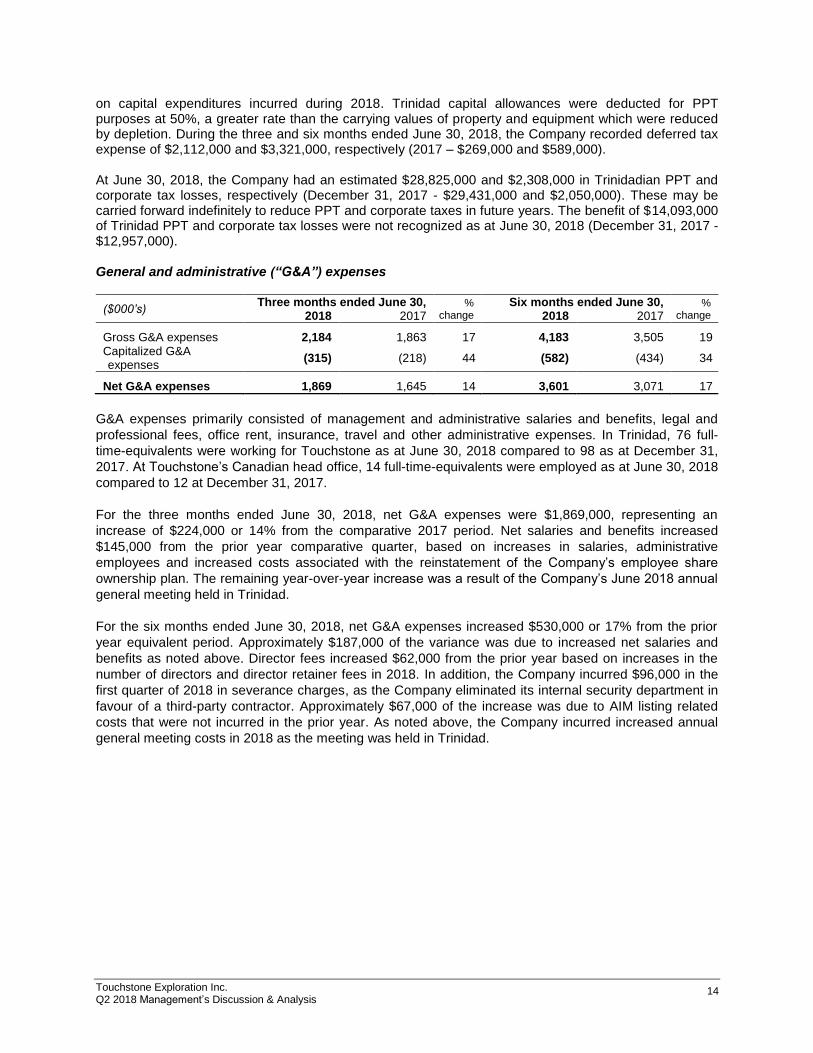
on capital expenditures incurred during 2018. Trinidad capital allowances were deducted for PPT purposes at 50%, a greater rate than the carrying values of property and equipment which were reduced by depletion. During the three and six months ended June 30, 2018, the Company recorded deferred tax expense of $2,112,000 and $3,321,000, respectively (2017 – $269,000 and $589,000). At June 30, 2018, the Company had an estimated $28,825,000 and $2,308,000 in Trinidadian PPT and corporate tax losses, respectively (December 31, 2017 - $29,431,000 and $2,050,000). These may be carried forward indefinitely to reduce PPT and corporate taxes in future years. The benefit of $14,093,000 of Trinidad PPT and corporate tax losses were not recognized as at June 30, 2018 (December 31, 2017 - $12,957,000). General and administrative (“G&A”) expenses
($000’s) Three months ended June 30, %
change
Six months ended June 30, % change 2018 2017 2018 2017
Gross G&A expenses 2,184 1,863 17 4,183 3,505 19 Capitalized G&A expenses
(315) (218) 44 (582) (434) 34
Net G&A expenses 1,869 1,645 14 3,601 3,071 17
G&A expenses primarily consisted of management and administrative salaries and benefits, legal and
professional fees, office rent, insurance, travel and other administrative expenses. In Trinidad, 76 full-
time-equivalents were working for Touchstone as at June 30, 2018 compared to 98 as at December 31,
2017. At Touchstone’s Canadian head office, 14 full-time-equivalents were employed as at June 30, 2018
compared to 12 at December 31, 2017.
For the three months ended June 30, 2018, net G&A expenses were $1,869,000, representing an
increase of $224,000 or 14% from the comparative 2017 period. Net salaries and benefits increased
$145,000 from the prior year comparative quarter, based on increases in salaries, administrative
employees and increased costs associated with the reinstatement of the Company’s employee share
ownership plan. The remaining year-over-year increase was a result of the Company’s June 2018 annual
general meeting held in Trinidad.
For the six months ended June 30, 2018, net G&A expenses increased $530,000 or 17% from the prior
year equivalent period. Approximately $187,000 of the variance was due to increased net salaries and
benefits as noted above. Director fees increased $62,000 from the prior year based on increases in the
number of directors and director retainer fees in 2018. In addition, the Company incurred $96,000 in the
first quarter of 2018 in severance charges, as the Company eliminated its internal security department in
favour of a third-party contractor. Approximately $67,000 of the increase was due to AIM listing related
costs that were not incurred in the prior year. As noted above, the Company incurred increased annual
general meeting costs in 2018 as the meeting was held in Trinidad.

Touchstone Exploration Inc. Q2 2018 Management’s Discussion & Analysis
15
Net finance expenses
($000’s) Three months ended June 30, %
change
Six months ended June 30, % change 2018 2017 2018 2017
Interest income (60) (17) (115) (34) Interest expense on term loan
299 299 595 595
Term loan revaluation gain
(283) - (283) -
Production payment liability revaluation loss
250 - 409 -
Interest expense on taxes / other
5 108 5 601
Net finance expenses 211 390 (46) 611 1,162 (47)
Interest income included interest earned from funds on deposit and interest generated from a finance lease (see “Capital Expenditures and Dispositions Resources – Capital lease”). The term loan revaluation gain represents the impact of the revaluation of the Company’s term loan that was extended by one-year in June 2018. The production payment liability revaluation loss was a result of the increased production payment liability estimated by the Company as at June 30, 2018. The estimate liability increased based on a corresponding one-year extension of the obligation and changes in internally forecasted production and forward commodity pricing (see “Liquidity and Capital Resources - Term loan”). In 2017, interest expenses on income taxes were accrued for outstanding value added tax balances owed as a result of intercompany transactions. The outstanding principal balances were fully paid in the second quarter of 2017 and incurred no further interest charges upon settlement. Foreign exchange and foreign currency translation The Company’s presentation currency is the Canadian dollar. The Company and its Canadian subsidiaries have a Canadian dollar functional currency while its Trinidadian subsidiaries each has a Trinidad and Tobago dollar functional currency. Touchstone Exploration (Barbados) Ltd., a wholly-owned holding subsidiary of the Company, has a United States dollar functional currency. In each reporting period, the change in values of the US$ and TT$ relative to the Canadian dollar reporting currency are recognized. The applicable rates used to translate the Company’s TT$ and US$ denominated items were as follows:
Three months ended June 30, % change
Six months ended June 30, % change 2018 2017 2018 2017
Average foreign exchange rates(1) Cdn$:US$ 0.77 0.74 4 0.78 0.75 5 Cdn$:TT$ 5.21 5.00 4 5.27 5.03 5 US$:TT$ 6.72 6.73 - 6.73 6.73 -
June 30,
2018 December 31,
2017 %
change
Closing foreign exchange rates(2) Cdn$:US$ 0.76 0.80 (4) Cdn$:TT$ 5.10 5.39 (5) US$:TT$ 6.71 6.77 (1)
Notes: (1) Source: Oanda Corporation average daily exchange rates for the specified periods. (2) Source: Oanda Corporation daily exchange rates for the specified date.
Touchstone Exploration Inc. Q2 2018 Management’s Discussion & Analysis
16
The income and expenses of the Company’s Trinidad operations are translated to Canadian dollars at the average monthly exchange rates relative to the date of the transactions. Specifically, the Company’s revenues are subject to foreign exchange exposure as the sales prices of crude oil are determined by reference to US$ denominated benchmark prices. An increase in the value of the Canadian dollar compared with the US$ has a negative impact on the Company’s reported results. Likewise, as the Canadian dollar weakens, the Company’s reported results are higher. The Company’s foreign currency risk also relates to working capital balances denominated in US$ and UK pounds sterling. During the three and six months ended June 30, 2018, the Canadian dollar depreciated relative to both the US$ and TT$. In the first quarter of 2018, the Canadian dollar depreciated relative to the UK pound and appreciated relative to the UK pound in the second quarter of 2018. The volatility in foreign exchange rates created a $24,000 loss in the second quarter of 2018 and a $317,000 gain during the six months ended June 30, 2018 (2017 – losses of $155,000 and $235,000). The majority of the translation differences were unrealized in nature and may be reversed in the future as a result of fluctuations in prevailing exchange rates. The assets and liabilities of the Company’s subsidiaries are translated to Canadian dollars at the exchange rate on the reporting period date for presentation purposes. All resulting foreign currency differences are recorded in other comprehensive income in the Company’s consolidated statements of comprehensive income (loss). As at June 30, 2018 compared to December 31, 2017, the Canadian dollar was 4% and 5% weaker relative to the US$ and TT$, respectively. As a result, foreign currency translation gains of $1,083,000 and $2,526,000 were recorded during the three and six months ended June 30, 2018, respectively (2017 – losses of $904,000 and $1,171,000). Share-based compensation The Company has a share option plan pursuant to which options to purchase common shares of the Company may be granted by the Board of Directors to directors, officers, employees and consultants of the Company. The exercise price of each option may not be less than the closing price of the common shares prior to the date of grant. Compensation expense is recognized as the options vest. Unless otherwise determined by the Board of Directors, vesting typically occurs one third on each of the next three anniversaries of the date of the grant as recipients render continuous service to the Company, and the share options typically expire five years from the date of the grant. On April 5, 2018, the Company awarded 1,018,800 share options to officers and employees at an exercise price of $0.22 per option. On June 13, 2018, the Company granted a further 670,000 share options to directors and employees at an exercise price of $0.25 per option. Under both grants, the share options have a five-year term and vest one third on each of the next three anniversaries of the grant date. The Company also has an incentive share option plan which provides for the grant of incentive share options to purchase common shares of the Company at a $0.05 exercise price. A maximum of one million common shares have been approved for issuance under this plan. Unless otherwise determined by the Board of Directors, vesting typically occurs one third on each of the next three anniversaries of the date of the grant, and the incentive share options typically expire five years from the date of the grant. The maximum number of common shares issuable on the exercise of outstanding share options and incentive share options at any time is limited to 10% of the issued and outstanding Company common shares. At June 30, 2018, share options and incentive share options outstanding represented 6.6% of the Company’s outstanding common shares (December 31, 2017 – 5.3%). During the three and six months ended June 30, 2018, the Company recorded share-based compensation expenses of $40,000 and $74,000, respectively (2017 - $44,000 and $100,000).
Touchstone Exploration Inc. Q2 2018 Management’s Discussion & Analysis
17
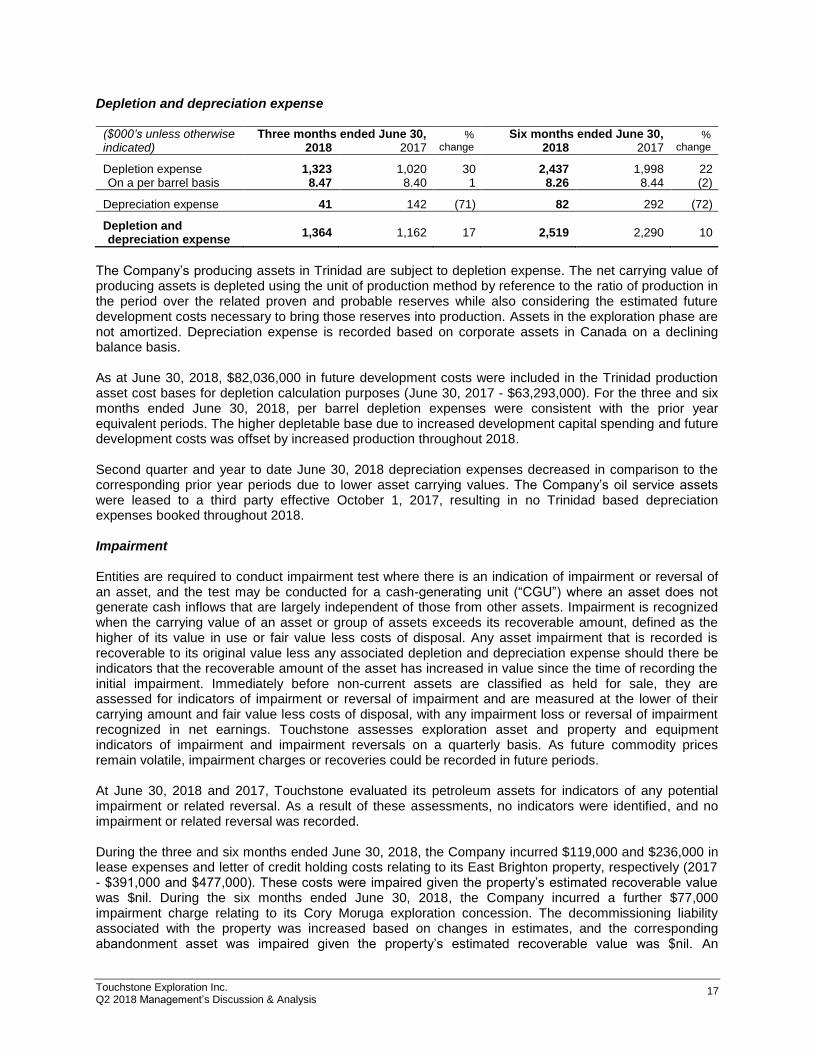
Depletion and depreciation expense
($000’s unless otherwise indicated)
Three months ended June 30, % change
Six months ended June 30, % change 2018 2017 2018 2017
Depletion expense 1,323 1,020 30 2,437 1,998 22 On a per barrel basis 8.47 8.40 1 8.26 8.44 (2)
Depreciation expense 41 142 (71) 82 292 (72)
Depletion and depreciation expense
1,364 1,162 17 2,519 2,290 10
The Company’s producing assets in Trinidad are subject to depletion expense. The net carrying value of producing assets is depleted using the unit of production method by reference to the ratio of production in the period over the related proven and probable reserves while also considering the estimated future development costs necessary to bring those reserves into production. Assets in the exploration phase are not amortized. Depreciation expense is recorded based on corporate assets in Canada on a declining balance basis. As at June 30, 2018, $82,036,000 in future development costs were included in the Trinidad production asset cost bases for depletion calculation purposes (June 30, 2017 - $63,293,000). For the three and six months ended June 30, 2018, per barrel depletion expenses were consistent with the prior year equivalent periods. The higher depletable base due to increased development capital spending and future development costs was offset by increased production throughout 2018. Second quarter and year to date June 30, 2018 depreciation expenses decreased in comparison to the corresponding prior year periods due to lower asset carrying values. The Company’s oil service assets were leased to a third party effective October 1, 2017, resulting in no Trinidad based depreciation expenses booked throughout 2018. Impairment Entities are required to conduct impairment test where there is an indication of impairment or reversal of an asset, and the test may be conducted for a cash-generating unit (“CGU”) where an asset does not generate cash inflows that are largely independent of those from other assets. Impairment is recognized when the carrying value of an asset or group of assets exceeds its recoverable amount, defined as the higher of its value in use or fair value less costs of disposal. Any asset impairment that is recorded is recoverable to its original value less any associated depletion and depreciation expense should there be indicators that the recoverable amount of the asset has increased in value since the time of recording the initial impairment. Immediately before non-current assets are classified as held for sale, they are assessed for indicators of impairment or reversal of impairment and are measured at the lower of their carrying amount and fair value less costs of disposal, with any impairment loss or reversal of impairment recognized in net earnings. Touchstone assesses exploration asset and property and equipment indicators of impairment and impairment reversals on a quarterly basis. As future commodity prices remain volatile, impairment charges or recoveries could be recorded in future periods. At June 30, 2018 and 2017, Touchstone evaluated its petroleum assets for indicators of any potential impairment or related reversal. As a result of these assessments, no indicators were identified, and no impairment or related reversal was recorded. During the three and six months ended June 30, 2018, the Company incurred $119,000 and $236,000 in lease expenses and letter of credit holding costs relating to its East Brighton property, respectively (2017 - $391,000 and $477,000). These costs were impaired given the property’s estimated recoverable value was $nil. During the six months ended June 30, 2018, the Company incurred a further $77,000 impairment charge relating to its Cory Moruga exploration concession. The decommissioning liability associated with the property was increased based on changes in estimates, and the corresponding abandonment asset was impaired given the property’s estimated recoverable value was $nil. An
Touchstone Exploration Inc. Q2 2018 Management’s Discussion & Analysis
18
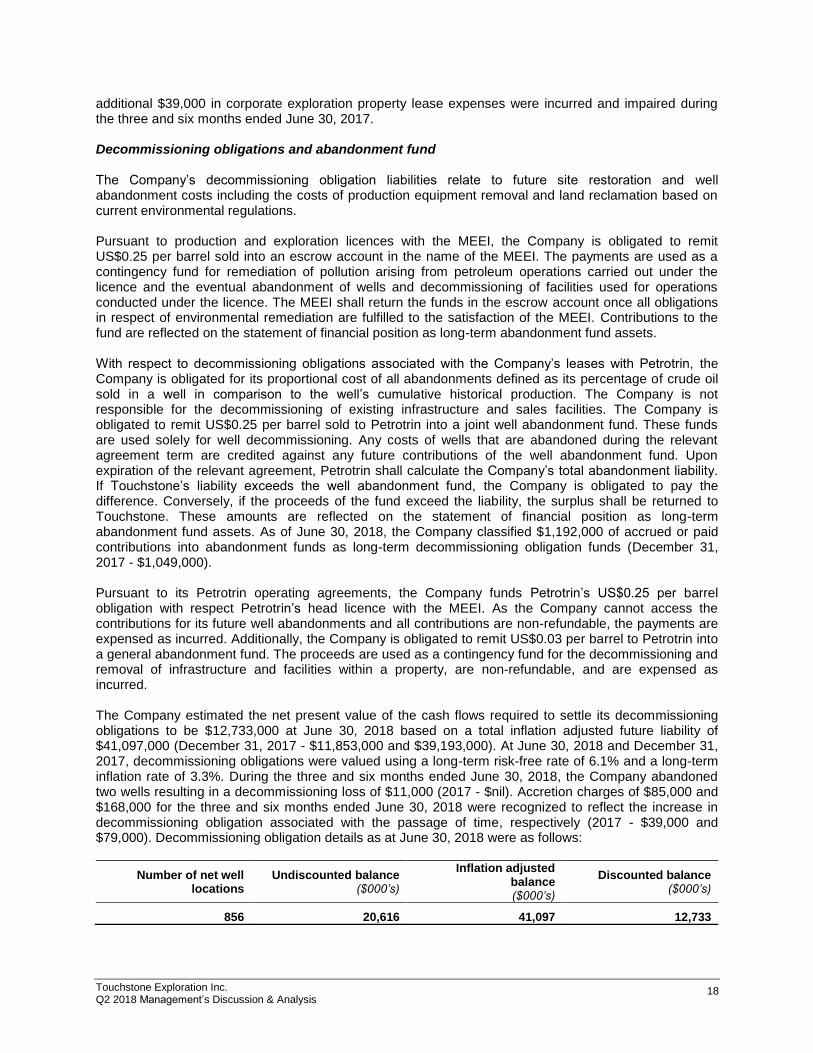
additional $39,000 in corporate exploration property lease expenses were incurred and impaired during the three and six months ended June 30, 2017. Decommissioning obligations and abandonment fund The Company’s decommissioning obligation liabilities relate to future site restoration and well abandonment costs including the costs of production equipment removal and land reclamation based on current environmental regulations. Pursuant to production and exploration licences with the MEEI, the Company is obligated to remit US$0.25 per barrel sold into an escrow account in the name of the MEEI. The payments are used as a contingency fund for remediation of pollution arising from petroleum operations carried out under the licence and the eventual abandonment of wells and decommissioning of facilities used for operations conducted under the licence. The MEEI shall return the funds in the escrow account once all obligations in respect of environmental remediation are fulfilled to the satisfaction of the MEEI. Contributions to the fund are reflected on the statement of financial position as long-term abandonment fund assets. With respect to decommissioning obligations associated with the Company’s leases with Petrotrin, the Company is obligated for its proportional cost of all abandonments defined as its percentage of crude oil sold in a well in comparison to the well’s cumulative historical production. The Company is not responsible for the decommissioning of existing infrastructure and sales facilities. The Company is obligated to remit US$0.25 per barrel sold to Petrotrin into a joint well abandonment fund. These funds are used solely for well decommissioning. Any costs of wells that are abandoned during the relevant agreement term are credited against any future contributions of the well abandonment fund. Upon expiration of the relevant agreement, Petrotrin shall calculate the Company’s total abandonment liability. If Touchstone’s liability exceeds the well abandonment fund, the Company is obligated to pay the difference. Conversely, if the proceeds of the fund exceed the liability, the surplus shall be returned to Touchstone. These amounts are reflected on the statement of financial position as long-term abandonment fund assets. As of June 30, 2018, the Company classified $1,192,000 of accrued or paid contributions into abandonment funds as long-term decommissioning obligation funds (December 31, 2017 - $1,049,000). Pursuant to its Petrotrin operating agreements, the Company funds Petrotrin’s US$0.25 per barrel obligation with respect Petrotrin’s head licence with the MEEI. As the Company cannot access the contributions for its future well abandonments and all contributions are non-refundable, the payments are expensed as incurred. Additionally, the Company is obligated to remit US$0.03 per barrel to Petrotrin into a general abandonment fund. The proceeds are used as a contingency fund for the decommissioning and removal of infrastructure and facilities within a property, are non-refundable, and are expensed as incurred. The Company estimated the net present value of the cash flows required to settle its decommissioning obligations to be $12,733,000 at June 30, 2018 based on a total inflation adjusted future liability of $41,097,000 (December 31, 2017 - $11,853,000 and $39,193,000). At June 30, 2018 and December 31, 2017, decommissioning obligations were valued using a long-term risk-free rate of 6.1% and a long-term inflation rate of 3.3%. During the three and six months ended June 30, 2018, the Company abandoned two wells resulting in a decommissioning loss of $11,000 (2017 - $nil). Accretion charges of $85,000 and $168,000 for the three and six months ended June 30, 2018 were recognized to reflect the increase in decommissioning obligation associated with the passage of time, respectively (2017 - $39,000 and $79,000). Decommissioning obligation details as at June 30, 2018 were as follows:
Number of net well locations
Undiscounted balance ($000’s)
Inflation adjusted balance ($000’s)
Discounted balance ($000’s)
856 20,616 41,097 12,733
Touchstone Exploration Inc. Q2 2018 Management’s Discussion & Analysis
19
Environmental stewardship is a core value at Touchstone, and abandonment and reclamation activities are made in a prudent, responsible manner with the oversight of the Board. Decommissioning liabilities are considered critical accounting estimates. There are significant uncertainties related to decommissioning expenditures, and the impact on the consolidated financial statements could be material. The eventual timing of and costs for these expenditures could differ from current estimates. Further information regarding decommissioning liabilities for the three months ended June 30, 2018 is included in Note 7 “Decommissioning Obligations and Abandonment Fund” to the Company’s June 30, 2018 unaudited interim consolidated financial statements. Capital Expenditures and Dispositions
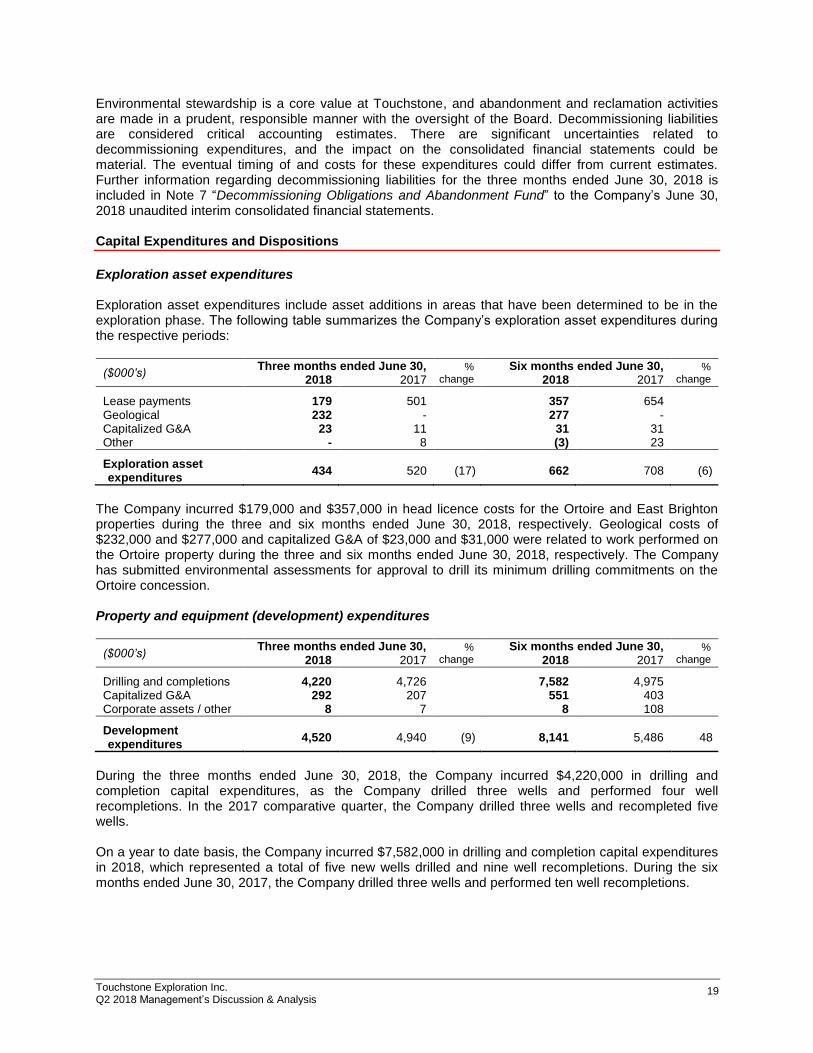
Exploration asset expenditures Exploration asset expenditures include asset additions in areas that have been determined to be in the exploration phase. The following table summarizes the Company’s exploration asset expenditures during the respective periods:
($000’s) Three months ended June 30, %
change
Six months ended June 30, % change 2018 2017 2018 2017
Lease payments 179 501 357 654 Geological 232 - 277 - Capitalized G&A 23 11 31 31 Other - 8 (3) 23
Exploration asset expenditures
434 520 (17) 662 708 (6)
The Company incurred $179,000 and $357,000 in head licence costs for the Ortoire and East Brighton properties during the three and six months ended June 30, 2018, respectively. Geological costs of $232,000 and $277,000 and capitalized G&A of $23,000 and $31,000 were related to work performed on the Ortoire property during the three and six months ended June 30, 2018, respectively. The Company has submitted environmental assessments for approval to drill its minimum drilling commitments on the Ortoire concession. Property and equipment (development) expenditures
($000’s) Three months ended June 30, %
change
Six months ended June 30, % change 2018 2017 2018 2017
Drilling and completions 4,220 4,726 7,582 4,975 Capitalized G&A 292 207 551 403 Corporate assets / other 8 7 8 108
Development expenditures
4,520 4,940 (9) 8,141 5,486 48
During the three months ended June 30, 2018, the Company incurred $4,220,000 in drilling and completion capital expenditures, as the Company drilled three wells and performed four well recompletions. In the 2017 comparative quarter, the Company drilled three wells and recompleted five wells. On a year to date basis, the Company incurred $7,582,000 in drilling and completion capital expenditures in 2018, which represented a total of five new wells drilled and nine well recompletions. During the six months ended June 30, 2017, the Company drilled three wells and performed ten well recompletions.
Touchstone Exploration Inc. Q2 2018 Management’s Discussion & Analysis
20
Property disposition On June 21, 2018 the Company entered an agreement to dispose of its 50% operating working interest in the Icacos property to the current third-party partner for minimum consideration of US$500,000. The consideration will be paid based on the Company’s working interest net revenue it would have received had it retained such interest through December 2021. Should these cumulative payments not exceed the minimum consideration, the Company will receive the difference prior to the end of February 2021. The Company shall retain all cumulative payments should such payments exceed the US$500,000 minimum consideration through December 31, 2021. The agreement was effective April 1, 2018 and remains subject to local regulatory approvals. At June 30, 2018, the Company reclassified the $187,000 net carrying value of the related assets from property and equipment to assets held for sale. In addition, $82,000 of associated decommissioning obligations were classified as liabilities held for sale as at June 30, 2018. Capital lease The Company entered into a five-year, US$1,836,000 contractual agreement to lease its four service rigs and ancillary equipment to a third party on October 1, 2017. The lease arrangement also included the Company’s coil tubing unit that was previously leased to the same party on May 1, 2015. The lease bears a fixed interest rate of 8% per annum, compounded and payable monthly. Principal payments commenced in January 2018, and the Company continues to hold title to the assets until all principal and associated interest payments have been collected. The lease arrangement was accounted for as a finance lease, as substantially all of the risks and rewards of ownership are held by the lessee. The Company’s finance lease receivable was $2,354,000, of which $1,842,000 was classified as long-term other assets as of June 30, 2018 (December 31, 2017 - $2,308,000 and $1,817,000, respectively). Liquidity and Capital Resources
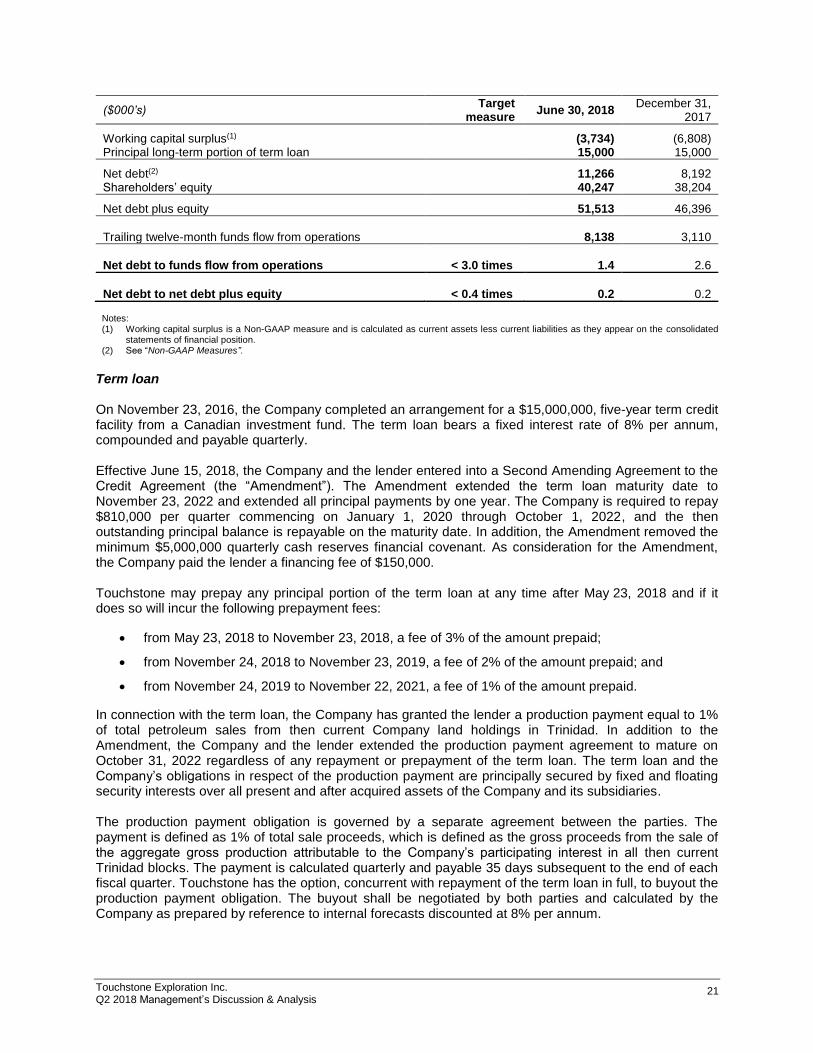
Touchstone exited the quarter with cash of $10,556,000, a working capital surplus of $3,734,000, and a $15,000,000 principal term loan balance. Touchstone’s long-term goal is to fund current period capital expenditures and reclamation expenditures using only funds from operations. Stewardship of the Company’s capital structure is managed through its financial and operating forecast process. The forecast of the Company’s future cash flows is based on estimates of production, crude oil prices, capital expenditures, royalty expenses, operating expenses, general and administrative expenses and other investing and financing activities. The forecast is regularly updated based on changes in commodity prices, capital expenditures, production expectations and other factors that in the Company’s view would impact cash flow. The Company’s objective is to maintain net debt to trailing twelve-month funds flow from operations at or below a level of 3.0 to 1. While the Company may exceed this ratio from time to time, efforts are made after a period of variation to bring the measure back in line. The Company also monitors its capital management through the net debt to net debt plus equity ratio. The Company’s strategy is to utilize more equity than debt, thereby targeting net debt to net debt plus shareholders’ equity at a ratio of less than 0.4 to 1.
Touchstone Exploration Inc. Q2 2018 Management’s Discussion & Analysis
21
($000’s) Target
measure June 30, 2018
December 31, 2017
Working capital surplus(1) (3,734) (6,808) Principal long-term portion of term loan 15,000 15,000
Net debt(2) 11,266 8,192 Shareholders’ equity 40,247 38,204
Net debt plus equity 51,513 46,396
Trailing twelve-month funds flow from operations 8,138 3,110
Net debt to funds flow from operations < 3.0 times 1.4 2.6
Net debt to net debt plus equity < 0.4 times 0.2 0.2 Notes: (1) Working capital surplus is a Non-GAAP measure and is calculated as current assets less current liabilities as they appear on the consolidated
statements of financial position. (2) See “Non-GAAP Measures”.
Term loan On November 23, 2016, the Company completed an arrangement for a $15,000,000, five-year term credit facility from a Canadian investment fund. The term loan bears a fixed interest rate of 8% per annum, compounded and payable quarterly. Effective June 15, 2018, the Company and the lender entered into a Second Amending Agreement to the Credit Agreement (the “Amendment”). The Amendment extended the term loan maturity date to November 23, 2022 and extended all principal payments by one year. The Company is required to repay $810,000 per quarter commencing on January 1, 2020 through October 1, 2022, and the then outstanding principal balance is repayable on the maturity date. In addition, the Amendment removed the minimum $5,000,000 quarterly cash reserves financial covenant. As consideration for the Amendment, the Company paid the lender a financing fee of $150,000. Touchstone may prepay any principal portion of the term loan at any time after May 23, 2018 and if it does so will incur the following prepayment fees:
• from May 23, 2018 to November 23, 2018, a fee of 3% of the amount prepaid;
• from November 24, 2018 to November 23, 2019, a fee of 2% of the amount prepaid; and
• from November 24, 2019 to November 22, 2021, a fee of 1% of the amount prepaid.
In connection with the term loan, the Company has granted the lender a production payment equal to 1% of total petroleum sales from then current Company land holdings in Trinidad. In addition to the Amendment, the Company and the lender extended the production payment agreement to mature on October 31, 2022 regardless of any repayment or prepayment of the term loan. The term loan and the Company’s obligations in respect of the production payment are principally secured by fixed and floating security interests over all present and after acquired assets of the Company and its subsidiaries. The production payment obligation is governed by a separate agreement between the parties. The payment is defined as 1% of total sale proceeds, which is defined as the gross proceeds from the sale of the aggregate gross production attributable to the Company’s participating interest in all then current Trinidad blocks. The payment is calculated quarterly and payable 35 days subsequent to the end of each fiscal quarter. Touchstone has the option, concurrent with repayment of the term loan in full, to buyout the production payment obligation. The buyout shall be negotiated by both parties and calculated by the Company as prepared by reference to internal forecasts discounted at 8% per annum.
Touchstone Exploration Inc. Q2 2018 Management’s Discussion & Analysis
22
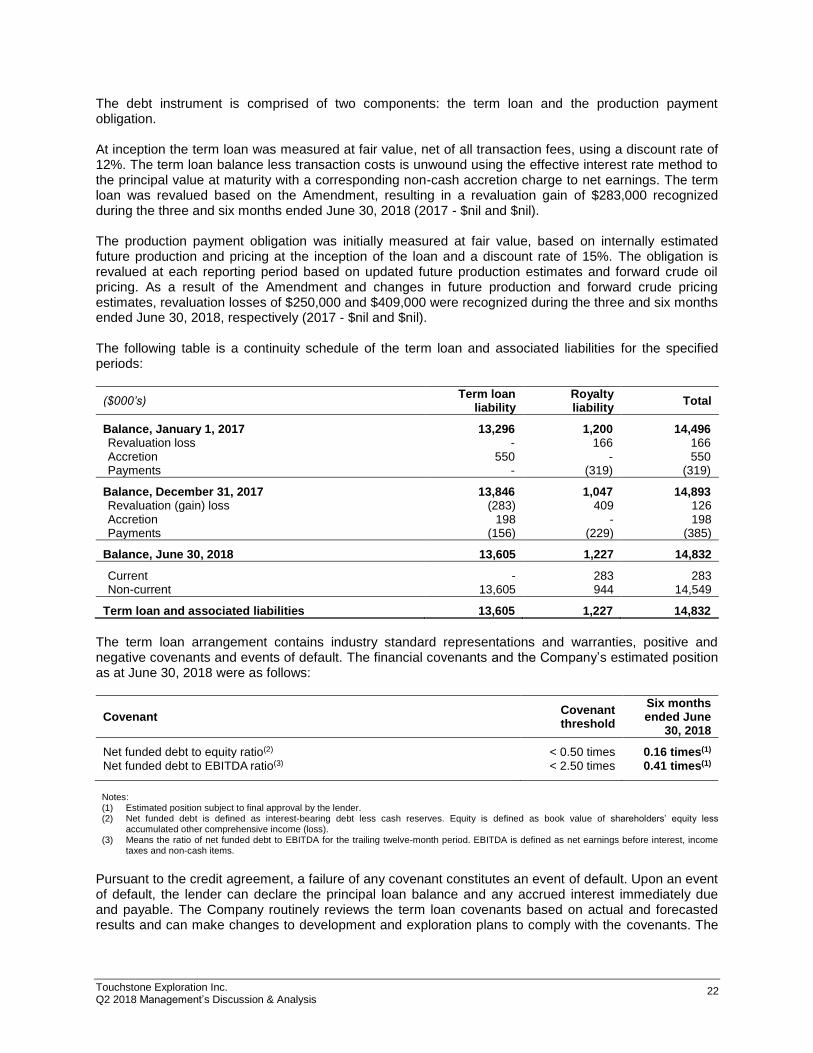
The debt instrument is comprised of two components: the term loan and the production payment obligation.
At inception the term loan was measured at fair value, net of all transaction fees, using a discount rate of 12%. The term loan balance less transaction costs is unwound using the effective interest rate method to the principal value at maturity with a corresponding non-cash accretion charge to net earnings. The term loan was revalued based on the Amendment, resulting in a revaluation gain of $283,000 recognized during the three and six months ended June 30, 2018 (2017 - $nil and $nil).
The production payment obligation was initially measured at fair value, based on internally estimated future production and pricing at the inception of the loan and a discount rate of 15%. The obligation is revalued at each reporting period based on updated future production estimates and forward crude oil pricing. As a result of the Amendment and changes in future production and forward crude pricing estimates, revaluation losses of $250,000 and $409,000 were recognized during the three and six months ended June 30, 2018, respectively (2017 - $nil and $nil). The following table is a continuity schedule of the term loan and associated liabilities for the specified periods:
($000’s) Term loan
liability Royalty liability
Total
Balance, January 1, 2017 13,296 1,200 14,496 Revaluation loss - 166 166 Accretion 550 - 550 Payments - (319) (319)
Balance, December 31, 2017 13,846 1,047 14,893 Revaluation (gain) loss (283) 409 126 Accretion 198 - 198 Payments (156) (229) (385)
Balance, June 30, 2018 13,605 1,227 14,832
Current - 283 283 Non-current 13,605 944 14,549
Term loan and associated liabilities 13,605 1,227 14,832
The term loan arrangement contains industry standard representations and warranties, positive and negative covenants and events of default. The financial covenants and the Company’s estimated position as at June 30, 2018 were as follows:
Covenant Covenant threshold
Six months ended June
30, 2018
Net funded debt to equity ratio(2) < 0.50 times 0.16 times(1) Net funded debt to EBITDA ratio(3) < 2.50 times 0.41 times(1) Notes: (1) Estimated position subject to final approval by the lender. (2) Net funded debt is defined as interest-bearing debt less cash reserves. Equity is defined as book value of shareholders’ equity less
accumulated other comprehensive income (loss). (3) Means the ratio of net funded debt to EBITDA for the trailing twelve-month period. EBITDA is defined as net earnings before interest, income
taxes and non-cash items.
Pursuant to the credit agreement, a failure of any covenant constitutes an event of default. Upon an event of default, the lender can declare the principal loan balance and any accrued interest immediately due and payable. The Company routinely reviews the term loan covenants based on actual and forecasted results and can make changes to development and exploration plans to comply with the covenants. The
Touchstone Exploration Inc. Q2 2018 Management’s Discussion & Analysis
23
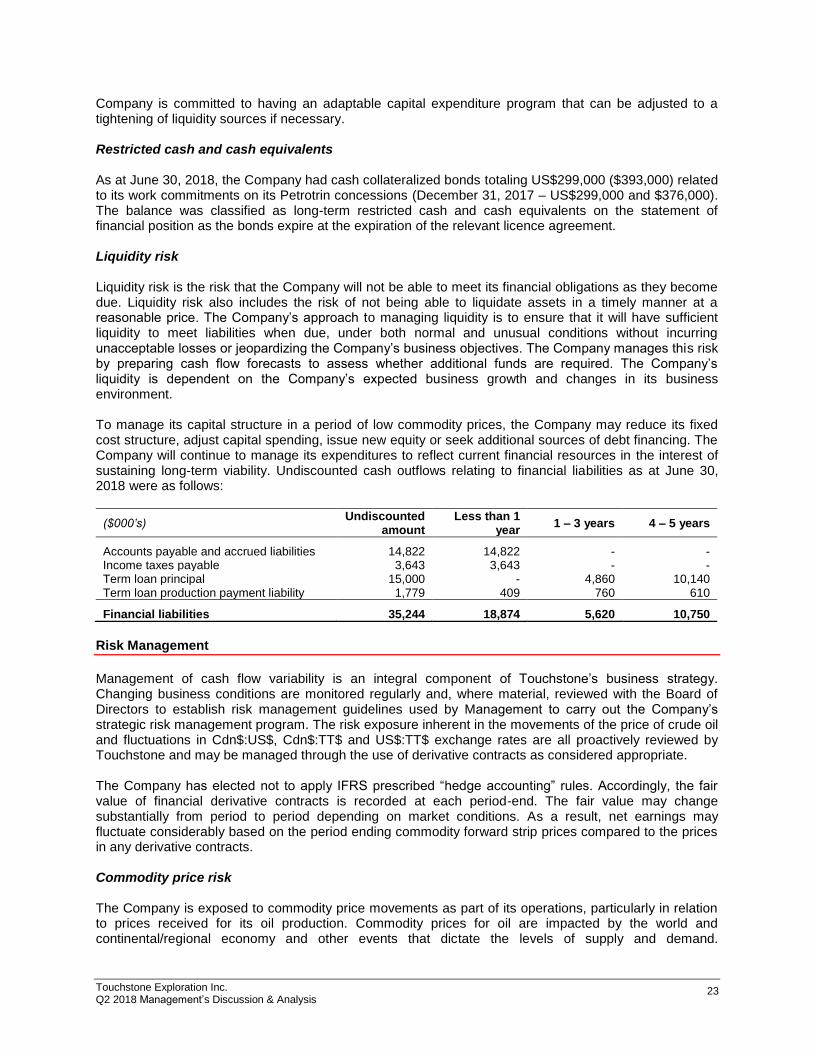
Company is committed to having an adaptable capital expenditure program that can be adjusted to a tightening of liquidity sources if necessary. Restricted cash and cash equivalents As at June 30, 2018, the Company had cash collateralized bonds totaling US$299,000 ($393,000) related to its work commitments on its Petrotrin concessions (December 31, 2017 – US$299,000 and $376,000). The balance was classified as long-term restricted cash and cash equivalents on the statement of financial position as the bonds expire at the expiration of the relevant licence agreement. Liquidity risk Liquidity risk is the risk that the Company will not be able to meet its financial obligations as they become due. Liquidity risk also includes the risk of not being able to liquidate assets in a timely manner at a reasonable price. The Company’s approach to managing liquidity is to ensure that it will have sufficient liquidity to meet liabilities when due, under both normal and unusual conditions without incurring unacceptable losses or jeopardizing the Company’s business objectives. The Company manages this risk by preparing cash flow forecasts to assess whether additional funds are required. The Company’s liquidity is dependent on the Company’s expected business growth and changes in its business environment. To manage its capital structure in a period of low commodity prices, the Company may reduce its fixed cost structure, adjust capital spending, issue new equity or seek additional sources of debt financing. The Company will continue to manage its expenditures to reflect current financial resources in the interest of sustaining long-term viability. Undiscounted cash outflows relating to financial liabilities as at June 30, 2018 were as follows:
($000’s) Undiscounted
amount Less than 1
year 1 – 3 years 4 – 5 years
Accounts payable and accrued liabilities 14,822 14,822 - - Income taxes payable 3,643 3,643 - - Term loan principal 15,000 - 4,860 10,140 Term loan production payment liability 1,779 409 760 610
Financial liabilities 35,244 18,874 5,620 10,750
Risk Management
Management of cash flow variability is an integral component of Touchstone’s business strategy. Changing business conditions are monitored regularly and, where material, reviewed with the Board of Directors to establish risk management guidelines used by Management to carry out the Company’s strategic risk management program. The risk exposure inherent in the movements of the price of crude oil and fluctuations in Cdn$:US$, Cdn$:TT$ and US$:TT$ exchange rates are all proactively reviewed by Touchstone and may be managed through the use of derivative contracts as considered appropriate. The Company has elected not to apply IFRS prescribed “hedge accounting” rules. Accordingly, the fair value of financial derivative contracts is recorded at each period-end. The fair value may change substantially from period to period depending on market conditions. As a result, net earnings may fluctuate considerably based on the period ending commodity forward strip prices compared to the prices in any derivative contracts. Commodity price risk The Company is exposed to commodity price movements as part of its operations, particularly in relation to prices received for its oil production. Commodity prices for oil are impacted by the world and continental/regional economy and other events that dictate the levels of supply and demand.
Touchstone Exploration Inc. Q2 2018 Management’s Discussion & Analysis
24
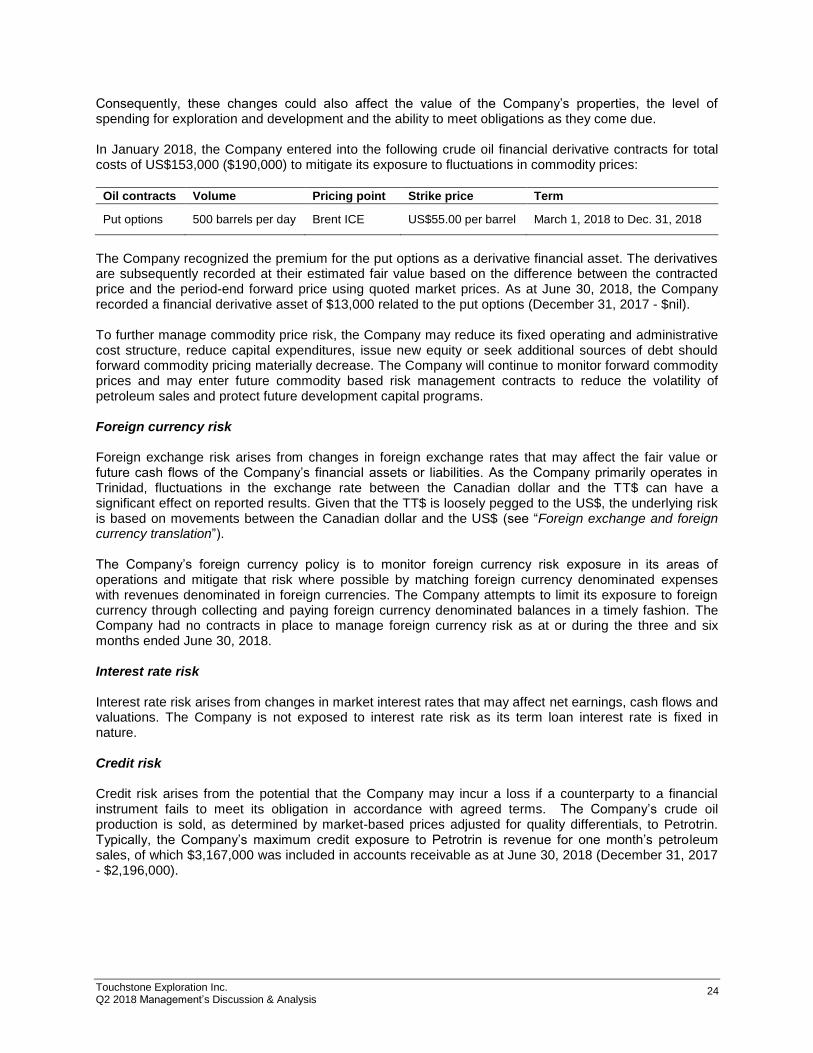
Consequently, these changes could also affect the value of the Company’s properties, the level of spending for exploration and development and the ability to meet obligations as they come due. In January 2018, the Company entered into the following crude oil financial derivative contracts for total costs of US$153,000 ($190,000) to mitigate its exposure to fluctuations in commodity prices:
Oil contracts Volume Pricing point Strike price Term
Put options 500 barrels per day Brent ICE US$55.00 per barrel March 1, 2018 to Dec. 31, 2018
The Company recognized the premium for the put options as a derivative financial asset. The derivatives are subsequently recorded at their estimated fair value based on the difference between the contracted price and the period-end forward price using quoted market prices. As at June 30, 2018, the Company recorded a financial derivative asset of $13,000 related to the put options (December 31, 2017 - $nil). To further manage commodity price risk, the Company may reduce its fixed operating and administrative cost structure, reduce capital expenditures, issue new equity or seek additional sources of debt should forward commodity pricing materially decrease. The Company will continue to monitor forward commodity prices and may enter future commodity based risk management contracts to reduce the volatility of petroleum sales and protect future development capital programs. Foreign currency risk Foreign exchange risk arises from changes in foreign exchange rates that may affect the fair value or future cash flows of the Company’s financial assets or liabilities. As the Company primarily operates in Trinidad, fluctuations in the exchange rate between the Canadian dollar and the TT$ can have a significant effect on reported results. Given that the TT$ is loosely pegged to the US$, the underlying risk is based on movements between the Canadian dollar and the US$ (see “Foreign exchange and foreign currency translation”). The Company’s foreign currency policy is to monitor foreign currency risk exposure in its areas of operations and mitigate that risk where possible by matching foreign currency denominated expenses with revenues denominated in foreign currencies. The Company attempts to limit its exposure to foreign currency through collecting and paying foreign currency denominated balances in a timely fashion. The Company had no contracts in place to manage foreign currency risk as at or during the three and six months ended June 30, 2018. Interest rate risk Interest rate risk arises from changes in market interest rates that may affect net earnings, cash flows and valuations. The Company is not exposed to interest rate risk as its term loan interest rate is fixed in nature. Credit risk Credit risk arises from the potential that the Company may incur a loss if a counterparty to a financial instrument fails to meet its obligation in accordance with agreed terms. The Company’s crude oil production is sold, as determined by market-based prices adjusted for quality differentials, to Petrotrin. Typically, the Company’s maximum credit exposure to Petrotrin is revenue for one month’s petroleum sales, of which $3,167,000 was included in accounts receivable as at June 30, 2018 (December 31, 2017 - $2,196,000).
Touchstone Exploration Inc. Q2 2018 Management’s Discussion & Analysis
25
The Company’s carrying values of accounts receivable represented the Company’s maximum credit exposure. The aging of accounts receivable as at June 30, 2018 and December 31, 2017 were as follows:
June 30,
2018 December 31,
2017
Not past due 4,829 3,388 Past due greater than 90 days 6,218 5,156
Accounts receivable 11,047 8,544
As at June 30, 2018, the Company determined that the average expected credit loss on the Company’s accounts receivables was nil. The Company believes that the accounts receivable balances that are past due are ultimately collectible, as the majority are due from the Trinidad government for value added taxes the Company has historically not experienced any collection issues. Contractual Obligations, Commitments and Guarantees
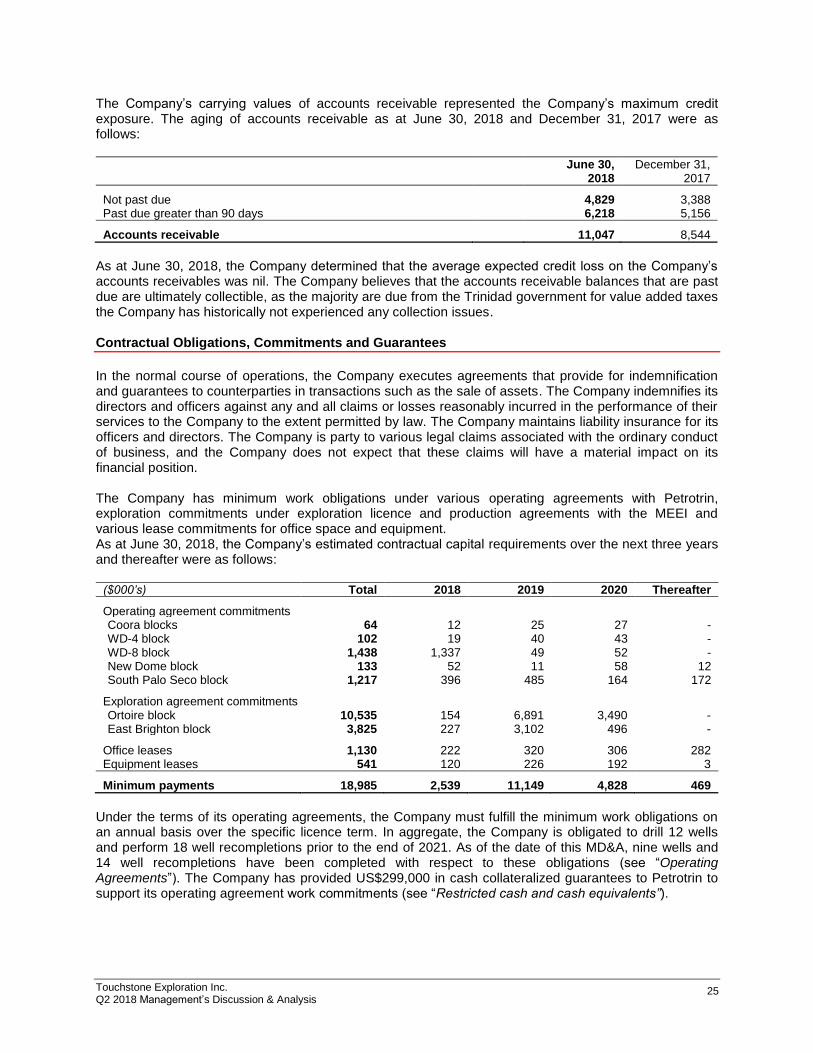
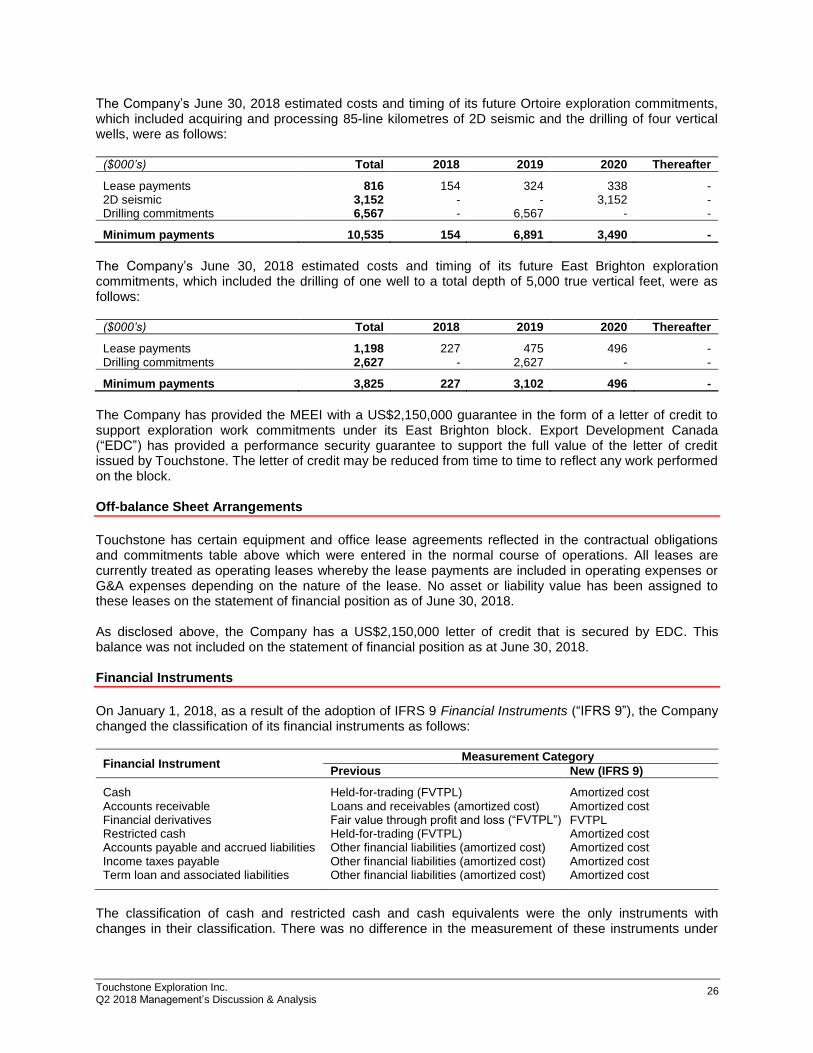
In the normal course of operations, the Company executes agreements that provide for indemnification and guarantees to counterparties in transactions such as the sale of assets. The Company indemnifies its directors and officers against any and all claims or losses reasonably incurred in the performance of their services to the Company to the extent permitted by law. The Company maintains liability insurance for its officers and directors. The Company is party to various legal claims associated with the ordinary conduct of business, and the Company does not expect that these claims will have a material impact on its financial position. The Company has minimum work obligations under various operating agreements with Petrotrin, exploration commitments under exploration licence and production agreements with the MEEI and various lease commitments for office space and equipment. As at June 30, 2018, the Company’s estimated contractual capital requirements over the next three years and thereafter were as follows:
($000’s) Total 2018 2019 2020 Thereafter
Operating agreement commitments Coora blocks 64 12 25 27 - WD-4 block 102 19 40 43 - WD-8 block 1,438 1,337 49 52 - New Dome block 133 52 11 58 12 South Palo Seco block 1,217 396 485 164 172
Exploration agreement commitments Ortoire block 10,535 154 6,891 3,490 - East Brighton block 3,825 227 3,102 496 -
Office leases 1,130 222 320 306 282 Equipment leases 541 120 226 192 3
Minimum payments 18,985 2,539 11,149 4,828 469
Under the terms of its operating agreements, the Company must fulfill the minimum work obligations on an annual basis over the specific licence term. In aggregate, the Company is obligated to drill 12 wells and perform 18 well recompletions prior to the end of 2021. As of the date of this MD&A, nine wells and 14 well recompletions have been completed with respect to these obligations (see “Operating Agreements”). The Company has provided US$299,000 in cash collateralized guarantees to Petrotrin to support its operating agreement work commitments (see “Restricted cash and cash equivalents”).
Touchstone Exploration Inc. Q2 2018 Management’s Discussion & Analysis
26
The Company’s June 30, 2018 estimated costs and timing of its future Ortoire exploration commitments, which included acquiring and processing 85-line kilometres of 2D seismic and the drilling of four vertical wells, were as follows:
($000’s) Total 2018 2019 2020 Thereafter
Lease payments 816 154 324 338 - 2D seismic 3,152 - - 3,152 - Drilling commitments 6,567 - 6,567 - -
Minimum payments 10,535 154 6,891 3,490 -
The Company’s June 30, 2018 estimated costs and timing of its future East Brighton exploration commitments, which included the drilling of one well to a total depth of 5,000 true vertical feet, were as follows:
($000’s) Total 2018 2019 2020 Thereafter
Lease payments 1,198 227 475 496 - Drilling commitments 2,627 - 2,627 - -
Minimum payments 3,825 227 3,102 496 -
The Company has provided the MEEI with a US$2,150,000 guarantee in the form of a letter of credit to support exploration work commitments under its East Brighton block. Export Development Canada (“EDC”) has provided a performance security guarantee to support the full value of the letter of credit issued by Touchstone. The letter of credit may be reduced from time to time to reflect any work performed on the block. Off-balance Sheet Arrangements
Touchstone has certain equipment and office lease agreements reflected in the contractual obligations and commitments table above which were entered in the normal course of operations. All leases are currently treated as operating leases whereby the lease payments are included in operating expenses or G&A expenses depending on the nature of the lease. No asset or liability value has been assigned to these leases on the statement of financial position as of June 30, 2018. As disclosed above, the Company has a US$2,150,000 letter of credit that is secured by EDC. This balance was not included on the statement of financial position as at June 30, 2018. Financial Instruments
On January 1, 2018, as a result of the adoption of IFRS 9 Financial Instruments (“IFRS 9”), the Company changed the classification of its financial instruments as follows:
Financial Instrument Measurement Category
Previous New (IFRS 9)
Cash Held-for-trading (FVTPL) Amortized cost Accounts receivable Loans and receivables (amortized cost) Amortized cost Financial derivatives Fair value through profit and loss (“FVTPL”) FVTPL Restricted cash Held-for-trading (FVTPL) Amortized cost Accounts payable and accrued liabilities Other financial liabilities (amortized cost) Amortized cost Income taxes payable Other financial liabilities (amortized cost) Amortized cost Term loan and associated liabilities Other financial liabilities (amortized cost) Amortized cost
The classification of cash and restricted cash and cash equivalents were the only instruments with changes in their classification. There was no difference in the measurement of these instruments under
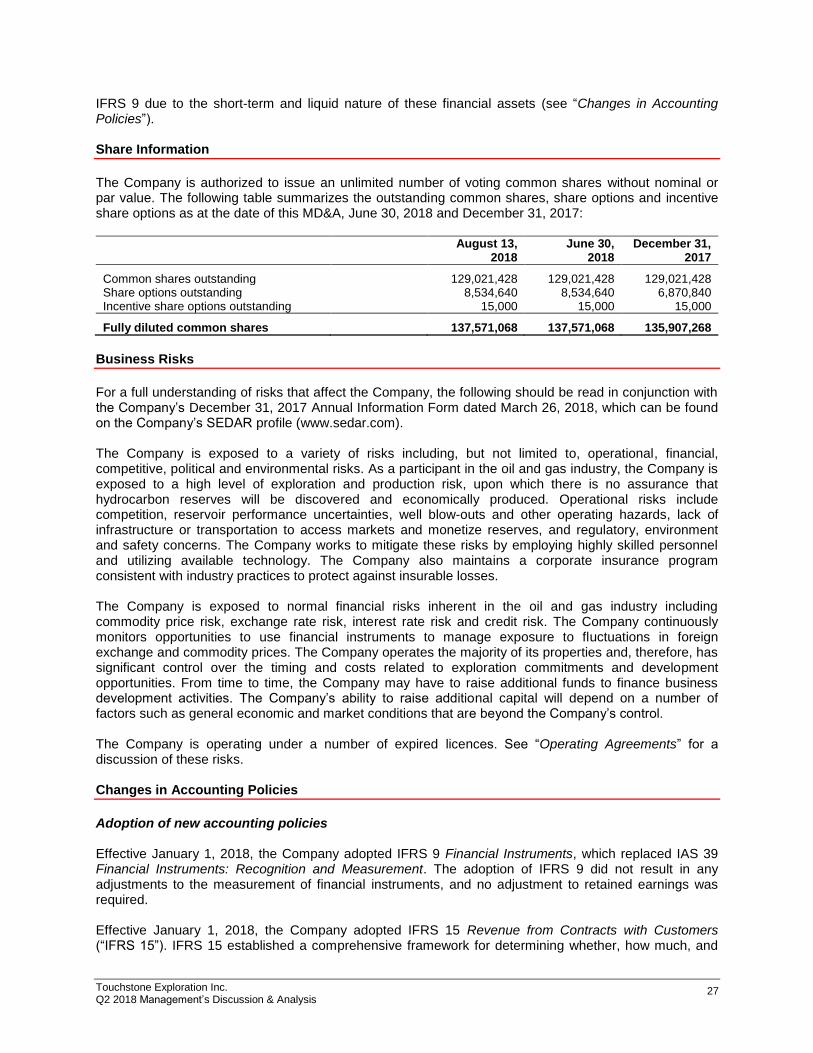
Touchstone Exploration Inc. Q2 2018 Management’s Discussion & Analysis
27
IFRS 9 due to the short-term and liquid nature of these financial assets (see “Changes in Accounting Policies”). Share Information
The Company is authorized to issue an unlimited number of voting common shares without nominal or par value. The following table summarizes the outstanding common shares, share options and incentive share options as at the date of this MD&A, June 30, 2018 and December 31, 2017:
August 13,
2018 June 30,
2018 December 31,
2017
Common shares outstanding 129,021,428 129,021,428 129,021,428 Share options outstanding 8,534,640 8,534,640 6,870,840 Incentive share options outstanding 15,000 15,000 15,000
Fully diluted common shares 137,571,068 137,571,068 135,907,268
Business Risks
For a full understanding of risks that affect the Company, the following should be read in conjunction with the Company’s December 31, 2017 Annual Information Form dated March 26, 2018, which can be found on the Company’s SEDAR profile (www.sedar.com). The Company is exposed to a variety of risks including, but not limited to, operational, financial, competitive, political and environmental risks. As a participant in the oil and gas industry, the Company is exposed to a high level of exploration and production risk, upon which there is no assurance that hydrocarbon reserves will be discovered and economically produced. Operational risks include competition, reservoir performance uncertainties, well blow-outs and other operating hazards, lack of infrastructure or transportation to access markets and monetize reserves, and regulatory, environment and safety concerns. The Company works to mitigate these risks by employing highly skilled personnel and utilizing available technology. The Company also maintains a corporate insurance program consistent with industry practices to protect against insurable losses. The Company is exposed to normal financial risks inherent in the oil and gas industry including commodity price risk, exchange rate risk, interest rate risk and credit risk. The Company continuously monitors opportunities to use financial instruments to manage exposure to fluctuations in foreign exchange and commodity prices. The Company operates the majority of its properties and, therefore, has significant control over the timing and costs related to exploration commitments and development opportunities. From time to time, the Company may have to raise additional funds to finance business development activities. The Company’s ability to raise additional capital will depend on a number of factors such as general economic and market conditions that are beyond the Company’s control. The Company is operating under a number of expired licences. See “Operating Agreements” for a discussion of these risks. Changes in Accounting Policies
Adoption of new accounting policies Effective January 1, 2018, the Company adopted IFRS 9 Financial Instruments, which replaced IAS 39 Financial Instruments: Recognition and Measurement. The adoption of IFRS 9 did not result in any adjustments to the measurement of financial instruments, and no adjustment to retained earnings was required. Effective January 1, 2018, the Company adopted IFRS 15 Revenue from Contracts with Customers (“IFRS 15”). IFRS 15 established a comprehensive framework for determining whether, how much, and

Touchstone Exploration Inc. Q2 2018 Management’s Discussion & Analysis
28
when revenue from contracts with customers is recognized. The adoption of IFRS 15 did not impact the timing or measurement of revenue, and no adjustment to retained earnings was required. Further information regarding the adoption of new accounting policies is included in Note 3 “Changes to Accounting Policies” to the Company’s June 30, 2018 unaudited interim consolidated financial statements. Future changes in accounting policies The Company will be required to adopt IFRS 16 Leases on January 1, 2019. Further information regarding future changes in accounting policies is included in Note 3 “Changes to Accounting Policies” to the Company’s June 30, 2018 unaudited interim consolidated financial statements. Significant Accounting Judgments, Estimates and Assumptions
The preparation of financial statements in conformity with IFRS requires Management to make judgments, estimates and assumptions that affect the application of accounting policies and the reported amounts of assets, liabilities, revenues and expenses. Actual results may differ from estimates, and those differences may be material. The estimates and assumptions used are subject to updates based on experience and the application of new information. Estimates and underlying assumptions are reviewed on an ongoing basis, and any revisions to accounting estimates are recognized in the period in which the estimates are revised. There were no changes to the Company’s significant judgments, estimates or assumptions used in applying accounting policies during the three and six months ended June 30, 2018. Further details on the Company’s significant accounting policies and significant accounting judgements, estimates and assumptions can be found in Note 5 “Use of Estimates, Judgements and Assumptions” to the December 31, 2017 audited consolidated financial statements. Control Environment
The Company is required to comply with National Instrument 52-109 “Certification of Disclosure in Issuers’ Annual and Interim Filings”. The certification of interim filings for the interim period ended June 30, 2018 requires that the Company discloses in the interim MD&A any changes in Touchstone’s internal controls over financial reporting (“ICFR”) that occurred during the period that have materially affected, or are reasonably likely to materially affect, the Company’s ICFR. The Company confirms that no such changes were made to ICFR or disclosure controls and procedures during the three months ended June 30, 2018. ICFR is a process designed to provide reasonable assurance that all assets are safeguarded; transactions are appropriately authorized; and to facilitate the preparation of relevant, reliable and timely information. Internal control systems, no matter how well designed, have inherent limitations. Therefore, even those systems determined to be effective can provide only reasonable assurance with respect to financial statement preparation and presentation. Furthermore, projections of any evaluation of effectiveness to future periods are subject to the risk that controls may become inadequate because of changes in conditions, or that the degree of compliance with the policies or procedures may deteriorate. Advisory on Forward-Looking Statements
Certain information regarding Touchstone set forth in this MD&A, including assessments by the Company’s Management of the Company’s plans and future operations, contains forward-looking statements that involve substantial known and unknown risks and uncertainties. All statements other than statements of historical fact may be forward-looking statements. Forward-looking statements are often, but not always, identified by the use of words such as “seek”, “anticipate”, “plan”, “continue”, “estimate”, “expect”, “may”, “will”, “project”, “predict”, “potential”, “target”, “intend”, “could”, “might”, “should”, “believe”
Touchstone Exploration Inc. Q2 2018 Management’s Discussion & Analysis
29
and other similar expressions. Such statements represent the Company’s internal projections, estimates or beliefs concerning, among other things, future growth, results of operations, production rates and production decline rates, the magnitude of and ability to recover oil and gas reserves, plans for and results of drilling and recompletion activity, well abandonment costs, the ability to secure necessary personnel, equipment and services, environmental matters, future commodity prices, changes to prevailing regulatory, royalty, tax and environmental laws and regulations, the impact of competition, future capital and other expenditures (including the amount, nature and sources of funding thereof), future financing sources, business prospects and opportunities, risk that the Company will not be able to obtain contract extensions or fulfill the contractual obligations required to retain its rights to explore, develop and exploit any of its properties and risks related to lawsuits. Although the Company believes that the expectations reflected in the forward-looking statements are reasonable, it cannot guarantee future results, levels of activity, performance or achievement since such expectations are inherently subject to significant business, economic, operational, competitive, political and social uncertainties and contingencies. Many factors could cause the Company’s actual results to differ materially from those expressed or implied in any forward-looking statements made by, or on behalf of, Touchstone. In particular, forward-looking statements contained in this MD&A may include, but are not limited to, statements with respect to:
• the Company's business and operational strategies, including targeted jurisdictions and technologies used to execute its strategies;
• financial and business prospects and financial outlook;
• the Company’s future capital expenditure programs, including the anticipated timing, allocation and costs thereof and the method of funding;
• crude oil production levels and estimated field production levels;
• the performance characteristics of the Company's oil and natural gas properties;
• the quantity and estimated future net revenue from oil and natural gas reserves and the projections of market prices and costs;
• timing of and the Company’s ability to develop unproved reserves;
• expectations regarding the ability of the Company to raise capital and to continually add to reserves through acquisitions and development;
• future development and exploration activities to be undertaken in various areas and timing thereof, including the fulfillment of minimum work obligations and exploration commitments;
• terms and estimated future expenditures of the Company's contractual commitments and their timing of settlement;
• terms and title of exploration and production licences and the expected renewal of certain contracts;
• the Company’s expectations regarding its ability to obtain contract extensions or fulfill the contractual obligations required to retain its rights to explore, develop and exploit any of its undeveloped properties;
• receipt of anticipated or future regulatory approvals;
• expected levels of operating costs, general and administrative costs and other costs associated with the Company’s business;
• the Company's risk management strategy and the future use of commodity derivatives to manage movements in the price of crude oil;
• treatment under current and future governmental regulatory regimes and tax laws;
Touchstone Exploration Inc. Q2 2018 Management’s Discussion & Analysis
30
• tax horizon, royalty rates and future tax and royalty rates enacted in the Company’s areas of operations;
• the Company’s position related to its uncertain tax positions;
• foreign currency risk and the ability to reverse unrealized foreign exchange gains and losses in the future;
• the Company's future liquidity and future sources of liquidity;
• the Company’s future compliance with its term loan covenants;
• estimated amounts of the Company’s production payment liability in connection with its term loan;
• the potential of future acquisitions or dispositions;
• general economic and political developments in Trinidad;
• estimated amounts, timing and the anticipated sources of funding for the Company's decommissioning obligations;
• effect of business and environmental risks on the Company; and
• the statements under “Significant Accounting Judgments, Estimates and Assumptions”. Many factors could cause the Company’s actual results to differ materially from those expressed or implied in any forward-looking statements made by, or on behalf of, the Company. The Company is exposed to numerous operational, technical, financial and regulatory risks and uncertainties, many of which are beyond its control and may significantly affect anticipated future results. The Company is exposed to risks associated with negotiating with foreign governments as well as country risk associated with conducting international activities. Operations may be unsuccessful or delayed as a result of competition for services, supplies and equipment, mechanical and technical difficulties, ability to attract and retain qualified employees on a cost-effective basis, commodity and marketing risk. The Company is subject to significant drilling risks and uncertainties including the ability to find crude oil reserves on an economic basis and the potential for technical problems that could lead to well blow-outs and environmental damage. The Company is exposed to risks relating to the inability to obtain timely regulatory approvals, surface access, access to third party gathering and processing facilities, transportation and other third party related operation risks. The Company is subject to industry conditions including changes in laws and regulations, the adoption of new environmental laws and regulations and changes in how they are interpreted and enforced. There are uncertainties in estimating the Company’s reserve base due to the complexities in estimated future production, costs and timing of expenses and future capital. The Company is subject to the risk that it will not be able to fulfill the contractual obligations required to retain its rights to explore, develop and exploit any of its properties. The financial risks the Company is exposed to include, but are not limited to, the impact of general economic conditions in Canada and Trinidad, continued volatility in market prices for crude oil, the impact of significant declines in market prices for oil, the ability to access sufficient capital from internal and external sources, changes in income tax laws or changes in tax laws, royalties and incentive programs relating to the Trinidad oil and gas industry, fluctuations in interest rates, and fluctuations in foreign exchange rates. The Company is subject to local regulatory legislation, the compliance with which may require significant expenditures and non-compliance with which may result in fines, penalties or production restrictions or the termination of licence, exploration, lease operating or farm-in rights related to the Company’s crude oil and gas interests in Trinidad. Readers are cautioned that the foregoing list of risk factors is not exhaustive. Additional information on these and other factors that could affect the Company’s operations and financial results are included in reports on file with Canadian securities regulatory authorities and may be accessed through the SEDAR website (www.sedar.com). Management has included the above summary of assumptions and risks related to forward-looking statements and other information provided in this MD&A in order to provide shareholders and investors with a more complete perspective on the Company’s current and future operations, and such information may not be appropriate for other purposes. Actual results, performance or achievement could differ
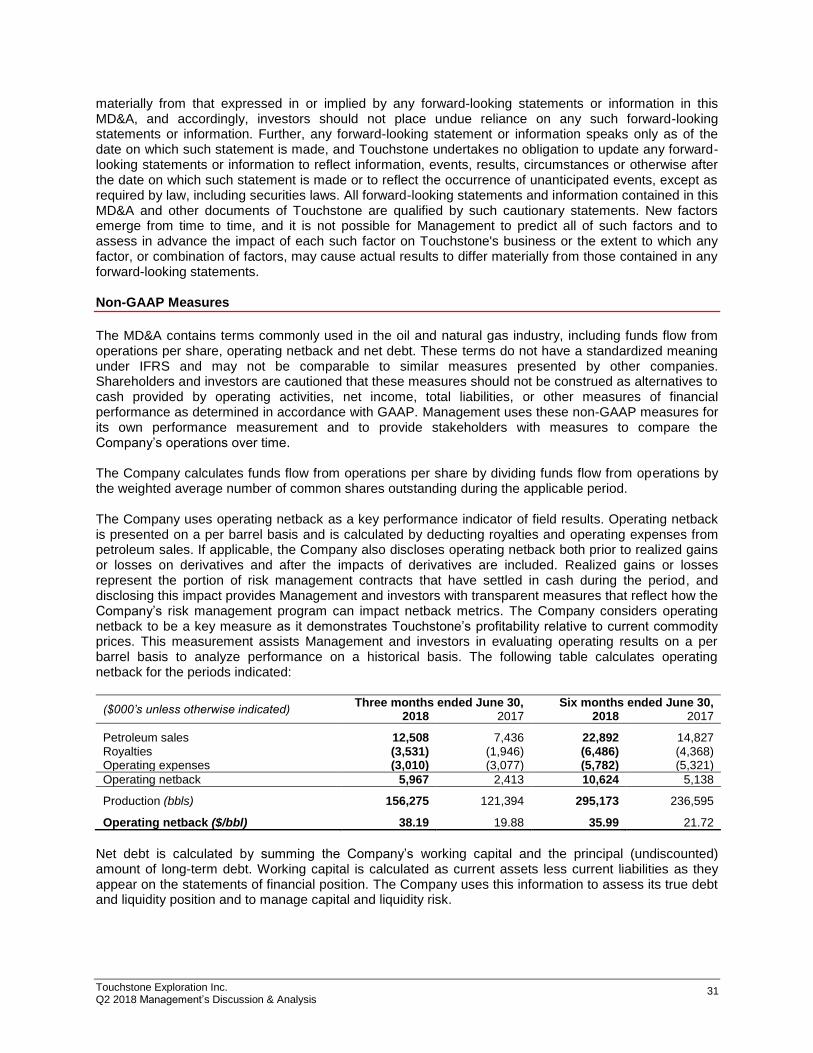
Touchstone Exploration Inc. Q2 2018 Management’s Discussion & Analysis
31
materially from that expressed in or implied by any forward-looking statements or information in this MD&A, and accordingly, investors should not place undue reliance on any such forward-looking statements or information. Further, any forward-looking statement or information speaks only as of the date on which such statement is made, and Touchstone undertakes no obligation to update any forward-looking statements or information to reflect information, events, results, circumstances or otherwise after the date on which such statement is made or to reflect the occurrence of unanticipated events, except as required by law, including securities laws. All forward-looking statements and information contained in this MD&A and other documents of Touchstone are qualified by such cautionary statements. New factors emerge from time to time, and it is not possible for Management to predict all of such factors and to assess in advance the impact of each such factor on Touchstone's business or the extent to which any factor, or combination of factors, may cause actual results to differ materially from those contained in any forward-looking statements. Non-GAAP Measures
The MD&A contains terms commonly used in the oil and natural gas industry, including funds flow from operations per share, operating netback and net debt. These terms do not have a standardized meaning under IFRS and may not be comparable to similar measures presented by other companies. Shareholders and investors are cautioned that these measures should not be construed as alternatives to cash provided by operating activities, net income, total liabilities, or other measures of financial performance as determined in accordance with GAAP. Management uses these non-GAAP measures for its own performance measurement and to provide stakeholders with measures to compare the Company’s operations over time. The Company calculates funds flow from operations per share by dividing funds flow from operations by the weighted average number of common shares outstanding during the applicable period. The Company uses operating netback as a key performance indicator of field results. Operating netback is presented on a per barrel basis and is calculated by deducting royalties and operating expenses from petroleum sales. If applicable, the Company also discloses operating netback both prior to realized gains or losses on derivatives and after the impacts of derivatives are included. Realized gains or losses represent the portion of risk management contracts that have settled in cash during the period, and disclosing this impact provides Management and investors with transparent measures that reflect how the Company’s risk management program can impact netback metrics. The Company considers operating netback to be a key measure as it demonstrates Touchstone’s profitability relative to current commodity prices. This measurement assists Management and investors in evaluating operating results on a per barrel basis to analyze performance on a historical basis. The following table calculates operating netback for the periods indicated:
($000’s unless otherwise indicated) Three months ended June 30, Six months ended June 30,
2018 2017 2018 2017
Petroleum sales 12,508 7,436 22,892 14,827 Royalties (3,531) (1,946) (6,486) (4,368) Operating expenses (3,010) (3,077) (5,782) (5,321)
Operating netback 5,967 2,413 10,624 5,138
Production (bbls) 156,275 121,394 295,173 236,595 Operating netback ($/bbl) 38.19 19.88 35.99 21.72
Net debt is calculated by summing the Company’s working capital and the principal (undiscounted) amount of long-term debt. Working capital is calculated as current assets less current liabilities as they appear on the statements of financial position. The Company uses this information to assess its true debt and liquidity position and to manage capital and liquidity risk.
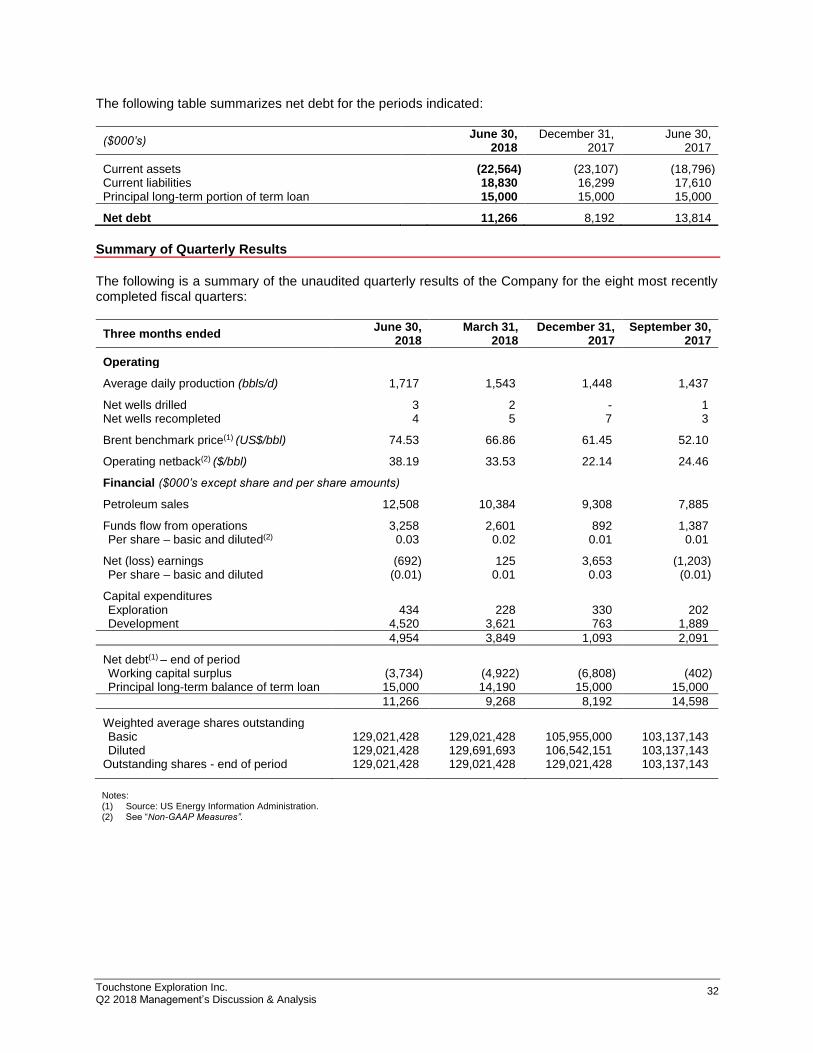
Touchstone Exploration Inc. Q2 2018 Management’s Discussion & Analysis
32
The following table summarizes net debt for the periods indicated:
($000’s) June 30,
2018 December 31,
2017 June 30,
2017
Current assets (22,564) (23,107) (18,796) Current liabilities 18,830 16,299 17,610 Principal long-term portion of term loan 15,000 15,000 15,000
Net debt 11,266 8,192 13,814
Summary of Quarterly Results
The following is a summary of the unaudited quarterly results of the Company for the eight most recently completed fiscal quarters:
Three months ended June 30,
2018 March 31,
2018 December 31,
2017 September 30,
2017
Operating Average daily production (bbls/d) 1,717 1,543 1,448 1,437 Net wells drilled 3 2 - 1 Net wells recompleted 4 5 7 3 Brent benchmark price(1) (US$/bbl) 74.53 66.86 61.45 52.10 Operating netback(2) ($/bbl) 38.19 33.53 22.14 24.46 Financial ($000’s except share and per share amounts) Petroleum sales 12,508 10,384 9,308 7,885 Funds flow from operations 3,258 2,601 892 1,387 Per share – basic and diluted(2) 0.03 0.02 0.01 0.01
Net (loss) earnings (692) 125 3,653 (1,203) Per share – basic and diluted (0.01) 0.01 0.03 (0.01)
Capital expenditures Exploration 434 228 330 202 Development 4,520 3,621 763 1,889
4,954 3,849 1,093 2,091
Net debt(1) – end of period Working capital surplus (3,734) (4,922) (6,808) (402) Principal long-term balance of term loan 15,000 14,190 15,000 15,000
11,266 9,268 8,192 14,598
Weighted average shares outstanding Basic 129,021,428 129,021,428 105,955,000 103,137,143 Diluted 129,021,428 129,691,693 106,542,151 103,137,143
Outstanding shares - end of period 129,021,428 129,021,428 129,021,428 103,137,143 Notes: (1) Source: US Energy Information Administration. (2) See “Non-GAAP Measures”.
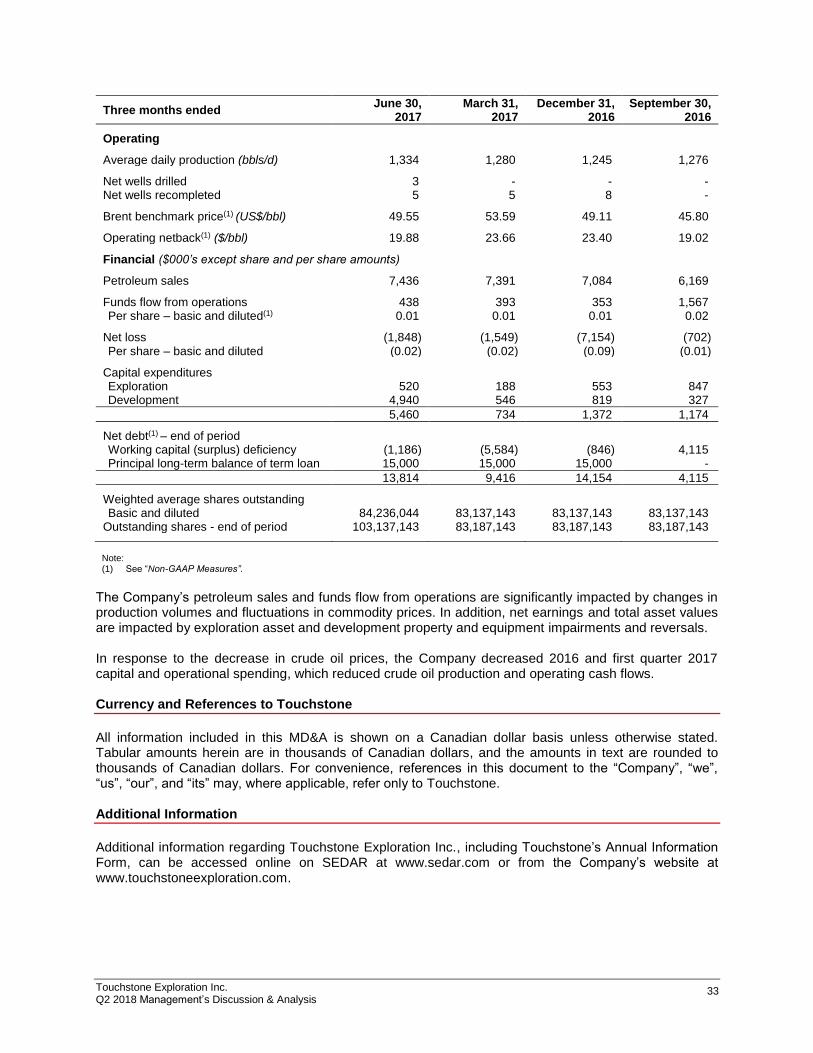
Touchstone Exploration Inc. Q2 2018 Management’s Discussion & Analysis
33
Three months ended June 30,
2017 March 31,
2017 December 31,
2016 September 30,
2016
Operating Average daily production (bbls/d) 1,334 1,280 1,245 1,276 Net wells drilled 3 - - - Net wells recompleted 5 5 8 - Brent benchmark price(1) (US$/bbl) 49.55 53.59 49.11 45.80 Operating netback(1) ($/bbl) 19.88 23.66 23.40 19.02 Financial ($000’s except share and per share amounts) Petroleum sales 7,436 7,391 7,084 6,169 Funds flow from operations 438 393 353 1,567 Per share – basic and diluted(1) 0.01 0.01 0.01 0.02
Net loss (1,848) (1,549) (7,154) (702) Per share – basic and diluted (0.02) (0.02) (0.09) (0.01)
Capital expenditures Exploration 520 188 553 847 Development 4,940 546 819 327
5,460 734 1,372 1,174
Net debt(1) – end of period Working capital (surplus) deficiency (1,186) (5,584) (846) 4,115 Principal long-term balance of term loan 15,000 15,000 15,000 -
13,814 9,416 14,154 4,115
Weighted average shares outstanding Basic and diluted 84,236,044 83,137,143 83,137,143 83,137,143
Outstanding shares - end of period 103,137,143 83,187,143 83,187,143 83,187,143 Note: (1) See “Non-GAAP Measures”.
The Company’s petroleum sales and funds flow from operations are significantly impacted by changes in production volumes and fluctuations in commodity prices. In addition, net earnings and total asset values are impacted by exploration asset and development property and equipment impairments and reversals. In response to the decrease in crude oil prices, the Company decreased 2016 and first quarter 2017 capital and operational spending, which reduced crude oil production and operating cash flows. Currency and References to Touchstone
All information included in this MD&A is shown on a Canadian dollar basis unless otherwise stated. Tabular amounts herein are in thousands of Canadian dollars, and the amounts in text are rounded to thousands of Canadian dollars. For convenience, references in this document to the “Company”, “we”, “us”, “our”, and “its” may, where applicable, refer only to Touchstone. Additional Information
Additional information regarding Touchstone Exploration Inc., including Touchstone’s Annual Information Form, can be accessed online on SEDAR at www.sedar.com or from the Company’s website at www.touchstoneexploration.com.
Touchstone Exploration Inc. Q2 2018 Management’s Discussion & Analysis
34
CORPORATE INFORMATION
DIRECTORS John D. Wright Chairman of the Board
Paul R. Baay Kenneth R. McKinnon Peter Nicol Stanley T. Smith Thomas E. Valentine Harrie Vredenburg EXECUTIVE OFFICERS Paul R. Baay
President and Chief Executive Officer
Scott Budau Chief Financial Officer
James Shipka Chief Operating Officer
STOCK EXCHANGE LISTING Toronto Stock Exchange London Stock Exchange AIM Symbol: TXP HEAD OFFICE Touchstone Exploration Inc. 4100, 350 - 7thAvenue SW Calgary, Alberta, Canada T2P 3N9
OPERATING OFFICE Touchstone Exploration (Trinidad) Ltd. #30 Forest Reserve Road Fyzabad, Trinidad, W.I.
AUDITORS Ernst and Young LLP Calgary, Alberta Port of Spain, Trinidad
RESERVE EVALUATORS GLJ Petroleum Consultants Ltd. Calgary, Alberta
LEGAL COUNSEL Norton Rose Fulbright Canada LLP Calgary, Alberta London, United Kingdom
Nunez and Co. Port of Spain, Trinidad
TRANSFER AGENT AND REGISTRAR Computershare Trust Company of Canada Calgary, Alberta
NOMINATED ADVISOR AND JOINT BROKER Shore Capital London, United Kingdom JOINT BROKER GMP FirstEnergy London, United Kingdom PUBLIC RELATIONS Camarco London, United Kingdom
ABBREVIATIONS
The following is a list of abbreviations that may be used in this MD&A: Oil bbls barrels Mbbl thousand barrels bbls/d barrels per day boe barrels of oil equivalent Mboe thousand barrels of oil
equivalent boe/d barrels of oil equivalent per
day Brent The reference price paid for
crude oil FOB North Sea WTI Western Texas
Intermediate, the reference price paid for crude oil and standard grade in U.S. dollars at Cushing, Oklahoma
Other AIM AIM market of the London
Stock Exchange plc Cdn$ Canadian dollar TSX Toronto Stock Exchange TT$ Trinidad and Tobago dollar US$ United States dollar