management’s discussion and analysis (fy08) financial ... · management’s discussion and...
TRANSCRIPT

MAnAGeMent’s DIsCussIon AnD AnAlysIs (Fy08) FInAnCIAl stAteMents
58 | MIGA AnnuAl RepoRt 08 MANAgEMENt’s disCUssiON ANd ANAlYsis

Management’s Discussion and Analysis (FY08)
overviewDevelopment ActivitiesFunding sourcesCapital ManagementInvestment ManagementCritical Accounting policyResults of operationsCorporate Governance
Financial Statements
Report of Independent Accountants Balance sheetstatement of Incomestatement of Comprehensive Income statement of Changes in shareholders’ equitystatement of Cash Flowsstatement of subscription to Capital stock and voting powerstatement of Guarantees outstandingnotes to Financial statements
MANAgEMENt’s disCUssiON ANd ANAlYsis MIGA AnnuAl RepoRt 08 | 59

MANAGEMENT’S DISCUSSION AND ANALYSIS (FY08)
OVERViEW
established in 1988, the Multilateral Investment Guarantee Agency (MIGA) is a member of the World Bank Group. the Bank Group also includes the International Bank for Reconstruction and Development (IBRD), the International Development Association (IDA), the International Finance Corporation (IFC), and the International Centre for settlement of Investment Disputes (ICsID). MIGA is a legal entity separate and distinct from IBRD, IDA, IFC, and ICsID, with its own charter (the “Convention”), share capital, financial structure, management, and staff. Membership in the agency, which currently stands at 172, is open to all members of IBRD. MIGA’s mission is to promote foreign direct investment (FDI) into developing countries to support economic growth, reduce poverty, and improve people’s lives. to this end, the agency acts as a multilateral risk mitigator, providing investors and lenders in the international investment community with the level of comfort necessary to invest in developing countries. MIGA’s core business is the provision of political risk insurance. In addition, as part of its mandate, the agency carries out complementary activities such as providing dispute resolution, technical assistance, and online information services to support FDI. MIGA is committed to promoting projects that are economically, environmentally, and socially sustainable, and promise a strong development impact. By providing political risk insurance for foreign direct investment in developing countries, MIGA is able to play a critical role in supporting the World Bank Group’s broad strategic priorities. since inception, MIGA has issued $20 billion of guarantees (including amounts issued under the Cooperative underwriting program), in support of 580 projects in approximately 100 member countries. the agency has also conducted hundreds of technical assistance activities, as well as multiple programs at regional and global levels in member countries. MIGA is financially self-sustaining, and its activities are supported by a robust capital base and a comprehensive risk management framework. the agency prepares its financial statements in accordance with accounting principles generally accepted in the united states of America (us GAAp) and International Financial Reporting standards (IFRs).
dEVElOPMENt ACtiVitiEs
summary of Business segments
MIGA seeks to fulfill its mission in developing member countries by offering political risk insurance, investment dispute resolution, technical assistance, and online dissemination of information.
Political Risk Insurance (PRI) MIGA provides investment guarantees against certain noncommercial risks (i.e., political risk insurance) to eligible foreign investors for qualified investments in developing member countries. Coverage is offered against the risks of 1) transfer restriction and inconvertibility, 2) expropriation, 3) breach of contract, and 4) war and civil disturbance, and investors may choose any combination of these covers1 (see Box 1). MIGA insures new cross-border investments originating in any MIGA member country, destined for any developing member country. types of investments that can be covered include equity, shareholder and non-shareholder loans, and loan guarantees, provided the loans have a minimum maturity of three years. other forms of investments—such as technical assistance and management contracts, or franchising and licensing agreements—may also be eligible. table 1 contains a summary of cumulative guarantees issued in member countries.
B
ox
1
riSkS CovErED by migA’S guArAntEES
1 Guarantees underwritten through the Small Investment Program (SIP) require coverage for transfer restriction, expropriation and war and civil disturbance.
MIGA provides political risk insurance to eligible investors and lenders against the following non-commercial risks:
r transfer restriction and inconvertibility – risk of incon-vertibility of local currency into foreign exchange for transfer outside the host country. Currency depreciation is not covered.
r Expropriation – risk of partial or total loss of the insured investment as a result of acts by the host government that may reduce or eliminate ownership of, control over, or rights to the insured investment.
r War and civil disturbance – risk of damage to, or the destruction or disappearance of, tangible covered assets caused by politically motivated acts of war or civil dis-turbance in the host country including revolution, insur-rection, coups d’état, sabotage and terrorism.
r Breach of contract – risk of being unable to obtain or enforce an arbitral or judicial decision recognizing the breach of an obligation by the host government.
60 | MIGA AnnuAl RepoRt 08 MANAgEMENt’s disCUssiON ANd ANAlYsis
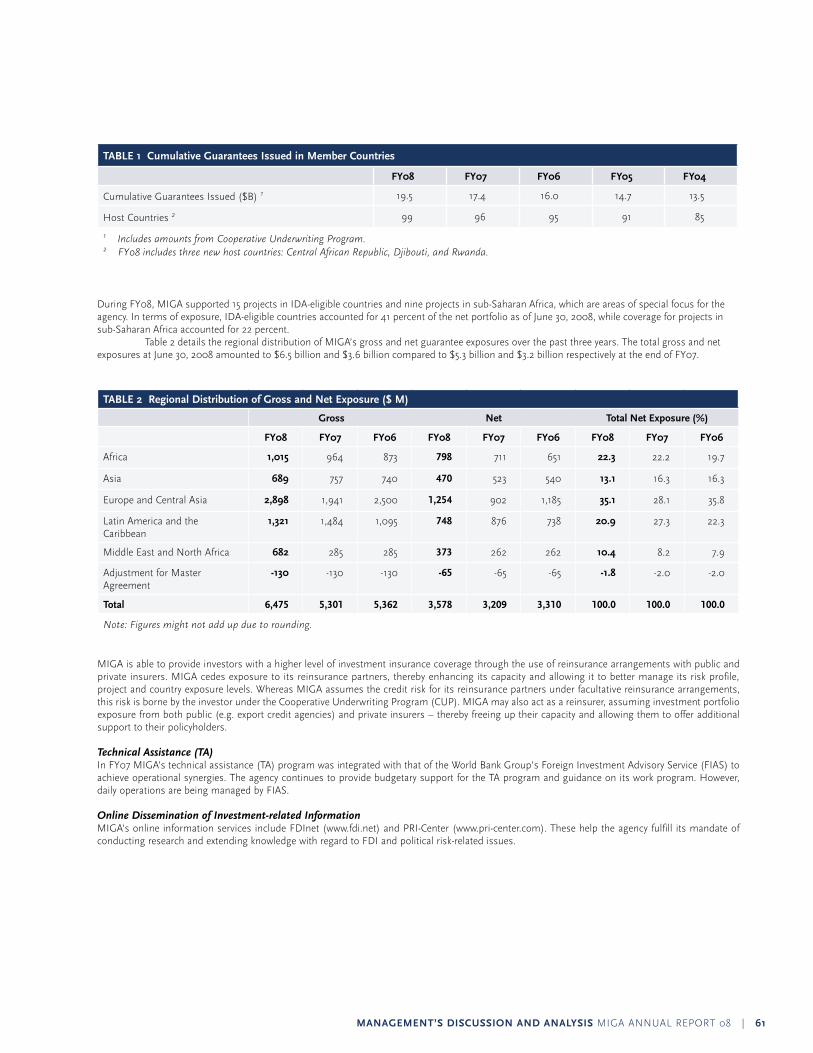
tABlE 1 Cumulative guarantees issued in Member Countries
FY08 FY07 FY06 FY05 FY04
Cumulative Guarantees Issued ($B) 1 19.5 17.4 16.0 14.7 13.5
Host Countries 2 99 96 95 91 85
1 Includes amounts from Cooperative Underwriting Program.2 FY08 includes three new host countries: Central African Republic, Djibouti, and Rwanda.
During Fy08, MIGA supported 15 projects in IDA-eligible countries and nine projects in sub-saharan Africa, which are areas of special focus for the agency. In terms of exposure, IDA-eligible countries accounted for 41 percent of the net portfolio as of June 30, 2008, while coverage for projects in sub-saharan Africa accounted for 22 percent. table 2 details the regional distribution of MIGA’s gross and net guarantee exposures over the past three years. the total gross and net exposures at June 30, 2008 amounted to $6.5 billion and $3.6 billion compared to $5.3 billion and $3.2 billion respectively at the end of Fy07.
tABlE 2 Regional distribution of gross and Net Exposure ($ M)
gross Net total Net Exposure (%)
FY08 FY07 FY06 FY08 FY07 FY06 FY08 FY07 FY06
Africa 1,015 964 873 798 711 651 22.3 22.2 19.7
Asia 689 757 740 470 523 540 13.1 16.3 16.3
europe and Central Asia 2,898 1,941 2,500 1,254 902 1,185 35.1 28.1 35.8
latin America and the Caribbean
1,321 1,484 1,095 748 876 738 20.9 27.3 22.3
Middle east and north Africa 682 285 285 373 262 262 10.4 8.2 7.9
Adjustment for Master Agreement
-130 -130 -130 -65 -65 -65 -1.8 -2.0 -2.0
total 6,475 5,301 5,362 3,578 3,209 3,310 100.0 100.0 100.0
Note: Figures might not add up due to rounding.
MIGA is able to provide investors with a higher level of investment insurance coverage through the use of reinsurance arrangements with public and private insurers. MIGA cedes exposure to its reinsurance partners, thereby enhancing its capacity and allowing it to better manage its risk profile, project and country exposure levels. Whereas MIGA assumes the credit risk for its reinsurance partners under facultative reinsurance arrangements, this risk is borne by the investor under the Cooperative underwriting program (Cup). MIGA may also act as a reinsurer, assuming investment portfolio exposure from both public (e.g. export credit agencies) and private insurers – thereby freeing up their capacity and allowing them to offer additional support to their policyholders.
Technical Assistance (TA)In Fy07 MIGA’s technical assistance (tA) program was integrated with that of the World Bank Group’s Foreign Investment Advisory service (FIAs) to achieve operational synergies. the agency continues to provide budgetary support for the tA program and guidance on its work program. However, daily operations are being managed by FIAs.
Online Dissemination of Investment-related Information MIGA’s online information services include FDInet (www.fdi.net) and pRI-Center (www.pri-center.com). these help the agency fulfill its mandate of conducting research and extending knowledge with regard to FDI and political risk-related issues.
MANAgEMENt’s disCUssiON ANd ANAlYsis MIGA AnnuAl RepoRt 08 | 61
Investment Dispute ResolutionArticle 23 of the MIGA Convention mandates the agency to seek to remove impediments to the flow of investment to developing member countries, and encourage the settlement of disputes between investors and host governments. MIGA’s dispute resolution efforts relate to projects where MIGA has issued guarantees. In addition, the agency has selectively offered mediation services to help resolve disputes between investors not guaranteed by MIGA and host countries which inhibit the flow of additional investment to the host country. MIGA may seek compensation for such services, in addition to reimbursement for out-of-pocket expenses for the costs of the mediation.
Outlook and Challenges
Market Trendsone of the principal changes in the market environment over the three year period leading up to 2007 was the fall in risk perceptions, reflected in the narrowing of the emerging Market Bond Index global composite stripped spreads, and the higher rate of growth of FDI into developing countries. During this period, the pRI market expanded significantly with the entry of new private sector players and the growth of operations of existing players. Combined with lower perceived political risks, the industry saw significant downward pressure on premium rates. However, over the past year there has been a shift. the disturbance in the financial markets stemming from the tightening of liquidity has had an effect not only on the availability of credit but also on the capacity of the pRI industry to underwrite coverage. At the same time, however, there has been a general increase in perceptions of global risk. thus, the environment is one of countervailing forces: while there is on the one hand less credit to finance deals and a tightening within the pRI market, there is also a greater general perception of risk which means sponsors proceeding with project will have a greater desire to identify effective risk mitigants.
Operational Priorities In 2008, MIGA’s Board of Directors endorsed an updated operational Directions paper identifying areas of special strategic focus for the Fy09-11 period. Given the agency’s relative portfolio and development success overall, these are based on a continuation of the four main pillars in the Fy05-08 strategy, coupled with three guiding principles that will guide its delivery. the four main operational priorities are:
Investments in IDA countries, r a key area of comparative advantage for MIGA.Investments in post-conflict countries, r an area of strengthened engagement for the agency over the past few years and where MIGA remains strongly relevant. Investment in complex projects, r mostly in infrastructure and the extractive industries, often involving government intervention and resulting in a delicate balance of risk-sharing by stakeholders.Support for investments between MIGA Category Two countries r
2 (South-South investments), given the growing proportion of FDI coming from developing countries and the need to provide underserved corporations with political risk insurance.
MIGA’s delivery of these operational priorities will be guided by the need to be:Supportive of and complement World Bank Group r strategies articulated for specific countries, as well as its strategic themes.Client and market responsiveness r through greater flexibility in service and product delivery across all markets.Financial sustainability r which will require an efficient use of MIGA’s capital and the maintenance of a balanced portfolio.
FUNdiNg sOURCEs
subscribed Capital
MIGA derives its financial strength primarily from the capital it receives from its shareholders and its retained earnings. In Fy08, new Zealand com-pleted its membership requirements, bringing the total number of member countries to 172. MIGA’s Convention established MIGA’s authorized capital stock (membership shares) at 100,000 shares—equivalent to $1,082 million—with a provision that the authorized capital stock shall automatically increase upon the admission of a new member to the extent that the total number of authorized shares are sufficient to allow subscription by the new member. As of June 30, 2008, the authorized shares increased to 105,845, equivalent to $1,145.2 million, subscribed by 172 member countries. of the membership shares subscribed, 20 percent or $229.0 million had been paid-in and the remaining 80 percent or $916.2 million was subject to call when needed by MIGA to meet its obligations. At June 30, 2008, $113.2 million is in the form of nonnegotiable, non-interest bearing demand obligations (promissory notes). the notes are denominated in freely convertible currencies and are due on demand to meet MIGA’s obligations. since inception, MIGA has not encashed any of the promissory notes. on March 29, 1999, MIGA’s Council of Governors approved a General Capital Increase (GCI) of 78,559 shares, equivalent to $850 million. the subscription period ended on March 28, 2003. on March 17, 2003, the Council of Governors approved an amendment to the GCI resolution allowing eligible countries to reserve the GCI shares allocated to them by submitting an instrument of contribution before the end of the GCI subscription period, and requesting such countries to subscribe to their GCI shares as soon as possible. the reserved shares are issued and corresponding voting power accrues when the subscription process reaches completion, i.e. when the requisite payment has been received. no time limit has been set for the payment of the reserved shares. As of June 30, 2008, cumulative subscriptions to the GCI totaled 68,934 shares, equivalent to $745.8 million, and GCI shares reserved through instruments of contribution totaled 7,328 shares, equivalent to $79.3 million. of the GCI shares subscribed, $131.6 million has been paid-in and $614.2 million is callable.
2 MIGA’s classification of developed and developing countries; see Schedule A of the Convention.
62 | MIGA AnnuAl RepoRt 08 MANAgEMENt’s disCUssiON ANd ANAlYsis

tABlE 3 summary of general Capital increase, as of June 30, 2008
Category One1 Category two1 All Countries
Number $ M Number $ M Number $ M
Fully subscribed 22 329.1 86 286.4 108 615.5
partly subscribed 1 130.3 1 130.3
total subscribed 23 459.4 86 286.4 109 745.8
Reserved through Instrument of Contribution 38.9 25 40.4 25 79.3
total subscribed & Reserved 23 498.3 111 326.8 134 825.1
Allocated 23 498.3 138 351.7 161 850.0
subscribed (%) 92.2 81.4 87.7
subscribed & Reserved (%) 100.0 92.9 97.1
1 MIGA’s classification of developed and developing countries; see Schedule A of the Convention.
As of June 30, 2008, MIGA’s total subscribed capital amounted to $1,891 million, of which $361 million was paid-in and $1,530 million was callable. since its inception, no call has been made on MIGA’s callable capital. Any calls on unpaid subscriptions are uniform on all shares. If the amount received by MIGA on a call is insufficient to meet the obligations which necessitated the call, MIGA may make further calls until the amounts received are sufficient to meet such obligations. the liability of a member on a call or calls is limited to the unpaid balance of its capital subscription.
Equitytotal shareholders’ equity as reported in MIGA’s balance sheet as of June 30, 2008 was $891 million compared with $831 million as of June 30, 2007. this amount consists of subscribed capital, less uncalled portions of subscriptions, plus retained earnings and accumulated other comprehensive income. the increase of $60 million in Fy08 primarily reflects the increase in retained earnings.
CAPitAl MANAgEMENt
Underwriting Capacity
MIGA’s equity base ensures the financial sustainability of the agency, over both the short-term and longer-term. the subscribed capital and retained earnings determine the agency’s statutory underwriting capacity. the Council of Governors and the Board of Directors have set the maximum amount of contingent liability that may be assumed by MIGA as 350 percent of the sum of its unimpaired subscribed capital and reserves and retained earnings, 90 percent of reinsurance obtained by MIGA with private insurers, and 100 percent of reinsurance obtained with public insurers. In other words, the maximum amount of net guarantee exposure is determined by the amount of available capital, and is expressed on a gross exposure basis by adding the current amount of portfolio reinsurance. As of June 30, 2008, MIGA’s underwriting capacity was $11,593 million, as follows:
tABlE 4 Current Underwriting Capacity, $ M
subscribed Capital 1,891
Retained earnings 509
Accumulated other Comprehensive Income 22
Insurance portfolio Reserve (net) 128
total 2,550
350% of subscribed Capital, Retained earnings, other Comprehensive Income and Reserve 8,923
90% of Reinsurance Ceded with private Insurers 2,044
100% of Reinsurance Ceded with public Insurers 626
Statutory Underwriting Capacity—June 30, 2008 11,593
As of June 30, 2008, MIGA’s gross exposure was $6,475 million and represented 55.9 percent of MIGA’s statutory underwriting capacity.
MANAgEMENt’s disCUssiON ANd ANAlYsis MIGA AnnuAl RepoRt 08 | 63

Capital Adequacy
Following the adoption of its formal economic Capital-based capital adequacy framework in Fy07, MIGA’s measures of capital adequacy and risk-bearing capacity include economic capital consumed by the guarantee portfolio. Modeled economic capital (eC) is the portion of MIGA’s capital that is placed at risk by the guarantee portfolio exposure. It provides an analytically rigorous measure for assessing the agency’s consumption of risk capital, and incorporates the effects from portfolio diversification and concentration. As of June 30, 2008, the economic capital consumed by the guarantee portfolio amounted to $250 million, compared to $229 million as of June 30, 2007. through an annual exercise of gauging the capital adequacy position, the current amount of eC consumed by MIGA’s activities is calculated to provide a measure of how much of available operating capital is currently utilized. In addition, as part of the framework, MIGA assesses how much eC is projected to be utilized in the future under various scenarios of growth of the guarantee portfolio. these are stressed scenarios, estimating over five years the eC consumed under assumptions of continued growth to MIGA’s portfolio, in combination with country rating downgrades and regional contagion effects. throughout the year, MIGA’s management monitors the level and utilization of available operating capital. this includes paid-in-capital, retained earnings, and the insurance portfolio reserve, net of the corresponding reinsurance recoverable. MIGA management’s objective is to have sufficient operating capital to sustain losses associated with claims and to support the ongoing business without facing a significant risk of having to avail of the callable capital. As a measure of the current utilization of this capital by the guarantee portfolio, table 5 shows the ratio of eC / operating capital over the past two years. this ratio has increased slightly to 24.6 percent in Fy08 compared with 24.1 percent in Fy07. table 5 also shows the ratio of eC / portfolio net exposure, to gauge year-on-year changes to the relative risk-level of the portfolio. As of end-Fy08, this ratio stood at 7.0% compared to 7.1% at end-Fy07, reflecting a risk level of the guarantee portfolio that has remained largely unchanged, taking into account the increased size of the portfolio. together, the two ratios indicate a strong and stable capital position at the end of Fy08.
tABlE 5 Capital Adequacy summary FY07-08, $ M
FY08 FY07
guarantee Portfolio Economic Capital (EC) 250 229
Insurance portfolio Reserve (net) 128 118
Retained earnings and Accumulated other Comprehensive Income 530 472
Paid-in Capital 361 360
Operating Capital 1,019 950
Net Exposure 3,578 3,209
EC / Operating Capital 24.6% 24.1%
EC / Net Exposure 7.0% 7.1%
iNVEstMENt MANAgEMENt
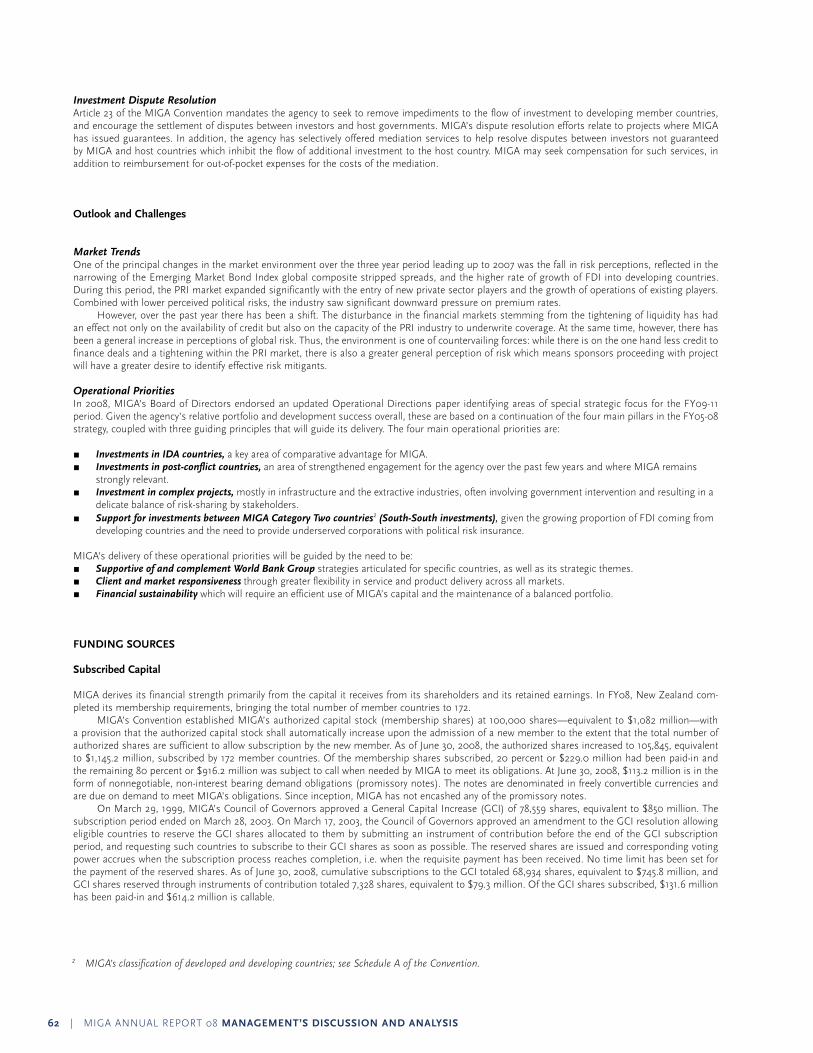
MIGA’s investment policy sets the objectives and constraints that must be considered in managing MIGA’s investment strategy (long-term) and tactics (short-term) in light of its contingent liabilities, which are the investment guarantees it issues. Given the nature of these contingent liabilities, MIGA’s invested assets may need to be liquidated to pay claims on a pre-recovery basis. As such, a certain portion of the assets is held in highly liquid assets with the amount determined by MIGA’s economic Capital Model. the amount is equal to the capital loss expected to occur with 1 percent probability within one year, plus the amount of MIGA’s specific reserve on a gross pre-recovery basis. At present MIGA’s investment portfolio is managed in two tranches subject to the constraints in the Investment Authorization approved by the Board in June 2004. tranche 1 is managed with a risk tolerance of 1 percent probability of annual capital loss over a one-year horizon, reflecting the main objective of this tranche to provide for near-term liquidity needs described above. tranche 2 is managed with a 1 percent probability of annual capital loss over a three-year horizon, reflecting the objective of providing more long-term capital growth. portfolio management activities, including trading, risk analytics and reporting, are executed by IBRD’s treasury Department under an Investment Management Agreement and the associated Investment Management Guidelines between MIGA and IBRD. MIGA’s investment portfolio consists mainly of usD denominated assets. the composition of the portfolio is shown in Figure 1. During Fy08, the investment portfolio held cash, treasury securities, agency securities, mortgage-backed securities, asset-backed securities and derivatives. Also, the portfolio included cash and government securities denominated in other currencies. the portfolio yield was 5.3 percent in Fy08 vs. 5.4 percent in Fy07 and the market value of MIGA’s asset portfolio was $915 million as of June 30, 2008, of which $760 resided in usD investments.
64 | MIGA AnnuAl RepoRt 08 MANAgEMENt’s disCUssiON ANd ANAlYsis
FigURE 1 Portfolio Composition of MigA’s holdings, in percent
CRitiCAl ACCOUNtiNg POliCY
the footnotes to MIGA’s financial statements contain a detailed summary of MIGA’s significant accounting policies. Described below are those significant policies where MIGA management is required to make estimates and parameters when preparing the agency’s financial statements and accompanying notes to conform to both IFRs and us GAAp. Accounting estimates generally involve the development of parameters by management based on judgments about the outcome of future conditions, transactions, or events. Because the outcome of future events is not known, actual results could differ from those estimates in a variety of areas. the area which management views as most critical with respect to the application of estimates and assumptions is the establishment of its loss reserves.
Reserve for Claims
MIGA’s provisioning methodology builds on portfolio risk quantification models which use both individually assessed loss probabilities for projects at risk and rating-based loss probabilities that are applied to the entire guarantee portfolio. under this methodology, for the purpose of presentation in the financial statements, MIGA’s reserve consists of two primary components, the specific Reserve and the Insurance portfolio Reserve.3 these com-ponents are defined based on the degree of probability and the basis of estimation. Reserves are shown on a gross basis on the liability side of the balance sheet, and reinsurance assets on the asset side. A detailed summary of MIGA’s provisioning policy can be found in the notes to Financial statements – note A.
Pension and Other Postretirement Benefits Along with IBRD and IFC, MIGA participates in a number of pension and postretirement benefit plans that cover almost all of their staff members. All costs, assets, and liabilities associated with these plans are allocated between IBRD, IFC, and MIGA based upon their employees’ respective partici-pation in the plans. the underlying actuarial assumptions, fair value of plan assets, and funded status associated with these plans are based on financial market interest rates, past experience, and management’s best estimate of future benefit changes and economic conditions. For further details, please refer to notes to Financial statements – note F.
REsUlts OF OPERAtiONs
Operating income and Net income
Fy08 operating income was $55.0 million, an increase of $6.0 million versus Fy07 primarily due to improved net premium income and investment income. And Fy08 net income of $65.7 million increased by $3.4 million. table 6 below shows the breakdown of MIGA’s operating income and net income.
59% Money Market/Deposits/Cash 9% Derivatives 5% Agency 4% Domestic Government 10% Asset-backed Securities 13% Mortgage-backed Securities
3 The Insurance Portfolio Reserve is calculated as the 95th percentile loss less the mean loss from the Economic Capital Model.
MANAgEMENt’s disCUssiON ANd ANAlYsis MIGA AnnuAl RepoRt 08 | 65

tABlE 6 Analysis of Operating income and Net income, $ M
FY08 FY07 FY06
total Guarantees Issued1 2,098 1,368 1,302
Gross exposure 6,475 5,301 5,362
net exposure 3,578 3,209 3,310
premium Income 54.4 49.0 52.9
premium Ceded (21.1) (17.3) (20.5)
Fees and Commissions 5.6 4.6 4.8
Net Premium income 38.9 36.3 37.2
Income from Investments 45.3 42.8 11.4
Administrative and other expenses (29.2) (30.1) (31.3)
Operating income 55.0 49.0 17.2
translation Gain 19.7 8.8 2.7
Release of (provision for) Claims (9.0) 4.6 3.4
Net income 65.7 62.3 23.2
Operating Capital 1,019 950 863
ROOC2 (before provisions) 7.3% 6.1% 2.3%
ROOC (after provisions) 6.5% 6.6% 2.7%
Note: numbers may not add up due to rounding.1 Including Cooperative Underwriting Program contracts.2 Return on Operating Capital
FY08 versus FY07
MIGA issued $2.1 billion in guarantees during Fy08, $730 million higher than in Fy07. Higher new business volumes coupled with a decline in cancel-lations, saw gross exposure and premium income increase by $1.2 billion and $5.4 million respectively. premium amounts ceded to reinsurers also increased by $3.8 million in Fy08 as a result of increased volumes. Fees and commissions increased in Fy08 in line with the increase in premium income. During Fy08, MIGA’s investment portfolio generated $45.3 million of investment income, compared with $42.8 million in Fy07. the yield was 5.3 percent in Fy08, compared with 5.4 percent in Fy07. In Fy08, administrative and other expenses decreased marginally to $29.2 million, compared with $30.1 million in Fy07. net income in Fy08 was $65.7 million compared with $62.3 million in Fy07.
FY07 versus FY06
MIGA issued $1.37 billion in guarantees during Fy07, $66 million higher than in Fy06. However, the premium income decreased by $3.9 million as did the gross exposure by $61 million. In Fy07, the trend of lower premium income due to expiries and cancellations of aged contracts that were written at higher premium rates in prior years continued. this in turn affected the premium amount ceded to reinsurers, which decreased by $3.2 million in Fy07. Fees and commissions, a function of premium income also decreased during Fy07. During Fy07, MIGA’s investment portfolio generated $42.8 million of investment income, compared with $11.4 million in Fy06. the yield was 5.4 percent in Fy07, compared with 1.5 percent in Fy06. this increase in investment return was primarily due to a more favorable interest rate envi-ronment. In Fy07, administrative and other expenses decreased marginally to $30.1 million, compared with $31.3 million in Fy06. net income in Fy07 was $62.3 million compared with $23.2 million in Fy06.
66 | MIGA AnnuAl RepoRt 08 MANAgEMENt’s disCUssiON ANd ANAlYsis

CORPORAtE gOVERNANCE
general governance
Board MembershipIn accordance with MIGA’s Convention, members of MIGA’s Board of Directors are appointed or elected by their member governments. Directors are neither officers, nor staff of MIGA. the president is the only management member of the Board of Directors, serving as a non-voting member (except casting a deciding vote in case of an equal division) and as Chairman of the Board. the Directors have established several committees including:
Committee on Development effectiveness r
Audit Committee r
Budget Committee r
personnel Committee r
ethics Committee r
Committee on Governance and Administrative Matters r
the Directors and their committees function in continuous session at the principal offices of MIGA, as business requires. each committee’s terms of reference establishes its respective roles and responsibilities. As committees do not vote on issues, their role is primarily to serve the full Board of Directors in discharging its responsibilities.
Audit Committee
Membershipthe Audit Committee consists of eight members of the Board of Directors. Membership on the Committee is determined by the Board of Directors, based upon nominations by the Chairman of the Board, following informal consultation with the Directors. In addition, membership of the Committee is expected to reflect the economic and geographic diversity of MIGA’s member countries. other relevant selection criteria include seniority, continuity, and relevant experience. some or all of the responsibilities of individual Committee members are performed by their alternates or advisors. Generally, Committee members are appointed for a two-year term; reappointment to a second term, when possible, is desirable for continuity. Audit Committee meetings are generally open to any member of the Board who may wish to attend, and non-Committee members of the Board may participate in the discussion. In addition, the Chairman of the Audit Committee may speak in that capacity at meetings of the Board of Directors, with respect to discus-sions held in the Audit Committee.
Key Responsibilitiesthe Audit Committee is appointed by the Board to assist it in the oversight and assessment of MIGA’s finances and accounting, including the ef-fectiveness of financial policies, the integrity of financial statements, the system of internal controls regarding finance, accounting and ethics (including fraud and corruption), and financial and operational risks. the Audit Committee also has the responsibility for reviewing the performance and recom-mending to the Board the appointment of the external auditor, as well as monitoring the independence of the external auditor and meeting with it in executive session. the Audit Committee participates in oversight of the internal audit function, including reviewing the responsibilities, staffing and effectiveness of internal audit. the committee likewise reviews the annual internal audit plan. In the execution of its role, the committee discusses with management as well as the external and internal auditors financial issues and policies which have an impact on the institution’s financial position and risk-bearing capacity. the Audit Committee monitors the evolution of developments in corporate governance and the role of audit committees on an ongoing basis and revised its terms of reference in Fy04 to reflect this responsibility.
Communicationsthe Audit Committee communicates regularly with the full Board through distribution of the following:
the minutes of its meetings. r
Reports of the Audit Committee prepared by the Chairman, which document discussions held. these reports are distributed to the Directors, r
Alternates, World Bank Group senior Management, and the senior Management of MIGA.“statement(s) of the Chairman” and statements issued by other members of the committee. r
the Annual Report to the Board of Directors, which provides an overview of the main issues addressed by the committee over the year. r
the Audit Committee’s communications with the external auditor are described in the Auditor Independence section.
Executive SessionsMembers of the Audit Committee may convene in executive session at any time, without management present. under the Audit Committee’s terms of reference, it meets separately in executive session with the external and internal auditors.
MANAgEMENt’s disCUssiON ANd ANAlYsis MIGA AnnuAl RepoRt 08 | 67
Access to Resources and to Managementthroughout the year, the Audit Committee receives a large volume of information, which supports the preparation of the financial statements. the Audit Committee meets both formally and informally throughout the year to discuss financial and accounting matters. Directors have complete access to management. the Audit Committee reviews and discusses with management the quarterly and annual financial statements. the committee also reviews with the external auditor the financial statements prior to their publication and recommends them for approval to the Board of Directors. the Audit Committee has the capacity, under exceptional circumstances, to obtain advice and assistance from outside legal, accounting, or other advisors as deemed appropriate.
Code of Ethics
MIGA strives to foster and maintain a positive work environment that supports the ethical behavior of its staff. to facilitate this effort, the World Bank Group has in place a Code of professional ethics—living our values. MIGA has adopted the code, which applies to all staff (including managers, con-sultants, and temporary employees) worldwide. this code is available in nine languages on IBRD’s website, www.worldbank.org. staff relations, conflicts of interest, and operational issues, including the accuracy of books and records, are key elements of the code. In addition to the code, an essential element of appropriate conduct is compliance with the obligations embodied in the principles of staff employment, staff Rules, and Administrative Rules, the violation of which may result in disciplinary actions. In accordance with the staff Rules, senior managers must complete a confidential financial disclosure instrument with the office of ethics and Business Conduct. Guidance for staff is also provided through programs, training materials, and other resources. Managers are responsible for ensuring that internal systems, policies, and procedures are consistently aligned with MIGA’s ethical goals. In support of its efforts on ethics, MIGA offers a variety of methods for informing staff of these resources. Many of these efforts are headed by the following groups:
the office of ethics and Business Conduct (oeBC) provides leadership, management and oversight for MIGA’s ethics infrastructure including r
the ethics Helpline, a consolidated conflicts of interest disclosure/resolution system, financial disclosure, ongoing training to both internal and external audiences, and communication resources.the Department of Institutional Integrity (Int) is charged with investigating allegations of fraud and corruption in projects benefiting from r
World Bank Group funding or guarantees worldwide. the Department also investigates allegations of misconduct by MIGA staff and trains and educates staff and clients in detecting and reporting fraud and corruption in MIGA-guaranteed projects. the Department reports directly to the president and is composed of professionals from a range of disciplines including financial analysts, researchers, investigators, lawyers, prosecu-tors, forensic accountants, and staff with operational experience across the World Bank Group.
MIGA has in place procedures for the receipt, retention, and treatment of complaints received regarding accounting, internal control and auditing mat-ters, including close collaboration with oeBC and Int.
Auditor independence
In February 2003, the Board of Directors adopted a set of principles applicable to the appointment of the external auditor for the World Bank Group. Key features of those principles include:
prohibition of the external auditor from the provision of all non audit-related services r
All audit-related services must be pre-approved on a case-by-case basis by the Board of Directors, upon recommendation of the Audit Committee r
Mandatory rebidding of the external audit contract every five years r
prohibition of any firm serving as external auditors for more than two consecutive five-year terms r
Mandatory rotation of the senior partner after five years r
An evaluation of the performance of the external auditor at the mid-point of the five year term r
external auditors are appointed to a five-year term of service. this is subject to annual reappointment based on the recommendation of the Audit Committee and approval of a resolution by the executive Directors. Following a mandatory re-bidding of the external audit contract during Fy 2008, IBRD’s executive Directors approved the appointment of KpMG as IBRD’s auditors for a five-year term commencing Fy 2009. As standard practice, the external auditor is present as an observer at virtually all Audit Committee meetings and is frequently asked to present its perspective on issues. In addition, the Audit Committee meets periodically with the external auditor in private session without management present. Communication between the external auditor and the Audit Committee is ongoing, as frequently as is deemed necessary by either party. MIGA’s auditors follow the communication requirements with audit committees set out under us Generally Accepted Auditing standards and International standards on Auditing. In keeping with these standards, significant formal communications include:
68 | MIGA AnnuAl RepoRt 08 MANAgEMENt’s disCUssiON ANd ANAlYsis

r Quarterly and annual financial statement reportingAnnual appointment of the external auditors r
presentation of the external audit plan r
presentation of control recommendations and discussion of the Coso attestation and report r
presentation of a statement regarding independence r
In addition to committee meetings, individual members of the Audit Committee have independent access to the external auditor.
MANAgEMENt’s disCUssiON ANd ANAlYsis MIGA AnnuAl RepoRt 08 | 69

MANAgEMENt’s AssERtiON REgARdiNg COsO
70 | MIGA AnnuAl RepoRt 08 MANAgEMENt’s disCUssiON ANd ANAlYsis

MANAgEMENt’s AssERtiON REgARdiNg COsO (CONt’d)
MANAgEMENt’s disCUssiON ANd ANAlYsis MIGA AnnuAl RepoRt 08 | 71

FiNANCiAl stAtEMENts
Report of independent Accountants
72 | MIGA AnnuAl RepoRt 08 FiNANCiAl stAtEMENts

BAlANCE shEEt
June 30, 2008 and June 30, 2007, expressed in thousands of us dollars
FY08 FY07
Assets
CAsH $ 6,301 $6,105
InvestMents—note B 966,047 880,284
nonneGotIABle, nonInteRest-BeARInG DeMAnD oBlIGAtIons 113,203 110,089
otHeR Assets
Receivable for investment securities sold 29,284 40,559
estimated reinsurance recoverables 33,600 35,800
prepaid premiums ceded to reinsurers 13,695 4,197
Asset under retirement benefits plans—note F 47,015 49,618
Miscellaneous 10,740 8,882
134,334 139,056
totAl Assets $ 1,219,885 $ 1,135,534
liabilities and shareholders’ EquitylIABIlItIes
payable for investment securities purchased $ 85,434 $ 60,611
Accounts payable and accrued expenses—note F 18,918 42,890
unearned premiums and commitments fees 33,274 16,515
Reserve for claims—note e
specific reserve for claims 55,200 58,400
Insurance portfolio reserve 135,800 125,800
Reserve for claims—gross 191,000 184,200
total liabilities 328,626 304,216
ContInGent lIABIlItIes—note D
sHAReHolDeRs’ eQuIty
Capital stock—note C
Authorized capital (184,404 shares- June 30, 2008; 183,891 shares-June 30, 2007)
subscribed capital (174,779 shares- June 30, 2008; 174,266 shares-June 30, 2007) 1,891,109 1,885,558
less uncalled portion of subscriptions 1,530,415 1,525,974
360,694 359,584
payments on account of pending subscriptions 67 67
360,761 359,651
Retained earnings 508,545 442,824
Accumulated other comprehensive income 21,953 28,843
total shareholders’ equity 891,259 831,318
totAl lIABIlItIes AnD sHAReHolDeRs’ eQuIty $ 1,219,885 $ 1,135,534
FiNANCiAl stAtEMENts MIGA AnnuAl RepoRt 08 | 73

The notes to financial statements are an integral part of these statements.
stAtEMENt OF iNCOME
For the fiscal years ended June 30, 2008 and June 30, 2007, expressed in thousands of us dollars
FY08 FY07
iNCOME
Income from guarantees
premium income $ 54,371 $ 48,960
premium ceded (21,062) (17,289)
Fees and commissions 5,597 4,617
total 38,906 36,288
Income from investments 45,335 42,747
translation gains 19,697 8,848
totAl InCoMe 103,938 87,883
expenses
provision for (release of) claims—note e 9,000 (3,726)
Release of provision due to withdrawal of claims — (837)
total 9,000 (4,563)
Administrative expenses—note F and G 28,449 29,103
other expenses 768 995
totAl expenses 38,217 25,535
net InCoMe $ 65,721 $ 62,348
stAtEMENt OF COMPREhENsiVE iNCOME
For the fiscal years ended June 30, 2008 and June 30, 2007, expressed in thousands of us dollars
FY08 FY07
net InCoMe $ 65,721 $ 62,348
otHeR CoMpReHensIve loss
unrecognized net actuarial losses on benefit plans (7,006) —
unrecognized prior service credit on benefit plans 116 —
total other comprehensive loss (6,890) —
CoMpReHensIve InCoMe $ 58,831 $ 62,348
74 | MIGA AnnuAl RepoRt 08 FiNANCiAl stAtEMENts

The notes to financial statements are an integral part of these statements.
stAtEMENt OF ChANgEs iN shAREhOldERs’ EQUitY
For the fiscal years ended June 30, 2008 and June 30, 2007, expressed in thousands of us dollars
FY08 FY07
CApItAl stoCK
Balance at beginning of the fiscal year $ 359,651 $ 359,122
new subscriptions 1,110 637
payments on account of pending subscriptions — (108)
ending Balance 360,761 359,651
RetAIneD eARnInGs
Balance at beginning of the fiscal year 442,824 380,476
net income 65,721 62,348
ending Balance 508,545 442,824
ACCuMulAteD otHeR CoMpReHensIve InCoMe
Balance at beginning of the fiscal year 28,843 3,435
other comprehensive loss (6,890) —
Adjustment to initially apply FAs 158—note F
unrecognized actuarial gain on benefit plans — 26,192
unrecognized prior service costs on benefit plans — (784)
ending Balance 21,953 28,843
totAl sHAReHolDeRs’ eQuIty $ 891,259 $ 831,318
stAtEMENt OF CAsh FlOWs
For the fiscal years ended June 30, 2008 and June 30, 2007, expressed in thousands of us dollars
FY08 FY07
CAsH FloWs FRoM opeRAtInG ACtIvItIes:
net income $ 65,721 $ 62,348
Adjustments to reconcile net income to net cash provided by (used in) operating activities:
net provision for (release of) claims 9,000 (3,726)
Release of provision due to withdrawal of claims — (837)
translation gains (19,697) (8,848)
net changes in:
Investments—trading (32,646) (69,491)
other assets, excluding investment receivables (4,145) (4,864)
Accounts payable and accrued expenses (7,002) 429
unearned premiums and commitment fees 12,230 327
net cash provided by (used in) operating activities 23,461 (24,662)
CAsH FloWs FRoM FInAnCInG ACtIvItIes
Increase (decrease) in overdraft—note B (24,272) 24,272
Capital subscription payments 550 330
net cash provided by (used in) financing activities (23,722) 24,602
eFFeCt oF exCHAnGe RAte CHAnGes on CAsH 457 394
net increase in cash 196 334
Cash at beginning of the fiscal year 6,105 5,771
CAsH At enD oF tHe FIsCAl yeAR $ 6,301 $ 6,105
FiNANCiAl stAtEMENts MIGA AnnuAl RepoRt 08 | 75

The notes to financial statements are an integral part of these statements.
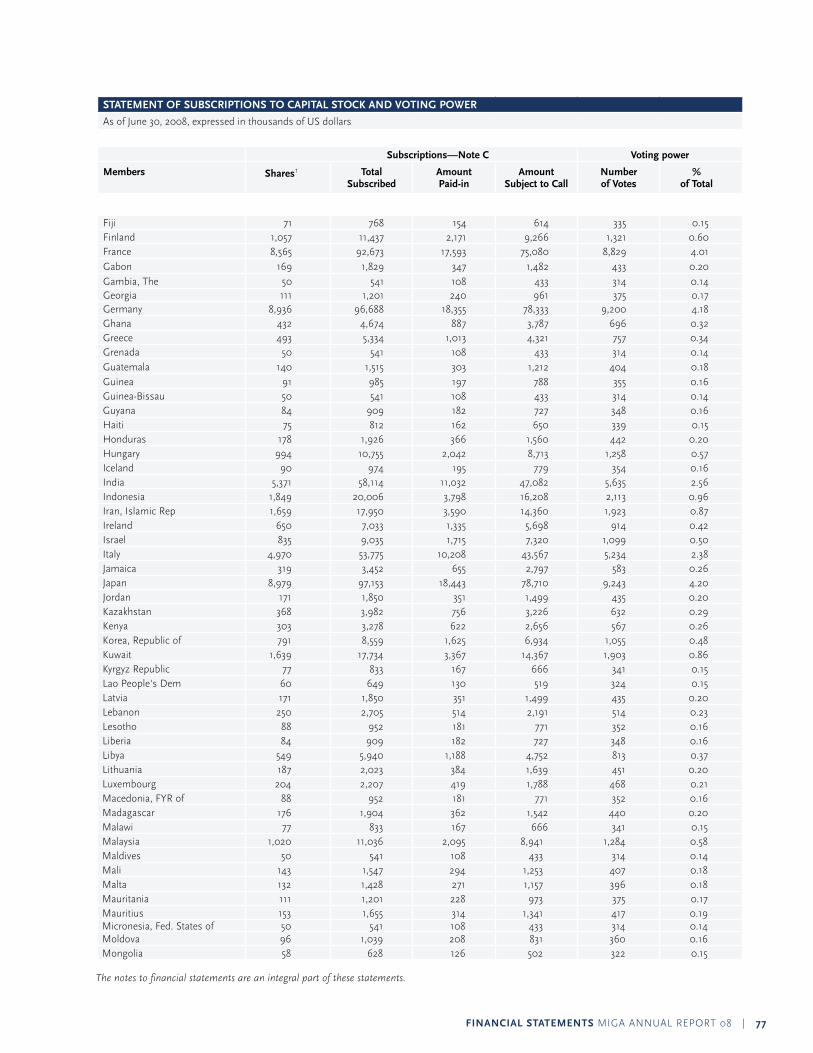
stAtEMENt OF sUBsCRiPtiONs tO CAPitAl stOCK ANd VOtiNg POWER
As of June 30, 2008, expressed in thousands of us dollars
subscriptions—Note C Voting power
Members shares1 total subscribed
Amount Paid-in
Amount subject to Call
Numberof Votes
% of total
Afghanistan 118 $ 1,277 $ 255 $ 1,022 382 0.17 Albania 102 1,104 210 894 366 0.17 Algeria 1,144 12,378 2,350 10,028 1,408 0.64 Angola 187 2,023 405 1,618 451 0.20 Antigua and Barbuda 50 541 108 433 314 0.14 Argentina 2,210 23,912 4,539 19,373 2,474 1.12 Armenia 80 866 173 693 344 0.16 Australia 3,019 32,666 6,201 26,465 3,283 1.50 Austria 1,366 14,780 2,806 11,974 1,630 0.75 Azerbaijan 115 1,244 249 995 379 0.17 Bahamas, the 176 1,904 362 1,542 440 0.20 Bahrain 136 1,472 279 1,193 400 0.18 Bangladesh 599 6,481 1,230 5,251 863 0.39 Barbados 120 1,298 246 1,052 384 0.17 Belarus 233 2,521 504 2,017 497 0.23 Belgium 3,577 38,703 7,347 31,356 3,841 1.75 Belize 88 952 181 771 352 0.16 Benin 108 1,169 222 947 372 0.17 Bolivia 220 2,380 452 1,928 484 0.22 Bosnia and Herzegovina 80 866 173 693 344 0.16 Botswana 88 952 181 771 352 0.16 Brazil 2,606 28,197 5,353 22,844 2,870 1.30 Bulgaria 643 6,957 1,321 5,636 907 0.41 Burkina Faso 61 660 132 528 325 0.15 Burundi 74 801 160 641 338 0.15 Cambodia 164 1,774 337 1,437 428 0.19 Cameroon 107 1,158 232 926 371 0.17 Canada 5,225 56,535 10,732 45,803 5,489 2.50 Cape verde 50 541 108 433 314 0.14 Central African Rep 60 649 130 519 324 0.15 Chad 60 649 130 519 324 0.15 Chile 855 9,251 1,756 7,495 1,119 0.51 China 5,530 59,835 11,359 48,476 5,794 2.63 Colombia 770 8,331 1,582 6,749 1,034 0.47 Congo, Democratic Republic of 596 6,449 1,224 5,225 860 0.39 Congo, Republic of 115 1,244 236 1,008 379 0.17 Costa Rica 206 2,229 423 1,806 470 0.21 Côte d'Ivoire 310 3,354 637 2,717 574 0.26 Croatia 330 3,571 678 2,893 594 0.27 Cyprus 183 1,980 376 1,604 447 0.20 Czech Republic 784 8,483 1,610 6,873 1,048 0.49 Denmark 1,265 13,687 2,598 11,089 1,529 0.70 Djibouti 50 541 108 433 314 0.14 Dominica 50 541 108 433 314 0.14 Dominican Republic 147 1,591 318 1,273 411 0.19 ecuador 321 3,473 659 2,814 585 0.27 egypt, Arab Republic of 809 8,753 1,662 7,091 1,073 0.49 el salvador 122 1,320 264 1,056 386 0.18 equatorial Guinea 50 541 108 433 314 0.14 eritrea 50 541 108 433 314 0.14 estonia 115 1,244 236 1,008 379 0.17 ethiopia 123 1,331 253 1,078 387 0.18
76 | MIGA AnnuAl RepoRt 08 FiNANCiAl stAtEMENts
The notes to financial statements are an integral part of these statements.
stAtEMENt OF sUBsCRiPtiONs tO CAPitAl stOCK ANd VOtiNg POWER
As of June 30, 2008, expressed in thousands of us dollars
subscriptions—Note C Voting power
Members shares1 total subscribed
Amount Paid-in
Amount subject to Call
Numberof Votes
% of total
Fiji 71 768 154 614 335 0.15 Finland 1,057 11,437 2,171 9,266 1,321 0.60 France 8,565 92,673 17,593 75,080 8,829 4.01
Gabon 169 1,829 347 1,482 433 0.20
Gambia, the 50 541 108 433 314 0.14 Georgia 111 1,201 240 961 375 0.17 Germany 8,936 96,688 18,355 78,333 9,200 4.18 Ghana 432 4,674 887 3,787 696 0.32 Greece 493 5,334 1,013 4,321 757 0.34 Grenada 50 541 108 433 314 0.14 Guatemala 140 1,515 303 1,212 404 0.18 Guinea 91 985 197 788 355 0.16 Guinea-Bissau 50 541 108 433 314 0.14 Guyana 84 909 182 727 348 0.16 Haiti 75 812 162 650 339 0.15 Honduras 178 1,926 366 1,560 442 0.20 Hungary 994 10,755 2,042 8,713 1,258 0.57 Iceland 90 974 195 779 354 0.16 India 5,371 58,114 11,032 47,082 5,635 2.56 Indonesia 1,849 20,006 3,798 16,208 2,113 0.96 Iran, Islamic Rep 1,659 17,950 3,590 14,360 1,923 0.87 Ireland 650 7,033 1,335 5,698 914 0.42 Israel 835 9,035 1,715 7,320 1,099 0.50 Italy 4,970 53,775 10,208 43,567 5,234 2.38 Jamaica 319 3,452 655 2,797 583 0.26 Japan 8,979 97,153 18,443 78,710 9,243 4.20 Jordan 171 1,850 351 1,499 435 0.20 Kazakhstan 368 3,982 756 3,226 632 0.29 Kenya 303 3,278 622 2,656 567 0.26 Korea, Republic of 791 8,559 1,625 6,934 1,055 0.48 Kuwait 1,639 17,734 3,367 14,367 1,903 0.86 Kyrgyz Republic 77 833 167 666 341 0.15 lao people's Dem 60 649 130 519 324 0.15 latvia 171 1,850 351 1,499 435 0.20 lebanon 250 2,705 514 2,191 514 0.23 lesotho 88 952 181 771 352 0.16 liberia 84 909 182 727 348 0.16 libya 549 5,940 1,188 4,752 813 0.37 lithuania 187 2,023 384 1,639 451 0.20 luxembourg 204 2,207 419 1,788 468 0.21 Macedonia, FyR of 88 952 181 771 352 0.16 Madagascar 176 1,904 362 1,542 440 0.20 Malawi 77 833 167 666 341 0.15 Malaysia 1,020 11,036 2,095 8,941 1,284 0.58 Maldives 50 541 108 433 314 0.14 Mali 143 1,547 294 1,253 407 0.18 Malta 132 1,428 271 1,157 396 0.18 Mauritania 111 1,201 228 973 375 0.17 Mauritius 153 1,655 314 1,341 417 0.19 Micronesia, Fed. states of 50 541 108 433 314 0.14 Moldova 96 1,039 208 831 360 0.16 Mongolia 58 628 126 502 322 0.15
FiNANCiAl stAtEMENts MIGA AnnuAl RepoRt 08 | 77

The notes to financial statements are an integral part of these statements.
stAtEMENt OF sUBsCRiPtiONs tO CAPitAl stOCK ANd VOtiNg POWER
As of June 30, 2008, expressed in thousands of us dollars
subscriptions—Note C Voting power
Members shares1 total subscribed
Amount Paid-in
Amount subject to Call
Numberof Votes
% of total
Montenegro 61 660 132 528 325 0.15 Morocco 613 6,633 1,259 5,374 877 0.40 Mozambique 171 1,850 351 1,499 435 0.20 namibia 107 1,158 232 926 371 0.17 nepal 122 1,320 251 1,069 386 0.18 netherlands 3,822 41,354 7,850 33,504 4,086 1.86 new Zealand 513 5,551 1,110 4,441 777 0.35 nicaragua 180 1,948 370 1,578 444 0.20 nigeria 1,487 16,089 3,054 13,035 1,751 0.80 norway 1,232 13,330 2,531 10,799 1,496 0.68 oman 166 1,796 341 1,455 430 0.20 pakistan 1,163 12,584 2,389 10,195 1,427 0.65 palau 50 541 108 433 314 0.14 panama 231 2,499 474 2,025 495 0.22 papua new Guinea 96 1,039 208 831 360 0.16 paraguay 141 1,526 290 1,236 405 0.18 peru 657 7,109 1,350 5,759 921 0.42 philippines 484 5,237 1,047 4,190 748 0.34 poland 764 8,266 1,653 6,613 1,028 0.47 portugal 673 7,282 1,382 5,900 937 0.43 Qatar 241 2,608 495 2,113 505 0.23 Romania 978 10,582 2,009 8,573 1,242 0.56 Russian Federation 5,528 59,813 11,355 48,458 5,792 2.63 Rwanda 132 1,428 271 1,157 396 0.18 st. Kitts and nevis 50 541 108 433 314 0.14 st. lucia 88 952 181 771 352 0.16 st. vincent and the Grenadines 88 952 181 771 352 0.16 samoa 50 541 108 433 314 0.14 saudi Arabia 5,528 59,813 11,355 48,458 5,792 2.63 senegal 256 2,770 526 2,244 520 0.24 serbia 407 4,404 836 3,568 671 0.30 seychelles 50 541 108 433 314 0.14 sierra leone 132 1,428 271 1,157 396 0.18 singapore 272 2,943 559 2,384 536 0.24 slovak Republic 391 4,231 803 3,428 655 0.30 slovenia 180 1,948 370 1,578 444 0.20 solomon Islands 50 541 108 433 314 0.14 south Africa 1,662 17,983 3,414 14,569 1,926 0.87 spain 2,265 24,507 4,652 19,855 2,529 1.15 sri lanka 478 5,172 982 4,190 742 0.34 sudan 206 2,229 446 1,783 470 0.21 suriname 82 887 177 710 346 0.16 swaziland 58 628 126 502 322 0.15 sweden 1,849 20,006 3,798 16,208 2,113 0.96 switzerland 2,643 28,597 5,429 23,168 2,907 1.32 syrian Arab Republic 296 3,203 608 2,595 560 0.25 tajikistan 130 1,407 267 1,140 394 0.18 tanzania 248 2,683 509 2,174 512 0.23 thailand 742 8,028 1,524 6,504 1,006 0.46 timor-leste 50 541 108 433 314 0.14 togo 77 833 167 666 341 0.15 trinidad and tobago 358 3,874 735 3,139 622 0.28
78 | MIGA AnnuAl RepoRt 08 FiNANCiAl stAtEMENts

The notes to financial statements are an integral part of these statements.
stAtEMENt OF sUBsCRiPtiONs tO CAPitAl stOCK ANd VOtiNg POWER
As of June 30, 2008, expressed in thousands of us dollars
subscriptions—Note C Voting power
Members shares1 total subscribed
Amount Paid-in
Amount subject to Call
Number of Votes
% of total
tunisia 275 2,976 565 2,411 539 0.24 turkey 814 8,807 1,672 7,135 1,078 0.49 turkmenistan 66 714 143 571 330 0.15 uganda 233 2,521 479 2,042 497 0.23 ukraine 1,346 14,564 2,765 11,799 1,610 0.73 united Arab emirates 656 7,098 1,347 5,751 920 0.42 united Kingdom 8,565 92,673 17,593 75,080 8,829 4.01 united states 32,564 352,342 67,406 284,936 32,828 14.91 uruguay 202 2,186 437 1,749 466 0.21 uzbekistan 175 1,894 379 1,515 439 0.20 vanuatu 50 541 108 433 314 0.14 venezuela, R.B. de 1,427 15,440 3,088 12,352 1,691 0.77 vietnam 388 4,198 797 3,401 652 0.30 yemen, Republic of 155 1,677 335 1,342 419 0.19 Zambia 318 3,441 688 2,753 582 0.26 Zimbabwe 236 2,554 511 2,043 500 0.23
total—June 30, 20082 174,779 $ 1,891,109 $ 360,694 $ 1,530,415 220,187 100.00
total—June 30, 2007 174,266 $ 1,885,558 $ 359,584 $ 1,525,974 218,384 100.00
Note: An amount of $67,000 was received from Niger who is in the process of completing its membership requirements.
1 Subscribed shares pertaining to the General Capital Increase include only those shares for which the subscription process has been completed, i.e., for which required payment has been received.2 May differ from the sum of individual figures shown because of rounding.
FiNANCiAl stAtEMENts MIGA AnnuAl RepoRt 08 | 79

The notes to financial statements are an integral part of these statements.
stAtEMENt OF gUARANtEEs OUtstANdiNg
As of June 30, 2008, expressed in thousands of us dollars, unless otherwise noted
gross Exposure—Note d
host Country Us dollars
Euro Japanese Yen
total Reinsurance—Note d
NetExposure3
Afghanistan 76,981 1,179 78,160 41,243 36,917
Albania 1,565 1,565 1,565Algeria 4,056 4,056 4,056Angola 14,700 14,700 1,470 13,230Argentina 34,540 34,540 16,062 18,478Bangladesh 78,265 78,265 7,826 70,438Belarus 13,412 13,412 1,341 12,071Benin 1,026 1,026 103 923Bolivia 14,250 14,250 1,425 12,825Bosnia and Herzegovina 189,120 189,120 54,752 134,368Brazil 54,185 181,243 235,428 92,295 143,132Bulgaria 155,343 155,343 77,672 77,672Burkina Faso 3,466 3,466 347 3,120Central African Republic 37,720 37,720 37,720Chile 9,614 9,614 9,614China 161,565 7,475 169,040 27,768 141,272Congo,Democratic Republic 29,110 29,110 396 28,714Costa Rica 192,286 192,286 92,858 99,429Côte d'Ivoire 11,183 11,183 11,183Croatia 17,416 17,416 12,193 5,223Djibouti 407,437 407,437 286,477 120,960Dominican Republic 125,804 125,804 16,140 109,664ecuador 118,359 118,359 42,872 75,487el salvador 3,150 3,150 315 2,835Ghana 132,352 132,352 16,941 115,411Guatemala 100,379 100,379 49,849 50,530Guinea 2,462 69,299 71,761 6,930 64,831Guinea-Bissau 29,547 29,547 2,955 26,592Indonesia 50,000 50,000 50,000Iran, Islamic Republic 127,165 127,165 12,717 114,449Jamaica 73,616 73,616 14,723 58,893Jordan 4,095 4,095 410 3,686Kazakhstan 39,243 39,243 1,949 37,295Kenya 101,643 101,643 14,639 87,004Kuwait 50,000 50,000 50,000Kyrgyz Republic 8,115 8,115 723 7,392lao pDR 88,825 88,825 44,413 44,413latvia 4,104 4,104 410 3,694Madagascar 500 38,363 38,863 1,512 37,351Mali 16,200 16,200 1,620 14,580Mauritania 5,400 5,400 540 4,860Moldova 61,092 7,464 68,556 30,546 38,010Mozambique 229,828 7,445 237,273 76,568 160,705nepal 30,001 30,001 15,941 14,061nicaragua 94,959 94,959 47,479 47,479nigeria 105,737 2,841 108,579 15,193 93,385pakistan 10,580 76,854 371 87,805 13,460 74,345
peru 7,772 7,772 1,554 6,218
80 | MIGA AnnuAl RepoRt 08 FiNANCiAl stAtEMENts

The notes to financial statements are an integral part of these statements.
stAtEMENt OF gUARANtEEs OUtstANdiNg
As of June 30, 2008, expressed in thousands of us dollars, unless otherwise noted
gross Exposure—Note d
host Country Us dollars
Euro Japanese Yen
total Reinsurance—Note d
NetExposure3
Romania 138,407 138,407 68,372 70,035Russian Federation 793,339 87,038 880,377 568,525 311,852
Rwanda 1,800 1,800 1,800
serbia 85,075 85,075 48,401 36,674sierra leone 5,000 5,000 500 4,500south Africa 12,300 12,300 12,300swaziland 26,023 7,445 33,468 16,734 16,734syrian Arab Republic 88,871 88,871 8,887 79,984thailand 83,825 83,825 41,913 41,913turkey 671,750 671,750 454,250 217,500turkmenistan 2,826 2,826 2,826uganda 157,570 157,570 77,597 79,973ukraine 623,121 623,121 325,252 297,869uruguay 300,625 300,625 192,063 108,563venezuela, R.B. de 19,800 19,800 5,940 13,860vietnam 106,419 106,419 67,853 38,566
5,573,589 1,143,088 15,261 6,731,938 3,020,912 3,711,026
Adjustment for Dual-Country Contracts1 Argentina/Chile -9,614 -9,614 -9,614
lao pDR/thailand -83,825 -83,825 -41,913 -41,913Mozambique/swaziland -26,023 -7,445 -33,468 -16,734 -16,734
-119,462 -7,445 -126,907 -58,647 -68,260
Adjustment for Master Agreement2
-129,895 -129,895 -64,948 -64,948
total—June 30, 20083 5,324,232 1,143,088 7,816 6,475,136 2,897,318 3,577,818total—June 30, 2007 4,098,509 1,194,166 8,515 5,301,190 2,091,776 3,209,414
1 For contracts where there are two host countries, MIGA is at risk for losses in both countries up to the maximum amount of liability under the contract. As such, the aggregate exposure is reported in both host countries and adjustment is made to correct for double-counting.
2 Adjustment for master agreement accounts for MIGA’s maximum exposure to loss with a single investor being less than the sum of the maximum aggregate liabilities under the individual contracts.
3 May differ from the sum of individual figures shown because of rounding.
FiNANCiAl stAtEMENts MIGA AnnuAl RepoRt 08 | 81

NOtEs tO FiNANCiAl stAtEMENts
PURPOsE
the Multilateral Investment Guarantee Agency (MIGA), established on April 12, 1988, is a member of the World Bank Group which also includes the International Bank for Reconstruction and Development (IBRD), the International Finance Corporation (IFC), and the International Development Association (IDA). MIGA’s activities are closely coordinated with and complement the overall development objectives of the other World Bank insti-tutions. MIGA is designed to help developing countries attract productive foreign investment by both private investors and commercially operated public sector companies. Its facilities include guarantees or insurance against noncommercial risks and a program of advisory services and technical assistance to support member countries’ efforts to attract and retain foreign direct investment.
NOtE A—sUMMARY OF sigNiFiCANt ACCOUNtiNg ANd RElAtEd POliCiEs
Basis of Preparation
MIGA’s financial statements have been prepared in conformity with International Financial Reporting standards (IFRs) and with accounting principles generally accepted in the united states of America (u.s. GAAp). the policy adopted is that considered most appropriate to the circumstances of MIGA having regard to its legal requirements and to the practices of other international insurance entities. on August 7, 2008, MIGA’s board of direc-tors approved the financial statements for issue.
Accounting & Reporting developments
the International Accounting standard Board (IAsB) issued International Financial Reporting standard (IFRs) 4 “Insurance Contracts” in March 2004 to achieve convergence of widely varying insurance industry accounting practices around the world. IAsB has divided the insurance project into two phases. In line with the requirements of phase 1, MIGA included additional disclosures beginning the quarter ended september 30, 2005 that identify and explain the amounts in the financial statements arising from insurance contracts. phase 2 of the project is expected to come into effect in 2011. this will address issues relating to insurance accounting. the IAsB issued a new standard (IFRs 7) “Financial Instruments: Disclosures” and revised standard (IAs 1) “Presentation of Financial Statements” that are to be applied for fiscal years beginning on or after January 1, 2007. MIGA has implemented these standards as of July 1, 2007. In september 2006, the Financial Accounting standard Board (FAsB) issued the statement of Financial Accounting standards no. 157, “Fair Value Measurements.” this standard is effective for annual periods beginning on or after november 15, 2007. MIGA is assessing the impact of this standard on its financial statements. In February 2007, the FAsB issued the statement of Financial Accounting standard no. 159, “The Fair Value Option for Financial Assets and Financial Liabilities.” this standard is effective for annual periods beginning on or after november 15, 2007 and will not impact MIGA’s financial statements. In December 2007, the FAsB issued the statement of Financial Reporting standard no. 160, “Non-controlling Interests in Consolidated Financial Statements – an amendment of ARB No. 51” (FAs 160), which changes the accounting and reporting for minority interests. this statement is effective for fiscal years beginning on or after December 15, 2008. FAs 160 will not impact MIGA’s financial statements. In March 2008, the FAsB issued the statement of Financial Accounting standard no.161, “Disclosures about Derivative Instruments and Hedging Activities” (FAs 161). FAs 161 is intended to improve financial reporting about derivative instruments and hedging activities by requiring enhanced disclosures to better understand their effects on an entity’s financial position, financial performance, and cash flows. the provisions of FAs 161 are effective for Financial statements issued for fiscal years beginning after november 15, 2008. MIGA is currently evaluating the impact of the provisions of FAs 161. In May 2008, the FAsB issued the statement of Financial Accounting standards no. 163 “Accounting for Financial Guarantee Insurance Contracts, an Interpretation of FASB Statement No. 60.” For certain financial insurance guarantee contracts, this statement addresses premium revenue recog-nition, claim liability recognition and disclosures related to each. except for certain disclosures that are applicable for quarter ending september 30, 2008 onwards, this statement is effective for fiscal years beginning after December 15, 2008. MIGA is currently assessing the impact of this standard on its financial statements.
differences between Us gAAP and iFRs
on september 29, 2006, the FAsB issued the statement of Financial Accounting standard no. 158, Employers’ Accounting for Defined Benefit Pension and Other Postretirement Plans (FAS 158). FAs 158 requires employers to recognize on their balance sheets the funded status of their defined benefit postretirement plans, measured as the difference between the fair value of the plan assets and the benefit obligation. Gains or losses and prior service costs or credits that arise during the period are recognized as part of other Comprehensive Income, to the extent they are not recognized as components of the net periodic benefit cost. Additionally, upon adoption, FAs 158 requires unrecognized net actuarial gain or loss and unrecognized prior service costs to be recognized in the ending balance of Accumulated other Comprehensive Income. these amounts will be adjusted as they are subsequently recognized as components of net periodic benefit cost, based upon the current amortization and recognition requirements of statement of Financial Accounting standard no. 87, Employers’ Accounting for Pensions (FAs 87) and Statement of Financial Accounting Standards no. 106, Employers’ Accounting for Postretirement Benefits Other Than Pensions (FAs 106). FAs 158 is applicable to MIGA’s financial statements as of June 30, 2007 and the impact of its adoption is discussed further in note F. MIGA has changed its accounting policy under International Accounting standards (IAs) 19, Employee Benefits to recognize all actuarial gains and losses in the period in which they occur—but outside profit or loss—“in a statement of changes in shareholder’s equity.” this is a permitted alter-
82 | MIGA AnnuAl RepoRt 08 FiNANCiAl stAtEMENts
native available under IAs 19 and MIGA considers that this will allow it to show the over/under funded position on the balance sheet thereby making its financial statements more relevant and complete. sFAs 158 requires prospective application of the standard, while the change in approach under IAs 19 requires retrospective application. In addition, sFAs 158 and IAs 19 differ in the treatment of amortization of unrecognized actuarial gains or losses. sFAs 158 requires the unrecognized actuarial gains or losses to be amortized to the Income statement, and IAs 19 requires the unrecognized actuarial gains or losses to remain in Accumulated other Comprehensive Income. As a result, net Income is lower by $36,000 and $187,000 for Fy08 and Fy07 respectively as reported under us GAAp compared to IFRs. MIGA does not believe these differences are material.
Use of Estimates
the preparation of financial statements in conformity with International Financial Reporting standards and accounting principles generally accepted in the united states of America requires management to make estimates and assumptions that affect the amounts reported in the financial statements. Actual results could differ from these estimates. significant judgments have been made in areas which management views as most critical with respect to the establishment of its loss reserves, the determination of net periodic income from pension and other post retirement benefits plans, and the present value of benefit obligations. the significant accounting policies employed by MIGA are summarized below.
Investments MIGA manages its investment portfolio both for the purpose of providing liquidity for potential claims and for capital growth. MIGA invests in time deposits, Mortgage/Asset-Backed securities and government and agency obligations based on its investment policy approved by the Board. Government and agency obligations include highly rated fixed rate bonds, notes, bills and other obligations issued or unconditionally guaranteed by governments of countries or other official entities including government agencies or by multilateral organizations. MIGA also enters into exchange traded futures and options transactions to manage its investment portfolio. the purposes of these transactions are to enhance the return and manage the overall duration of the portfolio. With respect to futures and options, MIGA generally closes out most open positions prior to expiration. Futures are settled on a daily basis. MIGA has classified all investment securities as trading. Investments classified as trading securities are reported at fair value using trade-date accounting. securities purchased or sold may have a settlement date that is different from the trade-date. securities purchased that could not be settled before the reporting dates are recorded as liability. similarly, securities sold that could not be settled before the reporting dates are recorded under “other Assets.” For trading securities, unrealized net gains and losses are both recognized in earnings. net gains and losses include interest income under the caption “Income from investments.”
Nonnegotiable, Noninterest-bearing Demand Obligations on Account of Subscribed Capitalpayments on these instruments are due to MIGA upon demand and are held in bank accounts which bear MIGA’s name. Accordingly, these instruments are carried and reported at face value as assets on the balance sheet.
Impairment of Reinsurance Assets MIGA assesses at each balance sheet date whether there is objective evidence that the reinsurance asset is impaired, and makes a provision for such impairment. objective evidence may be in the form of observable data that comes to MIGA’s attention periodically. If an impairment is determined, the carrying amount of the reinsurance asset is reduced through the use of an allowance account and the amount of the loss is recognized in the income statement.
Reserve for Claims MIGA’s reserve consists of two primary components, the specific Reserve and the Insurance portfolio Reserve. these components are comprehensive and mutually exclusive with respect to risk of losses that may develop from each guarantee contract, and from the contingent liability for the portfolio as a whole. the specific Reserve is calculated based on contract-specific parameters that are reviewed every quarter by MIGA Management for contracts that have known difficulties. the Insurance portfolio Reserve is calculated based on the long-term historical experiences of the political risk industry. Assumptions and parameters used in the calculations are intended to serve as the basis for an objective, reasonably conservative and arms-length valuation of insurance liabilities with a specified level of prudence. Key assumptions, including frequency of claim, severity, and expected recovery have been quantitatively derived from the political risk insurance industry’s historical claims data. the principal sources of data used as inputs for the assumptions include the Berne union and the overseas private Investment Corporation (opIC). the historical analysis of the data from those sources is further augmented by an internal econometric scoring analysis in order to derive risk-differentiated parameters with term structure effects over time. the historical and econometric analyses cover periods that are over 30 years, and the derived parameters are considered stable in the short term; however the analyses are reviewed annually. short-term risk changes are captured by changes in internal risk ratings for countries and contracts on a quarterly basis. For the purpose of the presentation of the financial statements, insurance liabilities (or reserves) are presented on a gross basis and not net of reinsurance. therefore, MIGA’s reserve is shown on a gross basis on the liability side of the balance sheet, while establishing reinsurance assets on the asset side. Currency Translation Assets and liabilities are translated at market exchange rates in effect at the end of the period. Income and expenses are translated at either the market exchange rates in effect on the dates on which they are recognized or at an average of the market exchange rates in effect during each month. translation adjustments are reflected in the Income statement.
Valuation of Capital Stock under the MIGA Convention, all payments from members subscribing to the capital stock of MIGA shall be settled on the basis of the average value
FiNANCiAl stAtEMENts MIGA AnnuAl RepoRt 08 | 83
of the special Drawing Rights (sDR) introduced by the International Monetary Fund, as valued in terms of united states dollars for the period January 1, 1981 to June 30, 1985, such value being equal to $1.082 for one sDR.
Revenue Recognition premium amounts received on direct insurance contracts and reinsurance contracts assumed can be annual, semi-annual or quarterly and are recorded as unearned premium. premiums are recognized as earned on a pro rata basis over the contract period. A receivable for premium is recorded when the contract has been renewed and coverage amounts have been identified. MIGA cedes reinsurance in the normal course of business by obtaining treaty and facultative reinsurance to augment its underwriting capacity and to mitigate its risk by protecting portions of its insurance portfolio. premiums ceded (net of commission) follow the same approach as for direct insurance contracts and are recognized as expenses on a pro rata basis over the contract period. Fee income for MIGA primarily consists of administrative fees, arrangement fees, annual fees, renewal fees, and commitment (offer) fees.
NOtE B—iNVEstMENts
MIGA classifies all investment securities as trading. Investments classified as trading securities are reported at fair value with unrealized gains or losses included in earnings. the unrealized gains included in the investment income for the fiscal year ended June 30, 2008 is $394,200 (unrealized gains of $6,538,710 – June 30, 2007).
A summary of the trading portfolio at June 30, 2008 and at June 30, 2007 is as follows (in thousands of us dollars):
Fair Value
2008 2007
Government obligations $ 82,701 $ 22,395
time deposits 624,964 571,995
Asset-backed securities 258,382 285,894
total $ 966,047 $ 880,284
MIGA manages its investments on a net portfolio basis. the following table summarizes MIGA’s net portfolio position as of June 30, 2008 and June 30, 2007 (in thousands of us Dollars):
Fair Value
2008 2007
Investments—trading $ 966,047 $ 880,284
Cash held in investment portfolio1 123 106
Receivable from investment securities sold 29,284 40,559
Accrued Interest2 4,470 5,237
Cash overdraft due to over-invested position3 — (24,272)
payable for investment securities purchased (85,434) (60,611)
Net investment Portfolio $ 914,490 $ 841,3031 This amount is included under Cash in the Balance Sheet.2 This amount is included under Miscellaneous assets in the Balance Sheet3 This amount is included under Accounts payable and accrued expenses in the Balance Sheet
Investments are denominated primarily in united states dollars with instruments in non-dollar currencies representing 16.94 percent (14.90 percent—June 30, 2007) of the portfolio. the maximum credit exposure of investments closely approximate the fair values of the financial instruments. Asset backed securities (ABs) are diversified among credit cards, student loans, home equity loans and mortgage backed securities. since these holdings are primarily investment grade, neither concentration risk nor credit risk represents a significant risk to MIGA.
84 | MIGA AnnuAl RepoRt 08 FiNANCiAl stAtEMENts

NOtE C—CAPitAl stOCK
the MIGA Convention established MIGA’s authorized capital stock at 100,000 shares with a provision that the authorized capital stock shall automat-ically increase on the admission of a new member to the extent that the then authorized shares are insufficient to provide the shares to be subscribed by such member. At June 30, 2008, the initial authorized capital stock increased to 184,404 (183,891 – June 30, 2007) shares. the Convention further states that 10 percent of the members’ initial subscription be paid in cash, in freely convertible currencies, except that developing member countries may pay up to a quarter of the 10 percent in their own currencies. An additional 10 percent of the initial subscription shall be paid in the form of non negotiable, non interest bearing promissory notes. the notes are denominated in freely convertible currencies and are due on demand to meet MIGA’s obligations. the remaining 80 percent is subject to call when required by MIGA to meet its obligations. on March 29, 1999, the Council of Governors approved a General Capital Increase (GCI) resolution increasing the authorized capital stock of MIGA by 78,559 shares to be subscribed by members during the subscription period ending March 28, 2002. of the additional capital, 17.65 percent is to be paid in cash, in freely usable currency. the remaining 82.35 percent is subject to call when required by MIGA to meet its obligations. on May 6, 2002, the Council of Governors adopted a resolution to extend the GCI subscription period to March 28, 2003. on March 17, 2003, the Council of Governors approved an amendment to the GCI resolution allowing eligible countries to subscribe to the GCI shares allocated to them by submitting an Instrument of Contribution before the GCI deadline of March 28, 2003, and requesting such countries to pay for their GCI shares as soon as possible. the reserved shares will be issued and corresponding voting power will accrue when the subscription process has been completed. During the year ended June 30, 2008, 513 shares were subscribed by member countries. At June 30, 2008, MIGA’s authorized capital stock com-prised 184,404 shares of which 174,779 (174,266 – June 30, 2007) shares had been subscribed. each share has a par value of sDR10,000, valued at the rate of $1.082 per sDR. of the subscribed capital, $360,694,000 ($359,584,000—June 30, 2007) has been paid in; and the remaining $1,530,415,000 ($1,525,974,000—June 30, 2007) is subject to call. At June 30, 2008, $113,203,000 is in the form of nonnegotiable, non interest bearing demand obli-gations (promissory notes). A summary of MIGA’s capital stock at June 30, 2008 and June 30, 2007 is as follows:
initial Capital Capital increase total
shares (Us$000) shares (Us$000) shares (Us$000)
As of June 30, 2008
Authorized 105,845 $ 1,145,243 78,559 $ 850,008 184,404 $ 1,995,251
subscribed 105,845 $ 1,145,243 68,934 $ 745,866 174,779 $ 1,891,109
At June 30, 2007
Authorized 105,332 $ 1,139,692 78,559 $ 850,008 183,891 $ 1,989,701
subscribed 105,332 $ 1,139,692 68,934 $ 745,866 174,266 $ 1,885,558
NOtE d—gUARANtEEs
guarantee Program
MIGA offers guarantees or insurance against loss caused by non-commercial risks (political risk insurance) to eligible investors on qualified investments in developing member countries. MIGA insures investments for up to 20 years against four different categories of risk: currency inconvertibility and transfer restriction, expropriation, war and civil disturbance, and breach of contract. Currency inconvertibility and transfer restriction coverage protects the investor against inconvertibility of local currency into foreign exchange for transfer outside the host country. Currency depreciation is not covered. expropriation coverage protects the investor against partial or total loss of the insured investment as a result of acts by the host government that may reduce or eliminate ownership of, control over, or rights to the insured investment. War and civil disturbance coverage protects the investor against losses from damage to, or the destruction or disappearance of, tangible coverage assets, as well as a total loss due to business interruption extending for a period of at least 180 days, caused by politically motivated acts of war or civil disturbance in the host country including revolution, insurrection, coup d’etat, sabotage and terrorism. Breach of contract coverage protects the investor against the inability to enforce an award arising out of an arbitral or judicial decision recognizing the breach of a covered obligation by the host government. Investors may insure projects by purchasing any combination of the four coverages. MIGA guarantees cannot be terminated unilaterally by the guarantee holder within the first three years from the date of issuance without payment of a termination fee except as provided in the contract. MIGA cannot terminate the contract unless the guarantee holder defaults on its contractual obligations to MIGA. premium rates applicable are set forth in the contracts. payments against all claims under a guarantee may not exceed the maximum amount of coverage issued under the guarantee. under breach of contract coverage, payments against claims may not exceed the lesser of the amount of guarantee and the arbitration award. MIGA also acts as administrator of some investment guarantee trust funds. MIGA, on behalf of the trust funds, issues guarantees against loss caused by non-commercial risks to eligible investors on qualified investments in the countries specified in the trust fund agreements. under the trust fund agreements, MIGA, as administrator of the trust funds, is not liable on its own account for payment of any claims under contracts of guarantees issued by MIGA on behalf of such trust funds which at June 30, 2008 amounts to $3,517,000 ($2,942,000 – June 30, 2007).
FiNANCiAl stAtEMENts MIGA AnnuAl RepoRt 08 | 85
Contingent liability
the maximum amount of contingent liability of MIGA under guarantees issued and outstanding at June 30, 2008 totaled $6,475,136,000 ($5,301,190,000—June 30, 2007). A contract of guarantee issued by MIGA may permit the guarantee holder, at the start of each contract period, to elect coverage and place amounts both on current and standby. MIGA is currently at risk for amounts placed on current. the maximum amount of con-tingent liability is MIGA’s maximum exposure to insurance claims, which includes “standby” coverage for which MIGA is committed but not currently at risk. At June 30, 2008, MIGA’s actual exposure to insurance claims, exclusive of standby coverage is $5,159,055,000 ($3,379,228,000—June 30, 2007).
Reinsurance
MIGA obtains treaty and facultative reinsurance (both public and private) to augment its underwriting capacity and to mitigate its risk by protecting portions of its insurance portfolio, and not for speculative reasons. All reinsurance contracts are ceded on a proportionate basis. However, MIGA is exposed to reinsurance non-performance risk in the event that reinsurers fail to pay their proportionate share of the loss in case of a claim. MIGA manages this risk by requiring that private sector reinsurers be rated by at least two of the four major rating agencies (standard & poor’s, A.M. Best, Moody’s and Fitch), and that such ratings be above a minimum threshold. In addition, MIGA may also place reinsurance with public insurers of member countries that operate under and benefit from the full faith and credit of their governments and with multilateral agencies that represent an acceptable counterparty risk. MIGA has established limits, at both the project and portfolio levels, which restrict the amount of reinsurance that may be ceded. the project limit states that MIGA may cede no more than 90 percent of any individual project. the portfolio limit states that MIGA may not reinsure more than 50 percent of its aggregate gross exposure. of the $6,475,136,000 outstanding contingent liability (gross exposure) as at June 30, 2008 ($5,301,190,000—June 30, 2007), $2,897,318,000 was ceded through contracts of reinsurance ($2,091,776,000—June 30, 2007). net exposure amounted to $3,577,818,000 as at June 30, 2008 ($3,209,414,000—June 30, 2007). As of June 30, 2008, total reinsurance provided by MIGA was nil ($28,933,000- June 30, 2007). premiums relating to direct, assumed, and ceded contracts for the fiscal years ended June 30, 2008 and June 30, 2007 were as follows:
In thousands of us dollars 2008 2007
premiums Written
Direct $ 65,995 $ 49,017
Assumed — 351
Ceded (26,640) (17,185)
premiums earned
Direct 54,260 48,609
Assumed 111 351
Ceded (21,062) (17,289)
Portfolio Risk Management
Controlled acceptance of political risk in developing countries is MIGA’s core business. the underwriting of such risk requires a comprehensive risk management framework to analyze, measure, mitigate and control risk exposures. Claims risk, the largest risk for MIGA, is the risk of incurring a financial loss as a result of a claimable political risk event in developing countries. political risk assessment forms an integral part of MIGA’s underwriting process and includes the analysis of both country-related and project-related risks. Country risk assessment is a combination of quantitative and qualitative analysis. Ratings are assigned individually to each risk for which MIGA provides insurance coverage in a country. Country ratings are reviewed and updated every quarter. Country risk assessment forms the basis of the underwriting of insurance contracts, setting of premium levels, and provisioning for claims. project-specific risk assessment is performed by a cross-functional team. Based on the analysis of project-specific risk factors within the country context, the final project risk ratings can be higher or lower than the country ratings of a specific coverage. the decision to issue an insurance contract is subject to approval by MIGA’s senior Management and concurrence by the Board of Directors. In order to avoid excessive risk concentration, MIGA sets exposure limits per country and per project. the maximum net exposure which may be assumed by MIGA is $600 million in each host country and $180 million for each project. As approved by the Board of Directors and the Council of Governors, the maximum aggregate amount of contingent liabilities that may be assumed by MIGA is 350 percent of the sum of MIGA’s unimpaired subscribed capital and its retained earnings, and insurance portfolio reserve plus such portion of the insurance ceded by MIGA through contracts of reinsurance as the Board of Directors may determine. Accordingly, at June 30, 2008, the maximum level of guarantees outstanding (including reinsurance) may not exceed $11,593,000,000.
86 | MIGA AnnuAl RepoRt 08 FiNANCiAl stAtEMENts

Portfolio diversification
MIGA aims to diversify its guarantee portfolio so as to limit the concentration of exposure to loss in a host country, region, or sector. the portfolio shares of the top five and top ten largest exposure countries provide a convenient indicator of concentration risk. the gross and net exposures of the top five and top ten countries at June 30, 2008 and June 30, 2007 are as follows:
In thousands of us dollars June 30, 2008 June 30, 2007
Exposure in top Five Countries
Exposure in top ten Countries
Exposure in top Five Countries
Exposure in top ten Countries
gross Exposure $ 2,888,310 $ 3,906,457 $ 1,970,512 $ 2,863,040
% of total Gross exposure 44.5 60.3 37.2 54.0
Net Exposure $ 1,131,058 $ 1,757,518 $ 946,116 $ 1,555,972
% of total net exposure 31.6 49.1 29.5 48.5
A regionally diversified portfolio is desirable for MIGA as an insurer, because correlations of claims occurrences are typically higher within a region than between regions. When a correlation is higher, the probability of simultaneous occurrences of claims will be higher. the regional distribution of MIGA’s portfolio at June 30, 2008 and June 30, 2007 is as follows:
In thousands of us dollars June 30, 2008 June 30, 2007
grossExposure
NetExposure
% of total Net Exposure
grossExposure
NetExposure
% of total Net Exposure
Africa $ 1,015,491 $ 798,182 22.3 $ 964,143 $ 711,234 22.2
Asia 688,516 470,012 13.1 757,147 523,209 16.3
europe and Central Asia 2,898,430 1,254,045 35.1 1,941,095 902,108 28.1
latin America and Carribean 1,320,969 747,393 20.9 1,483,567 876,191 27.3
Middle east and north Africa 681,625 373,134 10.4 285,133 261,620 8.1
Adjustment for Master Agreement 1 (129,895) (64,948) (1.8) (129,895) (64,948) (2.0)
$ 6,475,136 $ 3,577,818 100.0 $ 5,301,190 $ 3,209,414 100.0
1 Adjustment for master agreement accounts for MIGA’s maximum exposure to loss with a single investor being less than the sum of the maximum aggregate liabilities under the individual contracts.
the sectoral distribution of MIGA’s portfolio at June 30, 2008 and June 30, 2007 is shown in the following table:
In thousands of us dollars June 30, 2008 June 30, 2007
grossExposure
NetExposure
% of total Net Exposure
grossExposure
NetExposure
% of total Net Exposure
Infrastructure $ 2,648,422 $ 1,543,358 43.1 $ 2,196,276 $ 1,415,725 44.1
Financial 2,411,171 1,117,441 31.2 1,523,797 766,392 23.9
tourism, Construction and services 239,206 213,137 6.0 288,083 250,569 7.8
Manufacturing 495,385 282,560 7.9 541,434 318,216 9.9
oil and Gas 329,519 256,910 7.2 358,216 268,731 8.4
Mining 269,069 90,885 2.5 310,078 115,491 3.6
Agribusiness 82,364 73,527 2.1 83,306 74,290 2.3
$ 6,475,136 $ 3,577,818 100.0 $ 5,301,190 $ 3,209,414 100.0
FiNANCiAl stAtEMENts MIGA AnnuAl RepoRt 08 | 87
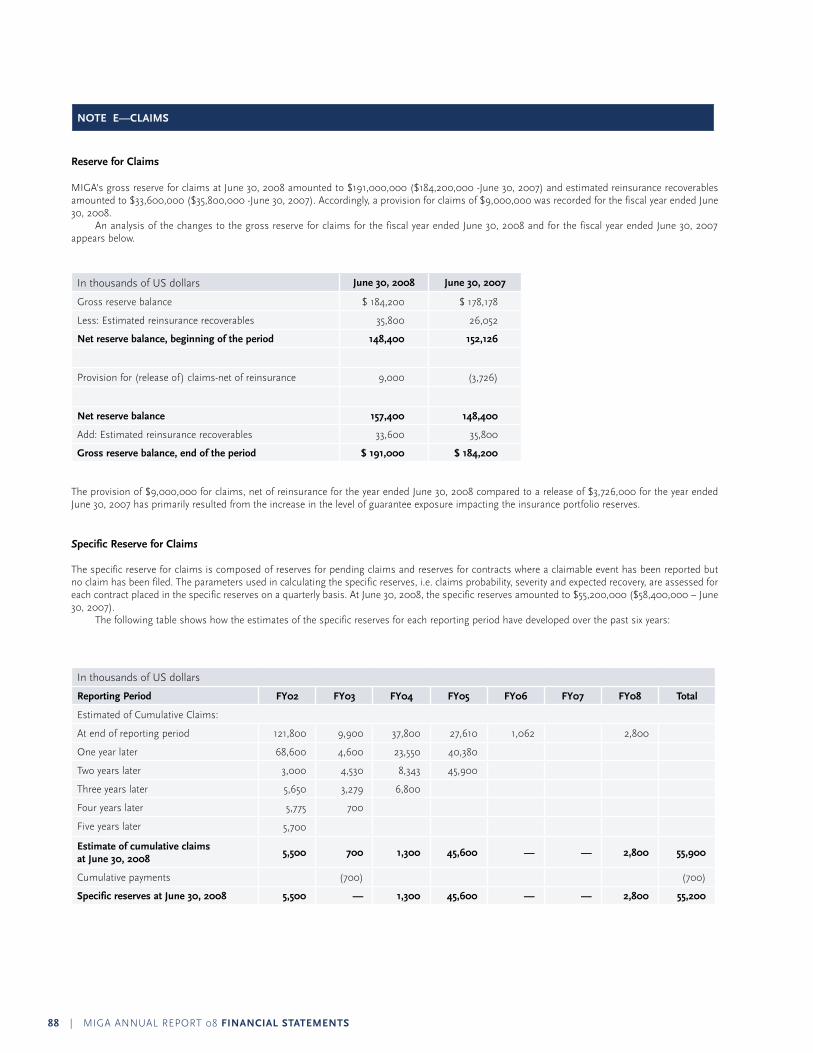
NOtE E—ClAiMs
Reserve for Claims
MIGA’s gross reserve for claims at June 30, 2008 amounted to $191,000,000 ($184,200,000 -June 30, 2007) and estimated reinsurance recoverables amounted to $33,600,000 ($35,800,000 -June 30, 2007). Accordingly, a provision for claims of $9,000,000 was recorded for the fiscal year ended June 30, 2008. An analysis of the changes to the gross reserve for claims for the fiscal year ended June 30, 2008 and for the fiscal year ended June 30, 2007 appears below.
In thousands of us dollars June 30, 2008 June 30, 2007
Gross reserve balance $ 184,200 $ 178,178
less: estimated reinsurance recoverables 35,800 26,052
Net reserve balance, beginning of the period 148,400 152,126
provision for (release of) claims-net of reinsurance 9,000 (3,726)
Net reserve balance 157,400 148,400
Add: estimated reinsurance recoverables 33,600 35,800
gross reserve balance, end of the period $ 191,000 $ 184,200
the provision of $9,000,000 for claims, net of reinsurance for the year ended June 30, 2008 compared to a release of $3,726,000 for the year ended June 30, 2007 has primarily resulted from the increase in the level of guarantee exposure impacting the insurance portfolio reserves.
Specific Reserve for Claims
the specific reserve for claims is composed of reserves for pending claims and reserves for contracts where a claimable event has been reported but no claim has been filed. the parameters used in calculating the specific reserves, i.e. claims probability, severity and expected recovery, are assessed for each contract placed in the specific reserves on a quarterly basis. At June 30, 2008, the specific reserves amounted to $55,200,000 ($58,400,000 – June 30, 2007). the following table shows how the estimates of the specific reserves for each reporting period have developed over the past six years:
In thousands of us dollars
Reporting Period FY02 FY03 FY04 FY05 FY06 FY07 FY08 total
estimated of Cumulative Claims:
At end of reporting period 121,800 9,900 37,800 27,610 1,062 2,800
one year later 68,600 4,600 23,550 40,380
two years later 3,000 4,530 8,343 45,900
three years later 5,650 3,279 6,800
Four years later 5,775 700
Five years later 5,700
Estimate of cumulative claims at June 30, 2008
5,500 700 1,300 45,600 — — 2,800 55,900
Cumulative payments (700) (700)
specific reserves at June 30, 2008 5,500 — 1,300 45,600 — — 2,800 55,200
88 | MIGA AnnuAl RepoRt 08 FiNANCiAl stAtEMENts
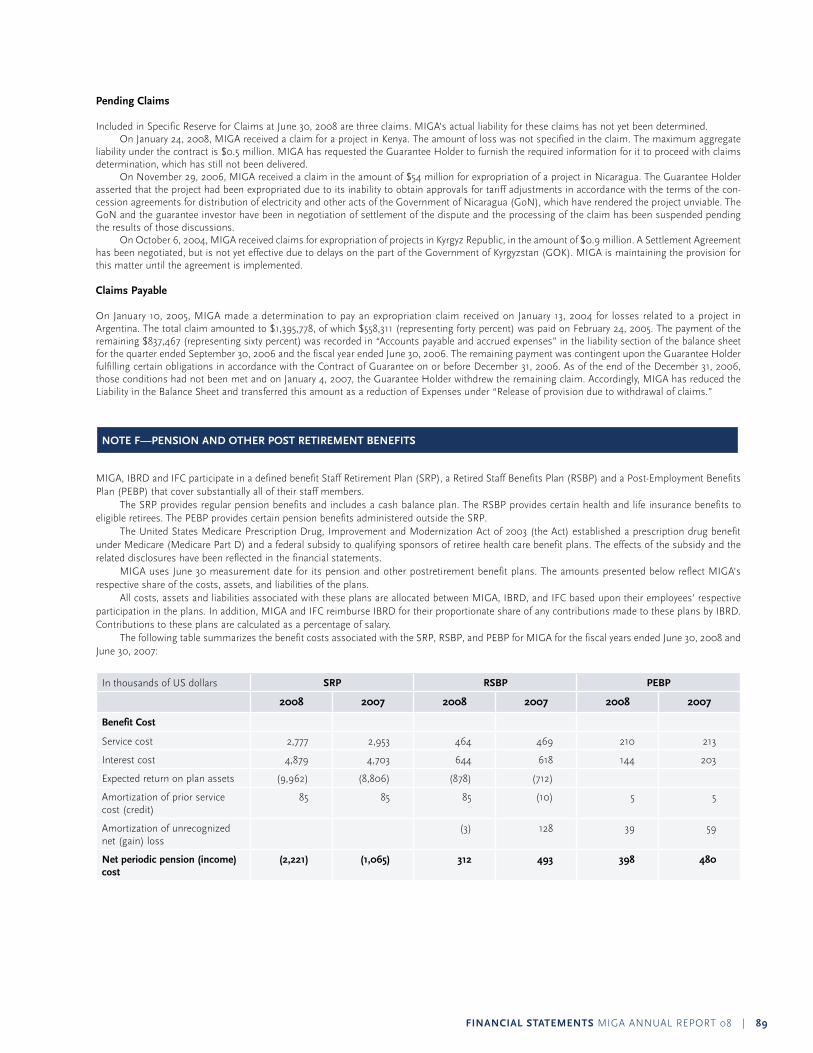
Pending Claims
Included in specific Reserve for Claims at June 30, 2008 are three claims. MIGA’s actual liability for these claims has not yet been determined. on January 24, 2008, MIGA received a claim for a project in Kenya. the amount of loss was not specified in the claim. the maximum aggregate liability under the contract is $0.5 million. MIGA has requested the Guarantee Holder to furnish the required information for it to proceed with claims determination, which has still not been delivered. on november 29, 2006, MIGA received a claim in the amount of $54 million for expropriation of a project in nicaragua. the Guarantee Holder asserted that the project had been expropriated due to its inability to obtain approvals for tariff adjustments in accordance with the terms of the con-cession agreements for distribution of electricity and other acts of the Government of nicaragua (Gon), which have rendered the project unviable. the Gon and the guarantee investor have been in negotiation of settlement of the dispute and the processing of the claim has been suspended pending the results of those discussions. on october 6, 2004, MIGA received claims for expropriation of projects in Kyrgyz Republic, in the amount of $0.9 million. A settlement Agreement has been negotiated, but is not yet effective due to delays on the part of the Government of Kyrgyzstan (GoK). MIGA is maintaining the provision for this matter until the agreement is implemented.
Claims Payable
on January 10, 2005, MIGA made a determination to pay an expropriation claim received on January 13, 2004 for losses related to a project in Argentina. the total claim amounted to $1,395,778, of which $558,311 (representing forty percent) was paid on February 24, 2005. the payment of the remaining $837,467 (representing sixty percent) was recorded in “Accounts payable and accrued expenses” in the liability section of the balance sheet for the quarter ended september 30, 2006 and the fiscal year ended June 30, 2006. the remaining payment was contingent upon the Guarantee Holder fulfilling certain obligations in accordance with the Contract of Guarantee on or before December 31, 2006. As of the end of the December 31, 2006, those conditions had not been met and on January 4, 2007, the Guarantee Holder withdrew the remaining claim. Accordingly, MIGA has reduced the liability in the Balance sheet and transferred this amount as a reduction of expenses under “Release of provision due to withdrawal of claims.”
NOtE F—PENsiON ANd OthER POst REtiREMENt BENEFits
MIGA, IBRD and IFC participate in a defined benefit staff Retirement plan (sRp), a Retired staff Benefits plan (RsBp) and a post-employment Benefits plan (peBp) that cover substantially all of their staff members. the sRp provides regular pension benefits and includes a cash balance plan. the RsBp provides certain health and life insurance benefits to eligible retirees. the peBp provides certain pension benefits administered outside the sRp. the united states Medicare prescription Drug, Improvement and Modernization Act of 2003 (the Act) established a prescription drug benefit under Medicare (Medicare part D) and a federal subsidy to qualifying sponsors of retiree health care benefit plans. the effects of the subsidy and the related disclosures have been reflected in the financial statements. MIGA uses June 30 measurement date for its pension and other postretirement benefit plans. the amounts presented below reflect MIGA’s respective share of the costs, assets, and liabilities of the plans. All costs, assets and liabilities associated with these plans are allocated between MIGA, IBRD, and IFC based upon their employees’ respective participation in the plans. In addition, MIGA and IFC reimburse IBRD for their proportionate share of any contributions made to these plans by IBRD. Contributions to these plans are calculated as a percentage of salary. the following table summarizes the benefit costs associated with the sRp, RsBp, and peBp for MIGA for the fiscal years ended June 30, 2008 and June 30, 2007:
In thousands of us dollars SrP rSbP PEbP
2008 2007 2008 2007 2008 2007
Benefit Cost
service cost 2,777 2,953 464 469 210 213
Interest cost 4,879 4,703 644 618 144 203
expected return on plan assets (9,962) (8,806) (878) (712)
Amortization of prior service cost (credit)
85 85 85 (10) 5 5
Amortization of unrecognized net (gain) loss
(3) 128 39 59
Net periodic pension (income)cost
(2,221) (1,065) 312 493 398 480
FiNANCiAl stAtEMENts MIGA AnnuAl RepoRt 08 | 89
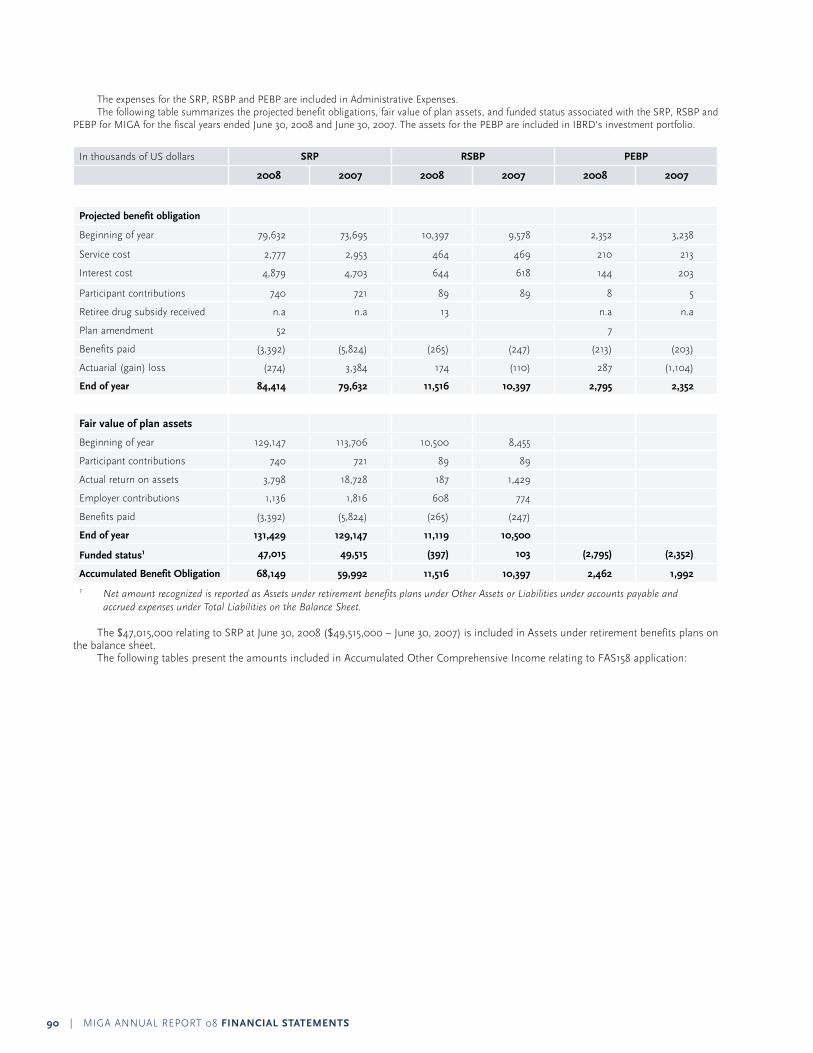
the expenses for the sRp, RsBp and peBp are included in Administrative expenses. the following table summarizes the projected benefit obligations, fair value of plan assets, and funded status associated with the sRp, RsBp and peBp for MIGA for the fiscal years ended June 30, 2008 and June 30, 2007. the assets for the peBp are included in IBRD’s investment portfolio.
In thousands of us dollars SrP rSbP PEbP
2008 2007 2008 2007 2008 2007
Projected benefit obligation
Beginning of year 79,632 73,695 10,397 9,578 2,352 3,238
service cost 2,777 2,953 464 469 210 213
Interest cost 4,879 4,703 644 618 144 203
participant contributions 740 721 89 89 8 5
Retiree drug subsidy received n.a n.a 13 n.a n.a
plan amendment 52 7
Benefits paid (3,392) (5,824) (265) (247) (213) (203)
Actuarial (gain) loss (274) 3,384 174 (110) 287 (1,104)
End of year 84,414 79,632 11,516 10,397 2,795 2,352
Fair value of plan assets
Beginning of year 129,147 113,706 10,500 8,455
participant contributions 740 721 89 89
Actual return on assets 3,798 18,728 187 1,429
employer contributions 1,136 1,816 608 774
Benefits paid (3,392) (5,824) (265) (247)
End of year 131,429 129,147 11,119 10,500
Funded status1 47,015 49,515 (397) 103 (2,795) (2,352)
Accumulated Benefit Obligation 68,149 59,992 11,516 10,397 2,462 1,992
1 Net amount recognized is reported as Assets under retirement benefits plans under Other Assets or Liabilities under accounts payable and accrued expenses under Total Liabilities on the Balance Sheet.
the $47,015,000 relating to sRp at June 30, 2008 ($49,515,000 – June 30, 2007) is included in Assets under retirement benefits plans on the balance sheet. the following tables present the amounts included in Accumulated other Comprehensive Income relating to FAs158 application:
90 | MIGA AnnuAl RepoRt 08 FiNANCiAl stAtEMENts

In thousands of us dollars
sRP RsBP PEBP total
Amounts included in Accumulated Other Comprehensive income in fiscal year ended June 30, 2008
net actuarial (gain) loss (20,880) 713 981 (19,186)
prior service cost 453 182 33 668
Net amount recognized in Accumulated Other Comprehensive (income)/loss
(20,427) 895 1,014 (18,518)
Amounts included in Accumulated Other Comprehensive income in fiscal year ended June 30, 2007
net actuarial (gain) loss (26,770) (155) 733 (26,192)
prior service cost 486 267 31 784
Net amount recognized in Accumulated Other Comprehensive (income)/loss
(26,284) 112 764 (25,408)
the estimated amounts that will be amortized from Accumulated other Comprehensive Income into net periodic benefit cost in the fiscal year ending June 30, 2009 are as follows:
In thousands of us dollars
sRP RsBP PEBP total
net actuarial loss — 39 110 149
prior service cost 90 85 6 181
Amount to be amortized into net periodic benefit cost
90 124 116 330
FiNANCiAl stAtEMENts MIGA AnnuAl RepoRt 08 | 91
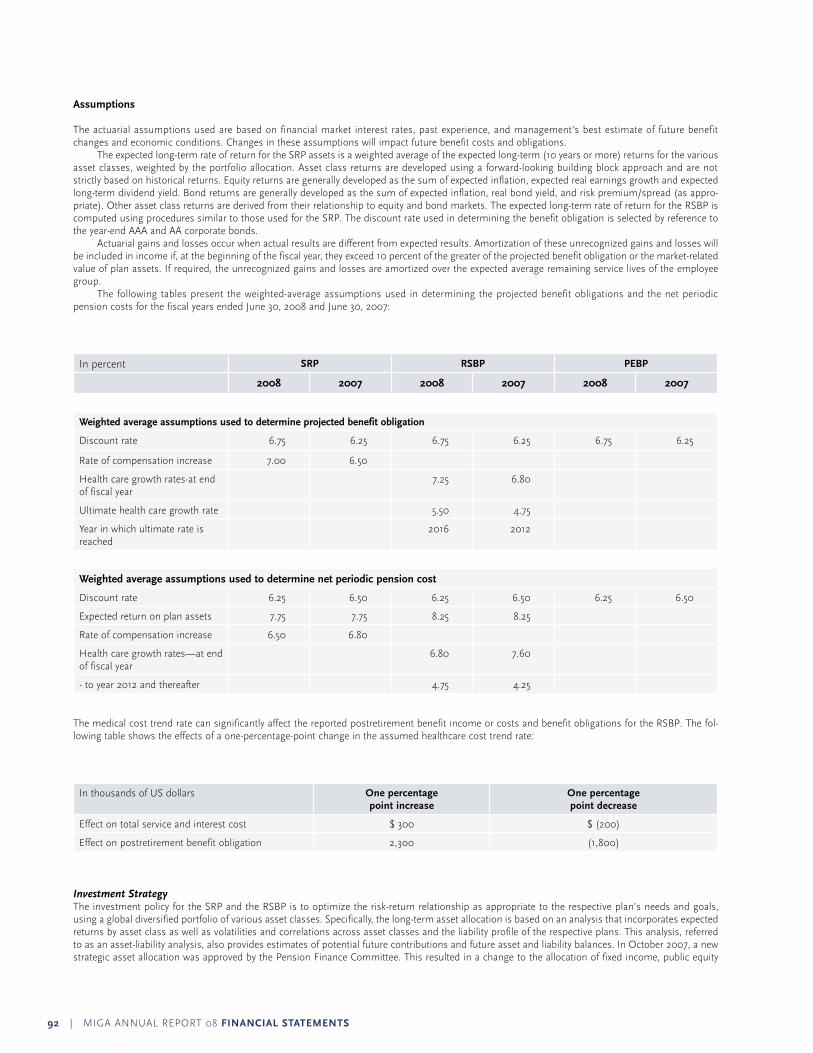
Assumptions
the actuarial assumptions used are based on financial market interest rates, past experience, and management’s best estimate of future benefit changes and economic conditions. Changes in these assumptions will impact future benefit costs and obligations. the expected long-term rate of return for the sRp assets is a weighted average of the expected long-term (10 years or more) returns for the various asset classes, weighted by the portfolio allocation. Asset class returns are developed using a forward-looking building block approach and are not strictly based on historical returns. equity returns are generally developed as the sum of expected inflation, expected real earnings growth and expected long-term dividend yield. Bond returns are generally developed as the sum of expected inflation, real bond yield, and risk premium/spread (as appro-priate). other asset class returns are derived from their relationship to equity and bond markets. the expected long-term rate of return for the RsBp is computed using procedures similar to those used for the sRp. the discount rate used in determining the benefit obligation is selected by reference to the year-end AAA and AA corporate bonds. Actuarial gains and losses occur when actual results are different from expected results. Amortization of these unrecognized gains and losses will be included in income if, at the beginning of the fiscal year, they exceed 10 percent of the greater of the projected benefit obligation or the market-related value of plan assets. If required, the unrecognized gains and losses are amortized over the expected average remaining service lives of the employee group. the following tables present the weighted-average assumptions used in determining the projected benefit obligations and the net periodic pension costs for the fiscal years ended June 30, 2008 and June 30, 2007:
In percent SrP rSbP PEbP
2008 2007 2008 2007 2008 2007
Weighted average assumptions used to determine projected benefit obligation
Discount rate 6.75 6.25 6.75 6.25 6.75 6.25
Rate of compensation increase 7.00 6.50
Health care growth rates-at end of fiscal year
7.25 6.80
ultimate health care growth rate 5.50 4.75
year in which ultimate rate is reached
2016 2012
Weighted average assumptions used to determine net periodic pension cost
Discount rate 6.25 6.50 6.25 6.50 6.25 6.50
expected return on plan assets 7.75 7.75 8.25 8.25
Rate of compensation increase 6.50 6.80
Health care growth rates—at end of fiscal year
6.80 7.60
- to year 2012 and thereafter 4.75 4.25
the medical cost trend rate can significantly affect the reported postretirement benefit income or costs and benefit obligations for the RsBp. the fol-lowing table shows the effects of a one-percentage-point change in the assumed healthcare cost trend rate:
In thousands of us dollars One percentage point increase
One percentage point decrease
effect on total service and interest cost $ 300 $ (200)
effect on postretirement benefit obligation 2,300 (1,800)
Investment Strategy the investment policy for the sRp and the RsBp is to optimize the risk-return relationship as appropriate to the respective plan’s needs and goals, using a global diversified portfolio of various asset classes. specifically, the long-term asset allocation is based on an analysis that incorporates expected returns by asset class as well as volatilities and correlations across asset classes and the liability profile of the respective plans. this analysis, referred to as an asset-liability analysis, also provides estimates of potential future contributions and future asset and liability balances. In october 2007, a new strategic asset allocation was approved by the pension Finance Committee. this resulted in a change to the allocation of fixed income, public equity
92 | MIGA AnnuAl RepoRt 08 FiNANCiAl stAtEMENts

and alternatives. In addition, three new alternative asset classes were introduced: timber, infrastructure and commodities. the new investment policy is reflected in the table below. plan assets are managed by external investment managers and monitored by IBRD’s pension investment department. the pension plan assets are invested in diversified portfolios of public equity, fixed income, and alternative investments. the following table presents the asset allocation as of June 30, 2008 and June 30, 2007 and the respective target allocation by asset category for the sRp and RsRp:
In percent sRP RsBP
target Allocation (%) % of Plan Assets target
Allocation (%) % of Plan Assets
2008 2008 2007 2008 2008 2007
Asset Class
Fixed Income 26 33 40 30 30 30
public equity 14 23 32 30 27 32
Alternative Investments 60 44 28 40 43 38
total 100 100 100 100 100 100
Alternative investments include:
private equity 15 14.8 10.5 28 20 14.3
Real estate 12.5 7.3 5.7 18 6.1 5.0
Hedge Funds & Active overlay 25 18.5 11.2 23 16.9 18.3
timber 2.5 0.2 n.a. n.a. n.a. n.a.
Infrastructure 2.5 0.5 n.a n.a n.a n.a
Commodities 2.5 2.6 n.a n.a n.a n.a
Estimated Future Benefits Payments
the following table shows the benefit payments expected to be paid in each of the next five years and subsequent five years. the expected benefit payments are based on the same assumptions used to measure the benefit obligation at June 30, 2008.
In thousands of us dollars sRP RsBP PEBP
Before Medicare Part
d subsidy
Medicare Part d subsidy
July 1, 2008—June 30, 2009 $ 3,579 $ 216 $ 5 $ 194
July 1, 2009—June 30, 2010 4,007 249 5 204
July 1, 2010—June 30, 2011 4,250 283 5 216
July 1, 2011—June 30, 2012 4,561 320 6 233
July 1, 2012—June 30, 2013 4,993 364 7 247
July 1, 2013—June 30, 2018 30,239 2,581 48 1,530
Expected Contributions
MIGA’s contribution to the sRp and RsBp varies from year to year, as determined by the pension Finance Committee, which bases its judgment on the results of annual actuarial valuations of the assets and liabilities of the sRp and RsBp. the best estimate of the amount of contributions expected to be paid to the sRp and RsBp for MIGA during the fiscal year beginning July 1, 2008 is $627,000 and $400,000, respectively.
FiNANCiAl stAtEMENts MIGA AnnuAl RepoRt 08 | 93

NOtE g—sERViCE ANd sUPPORt FEE
MIGA contributes its share of the World Bank Group’s corporate costs which include the Council of Governors and the Board of Directors, the president’s office, the Corporate secretariat, the Internal Auditing Department, the Department of Institutional Integrity, and the Conflict Resolution services. In addition, MIGA obtains certain administrative and support services from IBRD in those areas where services can be most efficiently provided by IBRD. these include human resources, information systems, and administrative services as well as investment management and treasury operations. payments for these services are made by MIGA to IBRD based on negotiated fees, charge backs and allocated charges where charge back is not feasible. total fees paid by MIGA to IBRD for the fiscal year ended June 30, 2008 was $6,180,800 ($6,394,000 – June 30, 2007).
NOtE h—FAiR VAlUE MEAsUREMENt
Fair value is defined as the price that would be received to sell a financial asset or paid to transfer a financial liability in an orderly transaction between market participants at the measurement date. MIGA uses observable market data, when available, and minimizes the use of unobservable inputs when determining fair value. the fair values of MIGA’s cash and non-negotiable, non interest-bearing demand obligations approximate their carrying values. the fair values of government obligations are based on quoted market prices and the fair values of asset backed securities are based on pricing models for which market observable inputs are used. the degree to which management judgment is involved in determining the fair value of a financial instrument is dependent upon the availability of quoted market prices or observable market parameters. For financial instruments that trade actively and have quoted market prices or observable market parameters, there is minimal subjectivity involved in measuring fair value. substantially all of MIGA’s financial instruments use either of the foregoing methodologies to determine fair values that are recorded on its financial statements. the fair values are only indicative of individual financial instrument values and should not be considered an indication of MIGA’s fair value.
NOtE i—RisK MANAgEMENt
the responsibility for approving MIGA’s risk management policies lies with the Board of Directors. the Audit Committee of the Board deals with risk management issues. While the executive vice president assumes the responsibility for overall risk management with the support of the senior management team, the responsibility for the design and operational implementation of the risk management framework lies with the Finance and Risk Management Group with coordination from the legal Affairs and Claims Group, the operations Group and the economics and policy Group.
Risk CategoriesMIGA is exposed to a variety of risks and uses risk management programs such as an economic Capital Framework, and reinsurance arrangements to manage its risk. Below is a description of risk management systems of the important risks for MIGA.
insurance Risk political risk assessment forms an integral part of MIGA’s underwriting process, and includes the analysis of both country-related and project-related risks. Insurance risk arises from MIGA’s core business of issuing investment guarantees. MIGA’s earnings depend upon the extent to which claims experience is consistent with assumptions used in setting prices for products and establishing technical provisions and liabilities for claims. If actual claims experience of the agency is less favorable than underlying assumptions, then income would be reduced. MIGA monitors claim activities and provisions for pending claims. In order to prevent excessive risk concentration, MIGA sets exposure limits per country and per project. MIGA uses an economic Capital model to evaluate concentration risk in MIGA’s guarantee portfolio and to support decision making in pricing new large projects, or new projects in countries with large exposure. Its reinsurance program, including treaty and facultative reinsurance, helps manage the risk profile of the portfolio.
Credit Risk Counter-party credit risk in MIGA’s portfolio is the risk that reinsurers would fail to pay their share of a claim. MIGA requires that private sector reinsurers, with which it conducts business, be rated by at least two of the four major rating agencies (standard & poor’s, A.M. Best, Moody’s and Fitch), and that the ratings be above a minimum threshold. Also, MIGA has established limits at both the project and portfolio levels, which restrict the amount of reinsurance. At present MIGA’s investment portfolio does not have any significant credit risk exposure. MIGA currently invests in fixed income securities with high credit quality. the Investment Authorization stipulates that government or agency sponsored debt securities be AA-rated or above, time deposits be A-rated or above, and corporate debt securities be AAA-rated.
interest Rate Risk Interest rate changes affect the market values of MIGA’s invested assets. A need to liquidate assets to pay for claims in an unfa-vorable interest rate environment may generate trading losses and reduce investment income. Changes in interest rates will also affect prepayment speeds of mortgage and asset backed security holdings, which may affect the duration of the asset portfolio. A 100 basis point parallel shift in the yield curve could impact the net income in Fy08 by approximately $9.6 million (Fy07: $8.1 million). this interest rate sensitivity is illustrative only and is based on simplified scenarios. the impact of a parallel shift in interest rates is determined using market value weighted portfolio duration applied to invested asset balance at year end.
Foreign Exchange Rate Risk the majority of MIGA’s assets and contingent liabilities are denominated in usD, but some guarantee contracts are issued in other currencies such as euR. to the extent that a claim is made in a non-usD currency and requires payment in excess of MIGA’s holdings
94 | MIGA AnnuAl RepoRt 08 FiNANCiAl stAtEMENts

of that currency, MIGA may face a foreign exchange related loss in converting to the needed currency to pay for a claim. A 10% change in the usD/euro year end exchange rate could impact the net income in Fy08 by approximately $12.3 million (Fy07: $9.4 million) and net guarantee exposure by approximately $74.0 million (Fy07: $67.2 million). this foreign exchange rate sensitivity is illustrative only and is based on simplified scenarios.
Operational Risk operational risk is intrinsic to financial institutions and is an important component of the agency-wide risk management framework. the most important types of operational risk involve breakdowns in internal controls and corporate governance. MIGA attempts to mitigate operational risks by maintaining a sound internal control system. since 2000, MIGA has adopted Coso inte-grated internal control framework, in line with IBRD/IDA and IFC, to regularly evaluate the effectiveness of internal control system. In addition, MIGA has introduced an operational risk management system to strengthen monitoring of the operational risks and controls in the financial reporting process, and the effectiveness of key controls in the financial reporting process are assessed through the internal quality assurance review process. In Fy08 MIGA conducted Coso Risk & opportunity workshops and actions are being taken to address the recommendations. MIGA’s internal control system is regularly evaluated through independent review by the Internal Audit Department (IAD) of the World Bank Group. Most recently, MIGA’s entity level Controls were reviewed by IAD. MIGA Management has been following up on the recommendations for further improvement of internal controls in these areas. With regard to information technology, all MIGA Information systems and applications are hosted on the IBRD technology infrastructure that is configured and adherent to the information security policy and procedures of the World Bank Group. In addition, increased collaboration with the World Bank has allowed MIGA to gain access to a larger pool of specialized skill sets to support the agency’s information systems. MIGA’s client relationship management system (MIGA CRM) is fully integrated with the agency’s core financial system (Guarantee Database). Its content is reviewed and verified against an external AMl/CFt database service. In addition, MIGA is currently undergoing a redesign of its core information system for managing and reporting data for activities supporting the guarantee process and its migration to a more robust sAp-based platform. the replacement system will allow for a more efficient and reliable database functionality to manage all key guarantee data, and enable the entire underwriting process to be done online. this is intended to be more efficient and to enhance the quality and the ability to share information internally and externally with the World Bank Group. For business continuity, MIGA’s corporate web services have now been added to MIGA’s information systems already hosted at the World Bank Group’s Business Continuity Center. In addition, MIGA departments have further documented their business processes required to support the agency’s effort to re-establish basic operations following a crisis. For data security, more robust reporting functions and security monitoring have been implemented to further enhance MIGA’s information security.
legal Risk legal risks arise primarily from changes in the legal parameters of MIGA’s member countries as a result of legislation or court decisions that may affect MIGA’s activities. there are also legal risks associated with MIGA being involved in legal disputes and arbitration pro-ceedings, especially in the context of claim resolution or settlement. MIGA manages these risks by monitoring current and prospective future developments by way of ongoing discussions with member countries’ representatives on the Board of Directors and Council of Governors. MIGA also shares information and analyses with other members of the World Bank Group, the IMF and the united nations. In addition, MIGA actively participates as a member of the Berne union in discussions and analyses of the changes in the operating investment environment in its member countries.
Economic Capital and Portfolio Risk Modeling For portfolio risk management purposes, MIGA currently utilizes an economic Capital Model, based on the latent factor model of the Merton framework in credit risk modeling. the economic Capital (eC) concept is a widely recognized risk management tool in the banking and insurance industries, defining the amount of capital an organization needs to hold in order to sustain larger than expected losses with a high degree of certainty, over a defined time horizon and given the risk exposure and defined risk tolerance. MIGA defines its economic capital as the 99.99th percentile of the aggregate loss distribution over a one year horizon, minus the mean of the loss distribution, which is in line with industry practice. the model helps evaluate concentration risk in the guarantee portfolio and facilitates active, risk-based exposure management by allocating the economic Capital to particular regions, countries, sectors, covers, or individual contracts, based on their respective risk contribution. MIGA employs the eC model to manage its insurance portfolio risks as the cornerstone of its capital adequacy framework. In addition, it provides the analytical basis for risk-based pricing of its products as well as quantification of the need for prudent technical provisions for claims and liquidity holdings. An extensive review of MIGA’s eC and pricing models was completed in the first quarter of Fy08, with the objective to validate critical parameters and to fully integrate the two models. this helps ensure consistency between pricing, portfolio exposure management, and provisioning. Moreover, beginning in Fy08, eC-based risk measures are combined with exposure and income information for a compre-hensive portfolio overview report prepared for MIGA management on a monthly basis.
FiNANCiAl stAtEMENts MIGA AnnuAl RepoRt 08 | 95