maintaining momentum - home | unite group › ...03 › ...presentation1-2018.pdf · maintaining...
TRANSCRIPT

Maintaining Momentum
Preliminary Results
Year ended 31 December 2018
Staniforth House, Birmingham

High-quality earnings and strong capital structure
- EPRA earnings up 25%
o Dividend increased 28%, 85% payout ratio
- 13% total accounting return
- LTV of 29%
Sustainable growth in earnings and cash flows
- 90% of portfolio aligned to strongest Universities
- 60% nominations, 6 years duration
- Rental growth and secured pipeline adds 13p to 17p on completion
- Significant progress with University partnerships, two deals and 10 active discussions
- Operating platform and further efficiencies underpin 74% EBIT margin target by 2021
Supportive market dynamics
- Student demand robust
- Record reservations for 19/20 academic year
- Confident in rental growth outlook of 3.0 - 3.5%
1
ANOTHER SUCCESSFUL YEAR
31 Dec
2018
31 Dec
2017Change
EPRA earnings £88.4m £70.5m +25%
EPRA EPS 34.1p 30.3p +13%
Dividend per share 29.0p 22.7p +28%
EPRA NAVps 790p 720p +10%
Total accounting
return13% 14%
Loan to value 29% 31%
EBIT margin 71% 68%
Reservations* 75% 75%
Source: Unite* Reservations as at date of results announcement

PERFORMANCE HIGHLIGHTS

45% 45% 40% 36%
41% 43% 50% 55%
0%
20%
40%
60%
80%
100%
2016 2017 2018 Post pipeline &
disposalsMedium High
3.3%3.8% 3.8%
3.4% 3.2%
99% 98% 98% 99% 98%
0%
20%
40%
60%
80%
100%
0%
1%
2%
3%
4%
5%
2014 2015 2016 2017 2018
Rental Growth (LHS) Occupancy (RHS)
3
Strong sales performance
- 98% occupancy for 2018/19 with 3.2% rental growth
- 75% reserved for 2019/20 (2018/19: 75%)
- Confident in rental growth outlook of 3.0 - 3.5%
High-quality portfolio in best locations
- 90% aligned to strongest Universities
- Three new nominations with top-25 Universities
Market-leading operating platform
- Record results in student and University surveys
- Technology enabling more efficient check-in and summer turnaround
- Enhancing asset utilisation
Platform driving sector-leading efficiency
- Delivered 75% NOI margin and 30bps efficiency target
- 74% EBIT target by the end of 2021
BUSINESS IN STRONG POSITION
Five-year occupancy and rental growth
University alignment by tariff group
Source: Unite
Source: Unite, 2019 Times rankings

727
814
26%
28%
30%
32%
34%
36%
38%
600
650
700
750
800
850
20
13
20
14
20
15
20
16
20
17
20
18
20
19
F
20
20
F
20
21
F
20
22
F
20
23
F
20
24
F
20
25
F
(00
0s)
18-year-old population (LHS) Participation rate (RHS)
4
UK Higher Education sector performing well
- Adapting to political change
- Consistently strong in global league tables
Overall student numbers at record levels
- 2018/19 intake 533,000 (696,000 applications)
o Record participation rate
- 2019/20 applications up 0.4% with stronger growth for core customer segments
Medium-term outlook is positive
- Participation rates growing
- More 2nd and 3rd years in PBSA
- Demographic decline reverses rapidly from 2021
o Potential c.80,000 additional students by 2025
Funding Review supports alignment to higher-quality Universities
MARKET REMAINS SUPPORTIVE
YoY change in applications by age and domicile(15 January deadline)
UK 18-year-old population and participation rate
Source: ONS, UCAS, Unite
Change in
applications% YoY
UK 18yr-olds +2,610 +1.0%
All other UK -5,845 -3.1%
Other EU +380 +0.9%
Non EU +5,250 +9.0%
+2,395 0.4%
Source: UCAS

0 5 10 15 20 25
King's College London
University of Portsmouth
University of Bristol
University College London
Aston University
Sheffield Hallam University
Coventry University
De Montfort University
University of Leeds
University of West England
£m
LengthBeds
(2018/19)
% income
(2018/19)
% income
(2017/18)
Single year 7,543 24% 29%
2-10 years 13,437 49% 44%
11-20 years 4,026 14% 14%
20+ years 4,099 13% 13%
29,105 100% 100%
5
Improved quality of income
- 60% of 2018/19 beds guaranteed by nominations
- 5.3% YoY growth in nominations income due to improvements in mix and location
- Index-linked rental growth from 76% of
nominations (up from 71%)
Significant progress with University partnerships
- Growing appetite from high-quality Universities
- Two new deals in 2018
On track to secure 1-2 new partnerships per year
- Further pipeline emerging – 10 active discussions
o Includes two Bristol sites in secured pipeline
- Unite increasingly viewed as a strategic partner for accommodation needs
UNIVERSITY PARTNERSHIPS DELIVERING
Source: Unite
Source: Unite
Nominations agreements
Top 10 nominations by income (2018/19)

57%
11%
8%
11%
7%
3%
2%
0% 20% 40% 60% 80% 100% 120% 140% 160% 180% 200% 220% 240% 260% 280% 300%
Nominations
Rebookers
International
Undergraduate
Postgraduate
UK & EU
Undergraduate
Summer income /
short-term lets
UK EU
6
% of income% of beds
2019 2020+
60% 5.3% YoY income growth RPI+ linked contracts
76% multi-year agreements
40%
Robust, consistent demand
Record customer satisfaction
More 2nd and 3rd year students
HMO market share under pressure
Applications +9.0% YoY
Strong growth from China
Global HE reputation supportive of future growth
Growth in international students
11% growth in FT postgraduate students in past two years (HESA)
18% of full-time UK students
Ability to tailor offer
Applications +1.0% YoY for core 18-year-old UK customer
Unchanged EU fee status
18-year-old population returns to growth from 2021
20-25% decline in EU students
n/a Targeting YoY growth
Widening hotel trials
Improving utilisation
Target of 5-6% of income
HIGH LEVEL OF INCOME VISIBILITY
Source: Unite1. Based on total Unite income, including 100% of USAF and LSAV 2. 2018 data using breakdown of nominations and direct-let customers for 2018/19 academic year3. Nominations also includes commercial income (c.1%)4. Income figures are rounded

FINANCIAL REVIEW

8
STRONG FINANCIAL PERFORMANCE
31 Dec 2018 31 Dec 2017 % change
Income
EPRA earnings £88.4m £70.5m 25%
EPRA EPS 34.1p 30.3p 13%
Dividend per share 29.0p 22.7p 28%
Balance sheet
EPRA NAVps 790p 720p 10%
Loan to value 29% 31% 2%
Cash flow
Operations cash flow £81.2m £63.2m 28%
Metrics
Total accounting return 13% 14%
EPRA EPS yield 4.7% 4.7%
Source: Unite

9
31 Dec 2018£m
31 Dec 2017 £m
Rental income 188.3 170.8
Property operating expenses (48.0) (44.3)
Net operating income (NOI) 140.3 126.5
NOI margin 75% 74%
Management fees 15.6 14.1
Operating expenses (21.7) (24.6)
Finance costs (40.0) (45.2)
USAF acquisition and net performance fees - 4.3
Development and other costs (5.8) (4.6)
EPRA earnings 88.4 70.5
EPRA EPS 34.1p 30.3p
EBIT margin 71% 68%
EARNINGS GROWTH MOMENTUM MAINTAINED
Source: Unite

25p29p
34p
47p - 51p
2p -3p
1p - 2p12p - 15p 2p - 3p
0p
5p
10p
15p
20p
25p
30p
35p
40p
45p
50p
55p
2016 EPS 2017 EPS 2018 EPS 2018 new
openings
Pipeline
growth
Future rental
growth
Disposals Illustrative
EPS post-
pipeline and
disposals
EPS
EARNINGS GROWTH OUTLOOK
Earnings growth prospects supported by:
- High-quality development programme
- Positive rental growth outlook and operating efficiencies
- Pro forma LTV of 35% post-pipeline and disposals
Note: Illustrative earnings progression demonstrating building blocks of growth (not a profit forecast)
Assumptions:- Development pipeline delivered in line with forecast- Rental growth of 2-4% p.a.- Efficiency targets delivered, then increase with inflation- Future disposals of £100-150m- 2016, 2017 and 2018 EPS excludes performance fee- Pro forma LTV includes forecast NAV upside remaining on pipeline but no revaluation of rental properties
10

0
50
100
150
200
250
300
350
400
450
2018 2019 2020 2021 2022 2023 2024 2025 2026 2027 2028
Group Funds
11
Strong debt position
- Diversified sources and balanced maturity profile
- Limited refinancing requirements before 2022
- Cost of debt 3.6% when fully drawn
Investment grade corporate rating maintained
- BBB from S&P and Baa2 from Moody’s
- £275 million unsecured 10-year bond
- 75% of facilities are unsecured
LTV reduced to 29% (2017: 31%)
Leverage targets maintained
- Accelerating disposals to maintain discipline
- Target LTV range of mid-30%s
- Net debt:EBITDA range of 6.0x to 7.0x
Debt maturity profile
DISCIPLINED APPROACH TO LEVERAGE
£m
31 Dec
2018
31 Dec
2017
Net debt £856m £803m
LTV 29% 31%
Net debt:EBITDA ratio 6.1 6.5
Interest cover ratio 3.4 2.6
Cost of debt 3.8% 4.1%
Average debt maturity 5.8 years 5.3 years
Proportion investment
debt at a fixed rate99% 80%
Key debt statistics (Unite share)
0
Source: Unite
Source: Unite

USAF£m
LSAV£m
GAV 2,253 1,242
Net debt (562) (486)
Other assets/liabilities (31) (14)
NAV 1,660 741
Unite share of NAV 423 371
Total accounting return 8% 18%
Loan to value 25% 39%
Unite stake 25% 50%
Maturity Infinite 2022/2027
Unite fees in period
Asset/property management 10.2 3.0
Acquisition fees - -
10.2 3.0
12
Strong performance across USAF and LSAV
- LSAV’s higher total accounting return driven by stronger yield compression in London
USAF acquisitions
- Completed two forward funds in Durham
- Acquired investment asset in Edinburgh
- c.£100 million acquisition capacity
Asset management fee income
- Asset management fees reduced by disposals
Continuing support from co-investment partners
- Demand for units remains high
- £48 million of USAF units traded in 2018 at small premium to NAV
- No redemptions received
Summary financials
CO-INVESTMENT VEHICLES CONTINUING TO DELIVER
Source: Unite

PROPERTY REVIEW

1%
2%
3%
4%
5%
6%
7%
8%
2006 2008 2010 2012 2014 2016 2018
Unite Completed Portfolio IPD All Property NIY
10Yr Swap Rate Prime Regional PRS NIY
30%
7%
26%
7%
15%
15%
Private
UK backed operator
Overseas backed operator
REIT
Institutional
Overseas
14
VALUATIONS WELL SUPPORTED
Transactional volume remains strong
- Over £3 billion traded in 2018
- Wide range of portfolio deals and single-asset transactions
- Investor sentiment remains positive
Diverse investor base
- Existing operators looking to build scale
- New capital from overseas institutions
Unite valuations: 15bps compression
- 5.0% average yield (Unite share)
- Growing divergence in performance between
quality and weaker markets
- Valuations compare favourably to other residential uses
Valuation yields
Source: Unite, IPD, CBRE
2018 transactions by investor type
Source: Unite, CBRE

2.2%2.3%
2.9%
2.3%
3.2%
0%
1%
2%
3%
4%
Non En-suite Ensuite Studio Market Unite
Students
-200
-100
0
100
200
300
400
2011 2012 2013 2014 2015 2016 2017 2018
£m
Acquisitions Capex Disposals
2018/19 rental growth (Unite vs. market)
15
OPTIMISING PORTFOLIO PERFORMANCE
Continued rental growth outperformance
Improving portfolio quality through investment
- 3,074 new beds delivered in 2018 with around 50% let under nominations (WAULT of 10 years)
- Extending nomination agreements
Disposed over 13,000 beds since 2011
- £180 million sold in 2018 (£85 million Unite share)
o Exited two markets (Huddersfield and Plymouth)
- Intend to sell £100 - 150 million in 2019 (Unite share)
Continuing to target growth with partner Universities
- Focus on quality of location and affordability
- Emerging pipeline of development opportunities
- Acquisition capacity in USAF
Capital recycling activity (Unite share)
Source: Unite1. Acquisitions includes increased share of USAF through performance fees and units purchased in the secondary market
Source: Knight Frank Student Housing report

Target delivery
Secured beds
Total completed
value (£m)
Totaldevelopment
costs(£m)
Forecastyield
on cost
Wholly owned
Skelhorne Street, Liverpool 2019 1,085 95 74 8.0%
Tower North, Leeds 2020 928 104 81 8.0%
First Way, London 2020 678 122 102 6.0%
New Wakefield Street, Manchester 2020 603 81 56 8.2%
Total wholly owned 3,294 402 313 7.6%
University partnerships
Cowley Barracks, Oxford 2019 887 98 73 6.5%
Old BRI, Bristol1 2021 370 52 39 6.2%
Middlesex Street, London1 2021 960 250 193 6.3%
Temple Quay, Bristol1 2022 650 95 77 6.2%
Total University partnerships 2,867 495 382 6.3%
USAF – forward funds
Battery Park, Birmingham 2019 418 43 38 6.3%
Total USAF 418 43 38 6.3%
Unite share of USAF 418 11 10 6.3%
Total pipeline (Unite share) 6,579 908 705 7.0%
Pipeline 100% aligned to high and mid-ranked Universities
Secured pipeline of 6,579 beds to deliver by 2022
- 70% nominations on 2019 openings
Disciplined approach to new opportunities
- Run-rate of 1,500 - 2,500 beds p.a.
- Attractive opportunities in both London and regional markets
New supply slowing
- 20,000 - 25,000 beds in 2019
- Slowing from 2020, pipeline c.20,000 beds
Mitigating supply chain risks from Brexit
- Forward ordered all materials critical to delivery of 2019 completions
DEVELOPMENT PIPELINE
16
Source: Unite1 Subject to obtaining planning consent
OUTLOOK

Sustainable earnings growth
- Underpinned by portfolio and income quality, development pipeline, University partnerships and operating efficiency
Ongoing confidence despite uncertainty created
by Brexit and Higher Education funding review
- Aligned to the strongest Universities where intake continues to grow
- Value-for-money service
Significant progress and future opportunities with University partnerships
Robust balance sheet
- Discipline around capital allocation to new opportunities
WELL POSITIONED FOR FUTURE GROWTH
18
St Vincent’s Place, Sheffield

APPENDICES

0.5%
-1.7%
1.0%
-6.3%
-2.0%-3.1%
-4.4%
2.8%
0.9%
2.8%
6.5%
9.0%
-8%
-6%
-4%
-2%
0%
2%
4%
6%
8%
10%
2017/18 2018/19 2019/20*
UK 18yr-olds All other UK Other EU Non-EU
Total -2.6% -0.6% +0.4%
654 677 700 718 718 700 696
465 496 512 532 535 534 533
1,710 1,728 1,730 1,771 1,827 1,875 1,878
0
400
800
1,200
1,600
2,000
2012/13 2013/14 2014/15 2015/16 2016/17 2017/18 2018/19
Stu
de
nts
(00
0s)
Applicants Acceptances Full-Time Students
United States
28%
United Kingdom
12%
Australia
9%
France
7%
Germany
7%
Canada
5%
Japan
4%
Italy
3%
Netherlands
3%
Other
22%
20
Overall student numbers stable in 2018/19
2018 student intake broadly in line with 2017
- Excess of applications and higher participation rates offsetting 1% reduction in applications
- Demographic decline reverses from 2021
Encouraging applications data for 2019
- Stronger growth for core customer segments (UK 18-year-olds +1.0% and non-EU +9.0%)
International student demand remains strong
- UK remains 2nd most popular destination
- Reduction in EU demand due to Brexit equates to a c.1% decline in student numbers by 2022
Introduction of Teaching Excellent Framework
- Expected to influence student choice
STUDENT NUMBERS REMAIN STRONG
Full-time student numbers
Source: UCAS, HESA, Unite estimates
International student mobility
Source: Education at a Glance 2018, OECD
Place of study
for 3.5 million
international
students
YoY growth in applications
Source: UCAS
* As at 15 January deadline for 2019/20
1,728 1,730 1,771 1,827 1,875 1,878
682 699 713 727 731 739
487 503 527 553 580 603
0
200
400
600
800
1,000
1,200
1,400
1,600
1,800
2,000
2013/14 2014/15 2015/16 2016/17 2017/18 2018/19
Stu
de
nts
(0
00
s)
Total Students 1st Years + Internationals PBSA Beds
21
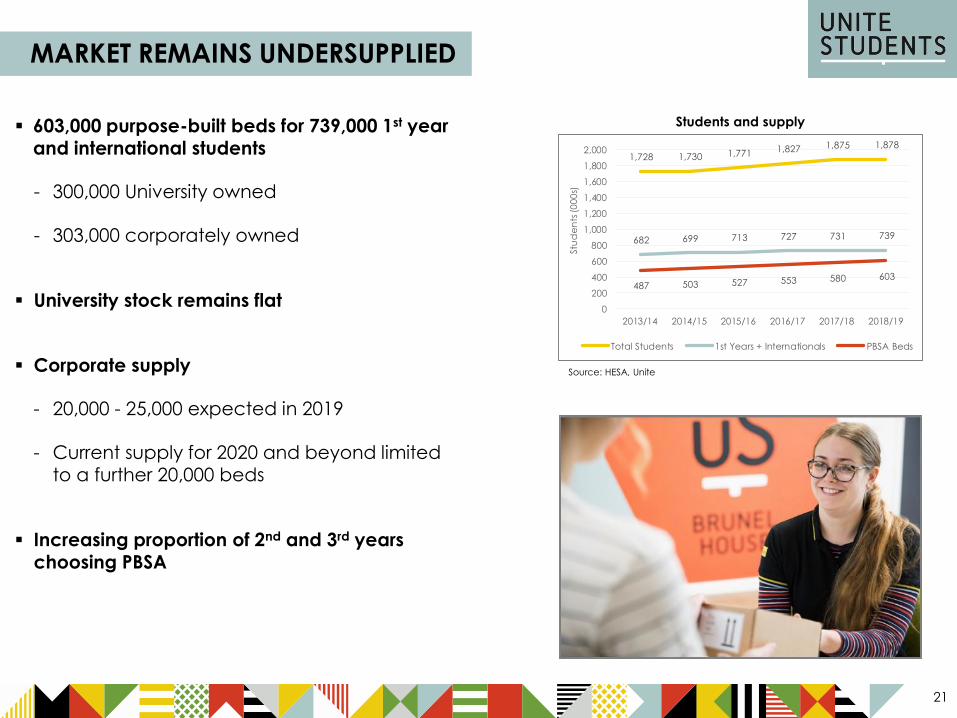
MARKET REMAINS UNDERSUPPLIED
603,000 purpose-built beds for 739,000 1st year and international students
- 300,000 University owned
- 303,000 corporately owned
University stock remains flat
Corporate supply
- 20,000 - 25,000 expected in 2019
- Current supply for 2020 and beyond limited to a further 20,000 beds
Increasing proportion of 2nd and 3rd years
choosing PBSA
Students and supply
Source: HESA, Unite

48
,81
5
28
,00
0
24
,00
0
23
,00
0
17
,00
0
15
,00
0
15
,00
0
12
,00
0
49
,60
6
24
,00
0
23
,00
0
23
,70
0
16
,50
0
14
,00
0
12
,50
0
12
,10
0
0
10,000
20,000
30,000
40,000
50,000
60,000
Unite iQ Liberty Living
(CPPIB)
CRM Student Roost
(Brookfield)
Homes for
Students
Watkins Jones Campus Living
Villages
Be
ds
2018 2017
Students living
at home,
360,000
Own residence,
75,000
Private-rented
housing, 810,000
University
owned PBSA,
300,000
Corporately
owned PBSA,
303,000
Other, 30,000
22
COMPETITIVE LANDSCAPE
Unite beds in development
Source: CBRE, Unite* Excludes UPP portfolio of 35,000 on-campus beds via University partnerships
6,5
79
1.87 million full-time students in the UK
- Around 1.5 million require accommodation
Over 800,000 students living in private-rented housing
- We see further opportunity in this area
Breakdown of accommodation for full-time students
Source: Unite estimates

23
All-inclusive pricing
- All utilities and services
- High-speed (70Mbps) Wi-Fi throughout our portfolio
- 24/7 customer support centre
- Free communal kitchen and bathroom cleaning
- ‘My Unite’ app
- Maintenance teams on hand
City-centre locations with range of price points
- Close to University campuses
- Flat shares and studios
- Range of products and price points
- Good transport links
Direct-let and University contracts
- Strong relationships with Universities
- Direct sales through website
- Unique online mobile-optimised booking system
- China office fully operational
HOME FOR SUCCESS
89%Of customers using
My Unite app
28KAverage monthly usage
of My Unite app87% increase YoY
1,000Staff trained in
student welfare
84%Of students viewed our
digital welfare guides

24
OUR TOP 10 MARKETS
2018
rank
CityCompleted beds
(18/19)
Full-time
student numbers
(17/18)
Market
Share
1 London 9,406 308,010 3.1%
2 Birmingham 4,508 69,090 6.5%
3 Sheffield 3,999 52,690 7.6%
4 Bristol 3,494 45,510 7.7%
5 Leeds 3,457 56,125 6.2%
6 Liverpool 3,015 62,490 4.8%
7 Portsmouth 2,706 20,525 13.2%
8 Manchester 2,336 84,040 2.8%
9 Leicester 1,687 38,360 4.4%
10 Edinburgh 1,684 55,185 3.1%
36,292 792,025 4.6%
Proportion of Unite portfolio 74%
Source: Unite, HESA
Bristol
Sheffield
Reading
Portsmouth
Loughborough
Liverpool
Aberdeen
Oxford
Newcastle
BirminghamLeicester
Bath
Bournemouth
Coventry
London
Nottingham
Leeds
Manchester
Durham
EdinburghGlasgow
Exeter

25
SUMMARY EPRA BALANCE SHEET AND INCOME STATEMENT
Wholly
owned
£m
USAF
(Unite share)
£m
LSAV
(Unite share)
£m
Unite Group
Dec 2018
£m
Unite Group
Dec 2017
£m
Balance sheet
Rental properties 1,497 567 621 2,685 2,379
Properties under development 279 3 - 282 216
Total property portfolio/GAV 1,776 570 621 2,967 2,595
Net debt (471) (142) (243) (856) (803)
Other assets/(liabilities) (14) (5) (7) (26) (52)
EPRA net assets 1,291 423 371 2,085 1,740
LTV 27% 25% 39% 29% 31%
Income statement 2018 2017
Net operating income 84.1 27.5 28.7 140.3 126.5
Overheads less management fees 0.9 (3.5) (3.5) (6.1) (10.5)
Finance costs (24.9) (6.2) (8.9) (40.0) (45.2)
Development/other (5.4) (0.2) (0.2) (5.8) (0.3)
EPRA earnings 54.7 17.6 16.1 88.4 70.5

26
31 December 2018
USAF LSAVWholly owned
Lease TotalUnite share
London Value (£m) 369 977 500 - 1,846 1,082
Beds 1,870 5,283 1,993 260 9,406 40%
Properties 6 12 6 1 25
Prime provincial Value (£m) 598 - 298 - 896 449
Beds 5,344 - 2,678 618 8,640 17%
Properties 18 - 7 2 27
Major provincial Value (£m) 1,062 266 409 - 1,737 811
Beds 13,597 3,067 5,329 1,210 23,203 30%
Properties 34 1 10 4 49
Provincial Value (£m) 212 - 290 - 502 343
Beds 2,688 - 3,819 1,059 7,566 13%
Properties 8 - 10 3 21
Total Value (£m) 2,241 1,242 1,497 - 4,981 2,685
Beds 23,499 8,350 13,819 3,147 48,815 100%
Properties 66 13 33 10 122
Unite ownership share 25.3% 50% 100% -
Value (£m) 567 621 1,497 - 2,685
PORTFOLIO ANALYSIS

Facility£m
Drawn£m
Maturity
Legal + General 114 114 2022
Mass Mutual 124 124 2024
Unsecured
Retail Bond 90 90 2020
HSBC/RBS 350 - 2023
Unsecured bond 275 275 2028
Total 953 603
Facility£m
Drawn£m
Maturity
USAF
Secured bond 690 690 2023-25
Wells Fargo 100 - 2021
Total 790 690
LSAV
Wells Fargo 250 250 2022
L&G 149 149 2022
Teachers RE 140 140 2027
Total 539 539
Co-investment vehiclesOn-balance sheet
DEBT FACILITIES
27

28
NNNAV
2018£m
2017£m
IFRS net assets 2,073 1,729
Mark to market on fixed rate debt (38) (55)
Realised swap gain (2) -
EPRA NNNAV 2,033 1,674
EPRA NNNAV per share 770p 692p

SECURED DEVELOPMENT AND PARTNERSHIPS PIPELINE
Target delivery
Secured beds
Total completed
value (£m)
Totaldevelopment
costs(£m)
Capex in2018(£m)
Capex remaining
(£m)
Forecast NAV remaining
(£m)
Forecastyield on cost
Wholly owned
Skelhorne Street, Liverpool 2019 1,085 95 74 30 19 8 8.0%
Tower North, Leeds 2020 928 104 81 23 58 16 8.0%
First Way, London 2020 678 122 102 39 63 10 6.0%
New Wakefield Street, Manchester 2020 603 81 56 8 36 13 8.2%
Total wholly owned 3,294 402 313 100 176 47 7.6%
University partnerships
Cowley Barracks, Oxford 2019 887 98 73 57 15 4 6.5%
Old BRI, Bristol1 2021 370 52 39 2 25 12 6.2%
Middlesex Street, London1 2021 960 250 193 7 186 57 6.3%
Temple Quay, Bristol1 2022 650 95 77 - 77 18 6.2%
Total University partnerships 2,867 495 382 66 303 91 6.3%
USAF
Battery Park, Birmingham 2019 418 43 38 - 29 2 6.3%
Total USAF 418 43 38 - 29 2 6.3%
Unite share of USAF 418 11 10 - 7 1 6.3%
Total pipeline (Unite share) 6,579 908 705 166 486 139 7.0%
Source: Unite1 Subject to obtaining planning consent
29