madhya pradesh - ibef
TRANSCRIPT
For updated information, please visit www.ibef.org September 2019
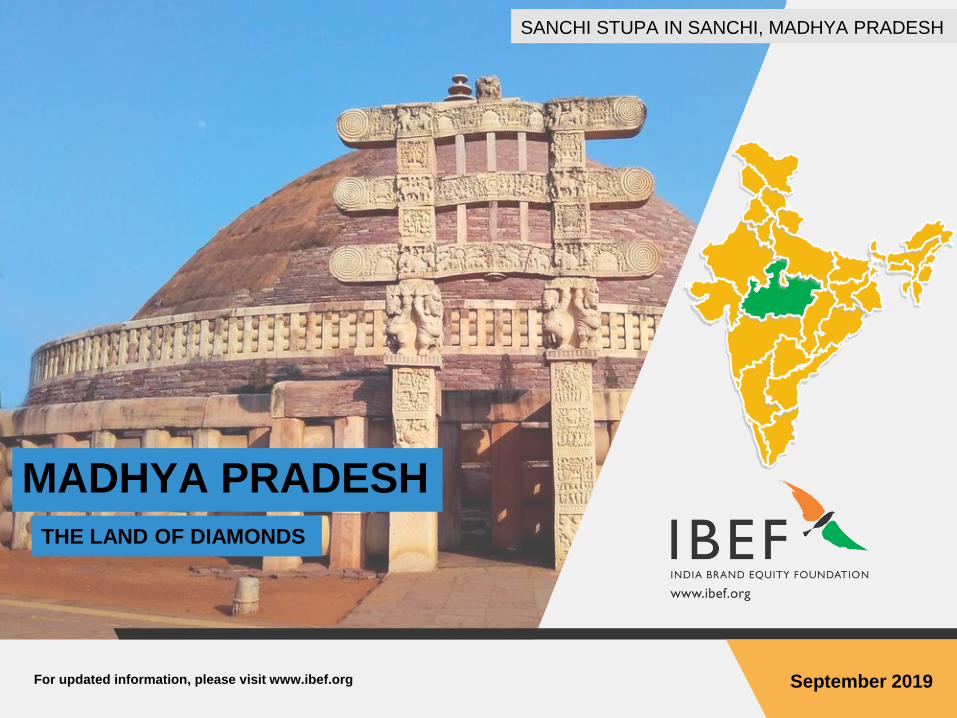
MADHYA PRADESH
THE LAND OF DIAMONDS
SANCHI STUPA IN SANCHI, MADHYA PRADESH
Table of Content
Executive Summary……………….…..…...…..3
Introduction…….…………………...…...……...4
Economic Snapshot…………………….….…..9
Physical Infrastructure….…...........................15
Social Infrastructure…………….….........……22
Industrial Infrastructure..................................25
Key Sectors…………………………….......…27
Key Procedures And Policies........................35
Annexure……………………......................…42
For updated information, please visit www.ibef.orgMADHYA PRADESH3
EXECUTIVE SUMMARY
GSDP of Madhya Pradesh grew at a Compound Annual Growth Rate (CAGR) of 17.00 per cent* between
FY12 and FY19.
The state is rich in natural resources: fuels, minerals, agriculture & biodiversity.
Madhya Pradesh has ample reserves of coal and coal-bed methane (8.77 per cent^ of India’s total coal reserves
and 218.04 BCM of methane).
The state has the largest reserves of diamond and copper in India.
Madhya Pradesh has significant reserves of limestone, manganese and dolomite.
Madhya Pradesh boasts of rich ancient cultural & religious heritage.
Due to a thick forest cover, the state has immense potential for wild life, adventure & eco-tourism.
Due to its centralised location, Madhya Pradesh has excellent connectivity. Many FMCG companies have
moved their warehouses here to save on logistics expenses.
Upcoming theme based SEZs near Jabalpur, industry parks in Indore & food parks at multiple locations aim
to promote sectoral growth.
MP is emerging as a solar power hub with an installed solar power capacity of 1,536.25 MW as of November
2018.
Source: Directorate of Economics and Statistics, Government of Madhya Pradesh; Ministry of Petroleum & Natural Gas, MNRE
Source: *in Rs terms
Strong economy
Rich in natural resources
Potential for tourism
Infrastructure support
MADHYA PRADESH
INTRODUCTION
For updated information, please visit www.ibef.orgMADHYA PRADESH5
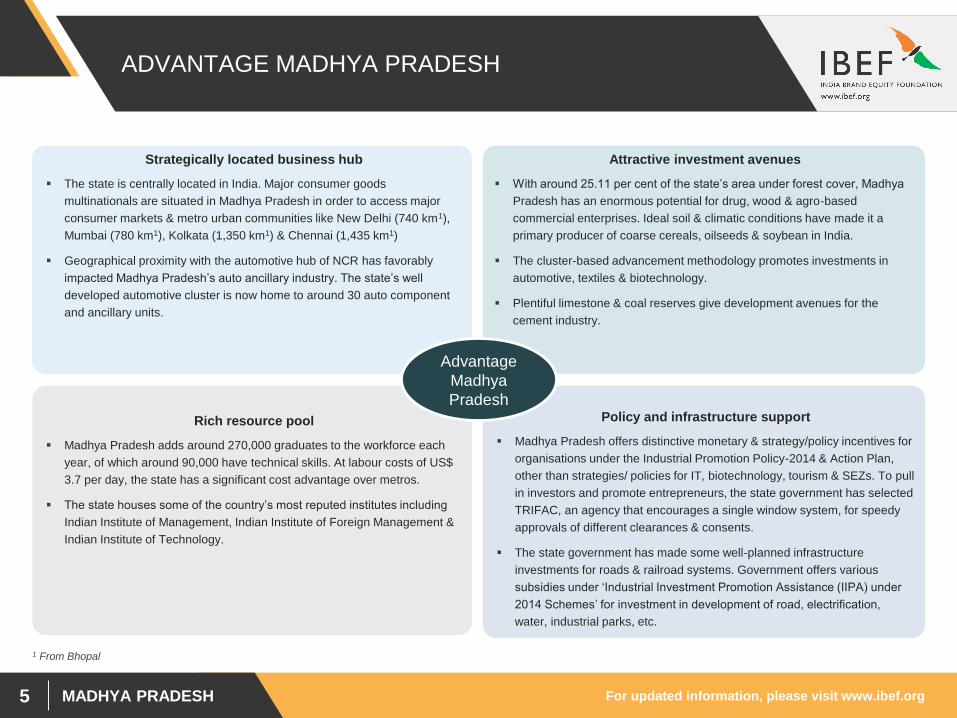
ADVANTAGE MADHYA PRADESH
Strategically located business hub
The state is centrally located in India. Major consumer goods
multinationals are situated in Madhya Pradesh in order to access major
consumer markets & metro urban communities like New Delhi (740 km1),
Mumbai (780 km1), Kolkata (1,350 km1) & Chennai (1,435 km1)
Geographical proximity with the automotive hub of NCR has favorably
impacted Madhya Pradesh’s auto ancillary industry. The state’s well
developed automotive cluster is now home to around 30 auto component
and ancillary units.
Attractive investment avenues
With around 25.11 per cent of the state’s area under forest cover, Madhya
Pradesh has an enormous potential for drug, wood & agro-based
commercial enterprises. Ideal soil & climatic conditions have made it a
primary producer of coarse cereals, oilseeds & soybean in India.
The cluster-based advancement methodology promotes investments in
automotive, textiles & biotechnology.
Plentiful limestone & coal reserves give development avenues for the
cement industry.
Policy and infrastructure support
Madhya Pradesh offers distinctive monetary & strategy/policy incentives for
organisations under the Industrial Promotion Policy-2014 & Action Plan,
other than strategies/ policies for IT, biotechnology, tourism & SEZs. To pull
in investors and promote entrepreneurs, the state government has selected
TRIFAC, an agency that encourages a single window system, for speedy
approvals of different clearances & consents.
The state government has made some well-planned infrastructure
investments for roads & railroad systems. Government offers various
subsidies under ‘Industrial Investment Promotion Assistance (IIPA) under
2014 Schemes’ for investment in development of road, electrification,
water, industrial parks, etc.
Rich resource pool
Madhya Pradesh adds around 270,000 graduates to the workforce each
year, of which around 90,000 have technical skills. At labour costs of US$
3.7 per day, the state has a significant cost advantage over metros.
The state houses some of the country’s most reputed institutes including
Indian Institute of Management, Indian Institute of Foreign Management &
Indian Institute of Technology.
Advantage
Madhya
Pradesh
1 From Bhopal
For updated information, please visit www.ibef.orgMADHYA PRADESH6
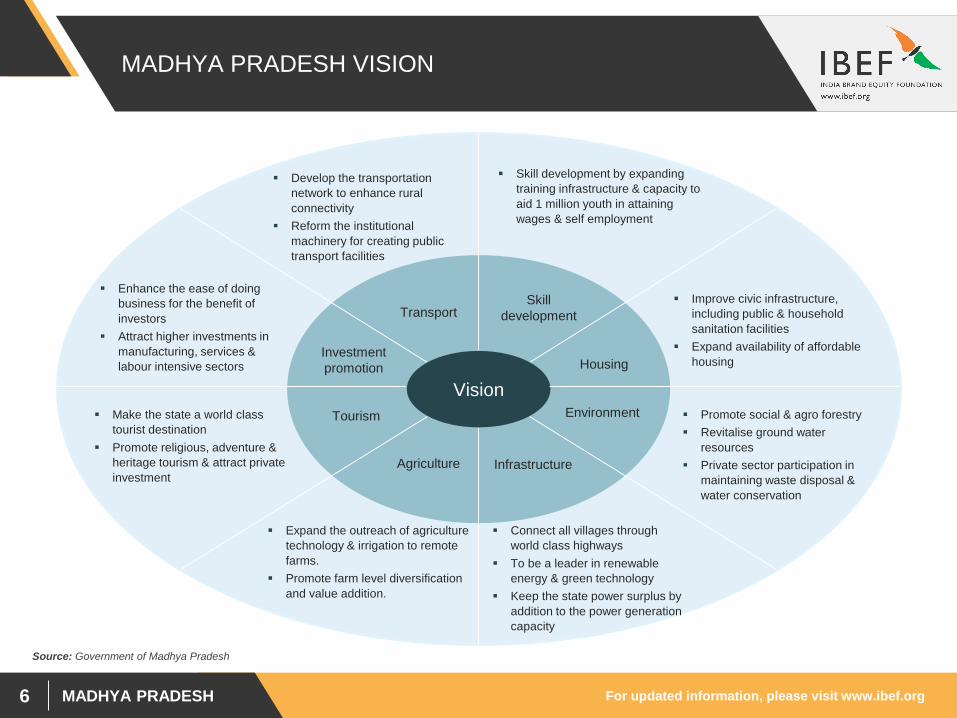
MADHYA PRADESH VISION
Housing
Improve civic infrastructure,
including public & household
sanitation facilities
Expand availability of affordable
housing
Agriculture
Expand the outreach of agriculture
technology & irrigation to remote
farms.
Promote farm level diversification
and value addition.
Transport
Develop the transportation
network to enhance rural
connectivity
Reform the institutional
machinery for creating public
transport facilities
Infrastructure
Skill
development
Investment
promotion
Skill development by expanding
training infrastructure & capacity to
aid 1 million youth in attaining
wages & self employment
Make the state a world class
tourist destination
Promote religious, adventure &
heritage tourism & attract private
investment
Connect all villages through
world class highways
To be a leader in renewable
energy & green technology
Keep the state power surplus by
addition to the power generation
capacity
VisionEnvironment Promote social & agro forestry
Revitalise ground water
resources
Private sector participation in
maintaining waste disposal &
water conservation
Tourism
Enhance the ease of doing
business for the benefit of
investors
Attract higher investments in
manufacturing, services &
labour intensive sectors
Source: Government of Madhya Pradesh
For updated information, please visit www.ibef.orgMADHYA PRADESH7
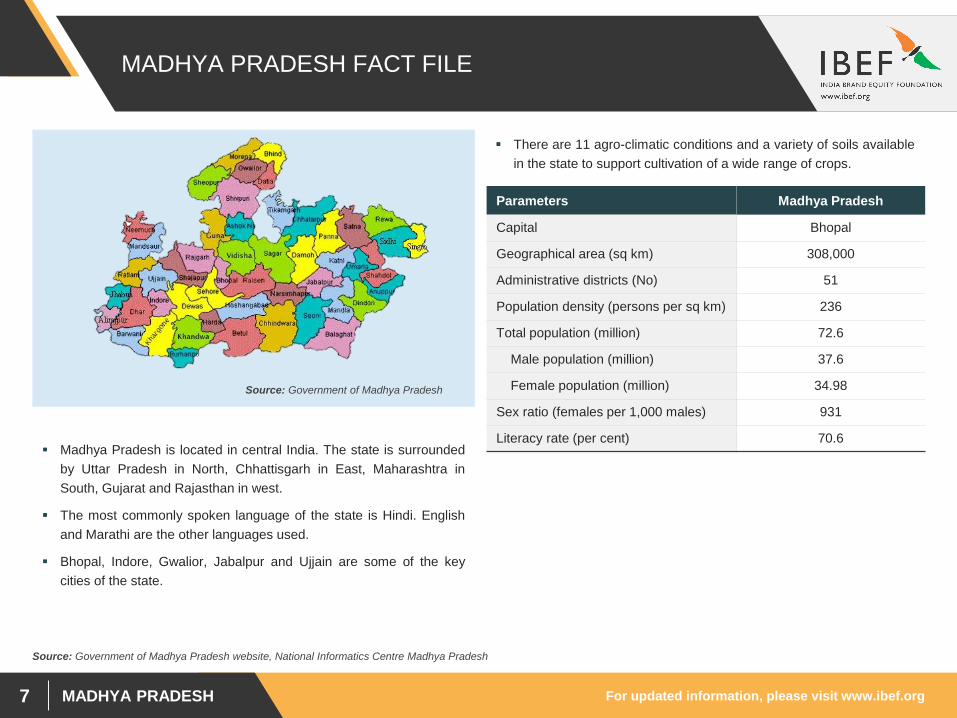
MADHYA PRADESH FACT FILE
Madhya Pradesh is located in central India. The state is surrounded
by Uttar Pradesh in North, Chhattisgarh in East, Maharashtra in
South, Gujarat and Rajasthan in west.
The most commonly spoken language of the state is Hindi. English
and Marathi are the other languages used.
Bhopal, Indore, Gwalior, Jabalpur and Ujjain are some of the key
cities of the state.
There are 11 agro-climatic conditions and a variety of soils available
in the state to support cultivation of a wide range of crops.
Parameters Madhya Pradesh
Capital Bhopal
Geographical area (sq km) 308,000
Administrative districts (No) 51
Population density (persons per sq km) 236
Total population (million) 72.6
Male population (million) 37.6
Female population (million) 34.98
Sex ratio (females per 1,000 males) 931
Literacy rate (per cent) 70.6
Source: Government of Madhya Pradesh website, National Informatics Centre Madhya Pradesh
Source: Government of Madhya Pradesh
For updated information, please visit www.ibef.orgMADHYA PRADESH8
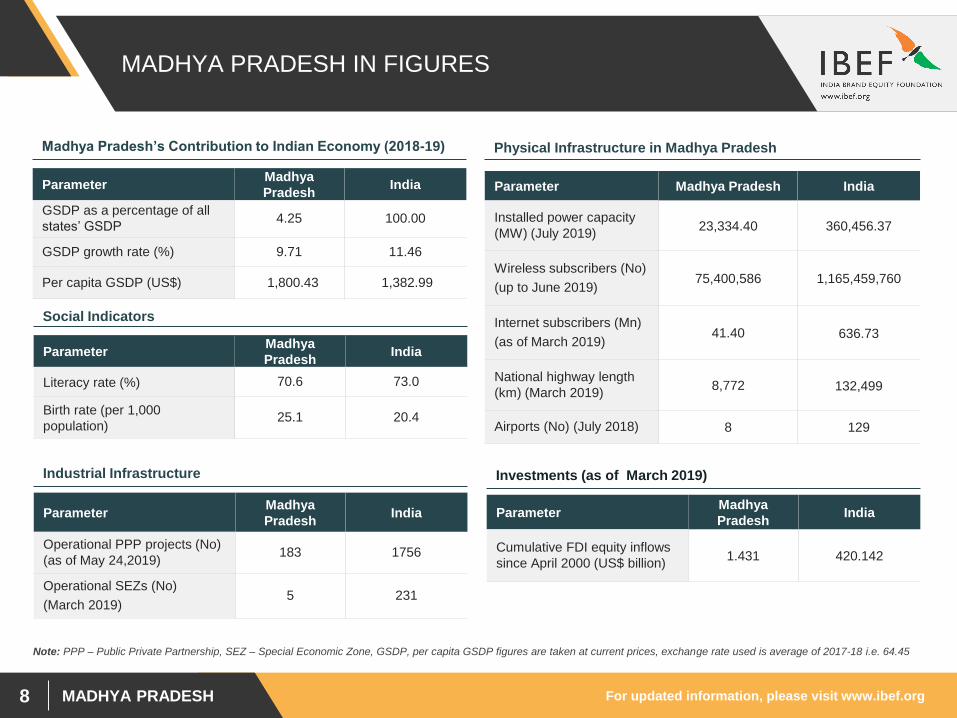
MADHYA PRADESH IN FIGURES
ParameterMadhya
PradeshIndia
GSDP as a percentage of all
states’ GSDP4.25 100.00
GSDP growth rate (%) 9.71 11.46
Per capita GSDP (US$) 1,800.43 1,382.99
Madhya Pradesh’s Contribution to Indian Economy (2018-19)
Parameter Madhya Pradesh India
Installed power capacity
(MW) (July 2019)23,334.40 360,456.37
Wireless subscribers (No)
(up to June 2019)75,400,586 1,165,459,760
Internet subscribers (Mn)
(as of March 2019)41.40 636.73
National highway length
(km) (March 2019)8,772 132,499
Airports (No) (July 2018) 8 129
Physical Infrastructure in Madhya Pradesh
ParameterMadhya
PradeshIndia
Literacy rate (%) 70.6 73.0
Birth rate (per 1,000
population)25.1 20.4
Social Indicators
ParameterMadhya
PradeshIndia
Operational PPP projects (No)
(as of May 24,2019)183 1756
Operational SEZs (No)
(March 2019)5 231
Industrial Infrastructure
ParameterMadhya
PradeshIndia
Cumulative FDI equity inflows
since April 2000 (US$ billion)1.431 420.142
Investments (as of March 2019)
Note: PPP – Public Private Partnership, SEZ – Special Economic Zone, GSDP, per capita GSDP figures are taken at current prices, exchange rate used is average of 2017-18 i.e. 64.45
MADHYA PRADESH
ECONOMIC SNAPSHOT
For updated information, please visit www.ibef.orgMADHYA PRADESH10
ECONOMIC SNAPSHOT – GSDP
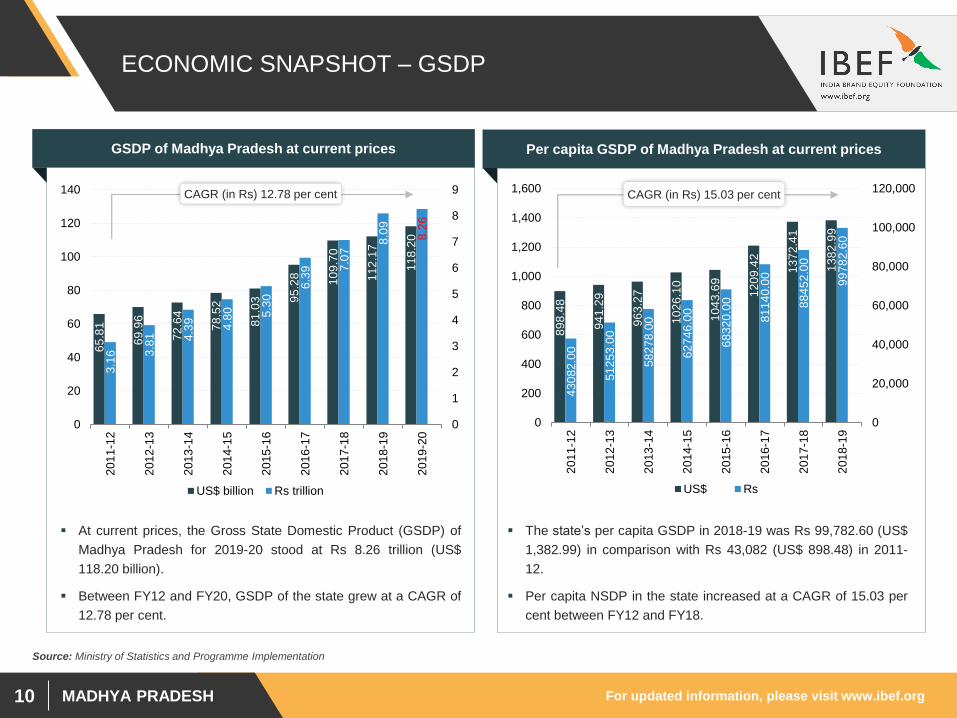
At current prices, the Gross State Domestic Product (GSDP) of
Madhya Pradesh for 2019-20 stood at Rs 8.26 trillion (US$
118.20 billion).
Between FY12 and FY20, GSDP of the state grew at a CAGR of
12.78 per cent.
GSDP of Madhya Pradesh at current prices
65
.81
69
.96
72
.64
78
.52
81
.03 9
5.2
8
10
9.7
0
11
2.1
7
11
8.2
0
3.1
6 3.8
1 4.3
9
4.8
0 5.3
0
6.3
9 7.0
7
8.0
9
8.2
60
1
2
3
4
5
6
7
8
9
0
20
40
60
80
100
120
140
201
1-1
2
201
2-1
3
201
3-1
4
201
4-1
5
201
5-1
6
201
6-1
7
201
7-1
8
201
8-1
9
201
9-2
0
US$ billion Rs trillion
CAGR (in Rs) 12.78 per cent
Source: Ministry of Statistics and Programme Implementation
Per capita GSDP of Madhya Pradesh at current prices
89
8.4
8
94
1.2
9
96
3.2
7
10
26
.10
10
43
.69
12
09
.42
13
72
.41
13
82
.99
43
08
2.0
0
51
25
3.0
0
58
27
8.0
0
62
74
6.0
0
68
32
0.0
0
81
14
0.0
0
88
45
2.0
0
99
78
2.6
0
0
20,000
40,000
60,000
80,000
100,000
120,000
0
200
400
600
800
1,000
1,200
1,400
1,600
201
1-1
2
201
2-1
3
201
3-1
4
201
4-1
5
201
5-1
6
201
6-1
7
201
7-1
8
201
8-1
9
US$ Rs
CAGR (in Rs) 15.03 per cent
The state’s per capita GSDP in 2018-19 was Rs 99,782.60 (US$
1,382.99) in comparison with Rs 43,082 (US$ 898.48) in 2011-
12.
Per capita NSDP in the state increased at a CAGR of 15.03 per
cent between FY12 and FY18.
For updated information, please visit www.ibef.orgMADHYA PRADESH11
ECONOMIC SNAPSHOT – NSDP
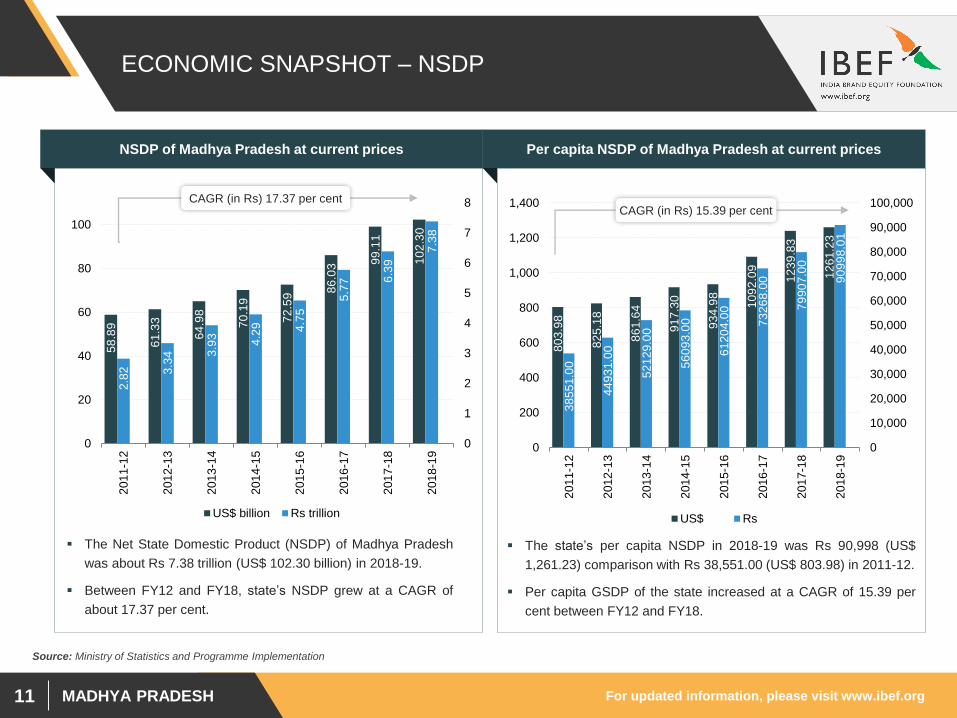
The Net State Domestic Product (NSDP) of Madhya Pradesh
was about Rs 7.38 trillion (US$ 102.30 billion) in 2018-19.
Between FY12 and FY18, state’s NSDP grew at a CAGR of
about 17.37 per cent.
NSDP of Madhya Pradesh at current prices
58
.89
61
.33
64
.98
70
.19
72
.59
86
.03 9
9.1
1
10
2.3
0
2.8
2 3.3
4 3.9
3
4.2
9 4.7
5
5.7
7 6.3
9
7.3
80
1
2
3
4
5
6
7
8
0
20
40
60
80
100
201
1-1
2
201
2-1
3
201
3-1
4
201
4-1
5
201
5-1
6
201
6-1
7
201
7-1
8
201
8-1
9
US$ billion Rs trillion
CAGR (in Rs) 17.37 per cent
Source: Ministry of Statistics and Programme Implementation
Per capita NSDP of Madhya Pradesh at current prices
80
3.9
8
82
5.1
8
86
1.6
4
91
7.3
0
93
4.9
8
10
92
.09
12
39
.83
12
61
.23
38
55
1.0
0
44
93
1.0
0
52
12
9.0
0
56
09
3.0
0
61
20
4.0
0
73
26
8.0
0
79
90
7.0
0
90
99
8.0
1
0
10,000
20,000
30,000
40,000
50,000
60,000
70,000
80,000
90,000
100,000
0
200
400
600
800
1,000
1,200
1,400
201
1-1
2
201
2-1
3
201
3-1
4
201
4-1
5
201
5-1
6
201
6-1
7
201
7-1
8
201
8-1
9
US$ Rs
CAGR (in Rs) 15.39 per cent
The state’s per capita NSDP in 2018-19 was Rs 90,998 (US$
1,261.23) comparison with Rs 38,551.00 (US$ 803.98) in 2011-12.
Per capita GSDP of the state increased at a CAGR of 15.39 per
cent between FY12 and FY18.
For updated information, please visit www.ibef.orgMADHYA PRADESH12
ECONOMIC SNAPSHOT – PERCENTAGE
DISTRIBUTION OF GSVA
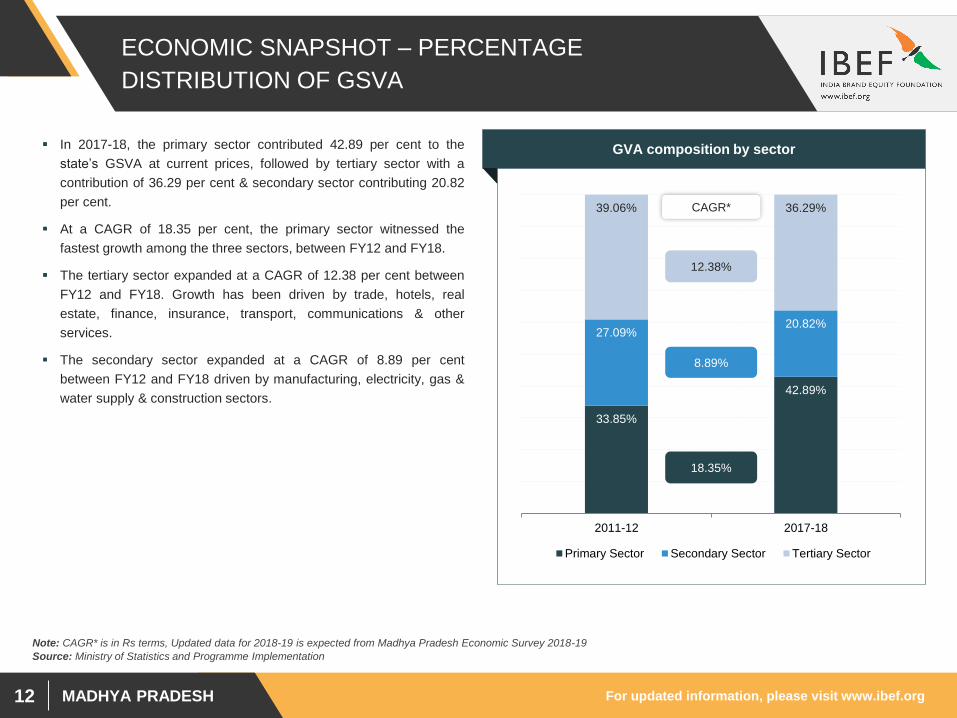
In 2017-18, the primary sector contributed 42.89 per cent to the
state’s GSVA at current prices, followed by tertiary sector with a
contribution of 36.29 per cent & secondary sector contributing 20.82
per cent.
At a CAGR of 18.35 per cent, the primary sector witnessed the
fastest growth among the three sectors, between FY12 and FY18.
The tertiary sector expanded at a CAGR of 12.38 per cent between
FY12 and FY18. Growth has been driven by trade, hotels, real
estate, finance, insurance, transport, communications & other
services.
The secondary sector expanded at a CAGR of 8.89 per cent
between FY12 and FY18 driven by manufacturing, electricity, gas &
water supply & construction sectors.
Visakhapatnam port traffic (million tonnes)GVA composition by sector
33.85%
42.89%
27.09%20.82%
39.06% 36.29%
2011-12 2017-18
Primary Sector Secondary Sector Tertiary Sector
18.35%
12.38%
8.89%
CAGR*
Source: Ministry of Statistics and Programme Implementation
Note: CAGR* is in Rs terms, Updated data for 2018-19 is expected from Madhya Pradesh Economic Survey 2018-19
For updated information, please visit www.ibef.orgMADHYA PRADESH13
ECONOMIC SNAPSHOT – FDI INFLOWS &
INVESTMENTS
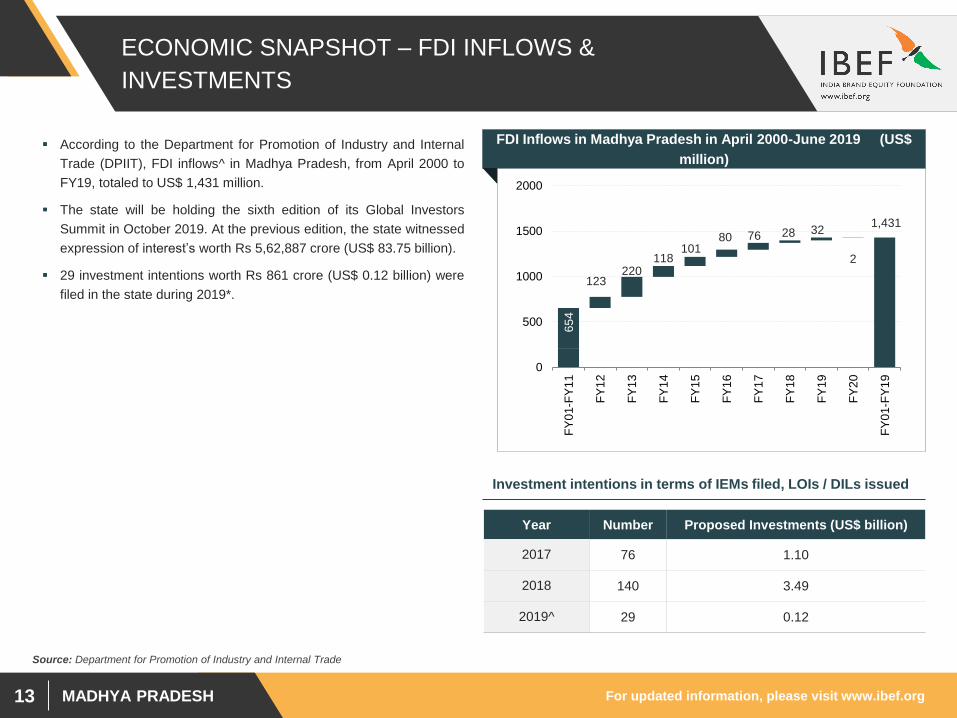
According to the Department for Promotion of Industry and Internal
Trade (DPIIT), FDI inflows^ in Madhya Pradesh, from April 2000 to
FY19, totaled to US$ 1,431 million.
The state will be holding the sixth edition of its Global Investors
Summit in October 2019. At the previous edition, the state witnessed
expression of interest’s worth Rs 5,62,887 crore (US$ 83.75 billion).
29 investment intentions worth Rs 861 crore (US$ 0.12 billion) were
filed in the state during 2019*.
Visakhapatnam port traffic (million tonnes)FDI Inflows in Madhya Pradesh in April 2000-June 2019 (US$
million)
123220
118101
80 76 28 32
2
1,431
65
4
0
500
1000
1500
2000
FY
01-F
Y1
1
FY
12
FY
13
FY
14
FY
15
FY
16
FY
17
FY
18
FY
19
FY
20
FY
01-F
Y1
9
Source: Department for Promotion of Industry and Internal Trade
Year Number Proposed Investments (US$ billion)
2017 76 1.10
2018 140 3.49
2019^ 29 0.12
Investment intentions in terms of IEMs filed, LOIs / DILs issued
For updated information, please visit www.ibef.orgMADHYA PRADESH14
ECONOMIC SNAPSHOT – EXPORT TRENDS
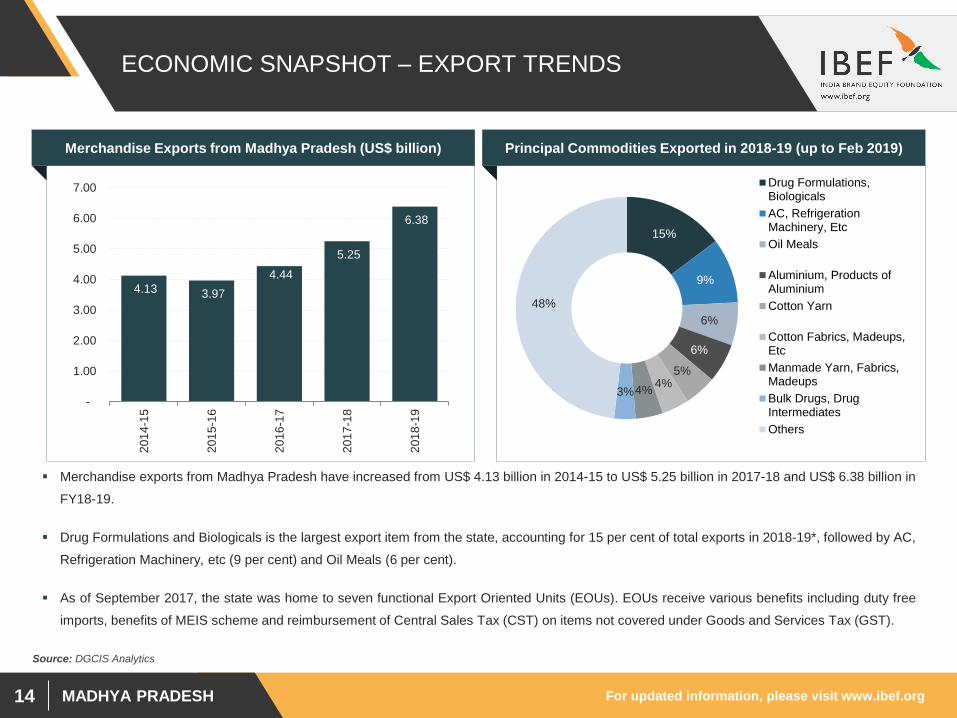
Merchandise exports from Madhya Pradesh have increased from US$ 4.13 billion in 2014-15 to US$ 5.25 billion in 2017-18 and US$ 6.38 billion in
FY18-19.
Drug Formulations and Biologicals is the largest export item from the state, accounting for 15 per cent of total exports in 2018-19*, followed by AC,
Refrigeration Machinery, etc (9 per cent) and Oil Meals (6 per cent).
As of September 2017, the state was home to seven functional Export Oriented Units (EOUs). EOUs receive various benefits including duty free
imports, benefits of MEIS scheme and reimbursement of Central Sales Tax (CST) on items not covered under Goods and Services Tax (GST).
Source: DGCIS Analytics
Merchandise Exports from Madhya Pradesh (US$ billion)
4.13 3.97
4.44
5.25
6.38
-
1.00
2.00
3.00
4.00
5.00
6.00
7.00
201
4-1
5
201
5-1
6
201
6-1
7
201
7-1
8
201
8-1
9
Principal Commodities Exported in 2018-19 (up to Feb 2019)
15%
9%
6%
6%
5%4%
4%3%
48%
Drug Formulations,Biologicals
AC, RefrigerationMachinery, Etc
Oil Meals
Aluminium, Products ofAluminium
Cotton Yarn
Cotton Fabrics, Madeups,Etc
Manmade Yarn, Fabrics,Madeups
Bulk Drugs, DrugIntermediates
Others
MADHYA PRADESH
PHYSICAL
INFRASTRUCTURE
For updated information, please visit www.ibef.orgMADHYA PRADESH16
PHYSICAL INFRASTRUCTURE – ROADS
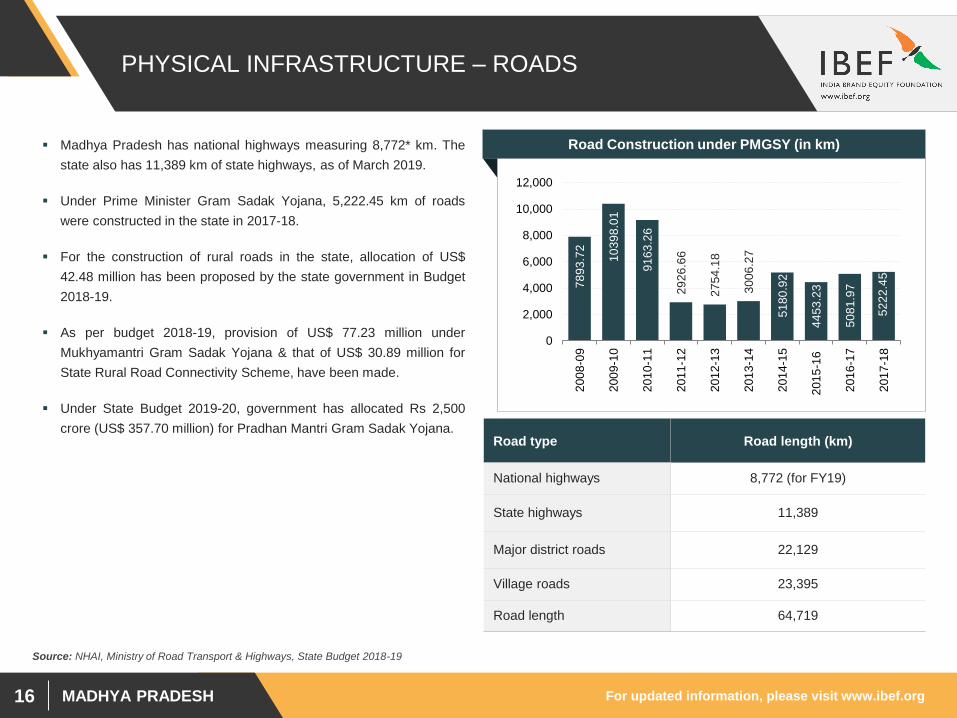
Madhya Pradesh has national highways measuring 8,772* km. The
state also has 11,389 km of state highways, as of March 2019.
Under Prime Minister Gram Sadak Yojana, 5,222.45 km of roads
were constructed in the state in 2017-18.
For the construction of rural roads in the state, allocation of US$
42.48 million has been proposed by the state government in Budget
2018-19.
As per budget 2018-19, provision of US$ 77.23 million under
Mukhyamantri Gram Sadak Yojana & that of US$ 30.89 million for
State Rural Road Connectivity Scheme, have been made.
Under State Budget 2019-20, government has allocated Rs 2,500
crore (US$ 357.70 million) for Pradhan Mantri Gram Sadak Yojana.Road type Road length (km)
National highways 8,772 (for FY19)
State highways 11,389
Major district roads 22,129
Village roads 23,395
Road length 64,719
Source: NHAI, Ministry of Road Transport & Highways, State Budget 2018-19
Road Construction under PMGSY (in km)
78
93
.72
10
39
8.0
1
91
63
.26
29
26
.66
27
54
.18
30
06
.27
51
80
.92
44
53
.23
50
81
.97
52
22
.45
0
2,000
4,000
6,000
8,000
10,000
12,000
200
8-0
9
200
9-1
0
201
0-1
1
201
1-1
2
201
2-1
3
201
3-1
4
201
4-1
5
201
5-1
6
201
6-1
7
201
7-1
8
For updated information, please visit www.ibef.orgMADHYA PRADESH17
PHYSICAL INFRASTRUCTURE – RAILWAYS
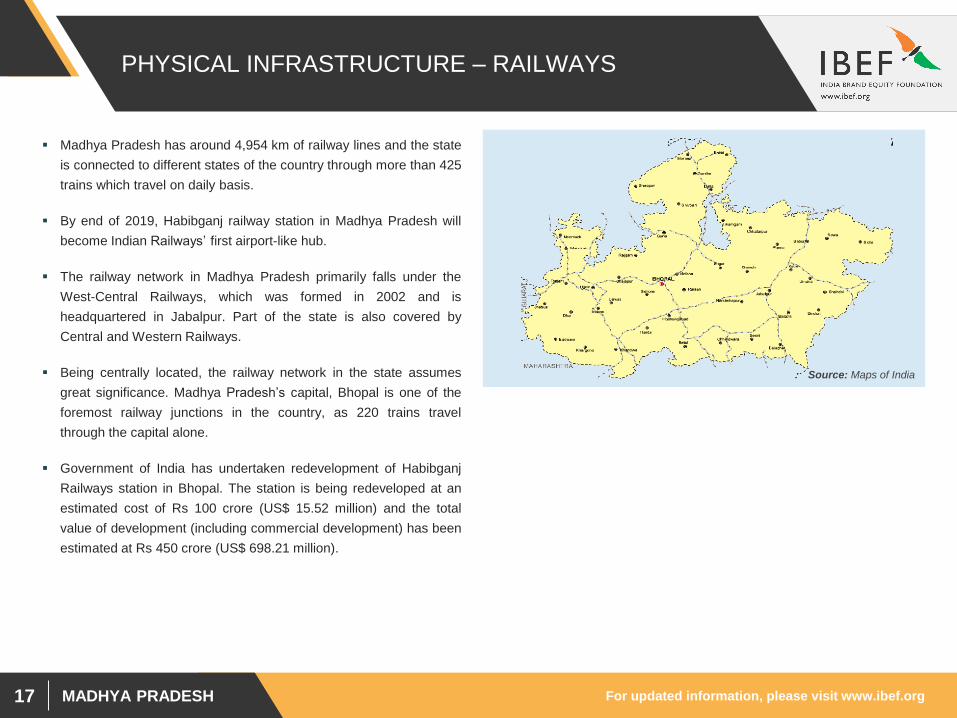
Madhya Pradesh has around 4,954 km of railway lines and the state
is connected to different states of the country through more than 425
trains which travel on daily basis.
By end of 2019, Habibganj railway station in Madhya Pradesh will
become Indian Railways’ first airport-like hub.
The railway network in Madhya Pradesh primarily falls under the
West-Central Railways, which was formed in 2002 and is
headquartered in Jabalpur. Part of the state is also covered by
Central and Western Railways.
Being centrally located, the railway network in the state assumes
great significance. Madhya Pradesh’s capital, Bhopal is one of the
foremost railway junctions in the country, as 220 trains travel
through the capital alone.
Government of India has undertaken redevelopment of Habibganj
Railways station in Bhopal. The station is being redeveloped at an
estimated cost of Rs 100 crore (US$ 15.52 million) and the total
value of development (including commercial development) has been
estimated at Rs 450 crore (US$ 698.21 million).
Source: Maps of India
For updated information, please visit www.ibef.orgMADHYA PRADESH18
PHYSICAL INFRASTRUCTURE – AIRPORTS
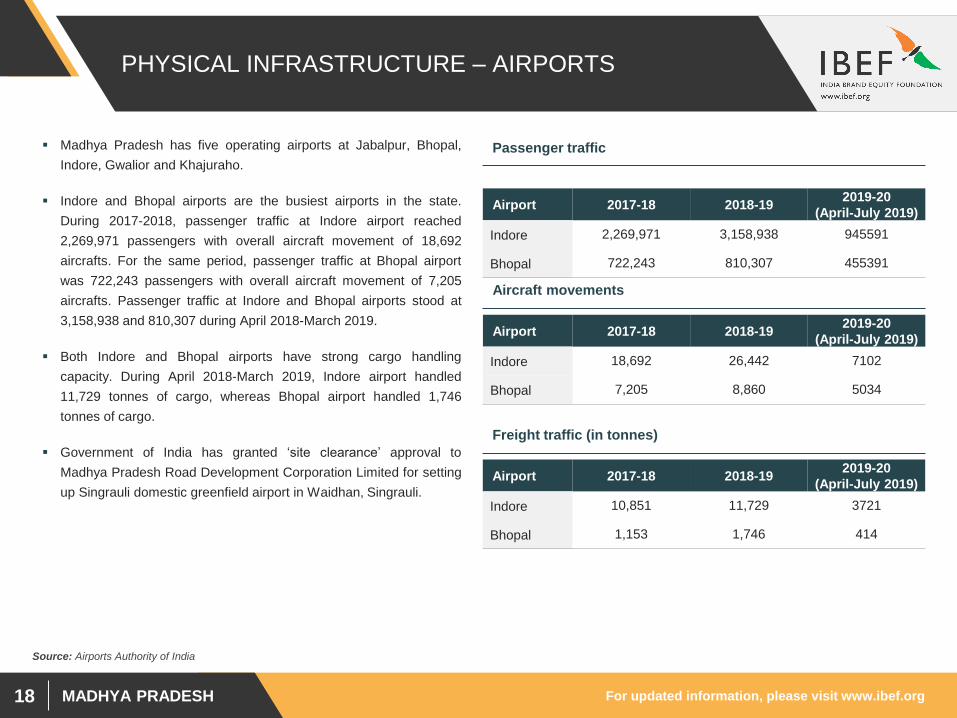
Madhya Pradesh has five operating airports at Jabalpur, Bhopal,
Indore, Gwalior and Khajuraho.
Indore and Bhopal airports are the busiest airports in the state.
During 2017-2018, passenger traffic at Indore airport reached
2,269,971 passengers with overall aircraft movement of 18,692
aircrafts. For the same period, passenger traffic at Bhopal airport
was 722,243 passengers with overall aircraft movement of 7,205
aircrafts. Passenger traffic at Indore and Bhopal airports stood at
3,158,938 and 810,307 during April 2018-March 2019.
Both Indore and Bhopal airports have strong cargo handling
capacity. During April 2018-March 2019, Indore airport handled
11,729 tonnes of cargo, whereas Bhopal airport handled 1,746
tonnes of cargo.
Government of India has granted ‘site clearance’ approval to
Madhya Pradesh Road Development Corporation Limited for setting
up Singrauli domestic greenfield airport in Waidhan, Singrauli.
Airport 2017-18 2018-192019-20
(April-July 2019)
Indore 2,269,971 3,158,938 945591
Bhopal 722,243 810,307 455391
Passenger traffic
Airport 2017-18 2018-192019-20
(April-July 2019)
Indore 18,692 26,442 7102
Bhopal 7,205 8,860 5034
Aircraft movements
Airport 2017-18 2018-192019-20
(April-July 2019)
Indore 10,851 11,729 3721
Bhopal 1,153 1,746 414
Freight traffic (in tonnes)
Source: Airports Authority of India
For updated information, please visit www.ibef.orgMADHYA PRADESH19
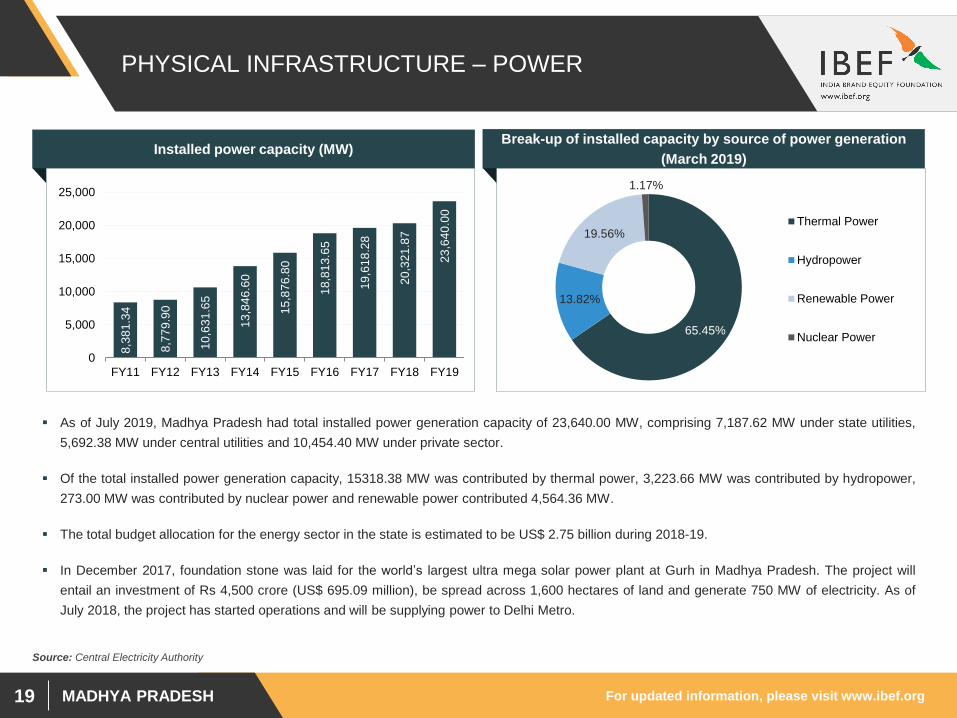
As of July 2019, Madhya Pradesh had total installed power generation capacity of 23,640.00 MW, comprising 7,187.62 MW under state utilities,
5,692.38 MW under central utilities and 10,454.40 MW under private sector.
Of the total installed power generation capacity, 15318.38 MW was contributed by thermal power, 3,223.66 MW was contributed by hydropower,
273.00 MW was contributed by nuclear power and renewable power contributed 4,564.36 MW.
The total budget allocation for the energy sector in the state is estimated to be US$ 2.75 billion during 2018-19.
In December 2017, foundation stone was laid for the world’s largest ultra mega solar power plant at Gurh in Madhya Pradesh. The project will
entail an investment of Rs 4,500 crore (US$ 695.09 million), be spread across 1,600 hectares of land and generate 750 MW of electricity. As of
July 2018, the project has started operations and will be supplying power to Delhi Metro.
PHYSICAL INFRASTRUCTURE – POWER
Installed power capacity (MW)
8,3
81
.34
8,7
79
.90
10
,63
1.6
5
13
,84
6.6
0
15
,87
6.8
0
18
,81
3.6
5
19
,61
8.2
8
20
,32
1.8
7
23
,64
0.0
0
0
5,000
10,000
15,000
20,000
25,000
FY11 FY12 FY13 FY14 FY15 FY16 FY17 FY18 FY19
Break-up of installed capacity by source of power generation
(March 2019)
65.45%
13.82%
19.56%
1.17%
Thermal Power
Hydropower
Renewable Power
Nuclear Power
Source: Central Electricity Authority
For updated information, please visit www.ibef.orgMADHYA PRADESH20
PHYSICAL INFRASTRUCTURE – TELECOM
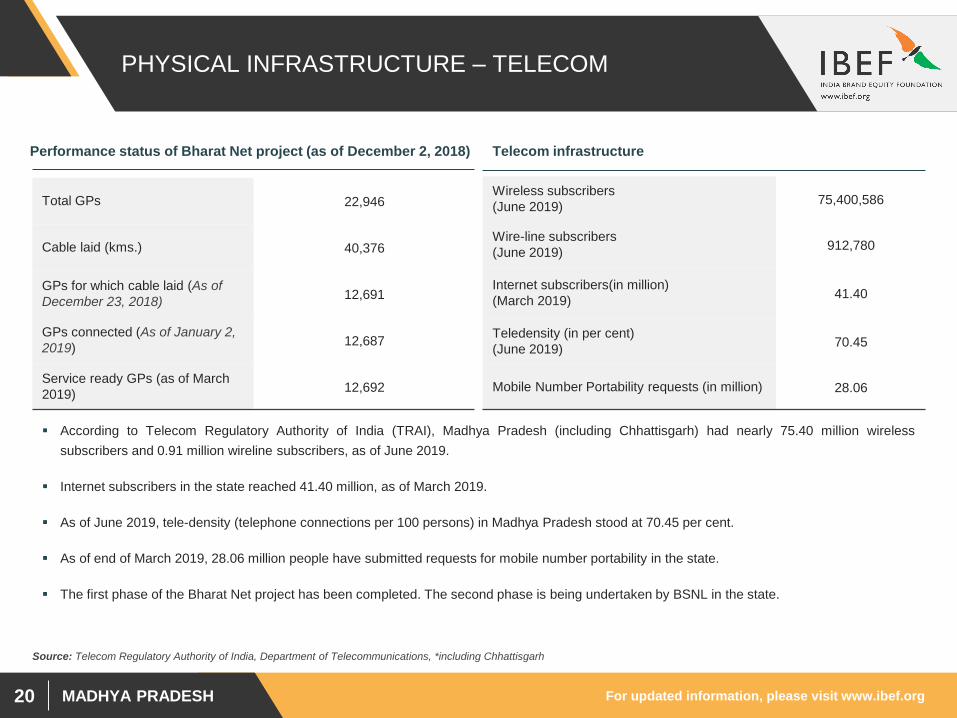
According to Telecom Regulatory Authority of India (TRAI), Madhya Pradesh (including Chhattisgarh) had nearly 75.40 million wireless
subscribers and 0.91 million wireline subscribers, as of June 2019.
Internet subscribers in the state reached 41.40 million, as of March 2019.
As of June 2019, tele-density (telephone connections per 100 persons) in Madhya Pradesh stood at 70.45 per cent.
As of end of March 2019, 28.06 million people have submitted requests for mobile number portability in the state.
The first phase of the Bharat Net project has been completed. The second phase is being undertaken by BSNL in the state.
Telecom infrastructure
Wireless subscribers
(June 2019)75,400,586
Wire-line subscribers
(June 2019)912,780
Internet subscribers(in million)
(March 2019)41.40
Teledensity (in per cent)
(June 2019)70.45
Mobile Number Portability requests (in million) 28.06
Source: Telecom Regulatory Authority of India, Department of Telecommunications, *including Chhattisgarh
Total GPs 22,946
Cable laid (kms.) 40,376
GPs for which cable laid (As of
December 23, 2018)12,691
GPs connected (As of January 2,
2019)12,687
Service ready GPs (as of March
2019)12,692
Performance status of Bharat Net project (as of December 2, 2018)
For updated information, please visit www.ibef.orgMADHYA PRADESH21
PHYSICAL INFRASTRUCTURE – URBAN
Source: Bhopal Municipal Corporation, Ministry of Urban Development, Census 2011
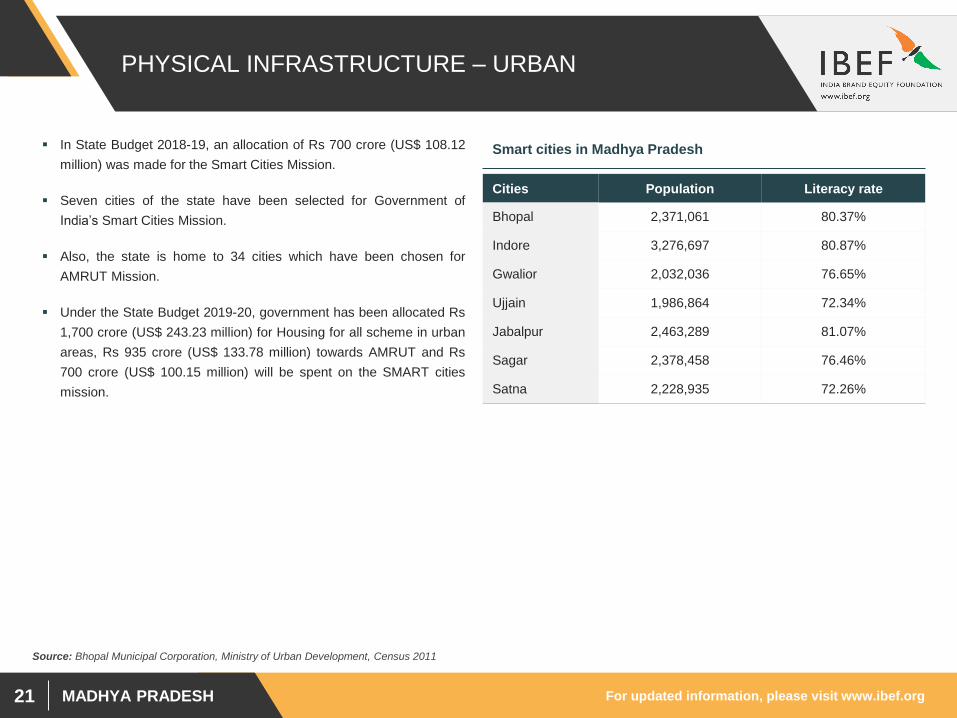
Cities Population Literacy rate
Bhopal 2,371,061 80.37%
Indore 3,276,697 80.87%
Gwalior 2,032,036 76.65%
Ujjain 1,986,864 72.34%
Jabalpur 2,463,289 81.07%
Sagar 2,378,458 76.46%
Satna 2,228,935 72.26%
Smart cities in Madhya Pradesh In State Budget 2018-19, an allocation of Rs 700 crore (US$ 108.12
million) was made for the Smart Cities Mission.
Seven cities of the state have been selected for Government of
India’s Smart Cities Mission.
Also, the state is home to 34 cities which have been chosen for
AMRUT Mission.
Under the State Budget 2019-20, government has been allocated Rs
1,700 crore (US$ 243.23 million) for Housing for all scheme in urban
areas, Rs 935 crore (US$ 133.78 million) towards AMRUT and Rs
700 crore (US$ 100.15 million) will be spent on the SMART cities
mission.
MADHYA PRADESH
SOCIAL
INFRASTRUCTURE
For updated information, please visit www.ibef.orgMADHYA PRADESH23
SOCIAL INFRASTRUCTURE – EDUCATION
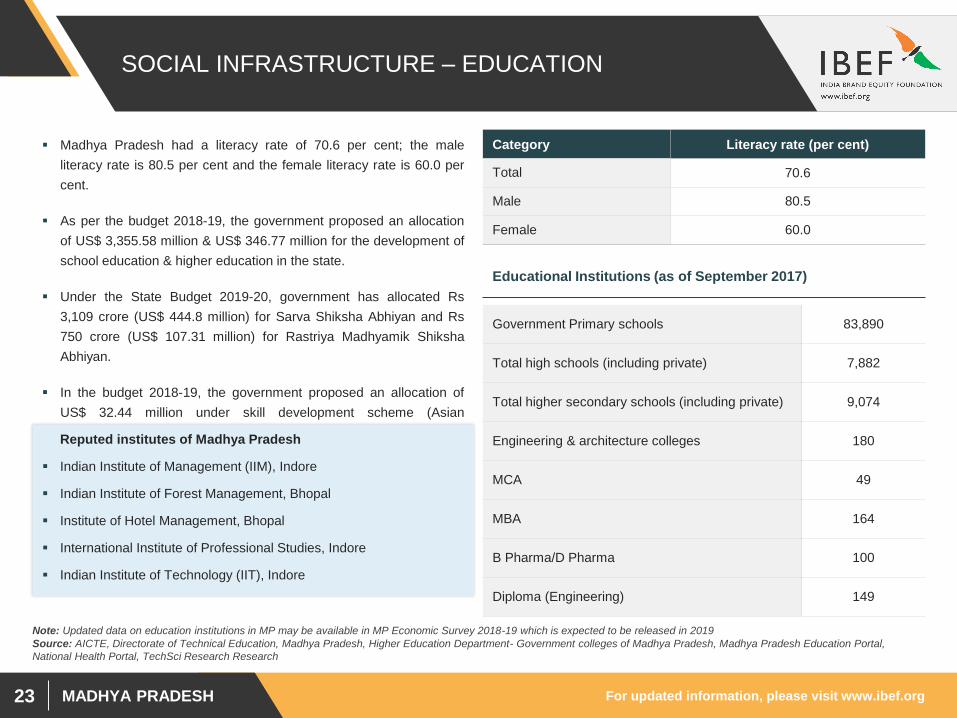
Madhya Pradesh had a literacy rate of 70.6 per cent; the male
literacy rate is 80.5 per cent and the female literacy rate is 60.0 per
cent.
As per the budget 2018-19, the government proposed an allocation
of US$ 3,355.58 million & US$ 346.77 million for the development of
school education & higher education in the state.
Under the State Budget 2019-20, government has allocated Rs
3,109 crore (US$ 444.8 million) for Sarva Shiksha Abhiyan and Rs
750 crore (US$ 107.31 million) for Rastriya Madhyamik Shiksha
Abhiyan.
In the budget 2018-19, the government proposed an allocation of
US$ 32.44 million under skill development scheme (Asian
Development Bank projects).
Category Literacy rate (per cent)
Total 70.6
Male 80.5
Female 60.0
Reputed institutes of Madhya Pradesh
Indian Institute of Management (IIM), Indore
Indian Institute of Forest Management, Bhopal
Institute of Hotel Management, Bhopal
International Institute of Professional Studies, Indore
Indian Institute of Technology (IIT), Indore
Educational Institutions (as of September 2017)
Government Primary schools 83,890
Total high schools (including private) 7,882
Total higher secondary schools (including private) 9,074
Engineering & architecture colleges 180
MCA 49
MBA 164
B Pharma/D Pharma 100
Diploma (Engineering) 149
Source: AICTE, Directorate of Technical Education, Madhya Pradesh, Higher Education Department- Government colleges of Madhya Pradesh, Madhya Pradesh Education Portal,
National Health Portal, TechSci Research Research
Note: Updated data on education institutions in MP may be available in MP Economic Survey 2018-19 which is expected to be released in 2019
For updated information, please visit www.ibef.orgMADHYA PRADESH24
SOCIAL INFRASTRUCTURE – HEALTH
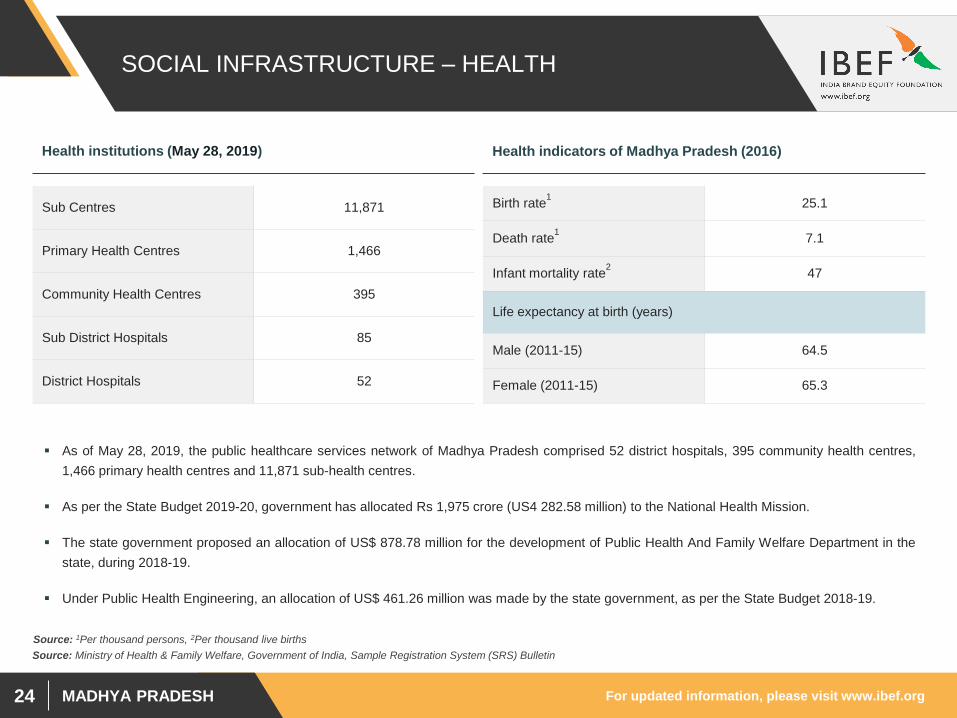
As of May 28, 2019, the public healthcare services network of Madhya Pradesh comprised 52 district hospitals, 395 community health centres,
1,466 primary health centres and 11,871 sub-health centres.
As per the State Budget 2019-20, government has allocated Rs 1,975 crore (US4 282.58 million) to the National Health Mission.
The state government proposed an allocation of US$ 878.78 million for the development of Public Health And Family Welfare Department in the
state, during 2018-19.
Under Public Health Engineering, an allocation of US$ 461.26 million was made by the state government, as per the State Budget 2018-19.
Health institutions (May 28, 2019)
Sub Centres 11,871
Primary Health Centres 1,466
Community Health Centres 395
Sub District Hospitals 85
District Hospitals 52
Health indicators of Madhya Pradesh (2016)
Birth rate1
25.1
Death rate1
7.1
Infant mortality rate2
47
Life expectancy at birth (years)
Male (2011-15) 64.5
Female (2011-15) 65.3
Source: Ministry of Health & Family Welfare, Government of India, Sample Registration System (SRS) Bulletin
Source: 1Per thousand persons, 2Per thousand live births
MADHYA PRADESH
INDUSTRIAL
INFRASTRUCTURE
For updated information, please visit www.ibef.orgMADHYA PRADESH26
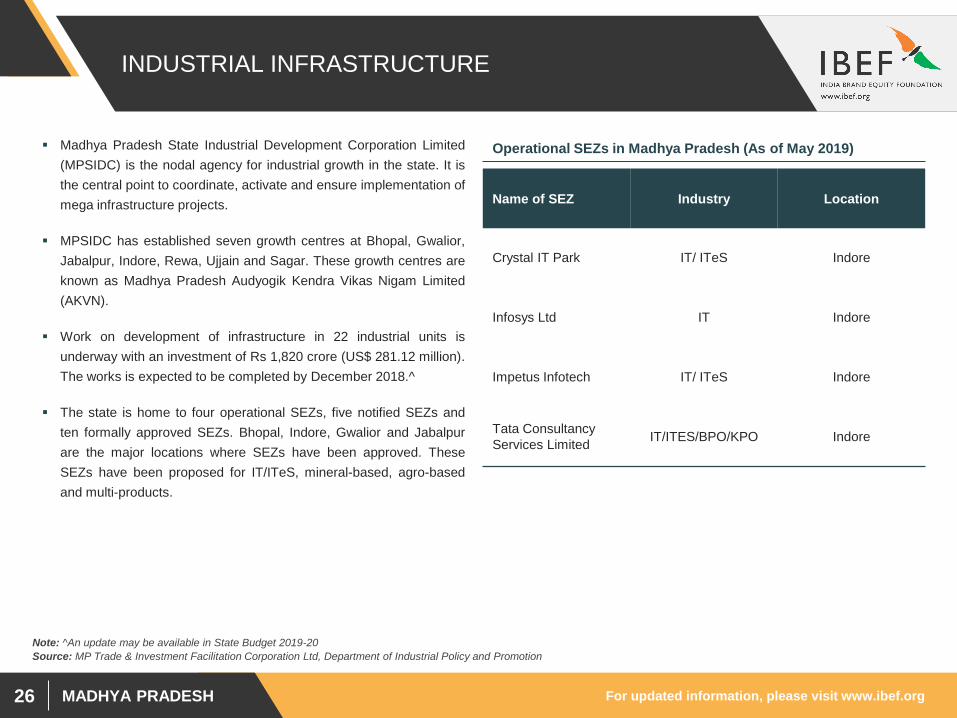
INDUSTRIAL INFRASTRUCTURE
Madhya Pradesh State Industrial Development Corporation Limited
(MPSIDC) is the nodal agency for industrial growth in the state. It is
the central point to coordinate, activate and ensure implementation of
mega infrastructure projects.
MPSIDC has established seven growth centres at Bhopal, Gwalior,
Jabalpur, Indore, Rewa, Ujjain and Sagar. These growth centres are
known as Madhya Pradesh Audyogik Kendra Vikas Nigam Limited
(AKVN).
Work on development of infrastructure in 22 industrial units is
underway with an investment of Rs 1,820 crore (US$ 281.12 million).
The works is expected to be completed by December 2018.^
The state is home to four operational SEZs, five notified SEZs and
ten formally approved SEZs. Bhopal, Indore, Gwalior and Jabalpur
are the major locations where SEZs have been approved. These
SEZs have been proposed for IT/ITeS, mineral-based, agro-based
and multi-products.
Source: MP Trade & Investment Facilitation Corporation Ltd, Department of Industrial Policy and Promotion
Operational SEZs in Madhya Pradesh (As of May 2019)
Name of SEZ Industry Location
Crystal IT Park IT/ ITeS Indore
Infosys Ltd IT Indore
Impetus Infotech IT/ ITeS Indore
Tata Consultancy
Services Limited IT/ITES/BPO/KPO Indore
Note: ^An update may be available in State Budget 2019-20
MADHYA PRADESH
KEY SECTORS
Agriculture and Food Processing
Textiles
Tourism
Pharmaceuticals
Mineral-based Industry
For updated information, please visit www.ibef.orgMADHYA PRADESH28
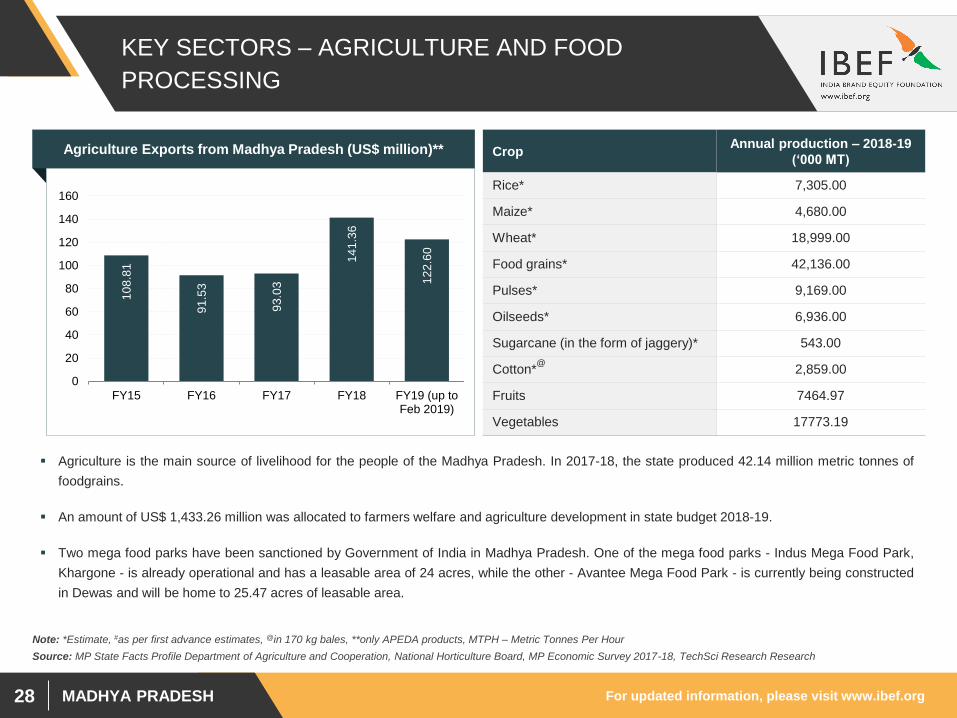
KEY SECTORS – AGRICULTURE AND FOOD
PROCESSING
CropAnnual production – 2018-19
(‘000 MT)
Rice* 7,305.00
Maize* 4,680.00
Wheat* 18,999.00
Food grains* 42,136.00
Pulses* 9,169.00
Oilseeds* 6,936.00
Sugarcane (in the form of jaggery)* 543.00
Cotton*@
2,859.00
Fruits 7464.97
Vegetables 17773.19
Agriculture is the main source of livelihood for the people of the Madhya Pradesh. In 2017-18, the state produced 42.14 million metric tonnes of
foodgrains.
An amount of US$ 1,433.26 million was allocated to farmers welfare and agriculture development in state budget 2018-19.
Two mega food parks have been sanctioned by Government of India in Madhya Pradesh. One of the mega food parks - Indus Mega Food Park,
Khargone - is already operational and has a leasable area of 24 acres, while the other - Avantee Mega Food Park - is currently being constructed
in Dewas and will be home to 25.47 acres of leasable area.
Source: MP State Facts Profile Department of Agriculture and Cooperation, National Horticulture Board, MP Economic Survey 2017-18, TechSci Research Research
Note: *Estimate, #as per first advance estimates, @in 170 kg bales, **only APEDA products, MTPH – Metric Tonnes Per Hour
Agriculture Exports from Madhya Pradesh (US$ million)**
10
8.8
1
91
.53
93
.03
14
1.3
6
12
2.6
0
0
20
40
60
80
100
120
140
160
FY15 FY16 FY17 FY18 FY19 (up toFeb 2019)
For updated information, please visit www.ibef.orgMADHYA PRADESH29
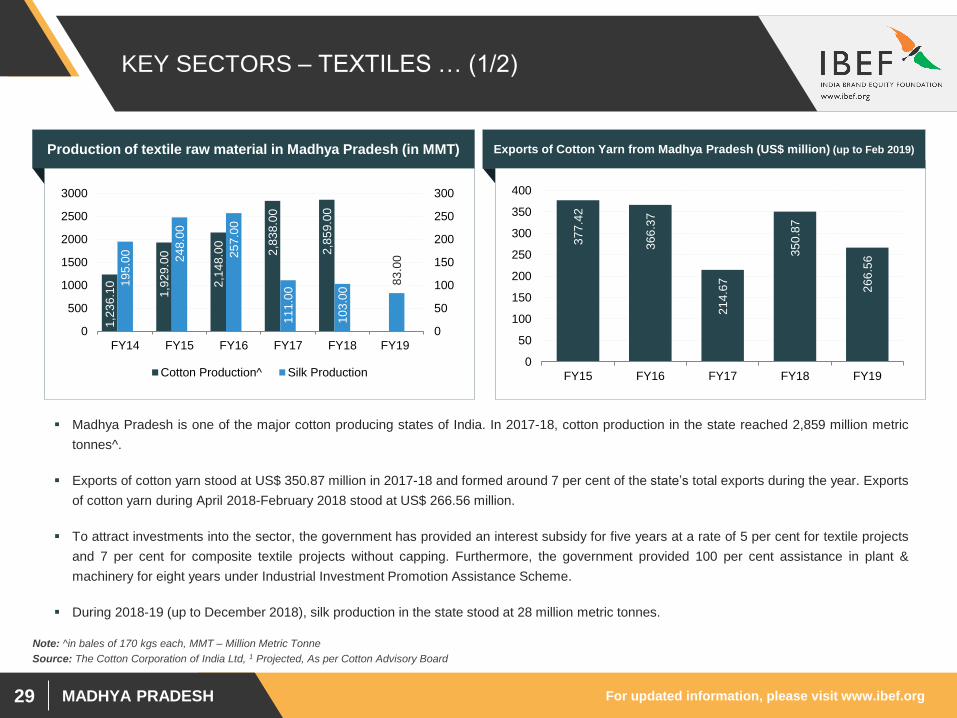
KEY SECTORS – TEXTILES … (1/2)
Madhya Pradesh is one of the major cotton producing states of India. In 2017-18, cotton production in the state reached 2,859 million metric
tonnes^.
Exports of cotton yarn stood at US$ 350.87 million in 2017-18 and formed around 7 per cent of the state’s total exports during the year. Exports
of cotton yarn during April 2018-February 2018 stood at US$ 266.56 million.
To attract investments into the sector, the government has provided an interest subsidy for five years at a rate of 5 per cent for textile projects
and 7 per cent for composite textile projects without capping. Furthermore, the government provided 100 per cent assistance in plant &
machinery for eight years under Industrial Investment Promotion Assistance Scheme.
During 2018-19 (up to December 2018), silk production in the state stood at 28 million metric tonnes.
Production of textile raw material in Madhya Pradesh (in MMT) Exports of Cotton Yarn from Madhya Pradesh (US$ million) (up to Feb 2019)
37
7.4
2
36
6.3
7
21
4.6
7
35
0.8
7
26
6.5
6
0
50
100
150
200
250
300
350
400
FY15 FY16 FY17 FY18 FY19
Source: The Cotton Corporation of India Ltd, 1 Projected, As per Cotton Advisory Board
Note: ^in bales of 170 kgs each, MMT – Million Metric Tonne
1,2
36
.10
1,9
29
.00
2,1
48
.00
2,8
38
.00
2,8
59
.00
19
5.0
0
24
8.0
0
25
7.0
0
11
1.0
0
10
3.0
0
83
.00
0
50
100
150
200
250
300
0
500
1000
1500
2000
2500
3000
FY14 FY15 FY16 FY17 FY18 FY19
Cotton Production^ Silk Production
For updated information, please visit www.ibef.orgMADHYA PRADESH30
KEY SECTORS – TEXTILES … (2/2)
Trident Limited, the flagship company of Trident Group, is one of the largest integrated home textiles
manufacturers over the world. The company has a bed linen manufacturing plant in Budni, Madhya Pradesh. The
facility has capacity of 43.2 million metres per annum and is home to 500 looms. Also, the world’s largest
standalone terry towel manufacturing facility resides at the plant.Trident Limited
Grasim Industries Ltd, a flagship company of the Aditya Birla Group, is one of the leading companies in India with
diverse interests in cement, chemicals and textiles. Its textile plants are located at Bhiwani, Haryana and
Malanpur, Madhya Pradesh. The Malanpur unit of the company manufactures worsted dyed yarn spun from pure
merino wool along with polyester and other blends. The company has a wide retail network and also serves
international apparel manufacturers.Grasim Industries Ltd
The Vardhman Group is a leading textile conglomerate in India having a turnover of US$ 1.1 Billion. The yarn
manufacturing units are located in Mandideep (130,994 spindles), Satlapur (222,624 spindles) and Bhudhni
(60,000 spindles). In September 2013, the company added 36,288 spindles to its Satlapur plant. Furthermore, the
Bhudhni plant has a fabric weaving unit (400 looms) and a fabric processing unit with a capacity of 40 million
metres per annum.Vardhman Textiles Ltd
Raymond is a major fabric manufacturer in India. Besides, the company also has business interests in engineering
and aviation. The company is one of the largest integrated manufacturers of worsted fabric in the world and
commands over 60.0 per cent market share in worsted suiting in India. The total production capacity of the
company is around 38 million metres of wool and wool-blended products. One of the four plants of the company is
located at Chhindwara in Madhya Pradesh.Raymond Ltd
Key players in textiles industry
For updated information, please visit www.ibef.orgMADHYA PRADESH31
KEY SECTORS – TOURISM
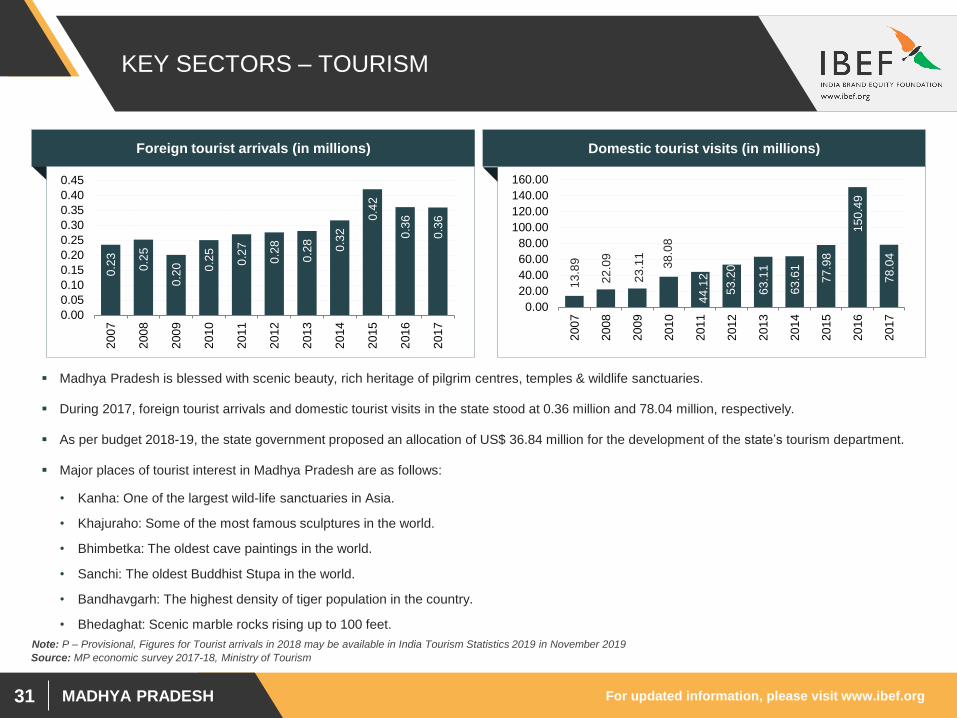
Madhya Pradesh is blessed with scenic beauty, rich heritage of pilgrim centres, temples & wildlife sanctuaries.
During 2017, foreign tourist arrivals and domestic tourist visits in the state stood at 0.36 million and 78.04 million, respectively.
As per budget 2018-19, the state government proposed an allocation of US$ 36.84 million for the development of the state’s tourism department.
Major places of tourist interest in Madhya Pradesh are as follows:
• Kanha: One of the largest wild-life sanctuaries in Asia.
• Khajuraho: Some of the most famous sculptures in the world.
• Bhimbetka: The oldest cave paintings in the world.
• Sanchi: The oldest Buddhist Stupa in the world.
• Bandhavgarh: The highest density of tiger population in the country.
• Bhedaghat: Scenic marble rocks rising up to 100 feet.
Foreign tourist arrivals (in millions)
0.2
3
0.2
5
0.2
0 0.2
5
0.2
7
0.2
8
0.2
8
0.3
2
0.4
2
0.3
6
0.3
6
0.00
0.05
0.10
0.15
0.20
0.25
0.30
0.35
0.40
0.45
200
7
200
8
200
9
201
0
201
1
201
2
201
3
201
4
201
5
201
6
201
7
Source: MP economic survey 2017-18, Ministry of Tourism
Note: P – Provisional, Figures for Tourist arrivals in 2018 may be available in India Tourism Statistics 2019 in November 2019
Domestic tourist visits (in millions)
13
.89
22
.09
23
.11
38
.08
44
.12
53
.20
63
.11
63
.61
77
.98
15
0.4
9
78
.04
0.00
20.00
40.00
60.00
80.00
100.00
120.00
140.00
160.00
200
7
200
8
200
9
201
0
201
1
201
2
201
3
201
4
201
5
201
6
201
7
For updated information, please visit www.ibef.orgMADHYA PRADESH32
KEY SECTORS – PHARMACEUTICALS
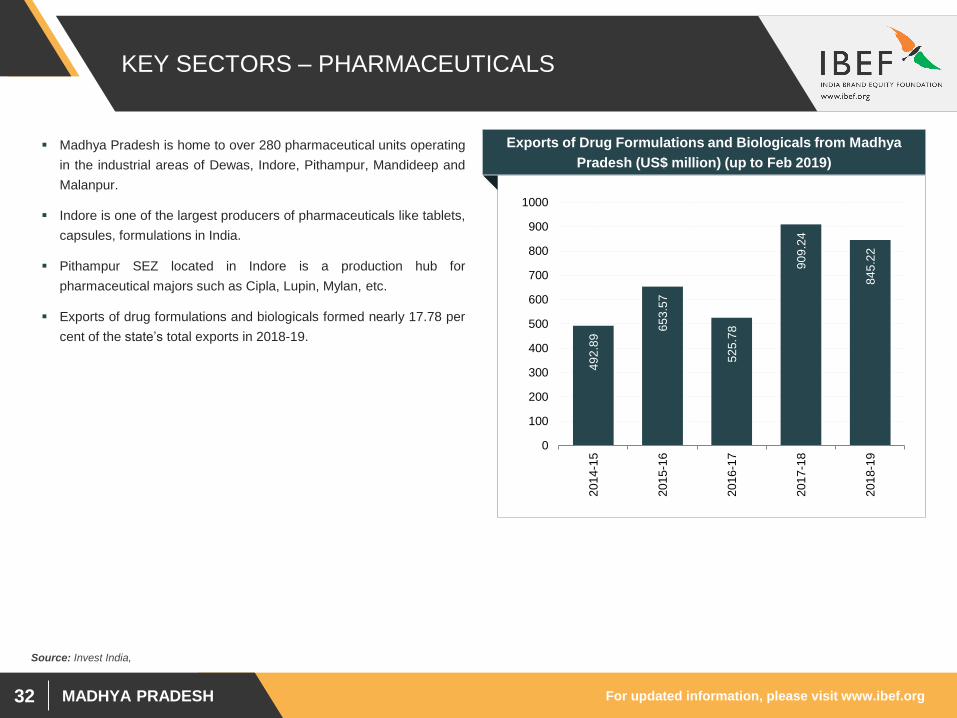
Madhya Pradesh is home to over 280 pharmaceutical units operating
in the industrial areas of Dewas, Indore, Pithampur, Mandideep and
Malanpur.
Indore is one of the largest producers of pharmaceuticals like tablets,
capsules, formulations in India.
Pithampur SEZ located in Indore is a production hub for
pharmaceutical majors such as Cipla, Lupin, Mylan, etc.
Exports of drug formulations and biologicals formed nearly 17.78 per
cent of the state’s total exports in 2018-19.
Source: Invest India,
Exports of Drug Formulations and Biologicals from Madhya
Pradesh (US$ million) (up to Feb 2019)
49
2.8
9
65
3.5
7
52
5.7
8
90
9.2
4
84
5.2
2
0
100
200
300
400
500
600
700
800
900
1000
201
4-1
5
201
5-1
6
201
6-1
7
201
7-1
8
201
8-1
9
For updated information, please visit www.ibef.orgMADHYA PRADESH33
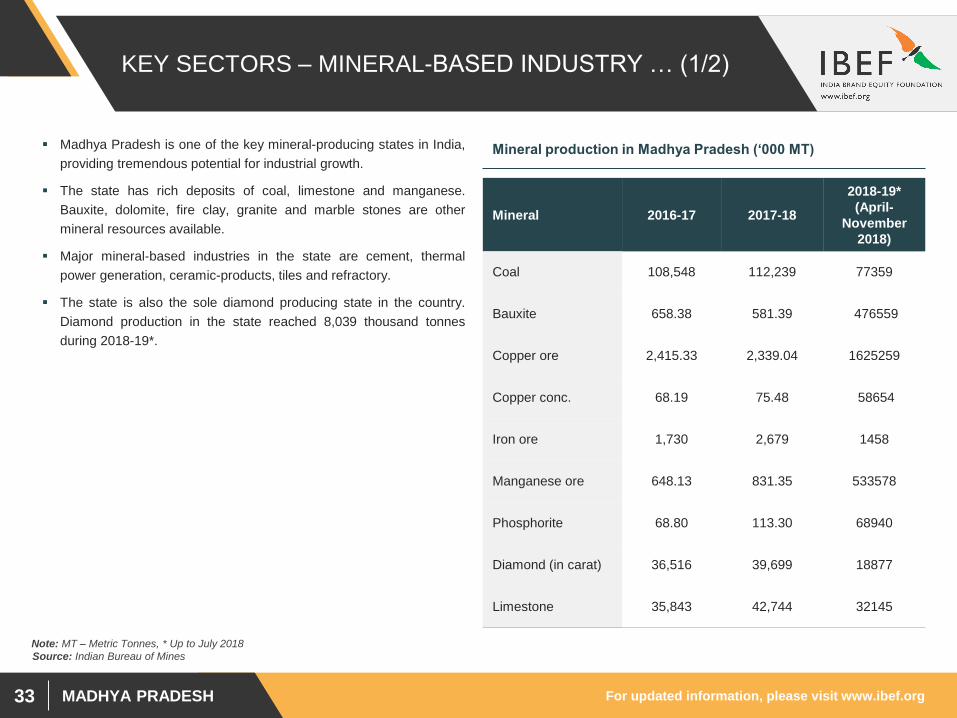
KEY SECTORS – MINERAL-BASED INDUSTRY … (1/2)
Madhya Pradesh is one of the key mineral-producing states in India,
providing tremendous potential for industrial growth.
The state has rich deposits of coal, limestone and manganese.
Bauxite, dolomite, fire clay, granite and marble stones are other
mineral resources available.
Major mineral-based industries in the state are cement, thermal
power generation, ceramic-products, tiles and refractory.
The state is also the sole diamond producing state in the country.
Diamond production in the state reached 8,039 thousand tonnes
during 2018-19*.
Source: Indian Bureau of Mines
Mineral 2016-17 2017-18
2018-19*
(April-
November
2018)
Coal 108,548 112,239 77359
Bauxite 658.38 581.39 476559
Copper ore 2,415.33 2,339.04 1625259
Copper conc. 68.19 75.48 58654
Iron ore 1,730 2,679 1458
Manganese ore 648.13 831.35 533578
Phosphorite 68.80 113.30 68940
Diamond (in carat) 36,516 39,699 18877
Limestone 35,843 42,744 32145
Mineral production in Madhya Pradesh (‘000 MT)
Note: MT – Metric Tonnes, * Up to July 2018
For updated information, please visit www.ibef.orgMADHYA PRADESH34
KEY INDUSTRIES – MINERAL-BASED INDUSTRY …
(2/2)
Hindustan Copper Ltd (HCL) is a vertically integrated copper manufacturing company. In 1982, the company
established its Malanjkhand copper project, which has the single-largest copper deposit in the country. The
Malanjkhand mine has a copper deposit of 221 million tonnes with 1.3 per cent copper concentration. The
company possesses an open-pit mine with a capacity of 2 million tonnes per annum, concentrator plant, tailing
disposal system and other auxiliary facilities. The plant contributes around 80.0 per cent of the copper production
of the company. HCL’s mines and plants are spread across Rajasthan, Jharkhand, Madhya Pradesh and
Maharashtra.Hindustan Copper Ltd
NMDC is a public sector unit involved in mining of a wide range of minerals such as iron, copper, limestone,
dolomite, gypsum, tin, graphite and diamond. The company is the single largest iron ore producer in the country.
NMDC is the only organised producer of diamonds in India and produces diamond from its Majhgawan mine at
Panna in Madhya Pradesh. The production capacity of the mine is around 84,000 carat per annum. The mine
employs around 199 persons.
NMDC Ltd
MADHYA PRADESH
KEY PROCEDURES
AND POLICIES
For updated information, please visit www.ibef.orgMADHYA PRADESH36
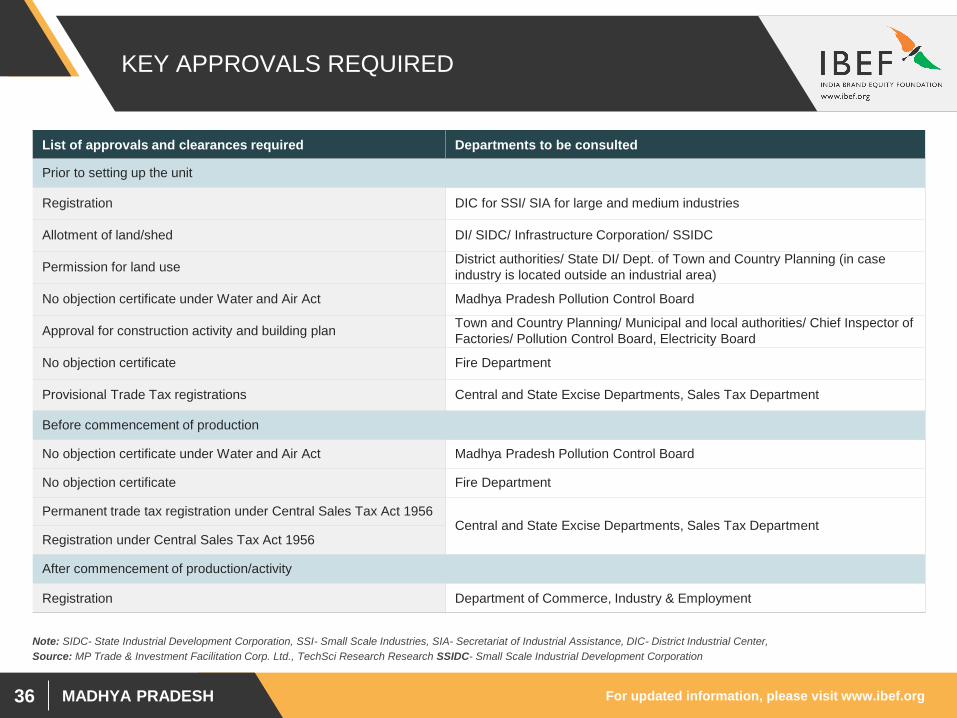
KEY APPROVALS REQUIRED
List of approvals and clearances required Departments to be consulted
Prior to setting up the unit
Registration DIC for SSI/ SIA for large and medium industries
Allotment of land/shed DI/ SIDC/ Infrastructure Corporation/ SSIDC
Permission for land useDistrict authorities/ State DI/ Dept. of Town and Country Planning (in case
industry is located outside an industrial area)
No objection certificate under Water and Air Act Madhya Pradesh Pollution Control Board
Approval for construction activity and building planTown and Country Planning/ Municipal and local authorities/ Chief Inspector of
Factories/ Pollution Control Board, Electricity Board
No objection certificate Fire Department
Provisional Trade Tax registrations Central and State Excise Departments, Sales Tax Department
Before commencement of production
No objection certificate under Water and Air Act Madhya Pradesh Pollution Control Board
No objection certificate Fire Department
Permanent trade tax registration under Central Sales Tax Act 1956 Central and State Excise Departments, Sales Tax Department
Registration under Central Sales Tax Act 1956
After commencement of production/activity
Registration Department of Commerce, Industry & Employment
Source: MP Trade & Investment Facilitation Corp. Ltd., TechSci Research Research SSIDC- Small Scale Industrial Development Corporation
Note: SIDC- State Industrial Development Corporation, SSI- Small Scale Industries, SIA- Secretariat of Industrial Assistance, DIC- District Industrial Center,
For updated information, please visit www.ibef.orgMADHYA PRADESH37
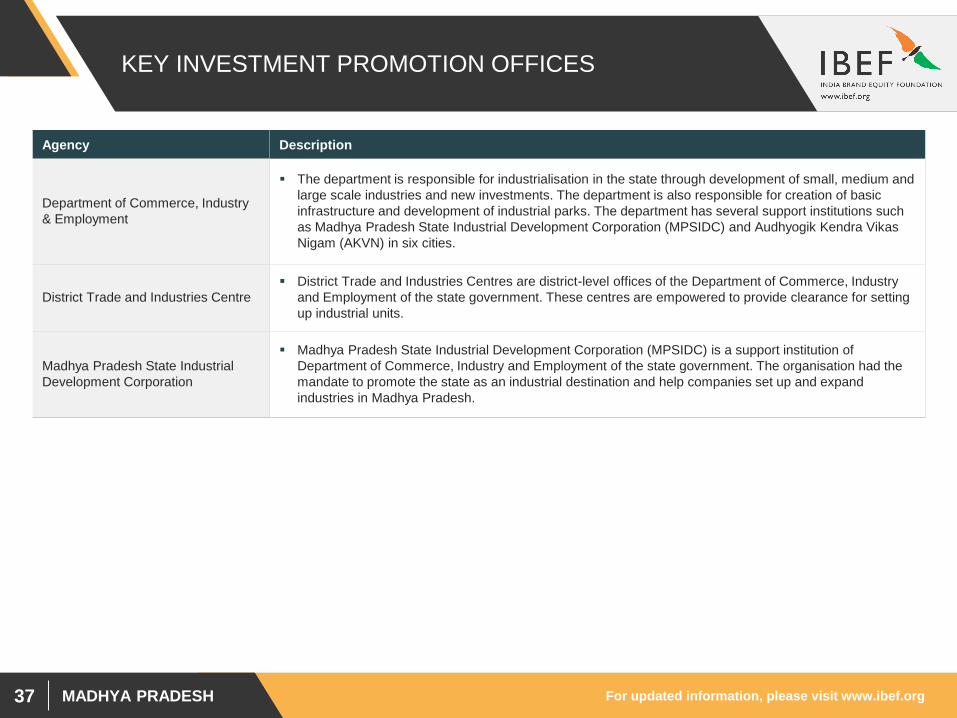
KEY INVESTMENT PROMOTION OFFICES
Agency Description
Department of Commerce, Industry
& Employment
The department is responsible for industrialisation in the state through development of small, medium and
large scale industries and new investments. The department is also responsible for creation of basic
infrastructure and development of industrial parks. The department has several support institutions such
as Madhya Pradesh State Industrial Development Corporation (MPSIDC) and Audhyogik Kendra Vikas
Nigam (AKVN) in six cities.
District Trade and Industries Centre
District Trade and Industries Centres are district-level offices of the Department of Commerce, Industry
and Employment of the state government. These centres are empowered to provide clearance for setting
up industrial units.
Madhya Pradesh State Industrial
Development Corporation
Madhya Pradesh State Industrial Development Corporation (MPSIDC) is a support institution of
Department of Commerce, Industry and Employment of the state government. The organisation had the
mandate to promote the state as an industrial destination and help companies set up and expand
industries in Madhya Pradesh.
For updated information, please visit www.ibef.orgMADHYA PRADESH38
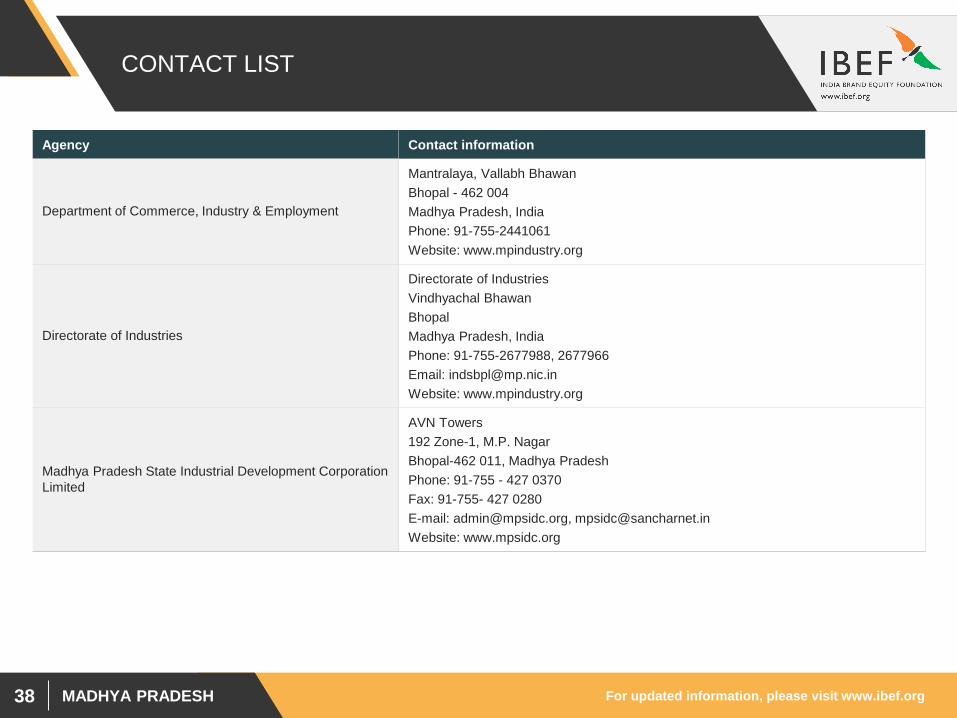
CONTACT LIST
Agency Contact information
Department of Commerce, Industry & Employment
Mantralaya, Vallabh Bhawan
Bhopal - 462 004
Madhya Pradesh, India
Phone: 91-755-2441061
Website: www.mpindustry.org
Directorate of Industries
Directorate of Industries
Vindhyachal Bhawan
Bhopal
Madhya Pradesh, India
Phone: 91-755-2677988, 2677966
Email: [email protected]
Website: www.mpindustry.org
Madhya Pradesh State Industrial Development Corporation
Limited
AVN Towers
192 Zone-1, M.P. Nagar
Bhopal-462 011, Madhya Pradesh
Phone: 91-755 - 427 0370
Fax: 91-755- 427 0280
E-mail: [email protected], [email protected]
Website: www.mpsidc.org
For updated information, please visit www.ibef.orgMADHYA PRADESH39
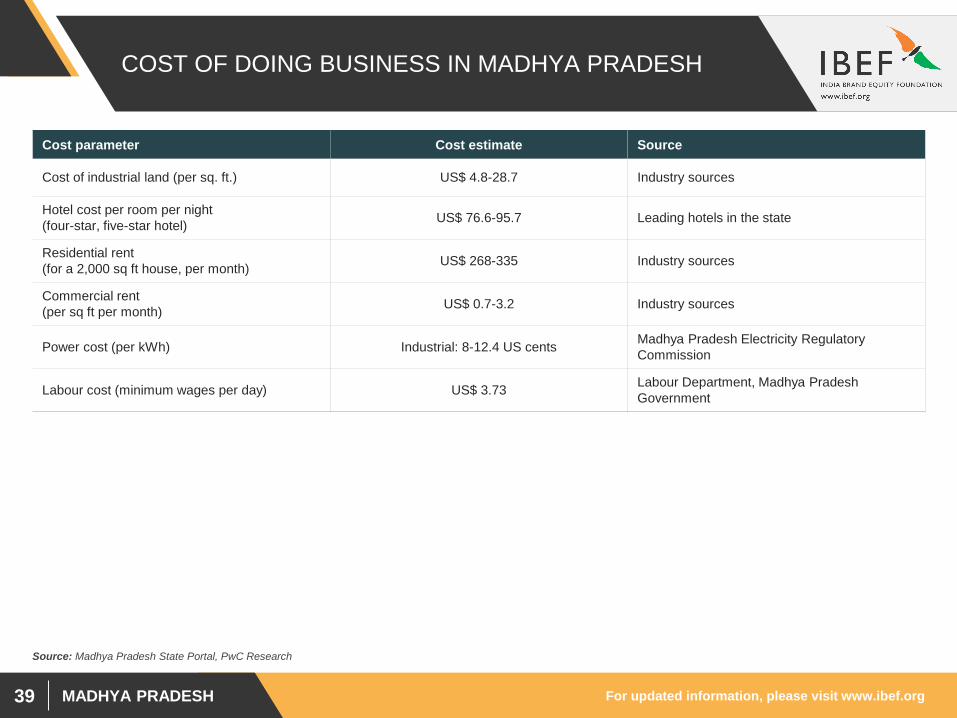
COST OF DOING BUSINESS IN MADHYA PRADESH
Cost parameter Cost estimate Source
Cost of industrial land (per sq. ft.) US$ 4.8-28.7 Industry sources
Hotel cost per room per night
(four-star, five-star hotel)US$ 76.6-95.7 Leading hotels in the state
Residential rent
(for a 2,000 sq ft house, per month)US$ 268-335 Industry sources
Commercial rent
(per sq ft per month)US$ 0.7-3.2 Industry sources
Power cost (per kWh) Industrial: 8-12.4 US centsMadhya Pradesh Electricity Regulatory
Commission
Labour cost (minimum wages per day) US$ 3.73Labour Department, Madhya Pradesh
Government
Source: Madhya Pradesh State Portal, PwC Research
For updated information, please visit www.ibef.orgMADHYA PRADESH40
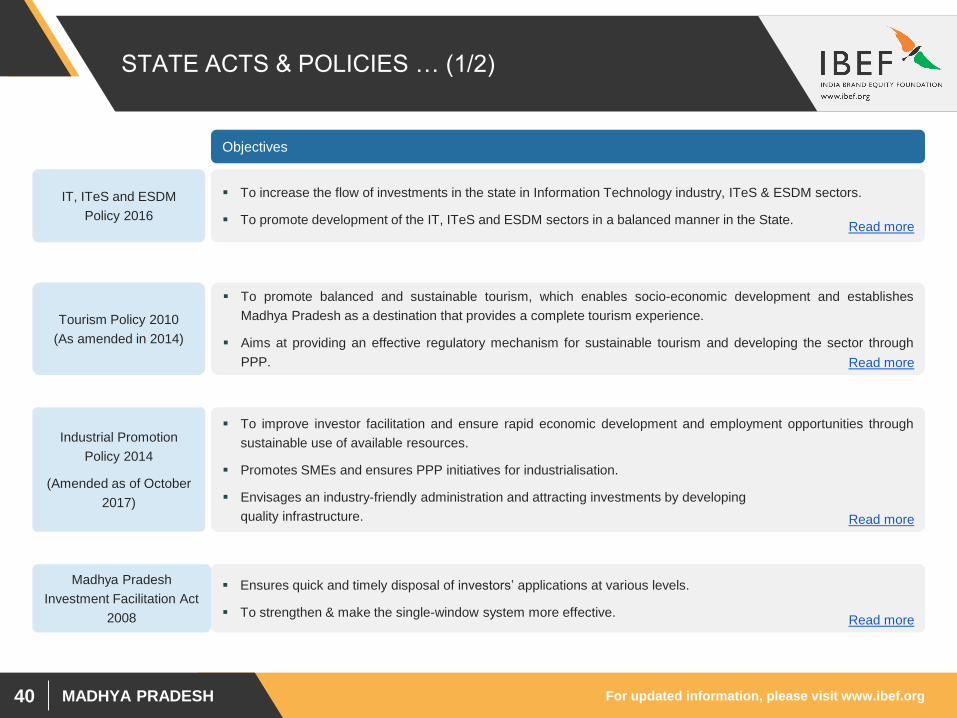
STATE ACTS & POLICIES … (1/2)
IT, ITeS and ESDM
Policy 2016
To increase the flow of investments in the state in Information Technology industry, ITeS & ESDM sectors.
To promote development of the IT, ITeS and ESDM sectors in a balanced manner in the State.
To promote balanced and sustainable tourism, which enables socio-economic development and establishes
Madhya Pradesh as a destination that provides a complete tourism experience.
Aims at providing an effective regulatory mechanism for sustainable tourism and developing the sector through
PPP.
Tourism Policy 2010
(As amended in 2014)
To improve investor facilitation and ensure rapid economic development and employment opportunities through
sustainable use of available resources.
Promotes SMEs and ensures PPP initiatives for industrialisation.
Envisages an industry-friendly administration and attracting investments by developing
quality infrastructure.
Industrial Promotion
Policy 2014
(Amended as of October
2017)
Objectives
Ensures quick and timely disposal of investors’ applications at various levels.
To strengthen & make the single-window system more effective.
Read more
Read more
Read more
Read more
Madhya Pradesh
Investment Facilitation Act
2008
For updated information, please visit www.ibef.orgMADHYA PRADESH41
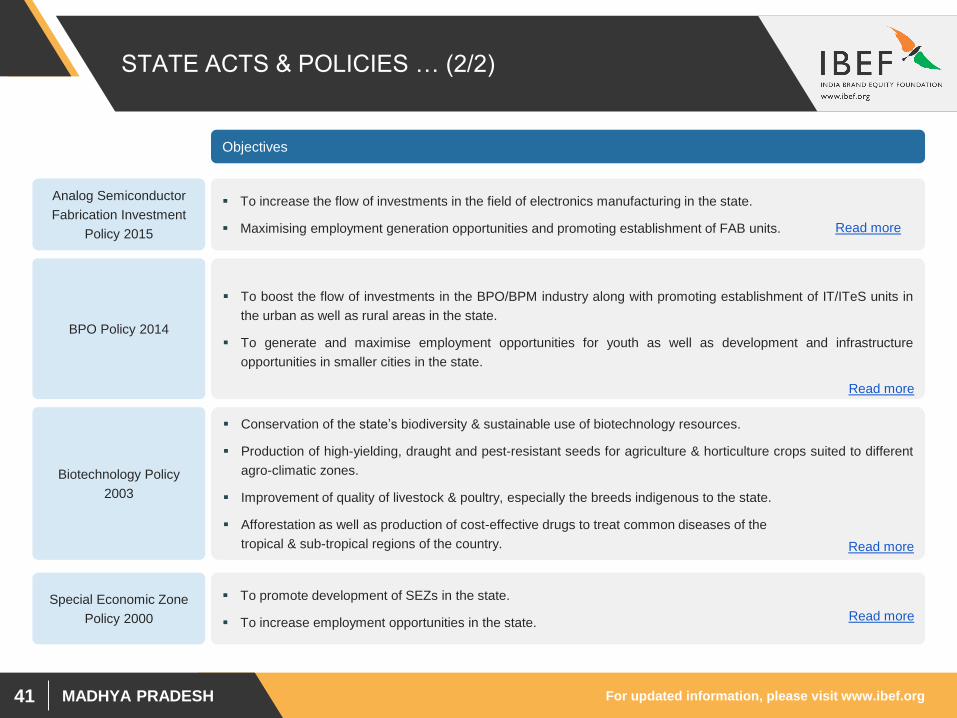
STATE ACTS & POLICIES … (2/2)
Conservation of the state’s biodiversity & sustainable use of biotechnology resources.
Production of high-yielding, draught and pest-resistant seeds for agriculture & horticulture crops suited to different
agro-climatic zones.
Improvement of quality of livestock & poultry, especially the breeds indigenous to the state.
Afforestation as well as production of cost-effective drugs to treat common diseases of the
tropical & sub-tropical regions of the country.
Biotechnology Policy
2003
Objectives
Special Economic Zone
Policy 2000
To promote development of SEZs in the state.
To increase employment opportunities in the state.
To increase the flow of investments in the field of electronics manufacturing in the state.
Maximising employment generation opportunities and promoting establishment of FAB units.
Analog Semiconductor
Fabrication Investment
Policy 2015
To boost the flow of investments in the BPO/BPM industry along with promoting establishment of IT/ITeS units in
the urban as well as rural areas in the state.
To generate and maximise employment opportunities for youth as well as development and infrastructure
opportunities in smaller cities in the state.
BPO Policy 2014
Read more
Read more
Read more
Read more
MADHYA PRADESH
ANNEXURE
For updated information, please visit www.ibef.orgMADHYA PRADESH43
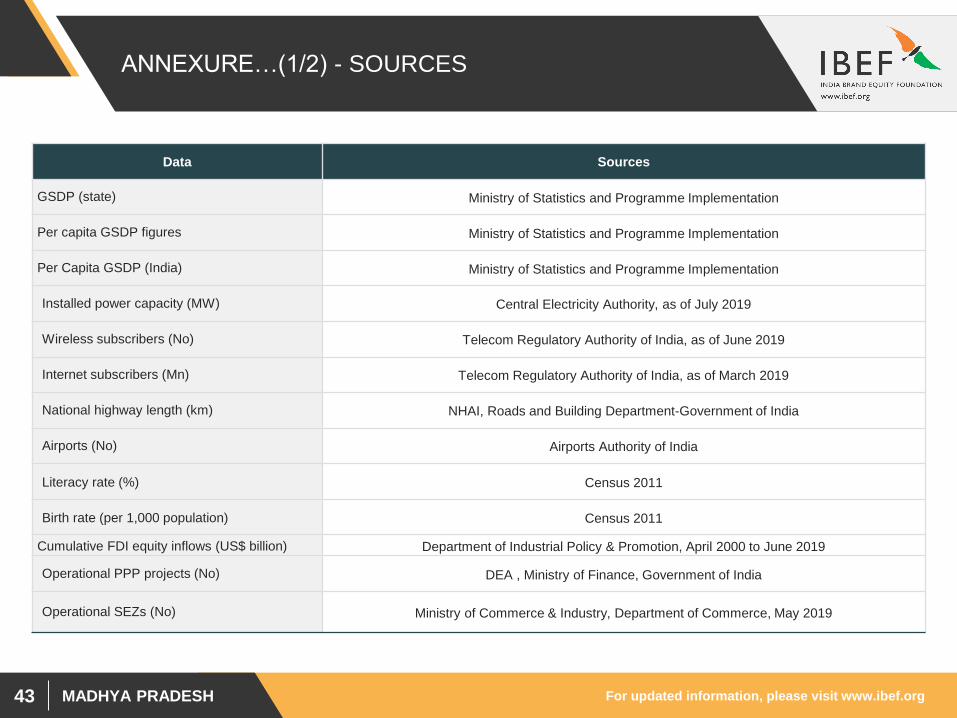
ANNEXURE…(1/2) - SOURCES
Data Sources
GSDP (state) Ministry of Statistics and Programme Implementation
Per capita GSDP figures Ministry of Statistics and Programme Implementation
Per Capita GSDP (India) Ministry of Statistics and Programme Implementation
Installed power capacity (MW) Central Electricity Authority, as of July 2019
Wireless subscribers (No) Telecom Regulatory Authority of India, as of June 2019
Internet subscribers (Mn) Telecom Regulatory Authority of India, as of March 2019
National highway length (km) NHAI, Roads and Building Department-Government of India
Airports (No) Airports Authority of India
Literacy rate (%) Census 2011
Birth rate (per 1,000 population) Census 2011
Cumulative FDI equity inflows (US$ billion) Department of Industrial Policy & Promotion, April 2000 to June 2019
Operational PPP projects (No) DEA , Ministry of Finance, Government of India
Operational SEZs (No) Ministry of Commerce & Industry, Department of Commerce, May 2019
For updated information, please visit www.ibef.orgMADHYA PRADESH44
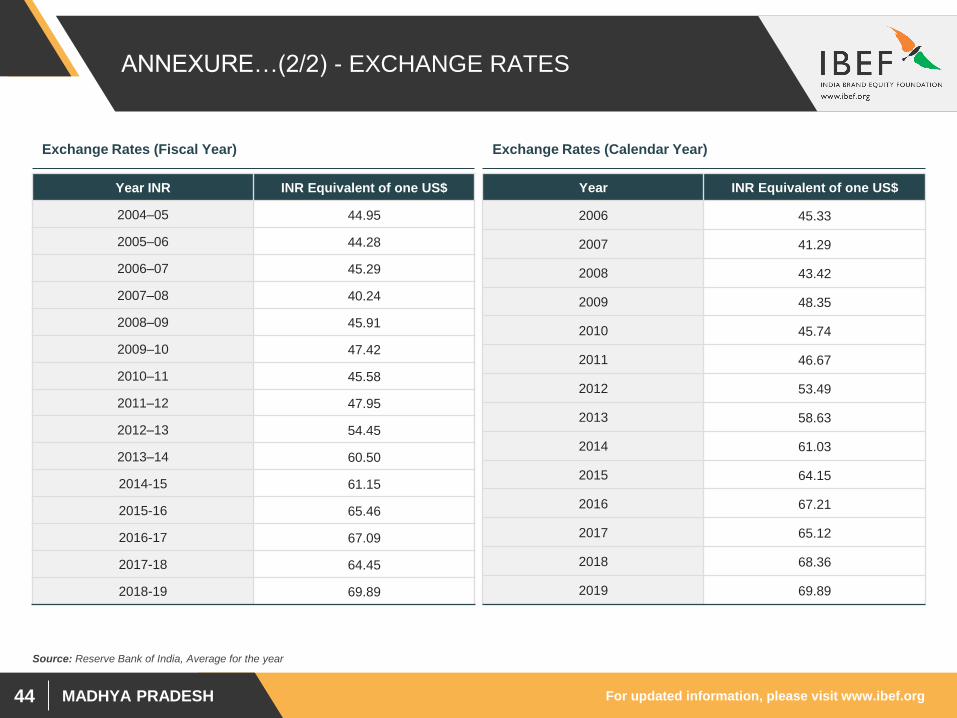
ANNEXURE…(2/2) - EXCHANGE RATES
Exchange Rates (Fiscal Year) Exchange Rates (Calendar Year)
Year INR INR Equivalent of one US$
2004–05 44.95
2005–06 44.28
2006–07 45.29
2007–08 40.24
2008–09 45.91
2009–10 47.42
2010–11 45.58
2011–12 47.95
2012–13 54.45
2013–14 60.50
2014-15 61.15
2015-16 65.46
2016-17 67.09
2017-18 64.45
2018-19 69.89
Year INR Equivalent of one US$
2006 45.33
2007 41.29
2008 43.42
2009 48.35
2010 45.74
2011 46.67
2012 53.49
2013 58.63
2014 61.03
2015 64.15
2016 67.21
2017 65.12
2018 68.36
2019 69.89
Source: Reserve Bank of India, Average for the year
For updated information, please visit www.ibef.orgMADHYA PRADESH45
DISCLAIMER
India Brand Equity Foundation (“IBEF”) engaged TechSci Research to prepare this presentation and the same has been prepared by TechSci
Research in consultation with IBEF.
All rights reserved. All copyright in this presentation and related works is solely and exclusively owned by IBEF. The same may not be reproduced,
wholly or in part in any material form (including photocopying or storing it in any medium by electronic means and whether or not transiently or
incidentally to some other use of this presentation), modified or in any manner communicated to any third party except with the written approval of
IBEF.
This presentation is for information purposes only. While due care has been taken during the compilation of this presentation to ensure that the
information is accurate to the best of TechSci Research and IBEF’s knowledge and belief, the content is not to be construed in any manner
whatsoever as a substitute for professional advice.
TechSci Research and IBEF neither recommend nor endorse any specific products or services that may have been mentioned in this presentation
and nor do they assume any liability or responsibility for the outcome of decisions taken as a result of any reliance placed on this presentation.
Neither TechSci Research nor IBEF shall be liable for any direct or indirect damages that may arise due to any act or omission on the part of the
user due to any reliance placed or guidance taken from any portion of this presentation.