macro indicators - multi act
TRANSCRIPT

1/22/2018 © MULTI-ACT EQUITY CONSULTANCY PVT. LTD 1
Macro IndicatorsJan-2018

1/22/2018 © MULTI-ACT EQUITY CONSULTANCY PVT. LTD 2
GDP Growth Indicators
1/22/2018 © MULTI-ACT EQUITY RESEARCH SERVICES PVT. LTD 3
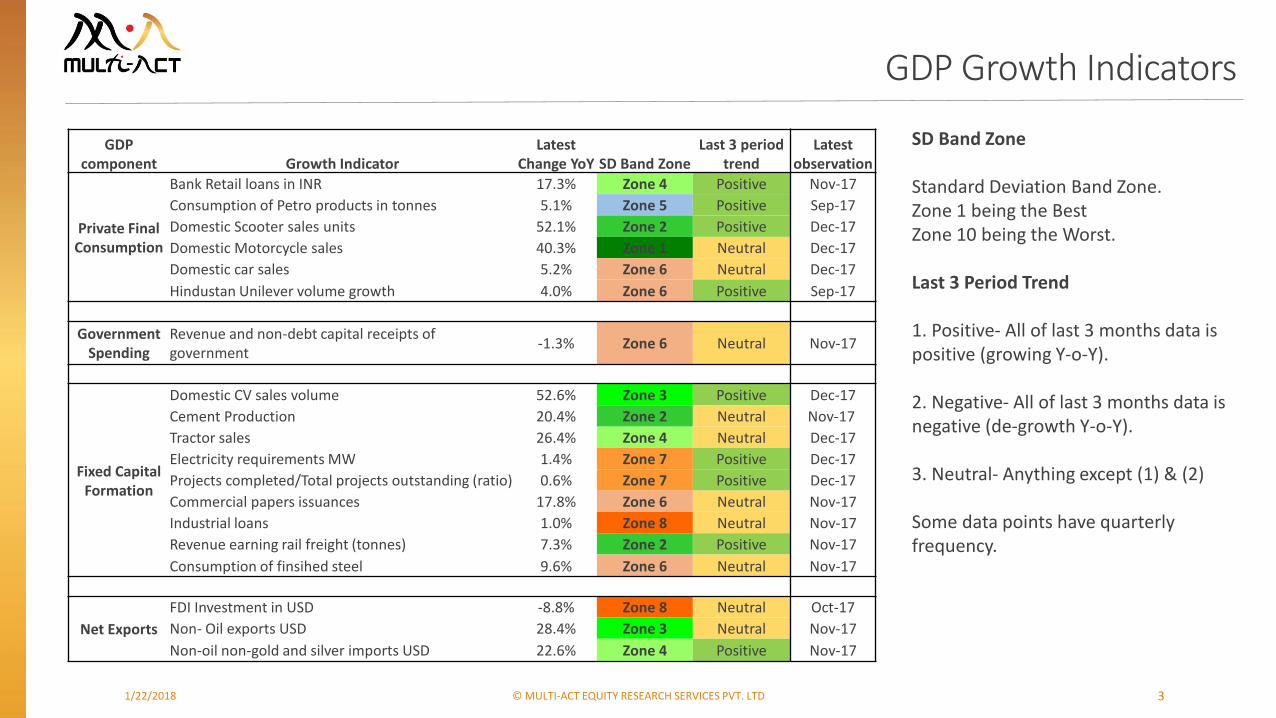
SD Band Zone
Standard Deviation Band Zone.Zone 1 being the BestZone 10 being the Worst.
Last 3 Period Trend
1. Positive- All of last 3 months data is positive (growing Y-o-Y).
2. Negative- All of last 3 months data is negative (de-growth Y-o-Y).
3. Neutral- Anything except (1) & (2)
Some data points have quarterly frequency.
GDP Growth Indicators
GDP component Growth Indicator
Latest Change YoY SD Band Zone
Last 3 period trend
Latest observation
Private Final Consumption
Bank Retail loans in INR 17.3% Zone 4 Positive Nov-17
Consumption of Petro products in tonnes 5.1% Zone 5 Positive Sep-17
Domestic Scooter sales units 52.1% Zone 2 Positive Dec-17
Domestic Motorcycle sales 40.3% Zone 1 Neutral Dec-17
Domestic car sales 5.2% Zone 6 Neutral Dec-17
Hindustan Unilever volume growth 4.0% Zone 6 Positive Sep-17
Government Spending
Revenue and non-debt capital receipts of government
-1.3% Zone 6 Neutral Nov-17
Fixed Capital Formation
Domestic CV sales volume 52.6% Zone 3 Positive Dec-17
Cement Production 20.4% Zone 2 Neutral Nov-17
Tractor sales 26.4% Zone 4 Neutral Dec-17
Electricity requirements MW 1.4% Zone 7 Positive Dec-17
Projects completed/Total projects outstanding (ratio) 0.6% Zone 7 Positive Dec-17
Commercial papers issuances 17.8% Zone 6 Neutral Nov-17
Industrial loans 1.0% Zone 8 Neutral Nov-17
Revenue earning rail freight (tonnes) 7.3% Zone 2 Positive Nov-17
Consumption of finsihed steel 9.6% Zone 6 Neutral Nov-17
Net Exports
FDI Investment in USD -8.8% Zone 8 Neutral Oct-17
Non- Oil exports USD 28.4% Zone 3 Neutral Nov-17
Non-oil non-gold and silver imports USD 22.6% Zone 4 Positive Nov-17

1/22/2018 © MULTI-ACT EQUITY CONSULTANCY PVT. LTD 4
Long term indicators

1/22/2018 © MULTI-ACT EQUITY RESEARCH SERVICES PVT. LTD 5
Updates summary
… Fiscal situation continues to remain under pressure. Though tax collections have grown at healthy pace, it is non-tax revenue that has not kept pace as compared to last year for central government. This can be largely attributed to lower dividend income from state owned companies, especially banks, that have been running losses.
… Inflation rise continues on the back of food inflation. Real interest rates have been declining.
… New projects announcements have hit its lowest. Government’s new project announcement has also seen a dip.
… IIP grew by 8.4%. However, closer look suggests ~2.5% higher growth as a result of a small weight sector. We may see higher IIP growth over next few months on account of low base from last year because of impact of demonetization and GST implementation.
… Bank credit growth has improved on the back of “Services” segment. Credit to Industry continues to remain low, but has turned positive now.
… Trade deficit continues to remain high in absolute amount. Import-Export ratio continues to indicate near upper limit scenario. Capital flows have largely kept INR in the range of 63-64 levels vs. USD. Current trend price is ~INR 59 per USD.
… Nifty continues to quote towards higher end based on rolled over valuation ranges for Mar-19. Sensex Fair Value Analysis, that incorporates normalized scenario, suggests Sensex is slightly above its fair value. Sensex range for Dec-2018 is 24,200 – 40,800.
… Valuation in small and midcap continue to appear stretched based on median P/E. Overall sentiments continue to indicate prevailing optimism in many segments.

1/22/2018 © MULTI-ACT EQUITY RESEARCH SERVICES PVT. LTD 6
Fiscal Deficit
6.7%
7.5%
8.9%
6.2%
4.0%
5.0%
6.0%
7.0%
8.0%
9.0%
10.0%
Centre + State fiscal deficit as a % of GDP
Gross fiscal deficit (Centre+State) Average Upper limit Lower limit
… Concerns over India missing its fiscal deficit target of 3.2% for FY-18 rise.
… Room for government to spend for the remaining period declines significantly.
… Early estimates suggests 2017-18 GDP growth at 6.5%, down from 7.1% during previous year.
… This puts higher onus on government capital spending to kick start economic recovery.
… Fiscal situation, tax collections and quality of government spending requires further monitoring.
Fiscal deficit % of budget
Apr-Nov 2017 112.0%
Apr-Nov 2016 85.8%

1/22/2018 © MULTI-ACT EQUITY RESEARCH SERVICES PVT. LTD 7
Tracking Government Spending
… Tax collections have slowed down slightly, largely owing to lower GST collections during November.
… Corporate tax continue to grow at ~12%.
… Non-tax revenue has seen a big decline during the period and has been one of the major source of deteriorating fiscal deficit.
… Non-tax revenue is largely impacted because of lower dividends by state owned companies, especially banks that are facing high NPA situation.
… March quarter generally has higher tax collection.
*Note: There appears to be some reclassification in Capital expenditure and revenue expenditure during Oct-17 onwards. Both have declined in absolute terms.
Ministry of Finance
13.1%
29.3%
16.2% 12.6%
-39.7%
-60.0%
-40.0%
-20.0%
0.0%
20.0%
40.0%
Revenue expenditure Capital expenditure Interest payment Net Tax Revenue Non-tax Revenue
Central government - spending growth YoYApr - Nov 2017*
INR crores Nov-17 Nov-16 Growth
Gross 10,87,302 9,33,280 16.5%
Corporate tax 2,49,829 2,22,258 12.4%
Income tax 2,15,183 1,86,675 15.3%
CGST + IGST + Cess 2,54,675 -
18.3%Excise 1,65,167 2,13,584
Service tax 79,129 1,46,839
Customs* 1,02,837 1,48,501
Others 20,386 15,424 32.2%
Assignment to states -3,85,286 -3,07,814 25.2%
* Some customs duty paid entitles tax credit under GST

1/22/2018 © MULTI-ACT EQUITY CONSULTANCY PVT. LTD 8
Inflation
Sources: Factset, MOSPI. Moving average chart.
… Consumer and wholesale Inflation continues to inch up gradually.
… Food inflation has reverted back to average levels.
Sources: eaindustry.nic.in, Factset
0.0%
5.0%
10.0%
15.0%
20.0%
19
98
19
99
20
00
20
01
20
02
20
03
20
04
20
05
20
06
20
07
20
08
20
09
20
10
20
11
20
12
20
13
20
14
20
15
20
16
20
17
India Consumer Inflation - Dec 17
India CPI YoY Mean Upper Limit Lower Limit
-2.0%
0.0%
2.0%
4.0%
6.0%
8.0%
10.0%
12.0%
Jan
-14
Ap
r-1
4
Jul-
14
Oct
-14
Jan
-15
Ap
r-1
5
Jul-
15
Oct
-15
Jan
-16
Ap
r-1
6
Jul-
16
Oct
-16
Jan
-17
Ap
r-1
7
Jul-
17
Oct
-17
CPI - Food Inflation - Dec 2017
YoY Growth Average

Positive real interest rates
1/22/2018 © MULTI-ACT EQUITY CONSULTANCY PVT. LTD 9
… Real interest rates continue to decline.
… Yields on government bonds continue to rise gradually. Government’s fiscal position and rising inflation continues to remain an overhang.
… Commentaries suggests that interest rates in India may have bottomed out.
… FII inflows into India’s debt market remain low.
Real risk free rate is Based on 3 month rolling CPI average.
(30,000)
(20,000)
(10,000)
-
10,000
20,000
30,000
Jan
-16
Feb
-16
Mar
-16
Ap
r-1
6
May
-16
Jun
-16
Jul-
16
Au
g-1
6
Sep
-16
Oct
-16
No
v-1
6
Dec
-16
Jan
-17
Feb
-17
Mar
-17
Ap
r-1
7
May
-17
Jun
-17
Jul-
17
Au
g-1
7
Sep
-17
Oct
-17
No
v-1
7
Dec
-17
FII - Net debt inflows
-10.0%
-5.0%
0.0%
5.0%
10.0%
19
98
19
99
20
00
20
01
20
02
20
03
20
04
20
05
20
06
20
07
20
08
20
09
20
10
20
11
20
12
20
13
20
14
20
15
20
16
20
17
India risk free real interest rate - Dec 17
Real rate Mean Upper limit Lower limit

1/22/2018 © MULTI-ACT EQUITY CONSULTANCY PVT. LTD 10
Capital formation
… New projects announcements continue to remain weak.
… Stalling of projects by private sector is at one of its highest level at 25% as a proportion of projects under implementation.
… Capacity utilization, based on RBI’s survey of 805 manufacturing companies indicates seasonal drop during June-17 quarter as compared to Mar-17 quarter.
Sources: RBI, CMIESources: CMIE, Mint
0%
10%
20%
30%
40%
50%
60%
70%
Mar
-96
Dec
-96
Sep
-97
Jun
-98
Mar
-99
Dec
-99
Sep
-00
Jun
-01
Mar
-02
Dec
-02
Sep
-03
Jun
-04
Mar
-05
Dec
-05
Sep
-06
Jun
-07
Mar
-08
Dec
-08
Sep
-09
Jun
-10
Mar
-11
Dec
-11
Sep
-12
Jun
-13
Mar
-14
Dec
-14
Sep
-15
Jun
-16
Mar
-17
Dec
-17
New Capex as a % of GDP - Dec 17

1/22/2018 © MULTI-ACT EQUITY RESEARCH SERVICES PVT. LTD 11
Index of Industrial Production
… IIP showed strong trend during Nov-17, growing by 8.4%. However, closer reading of the press note indicates that ~2.5% of 8.4% growth was contributed by a small segment (Digestive Enzymes and Antacids!) that has 0.22% in the overall index. Thus, IIP growth can be construed as around 5.5-6.0%.
… 8 core sectors grew by 6.8% during Nov-17 to a 13 month high, led by cement and steel.
… Dec-17 Nikkei Purchasing Managers Index index also jumped to 54.7. One needs to account for low base as a result of Demonetisation.
… Considering low bases between Dec-16 and June-17, we may see higher growth IIP for next few months.
Sources: MOSPI (% in brackets are weights in the general index. Nov-17
-2.0%
0.0%
2.0%
4.0%
6.0%
8.0%
10.0%
Ap
r-1
3
Jul-
13
Oct
-13
Jan
-14
Ap
r-1
4
Jul-
14
Oct
-14
Jan
-15
Ap
r-1
5
Jul-
15
Oct
-15
Jan
-16
Ap
r-1
6
Jul-
16
Oct
-16
Jan
-17
Ap
r-1
7
Jul-
17
Oct
-17
IIP - General Index (100%)
-10.0%
-5.0%
0.0%
5.0%
10.0%
15.0%
Ap
r-1
3
Jul-
13
Oct
-13
Jan
-14
Ap
r-1
4
Jul-
14
Oct
-14
Jan
-15
Ap
r-1
5
Jul-
15
Oct
-15
Jan
-16
Ap
r-1
6
Jul-
16
Oct
-16
Jan
-17
Ap
r-1
7
Jul-
17
Oct
-17
IIP - Infra (12.3%)
-4.0%
-2.0%
0.0%
2.0%
4.0%
6.0%
8.0%
10.0%
Ap
r-1
3
Au
g-1
3
Dec
-13
Ap
r-1
4
Au
g-1
4
Dec
-14
Ap
r-1
5
Au
g-1
5
Dec
-15
Ap
r-1
6
Au
g-1
6
Dec
-16
Ap
r-1
7
Au
g-1
7
IIP - Manufacturing (77.6%)

1/22/2018 © MULTI-ACT EQUITY CONSULTANCY PVT. LTD 12
Credit Growth still low
… Bank credit is witnessing some revival in growth.
… This may be construed as good quality growth considering the fact that bank credit had declined significantly only after Dec-16 post demonetization. However, it is to be noted that if the trend continues, bank credit growth over next few months can optically look higher.
Sources: RBI, SEBI
0.0%
5.0%
10.0%
15.0%
20.0%
25.0%
0%
10%
20%
30%
40%
50%
60%
70%
80%
90%
100%
Jun
-11
Sep
-11
Dec
-11
Mar
-12
Jun
-12
Sep
-12
Dec
-12
Mar
-13
Jun
-13
Sep
-13
Dec
-13
Mar
-14
Jun
-14
Sep
-14
Dec
-14
Mar
-15
Jun
-15
Sep
-15
Dec
-15
Mar
-16
Jun
-16
Sep
-16
Dec
-16
Mar
-17
Jun
-17
Sep
-17
Overall Credit Growth
Bank credit Corporate Bonds Commercial Papers Total Credit growth
0.0%
5.0%
10.0%
15.0%
20.0%
25.0%
30.0%
35.0%
40.0%
Dec
-97
Dec
-98
Dec
-99
Dec
-00
Dec
-01
Dec
-02
Dec
-03
Dec
-04
Dec
-05
Dec
-06
Dec
-07
Dec
-08
Dec
-09
Dec
-10
Dec
-11
Dec
-12
Dec
-13
Dec
-14
Dec
-15
Dec
-16
Dec
-17
Bank credit growth YoY (Dec-17)
Credit growth Average +1 SD -1 SD +2 SD -2 SD

1/22/2018 © MULTI-ACT EQUITY RESEARCH SERVICES PVT. LTD 13
… Growth visible in most sectors.
… Personal loans continue to sustain healthy growth.
… Credit growth towards Services industries continue to improve.
… Though improved, credit growth towards Industry remains low.
Credit growth – Key sectors
-10.0%
-5.0%
0.0%
5.0%
10.0%
15.0%
20.0%
25.0%
Jan-14 Jan-15 Jan-16 Jan-17
Sector wise credit growth
Agri and Allied Industry Services Personal Priority

1/22/2018 © MULTI-ACT EQUITY CONSULTANCY PVT. LTD 14
Current Account Deficit
… Non-oil Exports as well Imports grew significantly during Nov-17. Engineering goods and Chemicals continued to grow at relatively healthy pace.
… Trade deficit in absolute amount remains high at ~$ 8 bn.
… Current Account Deficit had improved to 1.2% of GDP during quarter ended Sept-17 as compared to 2.4% of GDP during Jun-17 quarter.
Sources: RBI, Commerce ministry
0.70
0.80
0.90
1.00
1.10
1.20
1.30
1.40
1.50
1.60
Non-Oil Merchandise Import to Export 12 month rolling - Nov 17
Imports to Exports Average +1 SD -1 SD +2 SD -2 SD
-
1,000
2,000
3,000
4,000
5,000
6,000
7,000
8,000
9,000
10,000
Dec
-15
Jan
-16
Feb
-16
Mar
-16
Ap
r-1
6
May
-16
Jun
-16
Jul-
16
Au
g-1
6
Sep
-16
Oct
-16
No
v-1
6
Dec
-16
Jan
-17
Feb
-17
Mar
-17
Ap
r-1
7
May
-17
Jun
-17
Jul-
17
Au
g-1
7
Sep
-17
Oct
-17
No
v-1
7
Non-Oil Trade Deficit (USD mn)
1/22/2018 © MULTI-ACT EQUITY RESEARCH SERVICES PVT. LTD 15
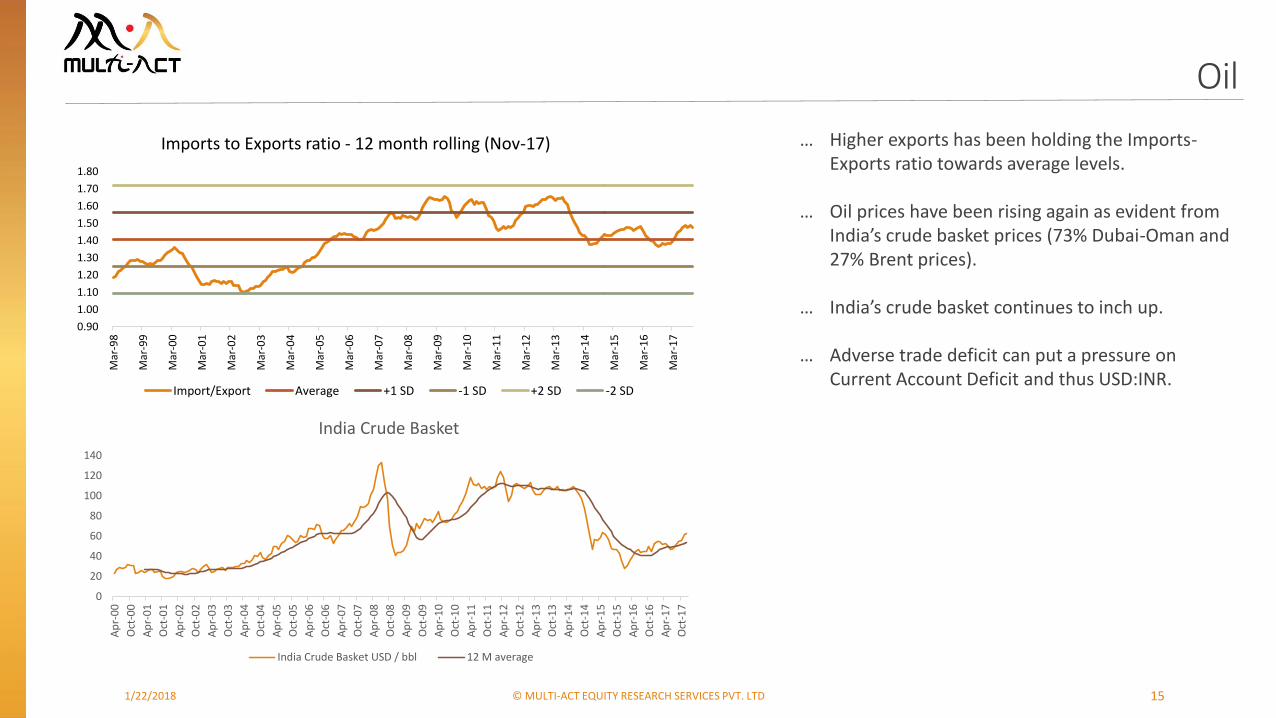
Oil
… Higher exports has been holding the Imports-Exports ratio towards average levels.
… Oil prices have been rising again as evident from India’s crude basket prices (73% Dubai-Oman and 27% Brent prices).
… India’s crude basket continues to inch up.
… Adverse trade deficit can put a pressure on Current Account Deficit and thus USD:INR.
0.90
1.00
1.10
1.20
1.30
1.40
1.50
1.60
1.70
1.80
Mar
-98
Mar
-99
Mar
-00
Mar
-01
Mar
-02
Mar
-03
Mar
-04
Mar
-05
Mar
-06
Mar
-07
Mar
-08
Mar
-09
Mar
-10
Mar
-11
Mar
-12
Mar
-13
Mar
-14
Mar
-15
Mar
-16
Mar
-17
Imports to Exports ratio - 12 month rolling (Nov-17)
Import/Export Average +1 SD -1 SD +2 SD -2 SD
0
20
40
60
80
100
120
140
Ap
r-0
0
Oct
-00
Ap
r-0
1
Oct
-01
Ap
r-0
2
Oct
-02
Ap
r-0
3
Oct
-03
Ap
r-0
4
Oct
-04
Ap
r-0
5
Oct
-05
Ap
r-0
6
Oct
-06
Ap
r-0
7
Oct
-07
Ap
r-0
8
Oct
-08
Ap
r-0
9
Oct
-09
Ap
r-1
0
Oct
-10
Ap
r-1
1
Oct
-11
Ap
r-1
2
Oct
-12
Ap
r-1
3
Oct
-13
Ap
r-1
4
Oct
-14
Ap
r-1
5
Oct
-15
Ap
r-1
6
Oct
-16
Ap
r-1
7
Oct
-17
India Crude Basket
India Crude Basket USD / bbl 12 M average

1/22/2018 © MULTI-ACT EQUITY CONSULTANCY PVT. LTD 16
INR Appreciation
… INR appreciation has steadied for now.
… Strong capital flows continue to overshadow deteriorating trade deficit, keeping INR largely steady.
340
350
360
370
380
390
400
410
420
Feb-17 Mar-17 Apr-17 May-17 Jun-17 Jul-17 Aug-17 Sep-17 Oct-17 Nov-17 Dec-17
India - Forex reserves (USD bn)Dec-17

1/22/2018 © MULTI-ACT EQUITY RESEARCH SERVICES PVT. LTD 17
Gold
… Gold continues to quote below its long term trend price.
-
1,000
2,000
3,000
4,000
5,000
6,000
No
v-1
5
Dec
-15
Jan
-16
Feb
-16
Mar
-16
Ap
r-1
6
May
-16
Jun
-16
Jul-
16
Au
g-1
6
Sep
-16
Oct
-16
No
v-1
6
Dec
-16
Jan
-17
Feb
-17
Mar
-17
Ap
r-1
7
May
-17
Jun
-17
Jul-
17
Au
g-1
7
Sep
-17
Oct
-17
No
v-1
7
Monthly gold imports into India in USD mn (Nov 17)
1/22/2018 © MULTI-ACT EQUITY CONSULTANCY PVT. LTD 18
How are Indian equities currently placed?
1/22/2018 © MULTI-ACT EQUITY CONSULTANCY PVT. LTD 19
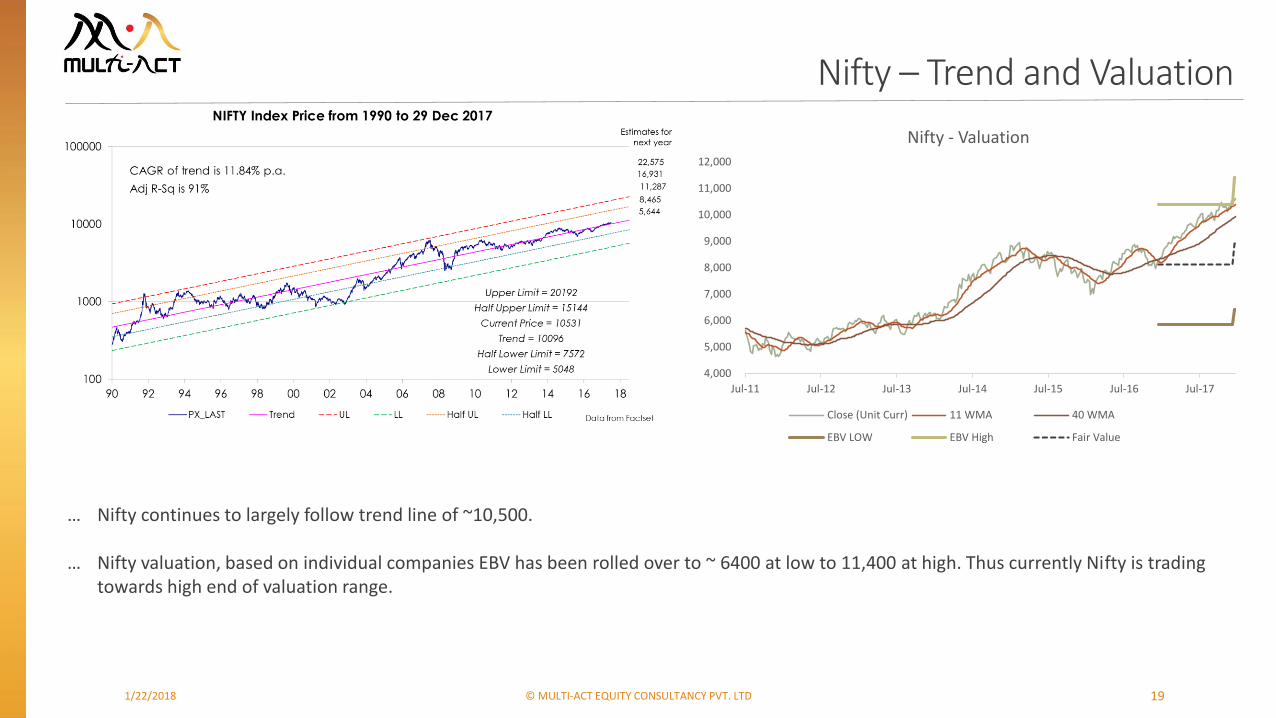
Nifty – Trend and Valuation
… Nifty continues to largely follow trend line of ~10,500.
… Nifty valuation, based on individual companies EBV has been rolled over to ~ 6400 at low to 11,400 at high. Thus currently Nifty is trading towards high end of valuation range.
4,000
5,000
6,000
7,000
8,000
9,000
10,000
11,000
12,000
Jul-11 Jul-12 Jul-13 Jul-14 Jul-15 Jul-16 Jul-17
Nifty - Valuation
Close (Unit Curr) 11 WMA 40 WMA
EBV LOW EBV High Fair Value

1/22/2018 © MULTI-ACT EQUITY CONSULTANCY PVT. LTD 20
Sensex
… Sensex is quoting near its “fair value” based on our normalized approach and continues to quote near its trend line.
… Sensex valuation range based on our fair value analysis is 24,200 – 40,800 for Dec-18. This band includes normalized scenario as well as Bottom up valuation based on individual companies EBV range.
… Though sentiments remains positive with some improved earnings visibility, absence of actual fundamental momentum can keep Sensex below its high end of 40,800 for the time being.
Logarithmic chart
2000
20000
De
c-9
4
De
c-9
5
De
c-9
6
De
c-9
7
De
c-9
8
De
c-9
9
De
c-0
0
De
c-0
1
De
c-0
2
De
c-0
3
De
c-0
4
De
c-0
5
De
c-0
6
De
c-0
7
De
c-0
8
De
c-0
9
De
c-1
0
De
c-1
1
De
c-1
2
De
c-1
3
De
c-1
4
De
c-1
5
De
c-1
6
De
c-1
7
De
c-1
8
Sen
sex
Sensex and Valuation Range
Close Low End High End Mid Band

1/22/2018 © MULTI-ACT EQUITY CONSULTANCY PVT. LTD 21
Nifty valuation – Price/Fair Value
… Long term average P/FV (since mid-2013) for Nifty has is 1.2x
… Nifty is now quoting towards highest levels for the available history.
… Please note that we have rolled over valuation to FY-19 next month.
Note: We have neutralized the impact of our internal valuation updates in the above analysis on 3 month rolling basis.Companies that have old valuations have been ignored. They comprise of small % of Nifty.FV = Fair Value or mid-band of our EBV
P/FV band 11-Jan-18
Below 0.5 0.0%Cheap
0.5 TO 0.75 0.0%
0.75 TO 1 25.4% Fairly valued
1 TO 1.25 35.7%Expensive
1.25 TO1.5 15.2%
1.5 TO 1.75 2.5% Very ExpensiveAbove 1.75 19.6%
Nifty P/FV 1.29
0.9
1.0
1.0
1.1
1.1
1.2
1.2
1.3
1.3
1.4
1.4
0%
10%
20%
30%
40%
50%
60%
70%
80%
90%
100%
Jul-
13
Sep
-13
No
v-1
3
Jan
-14
Mar
-14
May
-14
Jul-
14
Sep
-14
No
v-1
4
Jan
-15
Mar
-15
May
-15
Jul-
15
Sep
-15
No
v-1
5
Jan
-16
Mar
-16
May
-16
Jul-
16
Sep
-16
No
v-1
6
Jan
-17
Mar
-17
May
-17
Jul-
17
Sep
-17
No
v-1
7
Jan
-18
Nif
ty W
eig
hte
d A
vera
ge P
/FV
Nif
ty w
eig
ht
Nifty Price to Fair Value
Cheap Fairly Valued Expensive
Very Expensive Nifty P/FV Average Nifty P/FV

1/22/2018 © MULTI-ACT EQUITY CONSULTANCY PVT. LTD 22
High Quality valuation – Price/Fair Value
… It is to be noted that IT large cap companies are quoting closer to P/V of 1 within HQ companies.
… Long term (since mid-2013) P/FV of HQ companies as per our coverage is ~1.3x.
… Please note that we have rolled over valuation to FY-19 next month.
Note: We have neutralized the impact of our internal valuation updates in the above analysis on 3 month rolling basis.High Quality = Grade A and B+ companies as per MA framework.
P/FV band 10-Nov-17
Below 0.5 0.0%Cheap
0.5 TO 0.75 0.0%
0.75 TO 1 10.8% Fairly valued
1 TO 1.25 45.7%Expensive
1.25 TO1.5 7.0%
1.5 TO 1.75 11.3% Very ExpensiveAbove 1.75 25.2%
Nifty P/FV 1.38
1.05
1.10
1.15
1.20
1.25
1.30
1.35
1.40
1.45
1.50
1.55
0%
10%
20%
30%
40%
50%
60%
70%
80%
90%
100%Ju
l-1
3
Sep
-13
No
v-1
3
Jan
-14
Mar
-14
May
-14
Jul-
14
Sep
-14
No
v-1
4
Jan
-15
Mar
-15
May
-15
Jul-
15
Sep
-15
No
v-1
5
Jan
-16
Mar
-16
May
-16
Jul-
16
Sep
-16
No
v-1
6
Jan
-17
Mar
-17
May
-17
Jul-
17
Sep
-17
No
v-1
7
Jan
-18
HQ
m-c
ap w
eig
hte
d a
vera
ge P
/FV
HQ
co
mp
anie
s w
eig
ht
High Quality Price to Fair Value
Cheap Fair Value Expensive Very Expensive HQ P/FV Average HQ P/FV

1/22/2018 © MULTI-ACT EQUITY CONSULTANCY PVT. LTD 23
Sentiment – HQ:LQ Index
… HQ:LQ Index continues to indicate optimism towards LQ companies.
Performance Dec-17
High Quality 3.3%
Low Quality 10.1%
Sensex 2.7%
BSE Mid 5.3%
BSE Small 5.5%
NSE Quality 30 4.8%
-1.00
-0.50
0.00
0.50
1.00
1.50
2.00
Ratio of High Quality Index Vs Low Quality Index (EWI)
Ln(Ratio) Average `+2 SD `+1 SD `-1 SD `-2 SD

1/22/2018 © MULTI-ACT EQUITY CONSULTANCY PVT. LTD 24
Sentiment – HQ and LQ Index
… HQ and LQ Indices both continue to remain strong.
… Note that indices will be balanced during January-2018. Above chart is as at Dec-17.
Note: Both indices are equal weighted and balanced annually. As at Dec-2017
0
100
200
300
400
500
600
700
800
Dec
-02
Dec
-03
Dec
-04
Dec
-05
Dec
-06
Dec
-07
Dec
-08
Dec
-09
Dec
-10
Dec
-11
Dec
-12
Dec
-13
Dec
-14
Dec
-15
Dec
-16
Dec
-17
High Quality Index - Equal Weighted Index
High Quality Index 200 D Average 50 D Average
-
50
100
150
200
250
300
350
Dec
-02
Dec
-03
Dec
-04
Dec
-05
Dec
-06
Dec
-07
Dec
-08
Dec
-09
Dec
-10
Dec
-11
Dec
-12
Dec
-13
Dec
-14
Dec
-15
Dec
-16
Dec
-17
Low Quality Index
Low Quality Index 200 D Average 50 D Average

1/22/2018 © MULTI-ACT EQUITY RESEARCH SERVICES PVT. LTD 25
HQ Index - Valuation
… HQ Index now quotes above high end of valuation band.
… This should be read in context of low to reasonable valuation for IT companies.
0.00
100.00
200.00
300.00
400.00
500.00
600.00
700.00
800.00
HQ Index and Bottom-up Valuation band
HQ Index Low End High End

1/22/2018 © MULTI-ACT EQUITY RESEARCH SERVICES PVT. LTD 26
High valuation pockets
… Small and midcap companies continue to remain in uncharted territory with respect to valuations.
-
5
10
15
20
25
30
35
40
45
Dec
-02
Dec
-03
Dec
-04
Dec
-05
Dec
-06
Dec
-07
Dec
-08
Dec
-09
Dec
-10
Dec
-11
Dec
-12
Dec
-13
Dec
-14
Dec
-15
Dec
-16
Dec
-17
NSE Midcap Median PE
Midcap Median PE Average +2 SD +1 SD -1 SD -2 SD
-
5
10
15
20
25
30
Dec
-02
Dec
-03
Dec
-04
Dec
-05
Dec
-06
Dec
-07
Dec
-08
Dec
-09
Dec
-10
Dec
-11
Dec
-12
Dec
-13
Dec
-14
Dec
-15
Dec
-16
Dec
-17
NSE Small Cap Median PE
Smallcap Median PE Average +2 SD +1 SD -1 SD -2 SD

1/22/2018 © MULTI-ACT EQUITY CONSULTANCY PVT. LTD 27
Sentiment – Regulated Utility Index
Optimism
Pessimism
… RU Index now is near -1SD, indicating continued optimism.
-1.0%
1.0%
3.0%
5.0%
7.0%
9.0%
11.0%
Dec-06 Dec-07 Dec-08 Dec-09 Dec-10 Dec-11 Dec-12 Dec-13 Dec-14 Dec-15 Dec-16 Dec-17
Risk Premium (EWI): Reg Utilities Yield - 10 Yr Bond Yield
Risk Premium Average +2 SD +1 SD -1 SD -2 SD
Risk Premium
+2 SD 9.5%
+1 SD 7.5%
Average 5.6%
-1 SD 3.6%
-2 SD 1.7%

1/22/2018 © MULTI-ACT EQUITY CONSULTANCY PVT. LTD 28
Sentiment – Midcap vs Nifty
… Optimism for mid and small cap continues to remain high despite elevated valuations and lack of clear economic revival.
… Note that chart # 1 is converted from long term average ratio basis to 7 year moving average basis to suggest latest “market cycle” distribution.
0.60
0.80
1.00
1.20
1.40
1.60
1.80
2.00
2.20
Jan
-01
Jan
-02
Jan
-03
Jan
-04
Jan
-05
Jan
-06
Jan
-07
Jan
-08
Jan
-09
Jan
-10
Jan
-11
Jan
-12
Jan
-13
Jan
-14
Jan
-15
Jan
-16
Jan
-17
Midcap to Nifty Index ratio (11-Jan-17)7 year rolling basis
Midcap/Nifty Mean +1 SD -1SD +2SD -2SD
0.35
0.45
0.55
0.65
0.75
0.85
Jul-
02
Feb
-03
Sep
-03
Ap
r-0
4
No
v-0
4
Jun
-05
Jan
-06
Au
g-0
6
Mar
-07
Oct
-07
May
-08
Dec
-08
Jul-
09
Feb
-10
Sep
-10
Ap
r-1
1
No
v-1
1
Jun
-12
Jan
-13
Au
g-1
3
Mar
-14
Oct
-14
May
-15
Dec
-15
Jul-
16
Feb
-17
Sep
-17
Nifty 50 vs Nifty 500 turnover
Nifty/Nifty 500 Mean +1 SD -1 SD +2 SD -2 SD

1/22/2018 © MULTI-ACT EQUITY CONSULTANCY PVT. LTD 29
Sentiment – FII
Adjusted with long term inflation rate. As at Dec-17. In INR bn
… FII inflows into Indian equities had seen a big jump during Nov-17. Overall flows remain erratic.
INR crores
(1,000)
(500)
-
500
1,000
1,500
2,000
2,500
Dec
-00
Jul-
01
Feb
-02
Sep
-02
Ap
r-0
3
No
v-0
3
Jun
-04
Jan
-05
Au
g-0
5
Mar
-06
Oct
-06
May
-07
Dec
-07
Jul-
08
Feb
-09
Sep
-09
Ap
r-1
0
No
v-1
0
Jun
-11
Jan
-12
Au
g-1
2
Mar
-13
Oct
-13
May
-14
Dec
-14
Jul-
15
Feb
-16
Sep
-16
Ap
r-1
7
No
v-1
7
FII net inflows - 12M rolling
(30,000)
(20,000)
(10,000)
-
10,000
20,000
30,000
40,000
Dec
-15
Jan
-16
Feb
-16
Mar
-16
Ap
r-1
6
May
-16
Jun
-16
Jul-
16
Au
g-1
6
Sep
-16
Oct
-16
No
v-1
6
Dec
-16
Jan
-17
Feb
-17
Mar
-17
Ap
r-1
7
May
-17
Jun
-17
Jul-
17
Au
g-1
7
Sep
-17
Oct
-17
No
v-1
7
Dec
-17
Net FII inflows into Indian Equities
1/22/2018 © MULTI-ACT EQUITY CONSULTANCY PVT. LTD 30
Sentiment – Retail
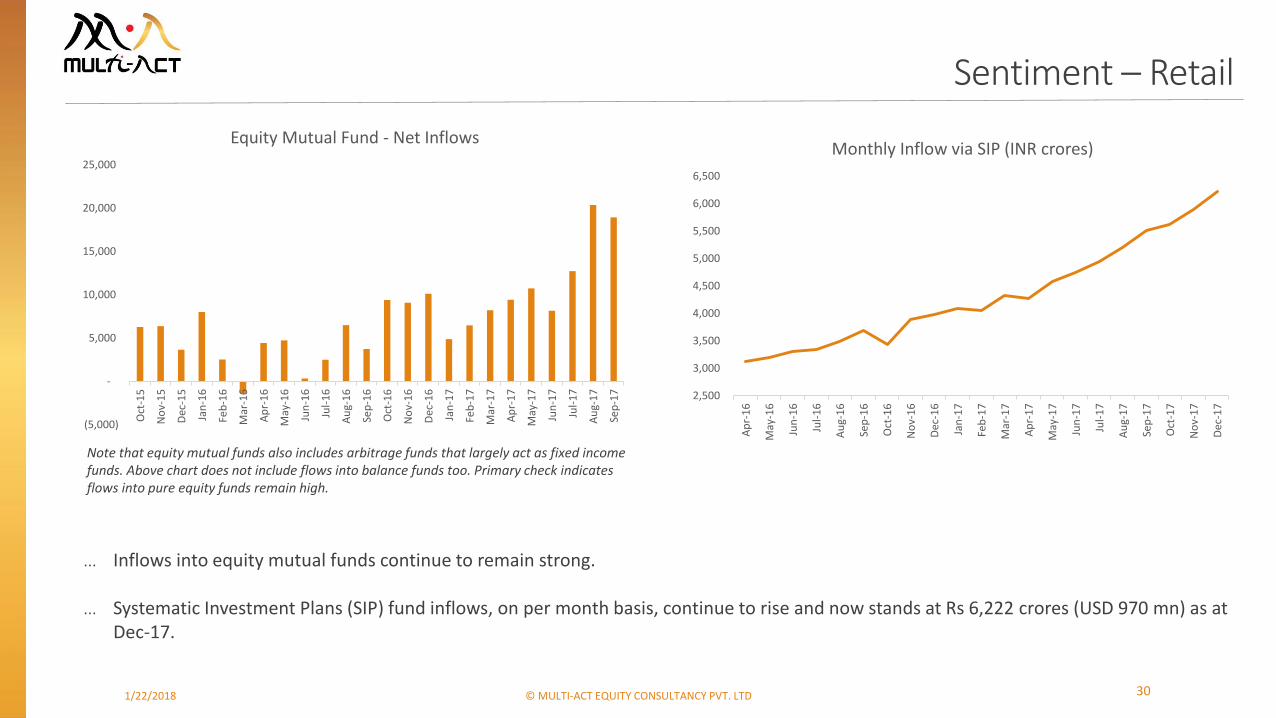
… Inflows into equity mutual funds continue to remain strong.
… Systematic Investment Plans (SIP) fund inflows, on per month basis, continue to rise and now stands at Rs 6,222 crores (USD 970 mn) as at Dec-17.
Note that equity mutual funds also includes arbitrage funds that largely act as fixed income funds. Above chart does not include flows into balance funds too. Primary check indicates flows into pure equity funds remain high.
(5,000)
-
5,000
10,000
15,000
20,000
25,000
Oct
-15
No
v-1
5
Dec
-15
Jan
-16
Feb
-16
Mar
-16
Ap
r-1
6
May
-16
Jun
-16
Jul-
16
Au
g-1
6
Sep
-16
Oct
-16
No
v-1
6
Dec
-16
Jan
-17
Feb
-17
Mar
-17
Ap
r-1
7
May
-17
Jun
-17
Jul-
17
Au
g-1
7
Sep
-17
Equity Mutual Fund - Net Inflows
2,500
3,000
3,500
4,000
4,500
5,000
5,500
6,000
6,500
Ap
r-1
6
May
-16
Jun
-16
Jul-
16
Au
g-1
6
Sep
-16
Oct
-16
No
v-1
6
Dec
-16
Jan
-17
Feb
-17
Mar
-17
Ap
r-1
7
May
-17
Jun
-17
Jul-
17
Au
g-1
7
Sep
-17
Oct
-17
No
v-1
7
Dec
-17
Monthly Inflow via SIP (INR crores)

1/22/2018 © MULTI-ACT EQUITY CONSULTANCY PVT. LTD 31
Advisor’s perspective
1/22/2018 © MULTI-ACT EQUITY CONSULTANCY PVT. LTD 32
What to make of all these?
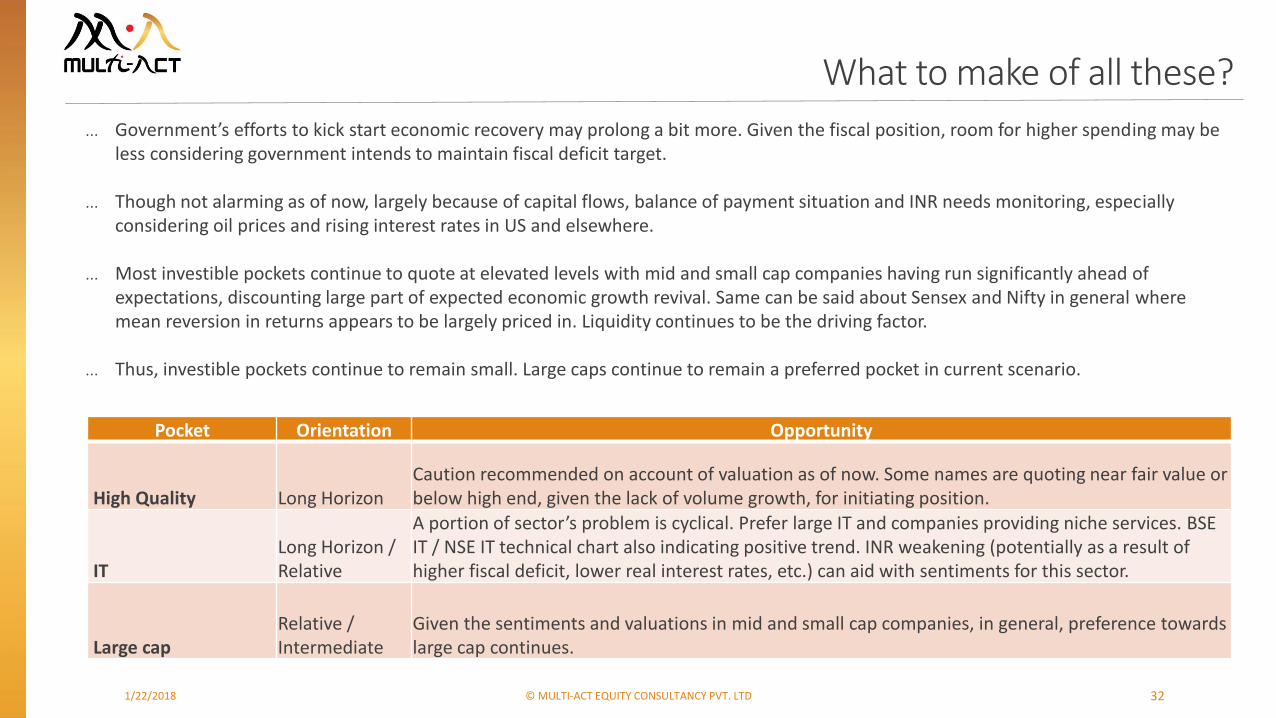
… Government’s efforts to kick start economic recovery may prolong a bit more. Given the fiscal position, room for higher spending may be less considering government intends to maintain fiscal deficit target.
… Though not alarming as of now, largely because of capital flows, balance of payment situation and INR needs monitoring, especially considering oil prices and rising interest rates in US and elsewhere.
… Most investible pockets continue to quote at elevated levels with mid and small cap companies having run significantly ahead of expectations, discounting large part of expected economic growth revival. Same can be said about Sensex and Nifty in general where mean reversion in returns appears to be largely priced in. Liquidity continues to be the driving factor.
… Thus, investible pockets continue to remain small. Large caps continue to remain a preferred pocket in current scenario.
Pocket Orientation Opportunity
High Quality Long HorizonCaution recommended on account of valuation as of now. Some names are quoting near fair value or below high end, given the lack of volume growth, for initiating position.
ITLong Horizon / Relative
A portion of sector’s problem is cyclical. Prefer large IT and companies providing niche services. BSE IT / NSE IT technical chart also indicating positive trend. INR weakening (potentially as a result of higher fiscal deficit, lower real interest rates, etc.) can aid with sentiments for this sector.
Large capRelative / Intermediate
Given the sentiments and valuations in mid and small cap companies, in general, preference towards large cap continues.
Disclaimer
1/22/2018 © MULTI-ACT EQUITY CONSULTANCY PVT. LTD 33
• This is an Internal Document and meant for only limited circulation. This document has been solely prepared for the Clients of Multi-Act Equity Consultancy Private Limited (MAECL) and is not meant for circulation to any third party.
• The information is prepared on the basis of publicly available information, internally developed data and other sources believed to be reliable. MAECL does not solicit any course of action based on the information provided by it and the investor is advised to exercise independent judgment and act upon the same based on its/his/her sole discretion based on their own investigations and risk-reward preferences.
• MAECL, its associates or any of their respective directors, employees, affiliates or representatives do not assume any responsibility for, or warrant the accuracy, completeness, adequacy and reliability of such information and consequently are not liable for any direct, indirect, special, incidental, consequential, punitive or exemplary damages, including lost profits arising in any way for decisions taken based on the said information.
• The Client shall at all times keep such information / data and material provided by MAECL strictly confidential and will not use, share or disclose such information to any third party.
• It is stated that, as permitted by SEBI Regulations and the Company’s Employee Dealing Policy, MAECL and/or its associates, employees, affiliates and/or individuals, clients of MAECL’s portfolio management services, thereof may have positions in securities referred to in the information provided by it and may make purchases or sale thereof while the information is in circulation.
• The contents herein – information or views – do not amount to distribution, guidelines, an offer or solicitation of any offer to buy or sell any securities or financial instruments, directly or indirectly, in the United States of America (US), in Canada, in jurisdictions where such distribution or offer is not authorized and in FATF non-compliant jurisdiction and are particularly not for US persons (being persons resident in the US, corporations, partnerships or other entities created or organized in or under the laws of the US or any person falling within the definition of the term “US person” under Regulation S promulgated under the US Securities Act of 1933, as amended) and persons of Canada.
General risk factors
•Securities investments are subject to market risks and there is no assurance or guarantee that the objective of the investments will be achieved.
•As with any investment in securities, value of the Client’s investments can go up or down depending on the factors and forces affecting the capital market. MAECL is neither responsible nor liable for any losses resulting from such factors.
•The information on investments is subject to external risks such as war, natural calamities, and policy changes of local / international markets which affect stock markets.
•MAECL has renewed SEBI PMS registration effective October 14, 2014 and has commenced its portfolio management activities with effect from January 2011. However MAECL has more than 10 years of experience in managing its own funds invested in the domestic market.