m&a telecom industry
DESCRIPTION
M&A Analysis on Telecom IndustryTRANSCRIPT
Shareholder Wealth Effects of Mergers & Acquisitions in the
Telecoms Industry
By
Olaf Rieck* Canh Thang Doan
Nanyang Technological University, Singapore
Abstract In the past ten years, waves of Mergers and Acquisitions (M&As) dramatically re-shaped the market structure of global telecommunications. The telecoms industry in Europe and the United States steadily consolidated and firms oligopolized the re-gional industry. Telecoms operators frequently engaged in M&As with the objectives to grow bigger and achieve higher earnings. However, the question arises whether and under what conditions they have really been able to achieve these objectives. Thus, the aim of this paper is to investigate M&As in the telecoms industry and analyze the conditions under which such M&As can be considered successful. In doing so, we employ the event study method, which traces immediate market reactions to M&A announcements and the corresponding shareholder value effects. Assuming efficient markets, shareholder value effects are taken as a perfect reflection of all future benefits (or cost) arising from M&As. This methodology is well established in the finance and strategic management literature, but has rarely been used in the context of the telecommunications industry. We first apply the event study method to our full set of M&As to obtain a broad picture of the shareholder value effects of M&As in the telecoms industry. We then proceed by investigating specifically (1) whether the shareholder value effects depend on the degree to which M&As are driven by a service diversification strategy; and (2) whether the shareholder value effects depend on the M&As being driven by an international diversification strategy. The empirical findings show that there is an overall positive shareholder wealth effect associated to M&A announcements in the telecommunication industry. This is especially true for telecommunication operators engaging in cross-border M&As. They experience positive abnormal returns and outperform firms that expand domestically. In addition, when investigating service diversification and international diversification, mergers that are both non-conglomerate and cross-border are found to add value to the acquiring telecommunications operator, whereas no significant stock reactions are found when acquirers engage in conglomerate domestic mergers.
*Address correspondence to Olaf Rieck, Assistant Professor, S3-B1b-5, Nanyang Avenue, Singapore 639798 (e-mail: [email protected], telephone: +65 6790-5929, fax: +65 6792-4217.
1. Introduction
In recent history, corporate consolidation through Mergers and Acquisitions (M&As)1
has reshaped a number of the world’s key industries, such as automobile (Daimler-
Benz and Chrysler), banking/insurance (UniCredito and HypoVereinsbank), airlines
(Air France and KLM), and telecommunications (SBC and AT&T). A large body of
literature in the fields of economics and strategic management has investigated the
question under which conditions M&As may be beneficial to the involved companies,
the consumers, or society at large. One of the most widely used methods used this
body of literature is the event study method, which looks at the companies’ stock
prices to assess the future benefits of an M&A event. It has been widely observed that
the release of important corporate information such as M&A announcements may
trigger significant reactions of stock prices. When the market learns about these kinds
of events, the involved stock price may immediately climb or fall. Hence, it appears
that the market connects an event (e.g. a merger between two companies) with the
prospect of future increases or decreases of cash-flow. Another way of putting this is
that the stock price will immediately reflect “the good news” or “the bad news”.
Table 1. Acquirer’s stock price changes on the day of M&A announcement
Acquirer Target Impact on Stock Price
Daimler-Benz Chrysler +8.38% Time Warner AOL +9.40% Vodafone Mannesmann +6.77% UniCredito Hypovereinsbank +4.90% Air France KLM +4.77%
Source: Calculated from data extracted from Yahoo! Finance
The stock price reactions illustrated in Table 1 could be purely random. But they
could also be related to the release of information on the imminent M&A. If a useful
interpretation of those observed returns is to be made, it must be contrasted against the
overall market return for the same period. Any return which significantly exceeds the
market return is to be considered abnormal (MacKinlay 1997). The type of news this
paper will focus on is the disclosure of M&A announcements of large telecommunica-
1 In this thesis the terms mergers and acquisitions are used interchangeably to refer to transactions involving the combination of two independent market participants to form one or more commonly controlled entities. It should be noted that this study covers only mergers or controlling-stake acquisitions as classified by Hitt, Ireland and Hoskisson (2005).
tion companies and the impacted stock price. The central question throughout this
paper will be:
How does the release of information about a planned M&A abnormally affect the
price of the underlying security?
Much research was done beginning in the latter half of the 20th century to explain why
companies are undertaking M&As. In the Industrial Organization literature, the two
most commonly identified reasons are efficiency gains and the strategic rationale
(Neary 2004). Efficiency gains arise through economies of scale or scope which is
due to the increased synergy between the involved firms. The strategic rationale fol-
lows the idea that an M&A can alter the structure of the market which in turn affects
the firm’s profits. Other motives for M&As include reduction of risk and change in
organisational focus. It has been widely observed that an acquisition strategy is some-
times applied because of the uncertainty in the competitive landscape, as in the case of
the telecommunications industry. If an industry undergoes dramatic changes or is in a
state of uncertainty, a firm may make an acquisition in an attempt to diversify its
product line or diversify geographically in order to spread risk. By doing so, it shifts
its core business into different markets due to anticipated volatility within its core
markets (Hitt, Ireland and Hoskisson 2005).
In the case of the telecommunications industry, one of these uncertainties is caused by
deregulation, another one is caused by technological change. Many countries have
removed important legal and regulatory barriers for more competition and privatiza-
tion. The removal of these barriers has opened the way for increased M&A activities
within and across national boundaries and telecommunications industry segments.
Arguably very importantly, technological change as induced continued uncertainty
about the future of this industry. It is currently facing an "Everything over IP" para-
digm that could mean big changes for the industry's fundamental players (Zadeh
2004). Voice-over-IP (VoIP) will offer new opportunities to alternative carriers and
present big challenges to traditional telecommunications companies. It is a disruptive
technology2 that will completely change the traditional public-switched telephone
2 The term refers to a technology or innovation, which radically transforms markets, creates entire new markets, or destroys existing markets for other (often older) technologies.
network market (PSTN). The dominance of VoIP seems inevitable but such a
phenomenon will take years depending on the level of broadband penetration, regula-
tory conditions and attractive pricing of VoIP services (Punja 2005).
To deal with uncertainty in the light of deregulation and technological change,
telecommunication giants are using M&As as an important growth avenue. Over the
past decade, a wave of M&As could be observed, especially on the US and European
telecommunications market (Warf 2003). These M&As involve both large and small
companies in a variety of different and similar industry segments (Warf 2003, Wilcox,
Chang and Grover 2001). Edward Whitacre, former CEO of SBC, puts this develop-
ment in his own words after he announced that SBC would acquire AT&T in a $16
billion-transaction:
“The communications industry is undergoing a profound transformation as it transi-
tions to unified, IP-based networks capable of delivering a host of integrated services.
To manage this evolution, customers need a partner with the resources to provide new
service platforms and product sets, while maintaining world-class reliability and
security. This merger creates that company.”
Source: AT&T News Release on January 31, 2005
The remainder of this paper is divided into five sections. The following section,
Section 2, will discuss findings of previous literature in order to formulate my
hypotheses. These will be tested using the event study methodology. This methodol-
ogy will be discussed and described in detail in Section 3. The results of the empirical
study will then be presented in Section 4. Discussion and limitations of to the findings
will be discussed in Section 5 which will also give summary of the research results in
a conclusion.
2. Development of Hypotheses
2.1 M&A in the Telecommunications Industry
Telecommunications is among the leading industries in M&A activity in the service
sector, largely as the result of deregulation and liberalization in these industries
(Sarkar, Cavusgil and Aulakh 1999, Luo 2002). According to Hitt et al. (2005), the
strategic management process calls for an M&A strategy to increase the firm’s
strategic competitiveness as well as its returns to the shareholders. An M&A strategy
shall only be used when the acquirer will be able to increase its economic value
through ownership and use of the acquired firm’s assets (Selden and Colvin 2003).
Thompson Jr. et al (2005) argues that the main motivation for M&As is the
maximization of profits and efficiency gain through a good combination with a new
business. Because every firm possesses unique capabilities and resources, a good
combination of two firms can be a unique match that maximizes the value of the
resulting firm due to synergies. These synergies would not be available to these firms
if they operated independently. Hence, the value of the target to the acquirer receives
an extra premium on top of the second highest bid3. The benefits that make the firms
pay such a premium include: (1) Economies of scale, which allow the combined firm
to be more cost-efficient and profitable. Telecommunication firms are particularly
keen on consolidation because of the high fixed costs and the need to spread these
costs across a large customer base. (2) Superior pricing power due to the reduced
competition and the higher market share result in higher profits. In telecommunica-
tions markets, where typically only few companies serve a given country market, any
M&A induced market concentration may result in great increases of pricing power. (3)
Benefits from different functional competencies, as would be the case when a
telecommunications operator acquires an internet service provider.
Studies conducted by Park et al. (2002) and Ferris and Park (2001) find that in
the telecommunications industry context M&A announcements generally show nega-
tive abnormal returns. Long-term integration costs, differences in corporate culture as
well as agency-problems are possible explanations. However, Park examines 42
events between 1997 and 2000, whereas this study covers a much larger sample size
with 88 events between 1998 and 2006. Ferris and Park (2001) investigate U.S.
telecommunication firms in the years before 1993, focusing on long term value effects.
On the other hand, potential benefits of M&As have been confirmed by a majority of
other previous event studies. Wilcox, Chang and Grover (2001) examine short-term
M&A announcement effects in the U.S. telecommunication industry. They find that
M&As are generally perceived positively by investors and therefore increases the
market value of the acquirer (2001). Another event study due to Uhlenbruck, Hitt and
Semadeni (2006) shows that M&As involving Internet firms also show value-creating
3 The second highest bid would represent the market price of target firm.
results for the shareholder. Therefore, choosing M&As as an avenue for growth may
turn out to be a good strategy.
In the light of the above review of previous empirical and theoretical literature, we
therefore posit:
H1: M&As in the telecommunication industry generate positive abnormal returns.
2.2 Firm Diversification
A natural way to refine the empirical analysis of M&As is to look at the extend to
which M&As can be seen as part of a diversification strategy, and what specific kind
of diversification strategy they represent. In general, firms find it often easier to fol-
low a focused strategy in the industry in which the firm is currently operating, than to
diversify into an unknown industry in which they lack experience (Hitt, Ireland and
Hoskisson 2005). However, in the current global environment, a diversified firm can
exploit strategic advantages that are generally not available to their undiversified
competitors. Diversification is generally defined as the extent to which firms operate
in different industries simultaneously and has proven to have a statistically significant
influence on the value of the firm (Jose, Nichols and Stevens 1986). To simplify the
array of options with regard to M&A strategies, this study distinguishes between
conglomerate mergers (broad firm diversification) and non-conglomerate mergers
(focused/related diversification)4.
There are several reasons why companies diversify. First, the formerly focused
firm wants to spread the risk of market contraction and is forced to diversify because
its products do not show further growth opportunities any more. Second, the outcome
of a diversification strategy can result in growth and profitability as well as synergies
with the firm’s current activities, giving it a better reception in capital markets as the
company increases in size. On the other hand however, diversification is generally
riskier than a focused strategy and requires the most careful investigation on the com-
pany’s own strength and weaknesses as well as on the target market itself. An empiri-
cal study conducted by Berry (1971) on US firms between 1960 and 1965 argues that
conglomerate mergers in general show poorer performance than the average industry
firms. Berry suggests that the firm’s lack of experience in skills and techniques in the 4 Refer to Section 3.3 for diversification measures employed in this study.
newly diversified industry may be one possible reason. Therefore, the more unrelated
the diversification the more risky it is for the firm. Moreover, diversification may re-
quire redistribution of human and of financial resources that can cause the company to
loose its focus, commitment and sustained investments in its core products.
Salter (1979) and a recent study by Moeller and Schlingemann (2005) found
that acquirer returns are significantly positively associated with a deal between two
firms in the same two-digit SIC code (non-conglomerate merger). In a more detailed
analysis, Varadarajan (1986) extended the SIC-classification by defining broad-
spectrum diversification (BSD) and the mean narrow-spectrum diversification
(MNSD). His findings suggests that firms pursuing a strategy of low broad-spectrum
diversification (BSD) and high mean narrow-spectrum diversification (MNSD)
financially outperform those pursuing a strategy of high BSD and low MNSD5. In
other words, firms of related diversification on average outperformed firms with unre-
lated diversification strategies. In fact, according to Bettis and Mahajan (1985),
related diversification achieves a comparably better return performance than any other
strategy. Arguments such as synergy, focus, competencies, and economies of scale
may serve as explanations for these findings. In an event study on M&A
announcement effects among telecommunication firms, Wilcox et al. (2001) found
that M&As where the acquirers employ a more focused strategy (i.e. non-conglomer-
ate) tend to experience greater market value increases upon the merger announcement.
Based upon the above discussion, we posit:
H2a: M&A activities which are classified as non-conglomerate mergers will
generate positive abnormal returns.
H2b: Average abnormal returns for conglomerate mergers are significantly lower
than for non-conglomerate mergers.
5 BSD is diversification into a different two-digit SIC industry. MNSD is diversification within the same two digit SIC industry but into a different four-digit SIC subcategory (Varadarajan 1986).
2.3 International Diversification
2.3.1 Cross-Border M&A
Another dimension of a firm’s diversification strategy is its internationalization
strategy. Acquisitions made between companies with headquarters in different
countries are called cross-border acquisitions. In recent years, the portion of cross-
border M&A has steadily increased (Breedon and Fornasari n.d.). An extensive
survey of senior executives6 revealed that the majority of recent acquisitions have
been cross-border. Although international diversification has captured considerably
less attention in the finance literature than domestic diversification, in reality the
former is more common. This is also reflected in the sample of this paper (53 cross
border vs. 35 domestic M&As). Domestic acquisitions are generally easier to execute
and present less risk, but globalization is inevitable. Acquisitions are often made to
overcome entry barriers (Hitt, Ireland and Hoskisson 2005). Especially in the context
of telecommunications, a cross-border merger definitely provides a more viable
option than organic growth in the foreign geographic market. Firstly, building up an
own network infrastructure is often more costly and time-consuming. Secondly, the
acquirer can often continue to use the brand name and avoid costly marketing efforts
in penetrating the market. For instance, when Vodafone (UK) took over Germany’s
Mannesmann, it could continue to provide mobile services under the “D2 privat” label.
In fact, this was the largest cross-border M&A in the telecommunications industry
with a price tag of 172 billion USD to date. This deal turned Vodafone instantly into
the second largest mobile provider in Germany.
Due to the relaxation of regulation in many industries, the number of cross-
border M&A activities among the European Union members generally continues to
increase (Brakman, Garretsen and Van Marrewijk 2005). Some market analysts be-
lieve that this is due to the fact that many European corporations face stiffening
competition and have reached saturation point in their domestic markets (Sarkar,
Cavusgil and Aulakh 1999). Increased international competition is affecting in the
telecommunications industry as well. With the erosion of trade limitations and other
regulatory barriers, the revenues from cross-border telecommunications services, such
as telephony, data transmission, and entertainment offerings, have rapidly grown. This
6 According to Economist Intelligence Unit 2006 Global M&A Survey
growth has been paralleled by an increase of the number of M&As among firms
headquartered in different countries.
A number of studies on announcement effects of cross-border acquisitions
come to the conclusion that shareholders experience significantly positive wealth
gains. Eun et al. (1996) examined the effect of foreign acquisitions of US firms on the
wealth of acquirer and target shareholders. The result shows that cross-border
acquisitions are significantly wealth-creating for acquirers. Corhay and Rad (2000),
using a sample of Western European cross-border acquisitions, also found weak
empirical evidence that cross-border acquisitions are generally wealth-creating
corporate activities. An event study on a large sample of Canadian firms shows that
cross-border bidders earn post announcement abnormal returns that are significantly
higher than domestic bidders (Tebourbi 2005). Cummins and Weiss (2004) examined
the performance of cross-border transactions of European insurance companies. They
found that cross-border transactions were value-neutral for acquirers, whereas
domestic transactions led to significant value loss for acquirers. Finally, Morosini,
Shane and Singh (1998) test whether foreignness enhances cross-border acquisition
performance. They employ Hofstede’s (1980) four cultural dimensions and its
quantitative scores to measure national culture distance as a proxy for foreignness and
find that there is a positive association between national cultural distance and cross-
border acquisition performance. We therefore posit:
H3a: Cross-border M&A activities of telecommunication firms will result in positive
abnormal returns for the acquirer within the event period.
H3b: Average abnormal returns for domestic M&A activities are significantly lower
than for cross-border M&A activities.
2.3.2 Emerging Markets
A further dimension of a firm’s diversification strategy concerns the question whether
the firm should diversify into emerging markets or not. Emerging markets are often
vaguely defined. The World Bank defines emerging market as one with low-to-middle
per capita income but potentially dynamic and rapidly growing economy where
companies can seek lucrative opportunities for medium to long-term investments.
While it is not easy to make an exact list of emerging markets, the best guides tend to

be investment information sources (such as The Economist) or market index makers
(such as Morgan Stanley Capital International). The MSCI Emerging Markets Index
consisted of 25 emerging markets. Among them are countries in Latin America (e.g.
Argentina, Brazil, Mexico), and Asian countries (China, India, Indonesia, Malaysia,
Taiwan, Thailand, Russia) but also some Eastern European and African nations. A
complete listing of all emerging countries can be found in the Appendix.
While developed countries remain the major targets for cross-border acquisi-
tions, emerging economies have also been earmarked as important targets of incoming
cross-border M&As since the 1990s. Companies that are racing for global leadership
have to consider competing in emerging markets. The business risks in these countries
are considerable but the opportunities for growth are huge, as their economies develop
and living standards climb towards levels in the industrialized world (Thompson,
Strickland and Gamble 2005). Chari et al. (2004) examined shareholder value gains
from developed-market acquisitions of emerging-market targets between 1988 and
2003. They found that joint returns for developed-market acquirers and targets are
significantly higher when M&A transactions in emerging markets are announced.
Not surprisingly, telecommunication firms rushed to seize opportunities in
emerging markets, to reap first-mover advantages and to satisfy the growing demand
for telecom services (Sarkar, Cavusgil and Aulakh 1999). Mobile operators especially,
have become increasingly dominant in markets with poor fixed-line coverage. In these
countries mobile phones are a substitute for traditional basic fixed services and extend
access to population groups such as the urban poor and rural users. Mobile services
are now considerably more affordable, both in start-up costs as well as in monthly
recurring costs for those consumer groups. Vodafone, for instance, seized the poten-
tial growth opportunities offered by emerging markets when they recently acquired
Telsim of Turkey. The mobile operator recognized that emerging markets were grow-
ing at three times the rate of developed markets. In light of this, Vodafone has also
made investments in India, Romania, and South Africa. In the light of the above
discussion, we therefore posit:
H4a: Cross-border M&A activities into emerging markets will result in positive
average abnormal returns.
H4b: Average abnormal returns for cross-border M&As into developed markets are
significantly lower than for cross-border M&As into emerging markets.
2.4 Dual Diversification
Prior research has focused on the causes and consequences of firm diversification.
Only recently more attention was given to international diversification. However,
much less attention has been paid to international diversification and its interaction
with firm diversification. The formulation of the all previous hypotheses concerns
only a single strategy (either service diversification or geographical diversification).
To study whether it is also beneficial for the firm when of both strategies are com-
bined, a sub sample of events which are characterized as both non-conglomerate and
cross-border will be tested. We investigate whether both strategies in combination
affect each other negatively, or whether we can expect such combination to result in
positive abnormal returns as well. So far there are only few studies which examine
dual diversification (firm diversification in conjunction with international diversifica-
tion). An empirical study of the media industry indicates that related diversification
(non-conglomerate mergers) in conjunction with cross-border activities contribute to
better financial performance than other combinations (Jung and Chan-Olmsted 2005).
To test whether this is also valid within the telecommunications industry, our
hypotheses are:
H5a: Cross-border M&A activities which are non-conglomerate mergers will result
in positive abnormal returns for the acquirer.
H5b: Average abnormal returns of non-conglomerate cross-border M&As are
significantly higher than those of conglomerate domestic M&As.
3. Theory & Methodology
3.1. Efficient Market Hypothesis
A capital market efficiently redistributes scarce resources from areas of surplus to
particular areas of insufficiency, such as developing sectors. There are numerous stud-
ies in the economics and finance literature that have addressed the efficient markets
hypothesis (EMH). In this paper, paying some attention to the EMH is warranted be-
cause it provides the basis for the use of the event study methodology. The EMH as-
sumes that (1) stocks are always in equilibrium, i.e. all available information is re-
flected in the total value of the capital market, and (2) that it is impossible for an
investor to consistently “beat the market” (Brigham and Houston 2004). Market effi-
ciency implies that stock prices incorporate all relevant information that is available to
market traders. If this is true, then any financially relevant information that is newly
revealed to investors will be instantaneously incorporated into stock prices (Fama
1998). Since release of news and information is unpredictable by nature, stock prices
change in response to new information unpredictably. This means that all investment
made have a zero net present value. As soon as there is any information indicating
that a stock is under-priced, investors will immediately rush to buy the stock, bidding
up its price to a reasonable level. Thus, only normal rates of return can be expected.
Financial theorists have discussed three forms of market efficiency. These
three forms clarify further what is meant by the term “all available information”. The
weak form of the EMH suggests that all information contained in past price move-
ments is fully reflected in current prices. Information about recent stock prices would
be of no use in selecting stocks. This form of the hypothesis suggests that a trend
analysis is meaningless. Historical stock price data are publicly available and costless
to obtain. In other words, returns are unpredictable from past returns or other variables
(E. Fama 1991). The semi-strong form of the EMH states that current market prices
reflect all publicly available information. And again, if semi-strong form efficiency
exists and investors have access to the publicly available information, it would be
futile to study annual reports or any other published data because market prices would
have adjusted to any good or bad news contained in such reports. The strong form of
the EMH states that current market prices reflect all information pertaining to the
company, including information available only to company insiders. Therefore, mak-
ing it impossible for anyone to earn abnormal returns from the stock market. Studies
of the semi-strong form of the EMH can be regarded as tests of the speed of adjust-
ment of prices to new information. The leading research tool in this area is the event
study method(Dimson and Mussavian 1998).
3.2. The Event Study Research Method
There have been numerous event studies undertaken in all kinds of areas, foremost in
the field of finance and strategic management. For instance, Subramani and Walden
(2001) study the returns to shareholders in firms engaging in e-commerce. Johnson et

al. (2005) examine the impact of ratings of board directors by the business press on
stockholders’ wealth. Another area in which event studies have been widely used is in
the evaluation of M&As. For instance, Wilcox, Chang and Grover (2001) analyze
M&A events in the telecommunications industry by testing the impact of near
diversification, far diversification, and the size of the firms on the shareholder value.
Uhlenbruck, Hitt and Semadeni (2006) focus on acquisitions of Internet firms and the
potential for the transfer of scarce resources in a resource-based view.
The event study method is based on the assumption that capital markets are efficient
such as to estimate the impact of new information on anticipated future profits of the
firms. The core assumption of the event-study methodology is that if information
communicated to the market contains any useful and surprising content an abnormal
return will occur. In a capital market with semi-strong efficiency one can assesses the
impact of the event in question on the market value of the company by calculating the
abnormal return - the difference between the actual post-event return and the return
expected in the absence of the event (MacKinlay 1997). McWilliams and Siegel (1997)
gave a good reason for conducting event studies: “The event study method has be-
come popular because it obviates the need to analyze accounting-based measures of
profit, which have been criticized because they are often not very good indicators of
the true performance of firms”. Therefore, it is expected that event studies will con-
tinue to be a valuable and widely used tool in economics and finance.
According to (MacKinlay 1997) an event study can be roughly categorized into the
following five steps:
1. Identifying of the events of interest and defining the event window size
2. Selection of the sample set of firms to include in the analysis.
3. Prediction of a “normal” return during the event window in the absence of the
event
4. Calculation of the abnormal return within the event window, where the abnormal
return is defined as the difference between the actual and predicted returns.
5. Testing whether the abnormal return is statistically different from zero.
Kothari and Warner (2004) recommend MacKinlay’s work as a standard reference for
understanding and conducting event studies. Many recent event studies are based on

the MacKinlay’s outline (Wilcox et al. 2001, Subramani et al. 2001, Park et al. 2004,
Joshi et al. 2005). In this spirit, this paper follows the methodology outlined by
MacKinlay (1997). Also, in this study, Eventus7, which operates under SAS, was used
to test the market reaction to the announcement of M&As.
1) Identifying of the events of interest and defining the event window size
The events of interest to this event study are M&A announcements of major
telecommunication companies that are listed in the US-stock exchanges or European
stock exchanges. More specifically, we are looking at the earliest announcements of
the planned M&A in the media. The significance of an event can be identified by
examining its impact on the firm’s stock price. To accomplish this, the researcher de-
fines a period of days over which the impact of the event will be measured. This
period is known as the event window (denoted as L2). The size length of the event
window has to be justified (Fama 1998).
This study examines two symmetric event windows: a three-day (1 day prior to the
event day and 1 day after the event day) and a five-day (-2;+2) event window. These
window lengths are appropriate to capture any news that might have leaked shortly
before the official announcement was made and also considers any short-term stock
price reactions linked to the event after the announcement. Some researchers may
decide to take longer event windows of 21-, 41-days or even longer for similar event
studies. An examination of 500 published event studies in academic press revealed
that short-term event studies deliver quite reliable results while long-term event-
studies underlie some serious limitations (Kothari and Warner 2004). One disadvan-
tage of using longer windows is that other, unrelated events may be confounded with
the event of interest. If other relevant events occurred during the event window, it is
hard to isolate the impact of one particular event. In addition, it is difficult to reconcile
the assumption of efficient markets with the use of long event windows. The use of
very long windows in many management studies implies that some researchers do not
believe that the effects of events are quickly incorporated into stock prices. This can
be seen as a violation of the assumption of market efficiency which is vital to the
7 Eventus™ is software which is designed for the specific purpose of event studies. Eventus™ is widely used in financial and economic research. It was developed by the US-based company Cowan Research LC – URL: http://www.eventstudy.com
event study methodology (McWilliams and Siegel 1997). However, it may be reason-
able sometimes to assume that information is revealed to investors slowly over a
period of time. Therefore, some studies do apply longer event window sizes.
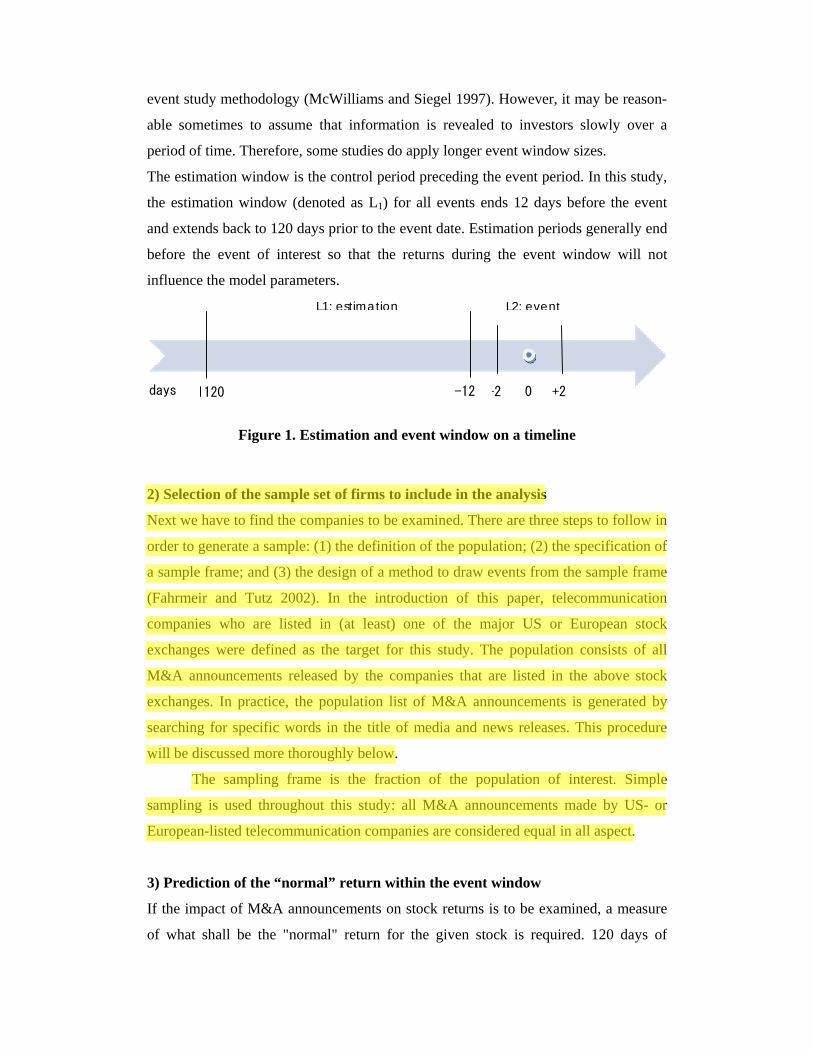
The estimation window is the control period preceding the event period. In this study,
the estimation window (denoted as L1) for all events ends 12 days before the event
and extends back to 120 days prior to the event date. Estimation periods generally end
before the event of interest so that the returns during the event window will not
influence the model parameters.
Figure 1. Estimation and event window on a timeline
2) Selection of the sample set of firms to include in the analysis
Next we have to find the companies to be examined. There are three steps to follow in
order to generate a sample: (1) the definition of the population; (2) the specification of
a sample frame; and (3) the design of a method to draw events from the sample frame
(Fahrmeir and Tutz 2002). In the introduction of this paper, telecommunication
companies who are listed in (at least) one of the major US or European stock
exchanges were defined as the target for this study. The population consists of all
M&A announcements released by the companies that are listed in the above stock
exchanges. In practice, the population list of M&A announcements is generated by
searching for specific words in the title of media and news releases. This procedure
will be discussed more thoroughly below.
The sampling frame is the fraction of the population of interest. Simple
sampling is used throughout this study: all M&A announcements made by US- or
European-listed telecommunication companies are considered equal in all aspect.
3) Prediction of the “normal” return within the event window
If the impact of M&A announcements on stock returns is to be examined, a measure
of what shall be the "normal" return for the given stock is required. 120 days of
0-2 +2 -12 -1120
L2: event L1: estimation
days
historical stock data will be used for each event and the event window was defined to
be five days in length. These 120 days are enough to calculate valid estimators needed
for the event-study model (MacKinlay 1997). There are a number of approaches to
calculate the normal return of a given stock. Four methods are usually used in past
event studies: the constant mean return model, the market model, the control portfolio
return model and the risk-adjusted return model. To discuss all these statistical
models would go beyond the scope of this paper. For firm-specific events, such as
M&A announcements, an appropriate choice for such a measure is the market model
(Fama 1998).
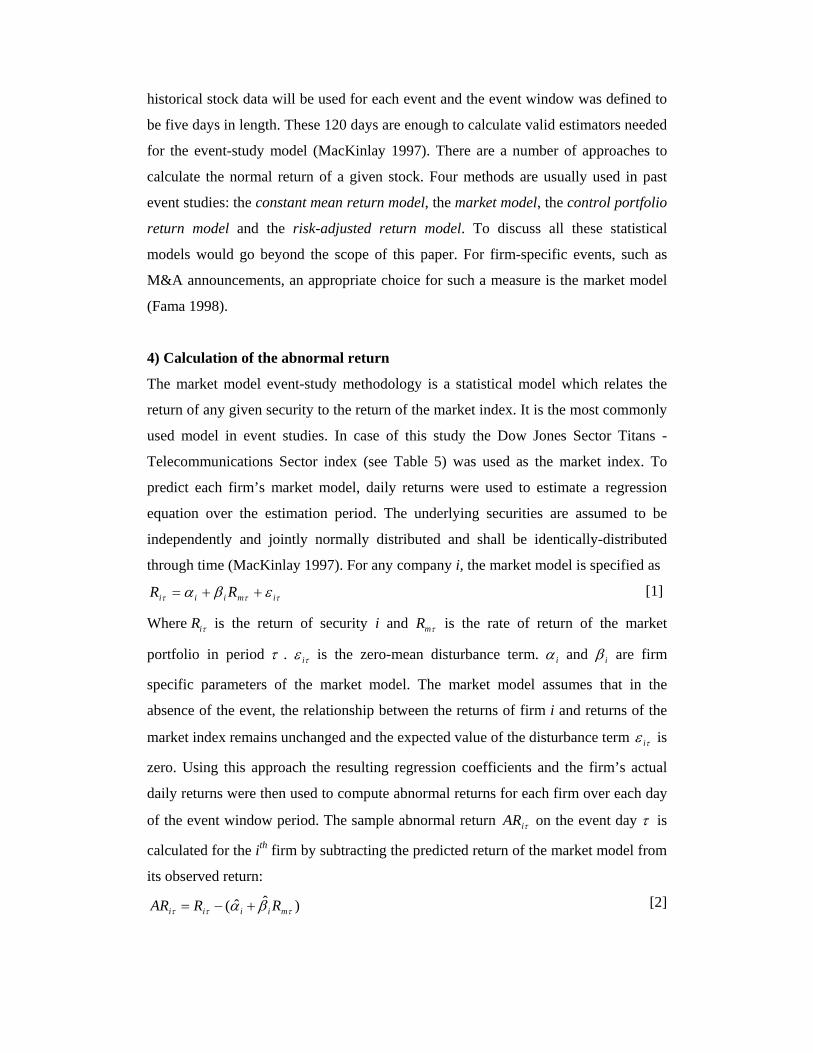
4) Calculation of the abnormal return
The market model event-study methodology is a statistical model which relates the
return of any given security to the return of the market index. It is the most commonly
used model in event studies. In case of this study the Dow Jones Sector Titans -
Telecommunications Sector index (see Table 5) was used as the market index. To
predict each firm’s market model, daily returns were used to estimate a regression
equation over the estimation period. The underlying securities are assumed to be
independently and jointly normally distributed and shall be identically-distributed
through time (MacKinlay 1997). For any company i, the market model is specified as
τττ εβα imiii RR ++= [1]
Where τiR is the return of security i and τmR is the rate of return of the market
portfolio in period τ . τε i is the zero-mean disturbance term. iα and iβ are firm
specific parameters of the market model. The market model assumes that in the
absence of the event, the relationship between the returns of firm i and returns of the
market index remains unchanged and the expected value of the disturbance term τε i is
zero. Using this approach the resulting regression coefficients and the firm’s actual
daily returns were then used to compute abnormal returns for each firm over each day
of the event window period. The sample abnormal return τiAR on the event day τ is
calculated for the ith firm by subtracting the predicted return of the market model from
its observed return:
)ˆˆ( τττ βα miiii RRAR +−= [2]
where the coefficients iα̂ and iβ̂ are ordinary least squares estimates of iα and iβ .
The Cumulative Abnormal Return (CAR) for firm i over the event period 1τ to 2τ is
then calculated as follows:
∑=
=2
1
)2,1(τ
ττττ ττ iARCAR
[3]
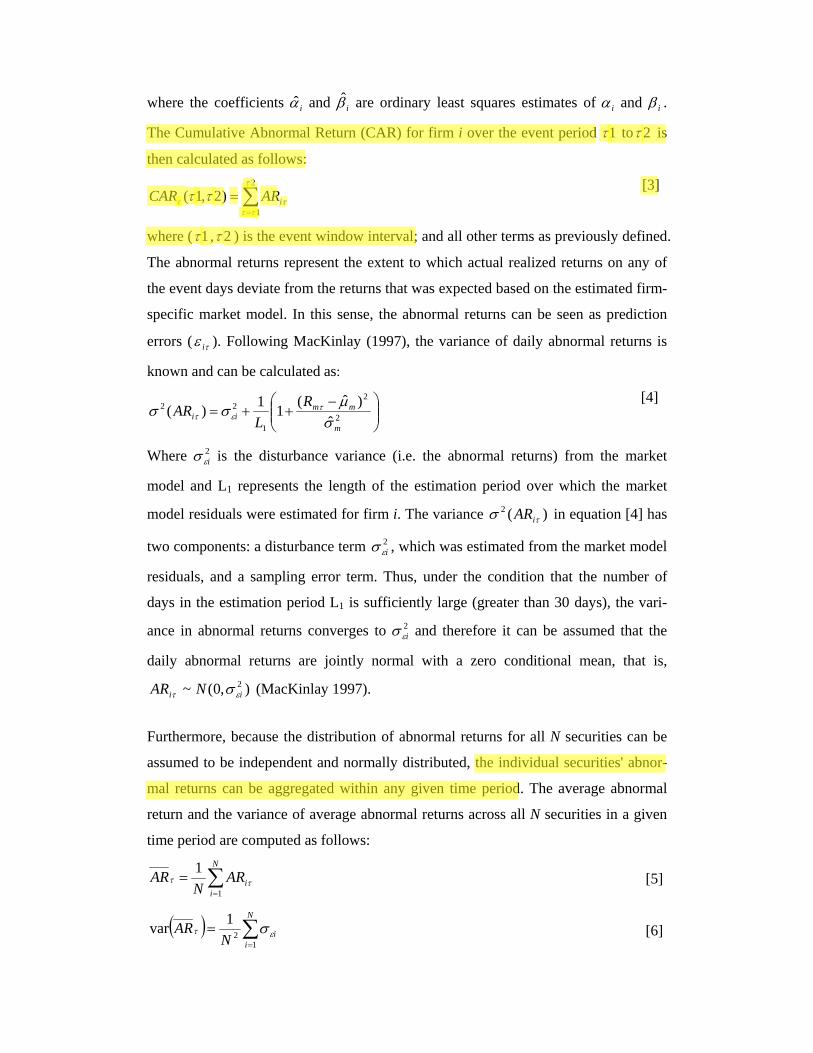
where ( 1τ , 2τ ) is the event window interval; and all other terms as previously defined.
The abnormal returns represent the extent to which actual realized returns on any of
the event days deviate from the returns that was expected based on the estimated firm-
specific market model. In this sense, the abnormal returns can be seen as prediction
errors ( τε i ). Following MacKinlay (1997), the variance of daily abnormal returns is
known and can be calculated as:
⎟⎟⎠
⎞⎜⎜⎝
⎛ −++= 2
2
1
22
ˆ)ˆ(11)(
m
mmii
RL
ARσµσσ τ
ετ [4]
Where 2iεσ is the disturbance variance (i.e. the abnormal returns) from the market
model and L1 represents the length of the estimation period over which the market
model residuals were estimated for firm i. The variance )(2τσ iAR in equation [4] has
two components: a disturbance term 2iεσ , which was estimated from the market model
residuals, and a sampling error term. Thus, under the condition that the number of
days in the estimation period L1 is sufficiently large (greater than 30 days), the vari-
ance in abnormal returns converges to 2iεσ and therefore it can be assumed that the
daily abnormal returns are jointly normal with a zero conditional mean, that is,
),0(~ 2ii NAR ετ σ (MacKinlay 1997).
Furthermore, because the distribution of abnormal returns for all N securities can be
assumed to be independent and normally distributed, the individual securities' abnor-
mal returns can be aggregated within any given time period. The average abnormal
return and the variance of average abnormal returns across all N securities in a given
time period are computed as follows:
∑=
=N
iiAR
NAR
1
1ττ [5]
( ) ∑=
=N
iiN
AR1
21var ετ σ [6]
where N equals the number of events; and all other terms are as previously defined.
As expected, the average abnormal return is also normally distributed with a zero
conditional mean and a conditional variance given by equation [6]. Then the average
abnormal returns and the variance in the CAR can then be aggregated over the event
window ( 1τ , 2τ ) as follows:
∑=
=2
1
)2,1(τ
τττττ ARCAR [7]
( ) ( )∑=
=2
1
var)2,1(varτ
τττττ ARCAR [8]
Analogously as above, inferences about the mean cumulative abnormal returns can be
drawn using the following relationship (MacKinlay 1997):
( )( ))2,1(var,0~)2,1( ττττ CARNCAR [9]
The impact on the cumulative abnormal returns across the securities in the portfolio
follows a standard Z-score statistic.
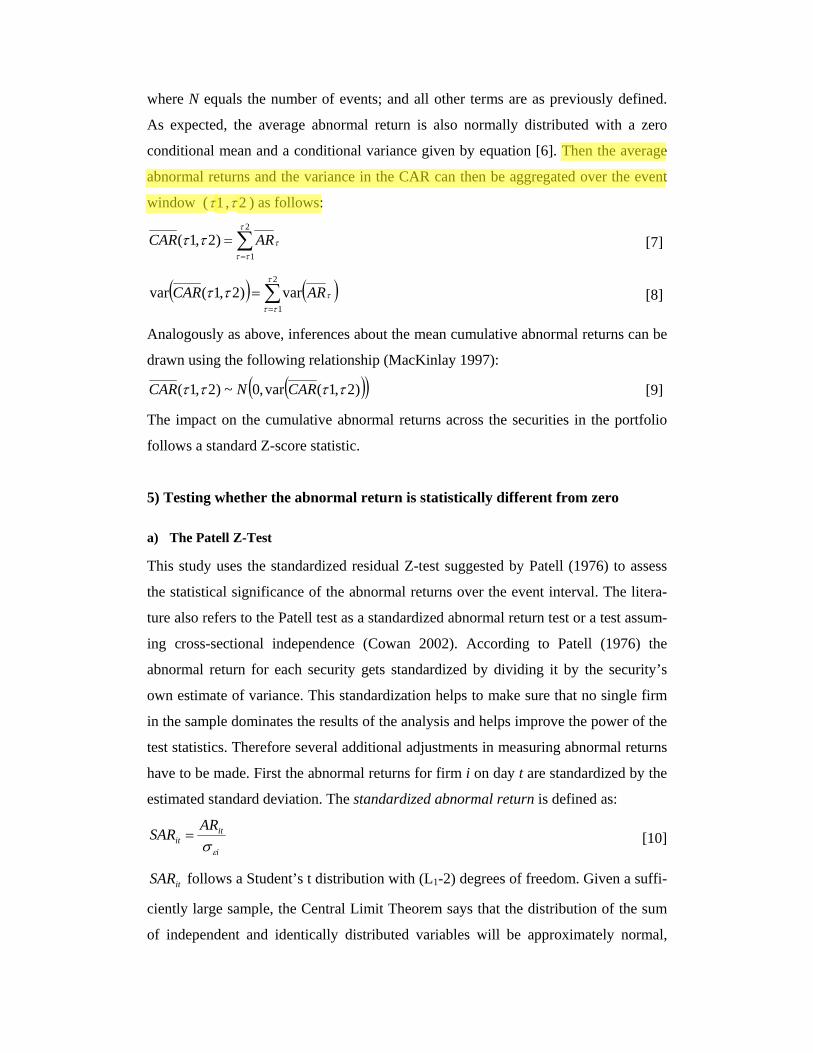
5) Testing whether the abnormal return is statistically different from zero
a) The Patell Z-Test
This study uses the standardized residual Z-test suggested by Patell (1976) to assess
the statistical significance of the abnormal returns over the event interval. The litera-
ture also refers to the Patell test as a standardized abnormal return test or a test assum-
ing cross-sectional independence (Cowan 2002). According to Patell (1976) the
abnormal return for each security gets standardized by dividing it by the security’s
own estimate of variance. This standardization helps to make sure that no single firm
in the sample dominates the results of the analysis and helps improve the power of the
test statistics. Therefore several additional adjustments in measuring abnormal returns
have to be made. First the abnormal returns for firm i on day t are standardized by the
estimated standard deviation. The standardized abnormal return is defined as:
i
itit
ARSARεσ
= [10]
itSAR follows a Student’s t distribution with (L1-2) degrees of freedom. Given a suffi-
ciently large sample, the Central Limit Theorem says that the distribution of the sum
of independent and identically distributed variables will be approximately normal,

regardless of the underlying distribution. This rule would therefore also apply to an
aggregation of itSAR : Just like in equation [5], the standardized abnormal returns in
period t will be aggregated across the N firms to obtain the cumulative standardized
abnormal return:
∑=
=N
iitt SARCSAR
1 [11]
The expected value of tCSAR is zero. The variance of tCSAR is known to be
∑= −
−=
N
i i
it L
LQ1 4
2 [12]
where iL is the is the number of non-missing trading day returns in the L-day period
1τ through 2τ for firm i. In an analogous fashion as done in equation [7], tCSAR
are then accumulated over the event period (see equations [13] and [14]) to produce
the test statistic:
∑=
=N
i
iZN
Z1
2,12,11
ττττ [13]
where
∑=
=2
12,1
2,11 τ
ττττ
ττ iti
i SARQ
Z [14]
and
42)121(2,1 −
−++=
i
ii
LLQ ττττ [15]
Under the condition that iZ 2,1 ττ is cross-sectional independent and some other condi-
tions (see Patell 1976), iZ 2,1 ττ follows the standard normal distribution under the null
hypothesis (Central Limit Theorem). This Z-statistic is then used to test the signifi-
cance of no abnormal return during the event window period.
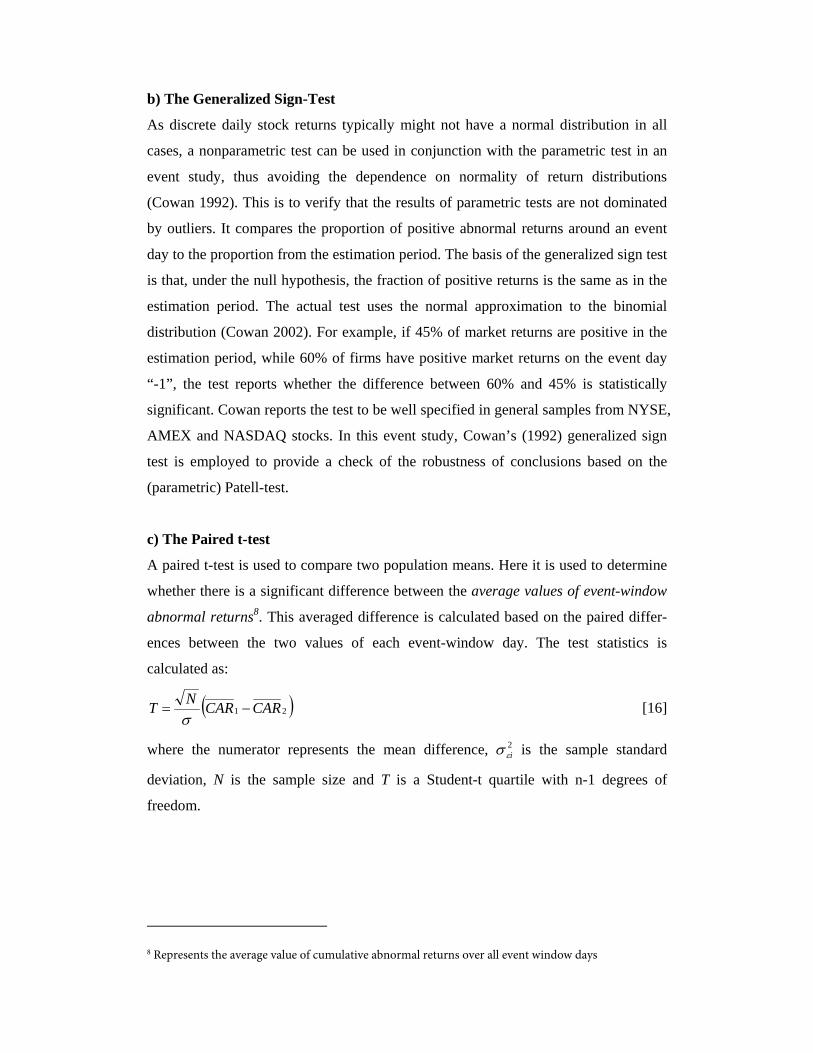
b) The Generalized Sign-Test
As discrete daily stock returns typically might not have a normal distribution in all
cases, a nonparametric test can be used in conjunction with the parametric test in an
event study, thus avoiding the dependence on normality of return distributions
(Cowan 1992). This is to verify that the results of parametric tests are not dominated
by outliers. It compares the proportion of positive abnormal returns around an event
day to the proportion from the estimation period. The basis of the generalized sign test
is that, under the null hypothesis, the fraction of positive returns is the same as in the
estimation period. The actual test uses the normal approximation to the binomial
distribution (Cowan 2002). For example, if 45% of market returns are positive in the
estimation period, while 60% of firms have positive market returns on the event day
“-1”, the test reports whether the difference between 60% and 45% is statistically
significant. Cowan reports the test to be well specified in general samples from NYSE,
AMEX and NASDAQ stocks. In this event study, Cowan’s (1992) generalized sign
test is employed to provide a check of the robustness of conclusions based on the
(parametric) Patell-test.
c) The Paired t-test
A paired t-test is used to compare two population means. Here it is used to determine
whether there is a significant difference between the average values of event-window
abnormal returns8. This averaged difference is calculated based on the paired differ-
ences between the two values of each event-window day. The test statistics is
calculated as:
( )21 CARCARNT −=σ
[16]
where the numerator represents the mean difference, 2iεσ is the sample standard
deviation, N is the sample size and T is a Student-t quartile with n-1 degrees of
freedom.
8 Represents the average value of cumulative abnormal returns over all event window days
3.3 Data
The two inputs that are required for the event-study model are the events themselves,
in this case M&A announcements, and historical stock price data (security prices and
the reference index). They were both gathered from databases.
In order to explore the effects of M&As in stock prices, this research limits its
scope to companies that are either listed at one of the major European stock ex-
changes (London, Paris, Frankfurt, Madrid, Amsterdam) or on a US stock exchange
(NYSE, NASDAQ). The reason is that most of the telecommunication operators are
listed on at least one of these stock exchanges. A large sample size is vital to reduce
the sampling error which in turn also increases the reliability of the statistical results
(Cohen 1988). Furthermore, it is generally known that these exchanges provide a high
public confidence due to the high standards and listing requirements. Thus, using only
major exchanges also increases the price stability of the securities – an important
prerequisite for the event study method. The hypotheses in this paper are tested on a
sample of M&As completed by publicly traded acquirers between 1998 and 2006.
Telecommunication operators were selected from the Thomson One Banker database
indexes by searching for companies within the following industries: companies with
primary SIC Code 4813 (Telephone Communications except Radiotelephone), 4812
(Radiotelephone Communications) or 4842 (Cable and Other Pay Television
Services). The results were limited to companies that are (at the time of the event)
listed at a major US or European stock. Next, with a list of 56 potential acquirers, the
M&A events which are associated with every one of these carriers were separately
retrieved from the Highbeam™ Research database 9 . The following search on
Highbeam™ using a set of relevant search terms was performed and the earliest dates
announcing the event was recorded:
Search in article title only:
{company name from list} AND buy OR acquires OR bid OR merge OR
takeover OR merger OR acquisition OR buys OR merges OR merging OR
acquiring
9 HighBeam™ Research is an online research engine which sorts free, paid, and proprietary online articles and databases published in the past 20 years. It is a tool for serious business, education, and personal research - URL: http://www.highbeam.com
Search in following sources:
“newspapers” (Business Wire, Associated Press, PR Newswire, Reuters,
Wallstreet Journal, Washington Post)
Dates
Between Jan 1, 1998 to 31 Oct 2006
Events that were identified using these criteria were consolidated into a master list
with duplicates removed. The preliminary sample frame had 493 M&A events. Out of
this, an acquisitions that resulted in a controlling stake for the acquirer, i.e. greater
than 50% of the stakes are chosen. This means that acquisitions giving the acquirer
lower than 50% in stakes are by definition not considered as acquisitions. Moreover,
only M&A announcements containing accurate and detailed information about date of
announcement, partner and transaction value were included. Last, only those events
with at least 120 days of historic stock data10 available were selected. Moreover, to
avoid possible confounding effects within the event window, a number of M&A
events were selectively omitted. Excluded events are those that coincided with other
major firm-specific events that might affect the stock price such as earnings alliance
announcements, earnings, large investment decisions or new product introduction
(McWilliams and Siegel 1997). Confounding events were identified using
Highbeam™ Research functions. It displays all company news within a 4-days-range
of the specific date. After meeting all these criteria, the final sample contains 88
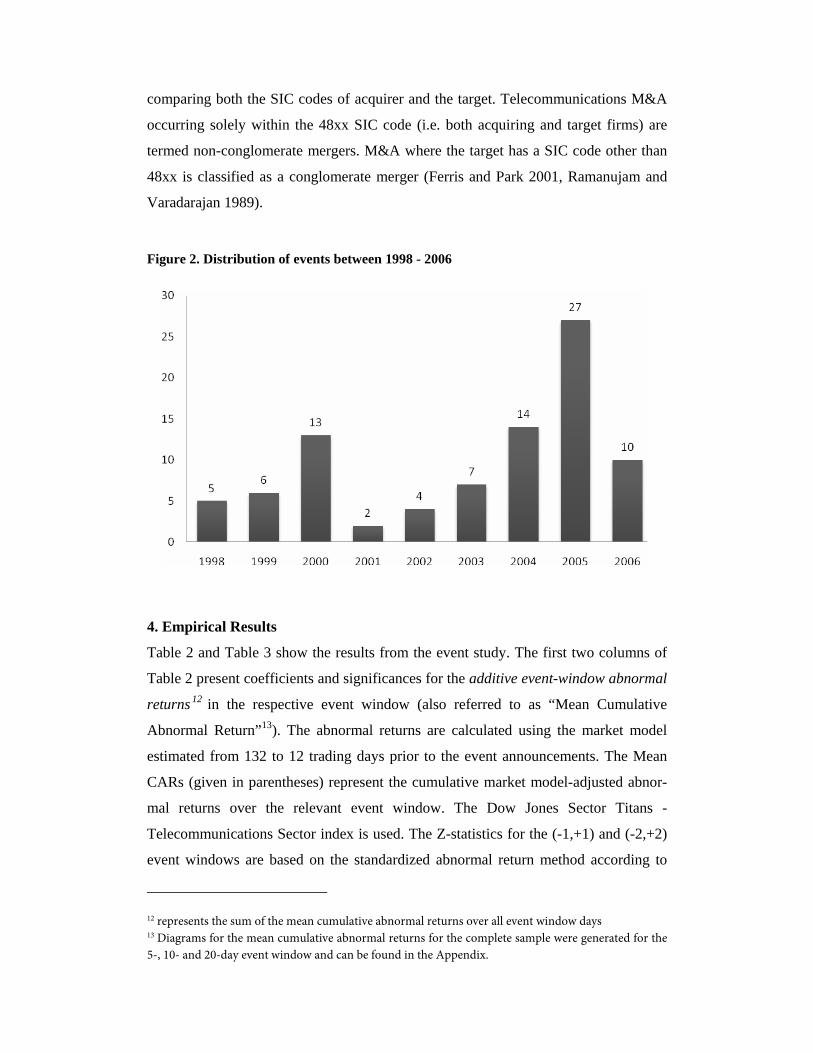
M&A announcements of 37 telecommunication firms. The distribution of events on
the calendar years clearly reflects the M&A waves during 2004/2005 and 1999/2000
(see Figure 2 below). The event date was again cross-checked with Factiva™ data-
base and all relevant event data was then condensed into a master list. Once the M&A
announcements were isolated and the event window was defined, the “normal”
(expected) returns for that window needed to be estimated. This was done by using
historical stock price data (adjusted closing prices) for all acquiring companies listed
in the master list. For each event 132 days of historic stock data before the event date
and 10 days of stock data after the event date were downloaded through either the
Center of Research on Security Prices database (CRSP) or the Yahoo! Finance
database. 10 retrievable through Yahoo! Finance or CRSP database
As this event study focuses on M&As in a global perspective many non-US
telecom carriers were included. Most of these carriers are also listed in the United
States as well and stock data could be easily retrieved from CRSP. However, in terms
of the traded volumes the main site of trading for those securities is at the stock ex-
change in their own respective countries. For instance, Germany’s largest
telecommunication operator, Deutsche Telekom, is traded both at the XETRA in
Frankfurt with an average trading volume of 26,902,100 whereas the company’s stock
at the NYSE has an average trading volume of only 613,188. Any sudden event such
as M&A announcements would be first reflected on their home stock exchange and
the short-term stock performance would reflect the shareholder gain much more accu-
rately. Therefore, historical stock data of the respective companies were always
retrieved from their “home” stock exchange.
To estimate the abnormal returns under the market model, an index needed to
be determined. The market model is a statistical model which relates the return of any
given security to the return of the market portfolio, i.e. an industry index (MacKinlay
1997). Since the sample consists of major telecommunication carriers the Dow Jones
Sector Titans - Telecommunications Sector (DJTTEL) was used as the reference
index for the market model (see Table ). The index consists of 29 securities of leading
global telecommunications carriers that are traded at their respective “home”
exchanges. 17 out of 37 acquiring companies in this study’s sample belong to the
DJTTEL as of November 2006. To measure the direction of diversification of the
M&As, this study employs the SIC11 classification as conducted by Berry (1971) and
Ferris and Park (2001). Many industrial organization studies have used objective
measures based on standard industrial classification (SIC) counts to capture the aspect
of diversification (Ramanujam and Varadarajan 1989). The first number assigns a
product to a very broad category. Each subsequent number distinguishes the product
at a progressively finer level. The SIC classification has been widely used among
economist to determine in which industry segments the company is operating in. As
all acquirers in this study are listed telecommunications companies, they all operate
with the two-digit 48xx SIC-code. The acquirers strategy can be determined by
11 A standard industrial classification (SIC) code categorizes US business establishments based upon the type of business activity performed at its location. All fields of economic activity are included in this system including both manufacturing and nonmanufacturing operations. The system is governed by the Office of Statistical Standards.
comparing both the SIC codes of acquirer and the target. Telecommunications M&A
occurring solely within the 48xx SIC code (i.e. both acquiring and target firms) are
termed non-conglomerate mergers. M&A where the target has a SIC code other than
48xx is classified as a conglomerate merger (Ferris and Park 2001, Ramanujam and
Varadarajan 1989).
Figure 2. Distribution of events between 1998 - 2006
4. Empirical Results
Table 2 and Table 3 show the results from the event study. The first two columns of
Table 2 present coefficients and significances for the additive event-window abnormal
returns 12 in the respective event window (also referred to as “Mean Cumulative
Abnormal Return”13). The abnormal returns are calculated using the market model
estimated from 132 to 12 trading days prior to the event announcements. The Mean
CARs (given in parentheses) represent the cumulative market model-adjusted abnor-
mal returns over the relevant event window. The Dow Jones Sector Titans -
Telecommunications Sector index is used. The Z-statistics for the (-1,+1) and (-2,+2)
event windows are based on the standardized abnormal return method according to
12 represents the sum of the mean cumulative abnormal returns over all event window days 13 Diagrams for the mean cumulative abnormal returns for the complete sample were generated for the 5-, 10- and 20-day event window and can be found in the Appendix.
Patell (1976). The test statistics for the nonparametric generalized sign test are
reported in the last two columns, with the number of positive and negative CARs
given in parentheses.
Table 3 shows the results of the Student’s paired t-test for the b-hypotheses.
The first two columns show the averaged event-window abnormal returns and an
averaged difference is calculated in the third row based on the paired differences
between the two values of each event-window day. The t-score is presented in fourth
column is based at 4 and 2 degrees of freedom for the 5- and 3-day event window
respectively.
4.1. Complete Sample
The first row of Table 2 reports the results for the complete sample (H1). As can be
seen from the table, there is significant support for Hypothesis 1 that M&A activities
will in general have a positive impact on telecommunication firms participating in
these activities. The mean CAR for both windows is approximately +0.85% and
significant at the 5% level. This is being supported by the generalized sign test for the
(-1,+1) event window.
4.2. Firm Diversification
According to Hypothesis 2a, non-conglomerate mergers will generate positive abnor-
mal returns. CARs of +0.63% and +0.61% are reported respectively for both windows,
which are weakly significant at the 10% level. The generalized sign test is statistically
significant at the confidence 1% level, indicating that the result is highly robust
against outliers. Therefore Hypothesis 2a is weakly supported.
Hypothesis 2b states that conglomerate mergers will generate lower abnormal
returns than non-conglomerate mergers. The CAR for the conglomerate mergers is
twice as much (+1.29%) and is significantly positive the 5% level for the (-1,+1)
window, the sign test shows no significance which indicates that the gains might be
due to outliners in the subsample. Also, no statistically significant evidence was found
in the (-2,+2) window. The t-score for the paired t-test that measures the difference for
both CAR means ( ) are negative but not
significant. Hence, there is no evidence that conglomerate mergers show lower abnor-
mal returns than non-conglomerate mergers. Therefore Hypothesis 2b is rejected.
4.3. International strategy
Hypothesis 3a suggests that cross-border M&A activities will result in positive abnor-
mal returns. For both event windows, cross-border acquirers gained 1.80% and 1.85%
(significant at the 0.1% and 1% level respectively). The generalized sign tests for the
number of positive and negative CARs are significant at least at the 1% and 10% level
respectively. These results indicate that the use cross-border M&A by telecommunica-
tion firms are perceived as a value-generating strategy. Hypothesis 3a is therefore
supported.
Hypothesis 3b states that domestic M&A activities are less favorable than
cross-border M&A. The Patell-test on the CARs results show that there is an insignifi-
cant wealth loss for domestic acquirers of -0.58% and -0.63% respectively, indicating
that CARs are statistically not different from zero. The paired t-test measures the
difference of the cumulative abnormal return mean values
( ) and determines a possible significance.
Here the t-score is positive and shows a weak significant difference of 0.81% and
0.50% at the 10% level for both windows. It can therefore be assumed that cross-
border M&A are adding more value to the firm than domestic M&A to a certain
extent. Thus, these results provide weak support for Hypothesis 3b.
4.4 Emerging markets
Hypothesis 4a states that cross-border M&A activities into emerging markets will
result in positive abnormal returns. For the (-1,+1) window, the results show statisti-
cally significant, positive abnormal returns of +1.06% at the 5% level. This is backed
by the generalized sign test which is significant at the 1% level. The examination of
the (-2,+2) window results in positive abnormal returns but not statistically different
from zero. Overall, the results show that cross-border M&A are beneficial to the
foreign acquirer and consistent with Hypothesis 4a.
Hypothesis 4b argues that cross-border M&A activities of a firm into developed mar-
kets are less attractive for the stakeholders than cross-border M&A activities into
emerging markets. As for the results of the Patell-test, transactions into developed
markets result in positive gains for both event windows of +2.29% and +2.52%
respectively (at the 0.1% and 1% significance level). Although CAR levels are higher
than the ones observed for emerging markets (+1.06%), no inference can be made
about the difference of both results. The paired t-test shows no statistical significance
( ). In other words, both
sub samples show significant positive abnormal returns while no conclusions can be
made on the difference. Therefore, Hypothesis 4b is rejected.
4.5. Dual Diversification
Hypothesis 5a claims that cross-border M&A activities, which are non-conglomerate
mergers (focused/related diversification), will result in positive abnormal returns for
the acquirer. The wealth gains for cross-border M&A are +1.22% and +1.27% for the
respective windows and statistically significant at least at the 5% level. The general-
ized sign test is also significant for both windows at the 1% and 10% significance
level respectively. These results confirm Hypothesis 5a.
According to Hypothesis 5b, cross-border & non-conglomerate mergers gener-
ate significantly higher CARs than domestic & conglomerate mergers. The Patell-test
for all domestic & conglomerate mergers indicate negative CARs in both event
windows (-1.41% and -1.02%) which are significant for the (-1,+1) window at the 5%
level. However, the generalized sign test for the number of positive and negative
CARs is not significant for both windows. The paired t-test showed that the difference
( ) is positive and
significant at the 10% and 1% level. This indicates that cross-border & non-
conglomerate mergers do perform better than domestic & conglomerate mergers.
Therefore, Hypothesis 5b cannot be rejected.
5. Discussion and Conclusion
5.1 Limitations
Like any other empirical study, this study is also subject to certain limitations, which
should not remain unmentioned. For instance, in conjunction with the cross-border
M&As, this study did not examine the current international exposure of the firm that
is making acquisitions outside its home market. In other words, an acquisition
announced by a firm which is already strongly diversified in other geographic markets
might not have the same effect as an announcement made by a firm that makes its first
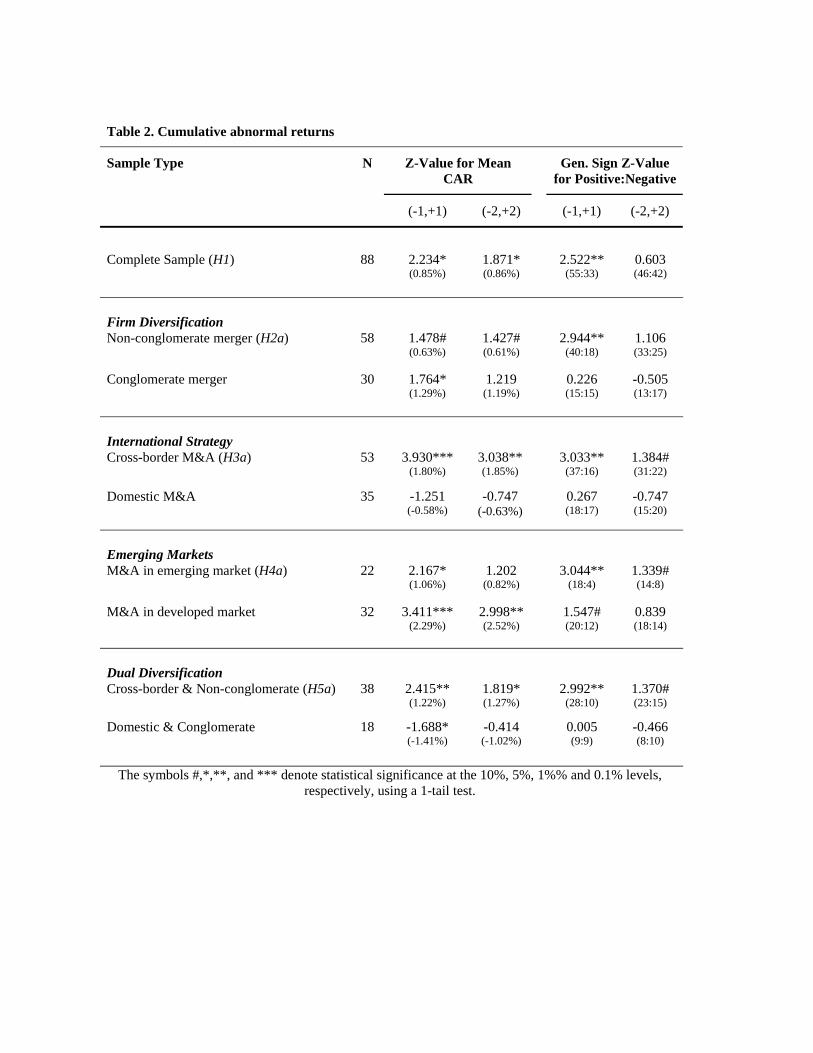
Table 2. Cumulative abnormal returns
Sample Type N Z-Value for Mean CAR
Gen. Sign Z-Value for Positive:Negative
(-1,+1) (-2,+2) (-1,+1) (-2,+2)
Complete Sample (H1) 88 2.234*
(0.85%) 1.871* (0.86%)
2.522** (55:33)
0.603 (46:42)
Firm Diversification Non-conglomerate merger (H2a) 58 1.478#
(0.63%) 1.427# (0.61%)
2.944** (40:18)
1.106 (33:25)
Conglomerate merger 30 1.764* (1.29%)
1.219 (1.19%)
0.226 (15:15)
-0.505 (13:17)
International Strategy Cross-border M&A (H3a) 53 3.930***
(1.80%) 3.038** (1.85%)
3.033** (37:16)
1.384# (31:22)
Domestic M&A 35 -1.251 (-0.58%)
-0.747 (-0.63%)
0.267 (18:17)
-0.747 (15:20)
Emerging Markets M&A in emerging market (H4a) 22 2.167*
(1.06%) 1.202 (0.82%)
3.044** (18:4)
1.339# (14:8)
M&A in developed market 32 3.411*** (2.29%)
2.998** (2.52%)
1.547# (20:12)
0.839 (18:14)
Dual Diversification Cross-border & Non-conglomerate (H5a) 38 2.415**
(1.22%) 1.819* (1.27%)
2.992** (28:10)
1.370# (23:15)
Domestic & Conglomerate
18 -1.688* (-1.41%)
-0.414 (-1.02%)
0.005 (9:9)
-0.466 (8:10)
The symbols #,*,**, and *** denote statistical significance at the 10%, 5%, 1%% and 0.1% levels, respectively, using a 1-tail test.
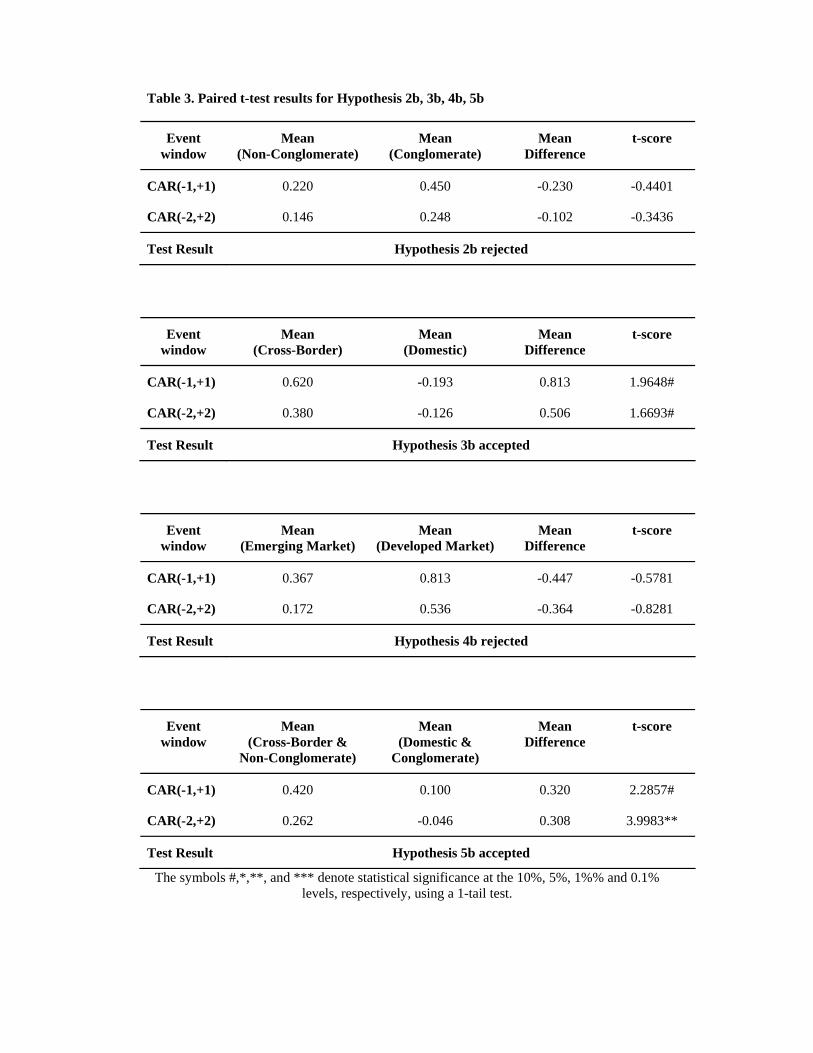
Table 3. Paired t-test results for Hypothesis 2b, 3b, 4b, 5b
Event window
Mean (Non-Conglomerate)
Mean (Conglomerate)
Mean Difference
t-score
CAR(-1,+1) 0.220 0.450 -0.230 -0.4401
CAR(-2,+2) 0.146 0.248 -0.102 -0.3436
Test Result Hypothesis 2b rejected
Event window
Mean (Cross-Border)
Mean (Domestic)
Mean Difference
t-score
CAR(-1,+1) 0.620 -0.193 0.813 1.9648#
CAR(-2,+2) 0.380 -0.126 0.506 1.6693#
Test Result Hypothesis 3b accepted
Event window
Mean (Emerging Market)
Mean (Developed Market)
Mean Difference
t-score
CAR(-1,+1) 0.367 0.813 -0.447 -0.5781
CAR(-2,+2) 0.172 0.536 -0.364 -0.8281
Test Result Hypothesis 4b rejected
Event window
Mean (Cross-Border &
Non-Conglomerate)
Mean (Domestic &
Conglomerate)
Mean Difference
t-score
CAR(-1,+1) 0.420 0.100 0.320 2.2857#
CAR(-2,+2) 0.262 -0.046 0.308 3.9983**
Test Result Hypothesis 5b accepted
The symbols #,*,**, and *** denote statistical significance at the 10%, 5%, 1%% and 0.1% levels, respectively, using a 1-tail test.
move outside its home market. However, the sample used in this event study consists
of large telecommunications operators which are relatively equal in their international
exposure. Therefore in any case, we should not expect this to be a major problem.
In contrast to some other studies, the SIC-based diversification measurement
method employed in this study does not consider the relative size of the firm’s various
SIC operations. This limitation applies for very large enterprises which are classified
in several SIC industries (such as Deutsche Telekom) and where the primary SIC
industry is not necessarily the strongest business any more. Nonetheless, this study
assumes the filed SIC to be the main business of the firm.
It is also uncertain whether a two dimensional categorization (conglomerate
merger/non-conglomerate merger) is suitable to characterize product diversification
within the telecommunications industry, which is technologically evolving faster than
any other industry. A more elaborate SIC measurement according to Ramanujam and
Varadarajan (1989) makes no sense within this research context as this study is
examining M&A valuation effects of telecommunication operators only. There were
no other quantitative measurement methods available to date. A thorough investiga-
tion by setting up a qualitative measurement and assessing every individual firm could
be considered in future research.
5.2 Discussion
The results are consistent with previous event studies in showing that M&As in the
telecommunication industry generally result in significant gains in the market values
of the acquirer. Therefore, it can be concluded that the market is generally optimistic
with regards to the potential of telecom carriers to add value in this industry. The
highly competitive marketplace in the telecom sector means that high returns are no
longer guaranteed for big telecom firms. Telecommunications networks have typically
high fixed costs but the marginal costs for an additional customer are comparably very
low. As a result, the potential for economies of scale and scope will remain enormous
in this industry. All rival operators are racing to grow fast to reap those benefits.
Investors may have realized that long-term growth depends on capital being diverted
to productive purposes. However, reasons for cases where firms do not show positive
gains after an M&A announcement can be that it is not always easy for a company to
achieve synergies and to reap scale and scope. High integration costs and differences
in corporate culture are reasons why M&A fail to add value. This shows investors’
skepticism about the likelihood that the acquirer will be able to achieve these
synergies required to justify the premium paid (Selden and Colvin 2003).
Besides the positive abnormal returns derived from M&As of telecommunica-
tion operators, four other conclusions can be drawn from the empirical results:
(1) The results weakly suggest that M&A involving firms that operate in the same or
related industry are wealth-creating but they do not necessarily perform better than
telecom firms that follow a broader diversification strategy through M&A.
(2) Telecommunication operators engaging in cross-border M&A generally experi-
ence positive abnormal returns and outperform firms that expand domestically.
(3) Cross-border M&A activities in emerging markets do add value to the acquirer but
do not result in significantly higher abnormal returns for the acquirer.
(4) Cross-border and non-conglomerate mergers are found to add value to the acquir-
ing telecommunications operator, while no significant stock reactions are found
for acquirers engaging in domestic and conglomerate mergers.
As summarized under (1): Non-conglomerate mergers seem to be value-adding for
telecommunications firms. However, on the other hand, conglomerate mergers do not
experience a significant value reduction either. Against expectations, the samples with
conglomerate mergers show higher mean CARs but it could not be shown that the
difference is significant. However, a broader diversification strategy might indeed
provide a more predictable and reliable revenue stream. For instance, the ongoing
modernization of packet-switched networks and the better congestion control due to
bandwidth management results in much more efficient network utilization. Some
telecom carriers with excess network capacity may be more cost-efficient across
industries. Moreover, a large portfolio is proven to handle cyclical downturns in one
business segment better as cyclical upturn in another business is likely to occur. This
is currently already true for many telecom incumbents worldwide which struggle to
maintain competitiveness in their former monopoly markets as local authorities have
liberalized telecommunications to allow more competition. Firms in deregulated
industries often want to provide bundles of products. This also applies to the
telecommunications industry, especially in the context of today’s technological
convergence (Pernet 2006). Market analysts14 say that consumers are demanding for
bundled digital services. As a result, “triple play” providers are converging television
(SIC 7812), internet (SIC 7375) and telecommunication technologies (SIC 48xx).
Large telecommunication providers started to see this trend and slowly back away
from their pure-play strategy on which they relied on for the past decades. This means
that operators must become active on formerly unrelated markets. In order to pick up
the technology, incumbent firms may have develop their own technologies or acquire
existing firms that are unrelated to telecommunications. In most cases, operators
diversify through M&A. Therefore, it remains to be seen whether the results under (1)
will show a significant shift in favor for a broad diversification strategy among
telecom operators in the years to come.
Operating under stiff competition in their home markets, it seems logical for
large telecommunication firms to diversify geographically in cross-border M&A as
stated under (2). However, with deregulation, and numerous competitors leveling the
playing field, returns are no longer guaranteed. Cross-border M&A becomes essential
as telecommunications companies who operate without a global network would not be
able to meet the growing demands of its customers in international data
communication services (Park, et al. 2002). The fact that most telecom M&As are
cross-border shows that telecommunication operators look for new markets beyond
national borders. This is an apparent attempt to expand the global market power as
growth on their home markets is slowly but surely stagnating. Firm size and global
reach are the new competitive edge, and is probably the reason for greater efficiency
within this industry during the merger waves in 2004 and 2005. This thesis found that
an increase in geographic diversification is positively and significantly associated
with acquirer returns. The results reflect only a weak significance for a better
performance than domestic M&A but they confirm a positive tendency of abnormal
returns which are significantly high in magnitude for this sample and are consistent
with previous studies.
According to (3), we could notfind any evidence for the hypothesis that M&As
into emerging markets add more value to the acquirer then M&A into developed
markets. In fact, average CARs for developed market entrants show higher
magnitudes than those of acquirers who operate in emerging markets and these results 14 According to DATAMONITOR: Fixed Line Telecoms in Europe (June 2006)
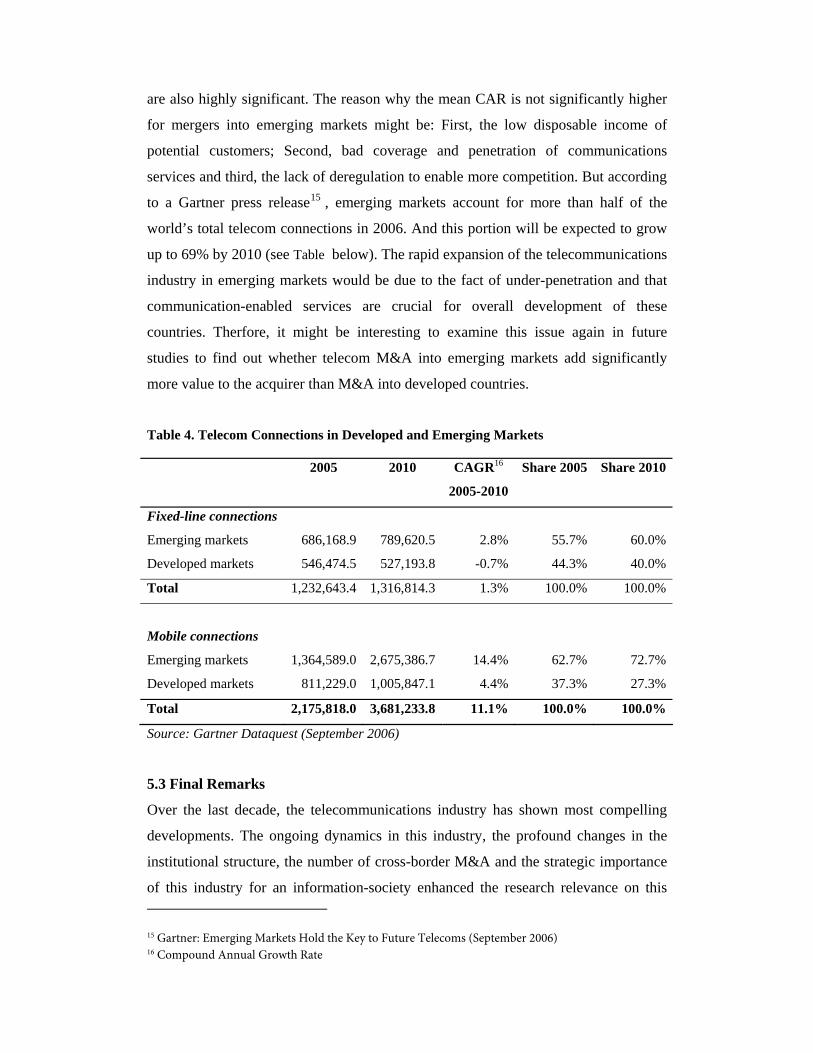
are also highly significant. The reason why the mean CAR is not significantly higher
for mergers into emerging markets might be: First, the low disposable income of
potential customers; Second, bad coverage and penetration of communications
services and third, the lack of deregulation to enable more competition. But according
to a Gartner press release15 , emerging markets account for more than half of the
world’s total telecom connections in 2006. And this portion will be expected to grow
up to 69% by 2010 (see Table below). The rapid expansion of the telecommunications
industry in emerging markets would be due to the fact of under-penetration and that
communication-enabled services are crucial for overall development of these
countries. Therfore, it might be interesting to examine this issue again in future
studies to find out whether telecom M&A into emerging markets add significantly
more value to the acquirer than M&A into developed countries.
Table 4. Telecom Connections in Developed and Emerging Markets
2005 2010 CAGR16
2005-2010
Share 2005 Share 2010
Fixed-line connections
Emerging markets 686,168.9 789,620.5 2.8% 55.7% 60.0%
Developed markets 546,474.5 527,193.8 -0.7% 44.3% 40.0%
Total 1,232,643.4 1,316,814.3 1.3% 100.0% 100.0%
Mobile connections
Emerging markets 1,364,589.0 2,675,386.7 14.4% 62.7% 72.7%
Developed markets 811,229.0 1,005,847.1 4.4% 37.3% 27.3%
Total 2,175,818.0 3,681,233.8 11.1% 100.0% 100.0%
Source: Gartner Dataquest (September 2006)
5.3 Final Remarks
Over the last decade, the telecommunications industry has shown most compelling
developments. The ongoing dynamics in this industry, the profound changes in the
institutional structure, the number of cross-border M&A and the strategic importance
of this industry for an information-society enhanced the research relevance on this 15 Gartner: Emerging Markets Hold the Key to Future Telecoms (September 2006) 16 Compound Annual Growth Rate
industry. With this paper we hope to having contributed to research on M&As by
showing some useful empirical evidence to better understand the telecommunications
industry. It can be basis for further research on this field and might also be helpful for
research on different industries that share similar structures and conditions as
telecommunications.
Appendix
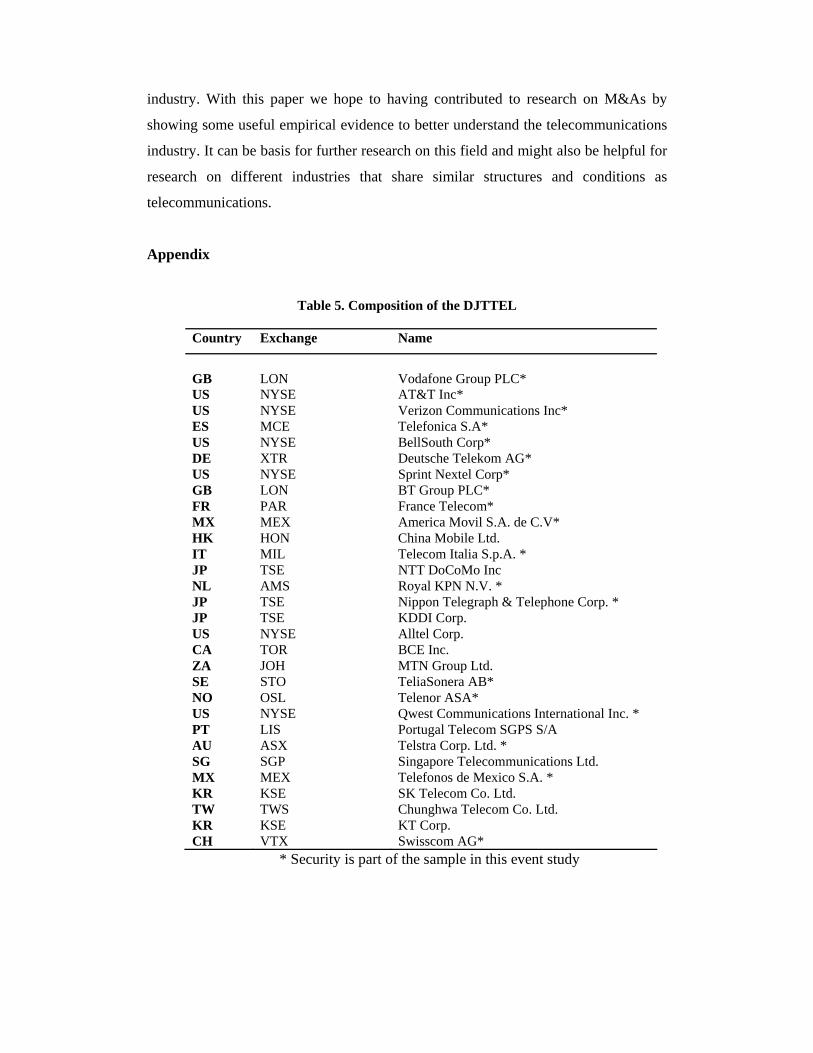
Table 5. Composition of the DJTTEL
Country Exchange Name
GB
LON
Vodafone Group PLC*
US NYSE AT&T Inc* US NYSE Verizon Communications Inc* ES MCE Telefonica S.A* US NYSE BellSouth Corp* DE XTR Deutsche Telekom AG* US NYSE Sprint Nextel Corp* GB LON BT Group PLC* FR PAR France Telecom* MX MEX America Movil S.A. de C.V* HK HON China Mobile Ltd. IT MIL Telecom Italia S.p.A. * JP TSE NTT DoCoMo Inc NL AMS Royal KPN N.V. * JP TSE Nippon Telegraph & Telephone Corp. * JP TSE KDDI Corp. US NYSE Alltel Corp. CA TOR BCE Inc. ZA JOH MTN Group Ltd. SE STO TeliaSonera AB* NO OSL Telenor ASA* US NYSE Qwest Communications International Inc. * PT LIS Portugal Telecom SGPS S/A AU ASX Telstra Corp. Ltd. * SG SGP Singapore Telecommunications Ltd. MX MEX Telefonos de Mexico S.A. * KR KSE SK Telecom Co. Ltd. TW TWS Chunghwa Telecom Co. Ltd. KR KSE KT Corp. CH VTX Swisscom AG*
* Security is part of the sample in this event study

Table6. List of Emerging Markets (as of June 2006)
Composition of the MSCI Emerging Markets
Index
Argentina Malaysia
Brazil Mexico
Chile Morocco
China Pakistan
Colombia Peru
Czech Republic Philippines
Hungary Poland
Egypt Russia
India South Africa
Indonesia Taiwan
Israel Thailand
Jordan Turkey
Korea
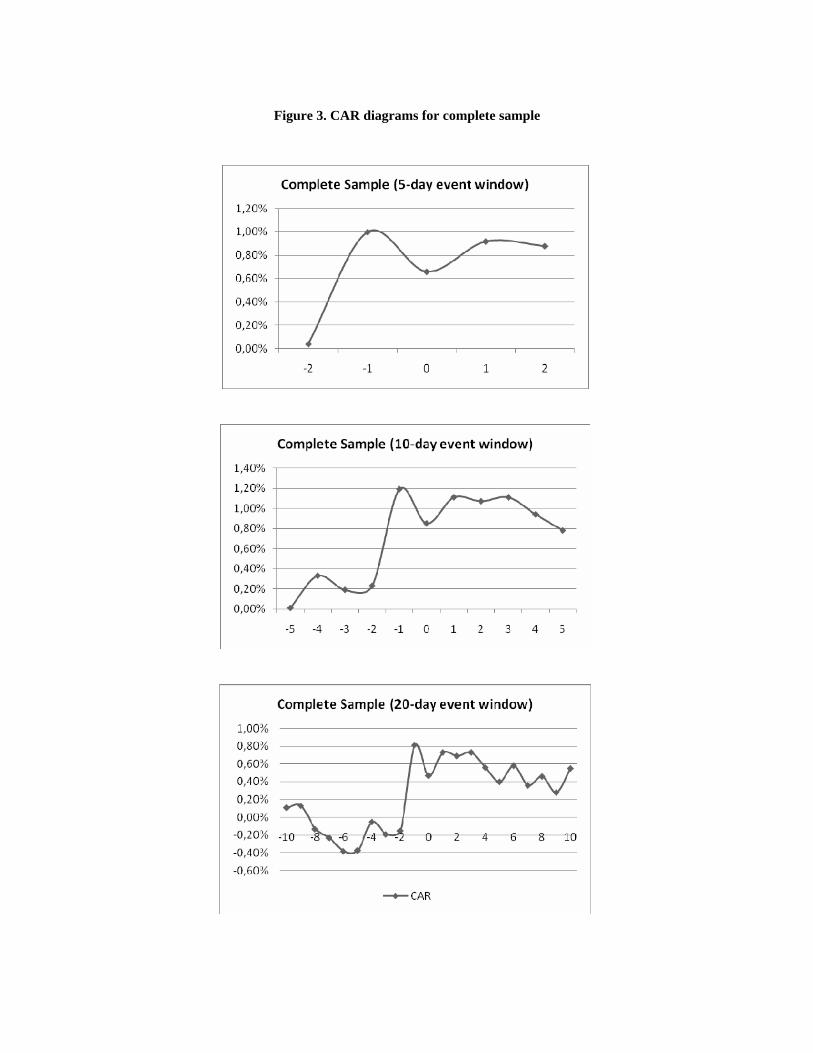
Figure 3. CAR diagrams for complete sample

Bibliography
Berry, C. "Corporate Growth and Diversification." Journal of Law and Economics, Vol. 14 No. 2., 1971: 371-383.
Bettis, R., and V. Mahajan. "Risk/Return Performance of Diversified Firms." Management Science, Vol. 31 No. 7, 1985: 785-799.
Bodie, Zvi, Alex Kane, and Alan J. Marcus. Investments. McGraw-Hill/Irwin, 2005.
Brakman, S., H. Garretsen, and C. Van Marrewijk. "Cross-Border Mergers and Acquisitions." CESifo Working Paper Series No. 1602, 2005.
Breedon, F., and F. Fornasari. "FX impact of cross-border M&A." Bank for International Settlements. http://www.bis.org/publ/bispap02n.pdf (accessed November 18, 2006).
Brigham, E., and J. Houston. "Fundamentals of Financial Management." In Chapter 8: Stocks and their Valuation, 334-337. 2004.
Chari, A., P. Ouimet, and L. Tesar. "Acquirer Gains in Emerging Markets." Ross School of Business Publication (UMICH), 2004.
Cohen, Jacob. Statistical Power Analysis for the Behavioral Sciences. Hillsdale, New Jersey: Lawrence Erlbaum Associates, 1988.
Corhay, A., and A. Rad. "International acquisitions and shareholder wealth Evidence from the Netherlands." International Review of Financial Analysis, Vol. 9 No. 2, 2000: 163-174.
Cowan, A. Eventus 7.0 User's Guide (revised version). 2002.
Cowan, A. "Nonparametric Event Study Tests." Review of Quantitative Finance and Accounting, Vol. 2, 1992: 343-358.
Cummins, D., and M. Weiss. "Consolidation in the European Insurance Industry: Do Mergers and Acquisitions Create Value for Shareholders?" 2004.
Dimson, E., and M. Mussavian. "A brief history of market efficiency." European Financial Management, Vol. 4 No. 1, 1998: 91-193.
Eun, C., R. Kolodny, and C. Scheraga. "Cross-border acquisitions and shareholder wealth: Tests of the synergy and internalization hypotheses." Journal of Banking & Finance, Vol. 20 No. 9, 1996: 1559-1582.
Fahrmeir, L., and G. Tutz. Statistik - Der Weg zur Datenanalyse. Berlin: Springer Verlag, 2002.
Fama. "Market efficiency, long-term returns, and behavioral finance." Journal of Financial Economics, Vol. 49, 1998: 283-306.
Fama, E. "Efficient Capital Markets: II." The Journal of Finance, 1991: 1575-1617.
Fama, F., L. Fisher, M. Jensen, und R. Roll. „The Adjustment of Stock Prices to New Information.“ International Economic Review, Vol. 10 No. 1, 1969: 1-21.
Ferris, S., and K. Park. "How Different is the Long-Run Performance of Mergers in the Telecommunications Industry?" SSRN, 2001.

Gartner. Gartner Says Emerging Markets Hold the Key to Future Telecoms. December 1, 2006. http://www.gartner.com/it/page.jsp?id=499110 (accessed December 22, 2006).
Hahn, W. Global Telecommunications Market Take 1Q-05. Gartner, 2005.
Henderson, G. "Problems and Solutions in Conducting Event Studies." The Journal of Risk and Insurance, Vol. 57 No. 2, 1990: 282-306.
Hitt, M., R. Ireland, and R. Hoskisson. Strategic Management: Competitiveness and Globalization (Concepts) 6th ed. Mason, OH: Thomson - South-Western, 2005.
Hofstede, G. Cultural Consequences: International Differences in Work-Related Values. Beverly Hills, CA: Sage, 1980.
Johnson, J., A. Ellstrand, D. Dalton, and C. Dalton. "The influence of the financial press on stockholder wealth." Strategic Management Journal, Vol. 26 No. 5, 2005: 461-471.
Joshi, S., M. Khanna, and S. Sidique. "Investor Responses to Emission Information." Michigan State University, 2005.
Jung, J., and S. Chan-Olmsted. "Impacts of Media Conglomerates Dual Diversification on Financial Performance." Journal of Media Economics, Vol. 18 No. 3, 2005: 183-202.
Kothari, S., and J. Warner. "Econometrics of Event Studies." Handbook of Corporate Finance, Vol. A, 2004: Ch. 1.
Luo, Yadong. Multinational Enterprises in Emerging Markets: Comparative Insights. Copenhagen: Copenhagen Business School Press, 2002.
MacKinlay, A. Craig. "Event Studies in Economics and Finance." Journal of Economic Literature, Vol. 35 No. 1, 1997: 13-39.
McWilliams, A., and D. Siegel. "Event Studies in Management Research: Theoretical and Empirical Issues." The Academy of Management Journal, Vol. 40, No. 3, 1997: 626-657.
Moeller, S., and F. Schlingemann. "Global diversification and bidder gains: A comparison between cross-border and domestic acquisitions." Journal of Banking & Finance, Vol. 29 No.3, 2005: 533-564.
Morosini, P., S. Shane, and H. Singh. "National Cultural Distance and Cross-Border Acquisition Performance." Journal of International Business Studies, Vol. 29 No. 1., 1998: 137-158.
Neary, P. „Cross-Border Mergers as Instruments of Comparative Advantage.“ University College Dublin and CEPR, 2004.
Park, M., D. Yang, C. Nam, and Y. Ha. "Mergers and Acquisitions in the Telecommunications Industry: Myths and Reality." ETRI Journal, Vol. 24 No. 1, 2002: 56-68.
Park, N., J. Mezias, and J. Song. "A Resource-based View of Strategic Alliances and Firm Value in the Electronic Marketplace." Journal of Management, Vol. 30 No. 1, 2004: 7–27.
Patell, J. "Corporate Forecasts of Earnings Per Share and Stock Price Behavior." Journal of Accounting Research, Vol 14, 1976: 246-276.
Pernet, S. "Bundles and Range Strategies: The Case of Telecom Operators." Communications & Strategies, no. 63, 2006: 19-31.

Punja, P. Market Focus: Voice Over Broadband Will Force Big Changes for Carriers. Gartner, 2005.
Ramanujam, V., and P. Varadarajan. "Report on Corporate Diversification: A Sythesis." Strategic Management Journal, Vol. 10, 1989: 523-551.
Report on Consolidation in the Financial Sector. OECD - Bank for International Settlements, 2001.
Salter, M. Diversification Through Acquisition: Strategies for Creating Economic Value. New York. NY: Free Press, 1979.
Sarkar, M., S. Cavusgil, and P. Aulakh. "International Expansion of Telecommunication Carriers: The Influence of Market Structure, Network Characteristics, and Entry Imperfections." Journal of International Business Studies, Vol. 30 No. 2., 1999: 361-381.
Selden, L., and G. Colvin. "M&A Needn't be a Loser's Game." Harvard Business Review, Vol. 81 No. 3, 2003: 70-73.
Subramani, M., and E. Walden. "The Impact of E-Commerce Announcements on the Market Value of Firms." Information Systems Research, Vol. 12 No. 2, 2001: 135-154.
Sullivan, T. Getting Started in Empirical Research. Austin, TX, June 17, 2005.
Tebourbi, I. "Bidder’s Shareholder Wealth effects of Canadian Cross-Border and Domestic Acquisitions - The Role of Corporate Governance Differences." CEREG - Université Paris Dauphine, 2005.
Thompson, A., A. Strickland, and J. Gamble. Crafting and Executing Strategy. Boston: McGraw-Hill Irwin, 2005.
Uhlenbruck, K., M. Hitt, and M. Semadeni. "Market Value Effects of Acquisitions Involving Internet Firms: A Resource-Based Analysis." Strategic Management Journal, Vol. 27, 2006: 899–913.
Varadarajan, P. "Product Diversity and Firm Performance: An Empirical Investigation." Journal of Marketing, Vol. 50 No. 3, 1986: 43-57.
Warf, B. "Mergers and Acquisitions in the Telecommunications Industry." Growth and Change, Vol. 34 No. 3, 2003: 321-344.
Wilcox, H. Dixon., K. Chang, and V. Grover. "Valuation of mergers and acquisitions in the telecommunications industry: a study on diversification and firm size." Information & Management, Vol. 38, 2001: 459–471.
Zadeh, A. "Why your fate rests at the edge: the convergence value chain is largely about exploiting the multiservice edge." America's Network, August 1, 2004.