m thesis - studerende.au.dk
TRANSCRIPT

MASTER’S THESIS
‘Megabats’
Stephen Turnbull
Department of Biological Sciences
Faculty of Science
Aarhus University, Denmark
Supervisor:
Associate Professor Jens M. Olesen
Cover photograph: Dorte Nyhagen

Introduction Why megabats? A brief explanation of my experiences with megabats.
I first came across megabats when studying for my honours project at Aberdeen University under
the supervision of Professor Paul Racey – an intimidating yet extremely likeable giant of the bat
world. I was to study Pteropus rodricensis, the famed golden fruit bat, endemic to the island of
Rodrigues; a tiny far-flung speck in the Indian Ocean, politically aligned with Mauritius. I had some
idea of what to expect, but no firm plans of how to carry out my studies, relying instead on my
confident ability to improvise. Upon arrival, the island presented itself as a catalogue of
environmental short-sightedness and ecological collapse, yet the fruit bats clung on to their perilous
existence, saved from extinction by the irregular topography of some parts of the island. In a near-
vertical and densely vegetated gorge, the bats could roost in peace during the day, flying to their
feeding sites each evening at dusk, their destinations presumably carefully planned the previous
night.
I quickly came to realise a number of problems inherently linked with the study of fruit-bats. Firstly,
they’re nocturnal. This presents a whole host of difficulties, not least of which being the absence of
daylight. Secondly, there was no way in which to access their roost site, and even if I could, my
clumsy approach would disturb them. Thirdly, they are pretty mobile. Not only could they easily fly
the breadth of the island, something that took hours in a vehicle, they also flew above the canopy,
accessing flowers and fruits beyond my reach (and again, mainly at night). What were accessible,
however, were their excretions: ‘splats’ and ‘ejecta’ – the bread and butter of field biologists. In the
end, and after a lot of watching the bats from cliff-tops at dusk and laying out plastic ‘splat-traps’ on
the forest floor, I had to give up on the bat study and instead turned to plants, a somewhat less
arresting but much more acquiescent group.
Despite my failure to return any data, I had gotten a taste for megabats, and not long afterwards
found myself back in the Indian Ocean, this time on Mauritius, studying the Mauritian fruit bat,
Pteropus niger. This study was successful, and the data collected was used for the paper that forms
part of this MSc project; ‘An investigation into the role of the flying fox, Pteropus niger, in forest
regeneration’. Second only to working with the project coordinator, Dorte Nyhagen (who is now my
wife), the most rewarding part of this study was our successful attempt to capture the bats in mist-
nets, something that we were told could not be done. By granting us much closer contact with the
bats, this brought the project to life in my mind, and gave me a deeper understanding of the animals
themselves.
My next and possibly most rewarding bat project was conducted in American Samoa under the
knowledgeable gaze of Dr Ruth Utzurrum and her husband Dr Joshua Seamon. Ruth is another giant
of the bat world and has amassed a great deal of experience and a host of publications and was a
pleasure to work alongside. With funding provided by the American Samoan Government via US
Federal Grants, we were able to conduct a thorough investigation into the movements of the two
species of Pteropus on the main island of Tutuila using radio telemetry, the results of which form the
second part of this MSc project. This required teamwork, and I was lucky enough to be working with
the most uplifting group of Samoans you could meet; Chey, Visa, Ailao, and Saifoi (a.k.a. the ‘Brown

Panther’). My experiences during this time were both deeply insightful and a great deal of fun, and
my interest and understanding of megabats was firmly cemented. Some of the most memorable
experiences include; raising orphaned bats to adulthood, witnessing the en-mass exit of roosting P.
tonganus, seeing bats’ pupils dilate whilst feeding them sugared fruit-juice, learning to raise high
mist nets to catch the uncatchable P. samoensis, and of course homing in on the signals of errant
bats. Also during this time I travelled to New Caledonia where we captured and did blood work on
the New Caledonia Blossom Bat, Notopteris neocaledonica, and the bear-like Pteropus vetulus, the
New Caledonian flying fox.
Upon my return to Denmark following the birth of my daughter, Nina, I continued to work with bats,
although they were of course of the ‘micro’ variety. I was also fortunate enough to enter into the
MSc programme at Aarhus University under the wise and friendly supervision of Professor Jens
Olesen and the subsequent research project forms the final part of this MSc project. In a departure
from my previous experiences, it is based upon a search of readily available literature and data from
libraries and the internet. Whilst it would be absurd to directly compare field work with desk work,
this experience has been of great personal benefit, having broadened my knowledge of megabats
and helped further my career in the world of science.
Stephen Turnbull
Contents
Part 1. ‘Megabats: Macroecology and Conservation Status’.
Part 2. ‘Home Range and Core Area of the Flying Foxes Pteropus
samoensis and P. tonganus on Tutuila, American Samoa’.
Part 3. ‘An investigation into the role of the Mauritian flying fox,
Pteropus niger, in forest regeneration’.

Part 1.
‘Megabats: Macroecology and conservation status’.

Megabats: Macroecology and
conservation status
Stephen Turnbull
Department of Biological Sciences
Faculty of Science
Aarhus University, Denmark
Supervisor:
Associate Professor Jens M. Olesen

2
Table of Contents 1 Introduction ................................................................................................................................... 4
1.1 Definition of Megabats ............................................................................................................ 4
1.2 Megabat Classification ............................................................................................................. 4
1.3 Macroecology .......................................................................................................................... 5
1.4 Body Mass ............................................................................................................................... 5
1.5 Nectarivory .............................................................................................................................. 6
1.6 Isolation ................................................................................................................................... 6
1.7 Range ...................................................................................................................................... 7
1.8 Biogeographical ‘Rules’ and trends .......................................................................................... 7
1.8.1 ‘The Island Rule’ and Optimal Body Size ............................................................................ 7
1.8.2 Bergmann’s rule ................................................................................................................ 7
1.8.3 Rapoport’s rule ................................................................................................................. 7
1.8.4 Latitudinal Diversity Gradient (LDG) .................................................................................. 8
2 Methods ......................................................................................................................................... 8
2.1 Database construction ............................................................................................................. 8
2.2 Megabat Phylogeny ................................................................................................................. 9
2.3 Data analysis ............................................................................................................................ 9
3 Results and Discussion .................................................................................................................. 10
3.1 Limitations of data and data analysis ..................................................................................... 10
3.2 Genera and species ................................................................................................................ 10
3.3 Phylogenetic modelling .......................................................................................................... 10
3.4 Body mass ............................................................................................................................. 12
3.5 Nectarivory specialisation ...................................................................................................... 13
3.6 Geographic distribution of species ......................................................................................... 14
3.7 The Latitudinal Diversity Gradient (LDG) ................................................................................ 14
3.8 Isolation, ‘The Island Rule’, and an ‘ideal’ body size................................................................ 15
3.8.1 Geographical distribution of body masses ....................................................................... 15
3.8.2 Isolation, ‘the island theory’, and ‘ideal’ body mass ......................................................... 15
3.8.3 Species-rich communities ................................................................................................ 16
3.9 Geographical range of megabats ............................................................................................ 18
3.9.1 Body mass and range ...................................................................................................... 18
3.9.2 Bergmann’s rule .............................................................................................................. 18
3.9.3 Rapoport’s rule ............................................................................................................... 19
3.10 IUCN Red List Status ............................................................................................................. 20
3.10.1 Distribution by genus .................................................................................................... 20

3
3.10.2 Geographical distribution .............................................................................................. 20
3.10.3 Conservation status in relation to body mass, isolation, and range ................................ 21
3.10.4 The outlook for megabat diversity ................................................................................. 22
4 Conclusions .................................................................................................................................. 23
5 Appendix ...................................................................................................................................... 25
5.1 Appendix A ............................................................................................................................ 25
5.2 Appendix B ............................................................................................................................ 25
5.3 Appendix C ............................................................................................................................ 26
6 Bibliography ................................................................................................................................. 30
4
1 Introduction
This study attempts to investigate the macroecology and conservation status of megabats, based
upon the ever-increasing availability of data accessible via the internet – a ‘study at a distance’
approach.
1.1 Definition of Megabats
Pteropodidae (Mammalia: Chiroptera: Pteropodidae) are collectively known in the English-speaking
world as fruit bats, flying foxes or megabats. The term ‘megabat’ is somewhat misleading as they
have a great variation in form and size, ranging across two orders of magnitude in adult body mass
(Bonaccorso & McNab, 1997; this study).
The order Chiroptera contains approximately 1,100 species of extant bats (Kuntz & Fenton, 2003),
which are traditionally divided into two suborders; the microbats (or Microchiroptera) and the
megabats (or Megachiroptera). Microbats are the much larger group, subdivided into many families,
whilst the megabats are grouped under only one family, the Pteropodidae. There are approximately
182 extant species of megabat from 43 genera (IUCN Red List of Threatened Species, 2010; Almeida
et al., 2011).
Megabats can be defined by the following traits; all megabats are confined to the Old World (unlike
microbats which are much more broadly distributed); they are all phytophagous, eating leaves, fruit,
and floral resources (Marshall, 1985); unlike every member of the suborder microchiroptera, there is
no megabat that employs laryngeal echolocation (Springer et al., 2001), although species of
Rousettus and Stenonycteris use a system of echolocation based on tongue clicks whilst Eonycteris
speleae echolocates by clapping its wings together (Giannini, 2005 and references therein).
1.2 Megabat Classification
The classification of megabats has long been scrutinised and has been subject to considerable
debate. The megachiropteran classification was originally devised by Anderson (1912) who
subdivided the family Pteropodidae into three subfamilies/subgroups; the Macroglossinae,
Pteropinae (=Pteropodinae), and Harpyionycterinae. The Macroglossinae subfamily contained all of
the specialist nectar and pollen feeders, having developed behavioural and morphological traits to
fulfil their specialist niche including an elongated muzzle and specialised tongue (Anderson, 1912),
features that Kirsch et al. (1995) have demonstrated to have evolved independently five times.
Anderson’s classification system was formally superseded by Bergmans’ classification system in
1997, dismantling the Macroglossinae subfamily. Like Anderson, Bergmans based his classification
largely on morphology, without an explicit application of cladistics principles (Giannini, 2003).
In 1986 Pettigrew advanced the theory first proposed by Carl Linnaeus, that megabats were an
evolutionary sister group to primates. This was based upon brain and body characteristics not shared
by microbats. Subsequent genetic studies have overturned this theory but have further scrutinised
the question of the monophyly of bats, although the latest studies suggest that the Chiroptera are a
monophylic order that can be comfortably sub-divided into the Megachiroptera and Microchiroptera
as previously thought, but with some significant changes (Almeida et al., 2011). Genetic studies have
concluded that some of the Microchiropteran genera should be grouped within the Megachiroptera
– both Rhinolophidae and Megadermatidae belonging to in the same suborder as Pteropodidae
(Springer et al., 2001). The enlarged megabat suborder has been rechristened the
‘Yinpterochiroptera’, whilst the remaining microbat suborder is known as the ‘Yangochiroptera’. In

5
the interests of simplicity, this study will focus on the more traditionally defined ‘megabats’, with the
exclusion of the aforementioned microbats.
The evolutionary history of megabats is confounded by the paucity of fossil records and incomplete
and inconclusive phylogenies (Gunnell & Simmons, 2005; Speakman, 2001). The means by which
megabats and microbats separated into two suborders and the mechanisms by which their
physiological traits developed are both fascinating and opaque. A number of theories have been
proposed, some of which are laid out in Speakman (2001), who favours an evolutionary model based
on the assumption that bats are monophyletic and that the ancestral ‘pre-bat’ was arboreal,
frugivorous, and diurnal. After the incremental development of flight, the predation of bats by
raptorial birds (which were new on the evolutionary scene) forced bats into the nocturnal realm
where they were subsequently divided into the megabats and microbats based upon their reliance
on either vision or echolocation. The chiropteran order experienced a rapid process of evolutionary
diversification in the Eocene, unprecedented amongst mammals (Simmons, 2011), attributed in part
to their exploitation of a bountiful food resource, insects, the diversity of which peaked in the
Tertiary (Teeling et al., 2005).
The megabat suborder is thought to have originated in SE Asia-Melanesia, and recent phylogenetic
evidence supports this theory (e.g. Kirsch et al. 1995, N. Giannini, 2003 and references therein).
Subsequent colonization of Africa is thought to have occurred several times in addition to the
colonization of Indian Ocean islands by Pteropus species (Juste et al., 1999; Gianninni & Simmons,
2003, O’Brien et al. 2009).
1.3 Macroecology
Macroecology, a term coined by Brown & Maurer in 1989, is a rapidly increasing field of scientific
study which attempts to form synthetic links between the overlapping disciplines of ecology,
biogeography, palaeobiology and evolution (Smith et al., 2008). The basic theory of macroecology is
that one can infer some fundamental underlying natural principles from a general observable
pattern. These observable patterns are often based on easy to measure or observe ecological or
phenological attributes, such as body mass or range, as other measurements are typically
incomplete across large numbers or groups of animals.
This paper does not set out to test any theories of the underlying principles of megabat ecology, but
to instead examine the available data and establish whether there are any discernible patterns, and
if they conform to existing theories of macroecology.
In examining the macroecology of megabats, a number of ecological factors were studied, including
body mass, nectarivory specialisation, isolation, and range. The significance of these factors is
outlined below.
1.4 Body Mass
Body mass has long been considered to be a fundamental measure of a wide variety of physiological
and ecological traits and has a strong influence on nearly all aspects of biology, including diet
selection, flight behaviour, roosting, reproductive behaviour and physiology (Swartz et al., 2003).
Some biogeographic rules are based upon body mass, e.g. Bergmann’s rule and ‘The Island Rule’ (see
below).
Bats, unlike their flying counterparts birds, are relatively small, with an upper limit of around 1.5kg
compared to 4kg in birds that sustain flapping flight (Kunz & Fenton, 2003). This upper limit on the

6
mass of bats could be imposed by a number of mechanical and metabolic requirements. Birds
employ thermal soaring to reduce the energy requirements of flight, which is only possible during
the daytime. All but one species of bat are limited to nocturnal foraging activity, Pteropus samoensis
being the exception, a large diurnal species of the Samoan and Fijian archipelagos which is regularly
seen to soar without sustained flapping (pers. obs.).
1.5 Nectarivory
Megabats could be considered to be dietary ‘sequential specialists’ (Marshall, 1985); at any given
time preferentially feeding on a limited proportion of plant resources available, and able to switch
from one food resource to another as necessary to fulfil their energetic needs. Unlike microbats,
there are few real megabat dietary specialists, i.e. species that consistently choose a particular food
resource over other available resources, and have developed specialised behavioural and
morphological adaptations to that resource. Nectarivory specialisation in megabats is one obvious
and well researched exception to this rule of generalisation. Morphological adaptations to nectar
and pollen feeding include an elongated muzzle and specialised tongue, making it possible to classify
some megabats as nectarivory specialists.
The thirteen species of nectarivorous megabats included in this study were from seven genera;
Eonycteris, Macroglossus, Megaloglossus, Meloncycteris, Notopterus, Pteropus, and Syconycteris. In
Andersen’s (1912) original classification, all of these genera, except Pteropus, were placed together
in the subfamily Macroglossinae. Bergman’s 1997 classification system broke this subfamily up and
instead spread the genera over three subfamilies; Pteropodinae, Rousettinae, and Epomophorinae.
Pteropus is grouped within the subfamily Pteropodinae.
1.6 Isolation
Isolation is one way to measure the island status of a species, i.e. whether it can be considered a
true island species, and is therefore subject to the evolutionary pressures (or lack thereof) special to
island dwellers. These pressures include genetic bottlenecks, limited and fluctuating resources,
absence of predation, absence of competition, and immigration filters – see ‘The Island Rule’ below.
Of course isolation, as measured by distance to the nearest neighbouring landmass, is not the only
factor influencing an island species – many other factors come into play such as island area and age,
habitat diversity, rainfall, historical sea level, etc. However, isolation alone is a recognised
biogeographic standard (see Lomolino, 2005 and references therein) and is especially important
when considering megabats which, as the only mammals capable of flight, are often the only
mammals to have naturally colonized remote oceanic islands. Some of the most isolated islands are
occupied by species of the genus Pteropus, a group which can be considered remote island
specialists. This study included only extant species of megabat, although fossil, specimen, and
written records indicate a greatly reduced bat diversity on remote Pacific islands, many species
becoming extinct since the arrival of Europeans in the 18th and 19th centuries (Helgen et al., 2009).
Sea level change must also be factored in when considering the isolation of an island. Major islands
such as Sumatra, Java and Borneo, as well as many of the smaller surrounding islands, have been
connected to mainland Asia via the Malay Peninsula as recently as the late Pleistocene, when sea
levels were 100-200m lower than at present (Bonaccorso & McNab, 1997; Corbet & Hill, 1992; Bird
et al., 2005). Only the most remote species (category 5; <400 km distant from a lower ranked island)
may not have been significantly influenced by sea-level changes.

7
1.7 Range
Range is another well-established measurement fundamental to a species’ natural history, and used
as a basis of some biogeographic rules, e.g. Rapoport’s rule and the Latitudinal Diversity Gradient
(see below). It is also a measurement that is readily available through the IUCN (IUCN Red List of
Threatened Species, 2010). It is of particular significance to island species where range can have a
‘hard’ delineation, i.e. the physical boundaries of an island, severely limiting range. However, the
mode with which range is measured is of great significance to island species; for example, a species
may occupy many small islands over a broad latitudinal/longitudinal range, yet still have a narrow
range in terms of land area occupied.
1.8 Biogeographical ‘Rules’ and trends
1.8.1 ‘The Island Rule’ and Optimal Body Size
‘The Island Rule’, a term coined by Van Valen (1973) and later quantified by Lomolino (1983), states
that there is a tendency for large animals to become smaller on islands and small animals to become
larger. This is usually only applied to mammals and other terrestrial vertebrates. There are certainly
many instances of this trend (e.g. Lomolio, 2005 and references therein), but as with all of these
biogeographic ‘rules’ there is also a great deal of contrary evidence and discourse (e.g. Meiri et al.,
2006, 2008). The theory behind the island rule is that of body size converging towards an optimum –
where island immigrants, freed from some of the constraints of mainland life - in particular
predation and competition - can maximise reproductive power from the energetic resources
available (Brown et al., 1993; Herczeg et al., 2009). They are thus able to focus their energy
expenditure towards the ‘primary’ life history requirement of successful reproduction and reduce
their energy expenditure on ‘secondary’ distractions such as predator avoidance or niche resource
strategies forced upon them by competition.
1.8.2 Bergmann’s rule
A much discussed rule in macroecology is Bergmann’s rule, published in 1947. This rule, originally
applied to homiotherm species within a genus, states that body size increases as ambient
temperature decreases. This rule is often applied in terms of latitude and altitude, and has been
greatly broadened beyond its original scope to include, e.g. endotherms and orders. The underlying
cause for the body size trends for homiotherms originally proposed by Bergmann is that larger
animals have a lower surface area to volume ratio and are therefore able to maintain body
temperature with a lower energy budget.
The species specific relationship between body size and temperature gradient has been shown to be
the reverse of Bergmann’s rule in some instances. Studies on the blossom bats Macroglossus
minimus and Syconycteris australis found that individuals living at higher elevations had lower body
masses than their counterparts at lower elevations (Bonaccorso & McNab, 1997) although the
sample sizes were small. What is now clear however is that megabats, particularly small blossom
bats, are metabolically flexible, and like microbats have the ability to enter torpor, even in tropical
climates, as a method of conserving energy (Bonaccorso & McNab, 1997; Bartels, Law & Geiser,
1998).
1.8.3 Rapoport’s rule
Rapoport’s rule states that the latitudinal range of plant or animal species declines as latitude
decreases towards the equator. This rule was so called by Stevens (1989) in honour of Eduardo

8
Rapoport (1982), and has been extensively applied to and tested against a broad range of biota at a
broad range of scales and geographical locations (see e.g. Luo et al., 2011 and references therein).
Stevens (1989) hypothesises that the decline in species’ range with decreasing latitudes is consistent
with a decrease in climatic variation, the so called ‘climatic variation hypothesis’. According to this
hypothesis, species occupying more northern latitudes are subjected to greater climatic variations
and must therefore be tolerant to a greater range of temperatures, thus enabling them to survive
and thrive across a broader latitudinal range. Conversely, tropical species that are exposed to a
narrower range of temperature gradients must become climatic specialists and are thus limited to a
narrower latitudinal range.
As with other biogeographical ‘rules’ there is a great deal of debate and conjecture as to the
explanations behind the rule, and even as to whether the rule can be supported by any evidence at
all (e.g. Gaston et al., 2012; Kerr et al., 1999; Cruz et al., 2005). The methodology at which the rule is
tested can have a significant impact upon the manifestation of the rule within any given dataset (Luo
et al., 2011) and Steven’s original paper has been criticised for employing a methodology that serves
to inflate the effect of his rule.
1.8.4 Latitudinal Diversity Gradient (LDG)
The latitudinal diversity gradient is one of the most well-known and widely debated ecological
phenomena, although it is also the most robust in terms of it being an easily observable global
pattern – that of increasing species diversity with decreasing latitude. This pattern works in
conjunction with Rapoport’s rule, which theoretically allows more species per unit area towards the
tropics.
There are many theories offered to explain the LDG, which can be grouped into biotic, spatial,
climatic or evolutionary hypotheses. These theories are not mutually exclusive and the
macroecological bases of the LDG are likely to be a combination of many factors (Hillebrand, 2004).
2 Methods
2.1 Database construction
Data for this study were collected from a number of sources, the primary one being ‘PanTHERIA’
(Jones et al., 2009), a database of extant and recently extinct mammalian species. From this dataset
a number of variables were extracted which included; Genus, species, body mass (g), latitudinal and
longitudinal maxima, minima, and mid-points (decimal degrees, dd). From these geographical data
the latitudinal and longitudinal ranges were calculated (dd). Species extinct from the wild were not
included. The second greatest source of information was the IUCN red list of threatened species
mammals database (“IUCN Red List of Threatened Species,” 2010), from which distribution
information was gleaned, including species range (spatially transformed to km² using ArcGIS) and
IUCN Red List conservation status (transformed to ordinal numeric data, where 1=Least Concern
(LC), 2=Near Threatened (NT), 3=Vulnerable (VU), 4=Endangered (EN), and 5=Critically Endangered
(CR)). Other data added include ‘isolation’, the geological origin of land masses, and nectarivory
specialisation.
‘Isolation’ was ranked from 1 to 5 based upon the distance to the nearest landmass of lower ranking
(separated by water) which, if occupied, would extend the range of the species in question. ‘Island
hopping’ was taken into consideration, whereby a lower ranked landmass could be reached through

9
a series of steps across equally ranked landmasses. The IUCN species range maps were used to
evaluate each species individually (IUCN Red List of Threatened Species, 2010) whilst ‘Google Maps
Distance Calculator’ (Daft Logic, 2010) was used to measure map distances. Species were ranked as
follows; Rank 1 is the lowest ranking (i.e. least isolated) and was applied to species occupying
continental mainland areas (e.g. Casinycteris argynnis of central Africa). Rank 2 was applied to
species inhabiting large island masses (e.g. Eonycteris robusta which is widely distributed across the
Philippines). Rank 3 describes islands within 100kms of lower ranked landmasses (e.g. Dobsonia
intermis inhabiting the Solomon Islands). Rank 4 describes island species between 100 and 400kms
distant from the nearest landmass of equal or lower ranking (e.g. Notopteris macdonaldi, found in
Fiji and Vanuatu). Rank 5 describes the truly isolated species with more than 400kms to the nearest
landmass ranked 4 or below (e.g. Pteropus rodricensis inhabiting the Indian Ocean island of
Rodrigues).
The geological origins of landmasses were grouped as either ‘Continental’ (i.e. originally part of the
continental plate and possibly subsequently isolated by continental drift or changes in sea-level) or
‘Oceanic’ (i.e. landmasses raised from the sea floor which have never been directly connected to a
continental land mass) (Bunbury, N. pers. comm.; United Nations Environment Programme, 2006).
The IUCN Red List (IUCN Red List of Threatened Species, 2010) was used to determine species
distribution. A species would be described as ‘Oceanic’ only if it occupied no continental landmasses.
‘Mainland’ vs. ‘Island’: species occupying islands only, i.e. no distribution on mainland, were
classified as island species; the remainder were classified as mainland species. ‘Mainlands’ were
designated as continental landmasses and included e.g. Australia, Africa, Asia and excluded, e.g.
Indonesia, the Philippines, and Madagascar.
Bat diet was very difficult to establish within the scope of this project. Therefore nectar
specialisation was determined instead – bats were classified as ‘nectar specialists’ or ‘not nectar
specialists’. Nectar specialisation was based upon morphological adaptations, such as specialised
dentition (Freeman, 1995) and specialised tongue (Birt et al., 1997). See appendix A for a list of the
most important data used in this study.
2.2 Megabat Phylogeny
The megabat phylogeny and subsequent data analysis was carried out using a method devised by
Cryer (2012, unpublished) and will be briefly outlined here. Phylogenies were calculated using the
1140 bp sequence for cytochrome b as the homologous sequence, as it is considered to be a
successful predicator (see e.g. Castresana, 2001; Almeida et al., 2009). Gene sequence information
was retrieved from GenBank (http://www.ncbi.nlm.nih.gov/genbank) using the Python module
‘BioPython’. Analysis of the data was done using the R statistical programme (R Development Core
Team, 2011) with the add-ons ‘ape’ and ‘nlme’. To construct a phylogenetic tree one or more
evolutionary models must be selected to establish the rate of mutation between molecular
sequences. The PhyML programme was used in conjunction with R (ape package) to automatically
run a variety of evolutionary models which were then evaluated using the Akaike Information
Criterion (AIC).
2.3 Data analysis
Data were analysed using the programmes JPM 9 (SAS Institute Inc.) and ArcMap 10 (ESRI, 2011.
ArcGIS Desktop: Release 10. Redlands, CA: Environmental Systems Research Institute). Data that
were not normally distributed were log transformed (base-10) to enable parametric statistical

10
testing. Logistic regression was used to compare a measured variable (e.g. body mass) against a
nominal variable (e.g. isolation), and student’s t-test was used to compare a measured variable
against a nominal variable with two values (e.g. diet specialisation).
3 Results and Discussion
3.1 Limitations of data and data analysis
Data for body mass and range were sourced from the internet and could not be individually verified,
although the large number of bats included in this study should reduce the influence of inaccurate
data. Data such as body mass and range are dependent upon sampling effort which is typically
higher in the northern latitudes and lower around the equator.
3.2 Genera and species
There were 193 species of megabat in the original PanTHERIA database. This was reduced to 182
after the removal of extinct species and duplicates, i.e. species with multiple names. The 182 extant
species were distributed across 43 genera (see figure 1), 28 of which have only 1-2 species. With
sixty-one species, Pteropus is the largest genus, and constitutes one third of the total number of
megabat species.
Figure 1. List of megabat genera and the corresponding number of species within each genus.
3.3 Phylogenetic modelling
The unavailability of Nucleotide sequences for every bat species reduced the number of megabat species available for phylogenetic analysis to 54. The evolutionary model with the lowest AIC value was chosen as the best model with the best fit for the data. The evolutionary tree was then plotted from the chosen evolutionary model, in this case the GTR+Gamma+I model of nucleotide substitution (see appendix B). The tree groups genera together as expected (see figure 2) and broadly matches other megabat phylogenetic trees (e.g. Almeida et al., 2011; Almeida et al., 2009; Romagnoli & Springer, 2000). As such it is suitable to be used to correct for any phlogenetic interference in the ecological dataset.

11
Figure 2. The maximum likelihood tree of megabat phylogeny calculated using the GTR+Gamma+I model of nucleotide
substitution. Relative branch lengths are illustrated by the scale bar. Letters to the right describe the geographic range of
each species as illustrated in the map below. The black blocks denote nectarivory specialisation. The table is divided at
cladistics intervals; dashed lines denote minor intervals.
D E F GH I
E F
C D E
D E
F
D E
H
GH
H
H
G
A C
A
A
H
H K
GH I
C D E F GH I
I
B
B
C D
D E F G
B
F
B
I
G
E
E
F
F
F
E G
E F
C D
C D E F G
C D E
A C
B
D E F GH
A
A
A
A
A
A
A
A
H
G

12
Figure 3. Map of biogeographic regions used in figure 2, above (from Almeida, 2011).
The role of phylogenetic relationships in ensuring the independence of ecological and biological
factors for statistical analysis has been well established and broadly accepted (e.g. Falsenstein, 1985;
Swartz et al., 2003; Adams, 2008). However, the phylogenetic comparative method is not free from
controversy, and at its heart suffers from the implicit assumptions of the evolutionary model upon
which it is based (Rohlf, 2006; Westoby et al., 1995). The life-history traits of a species can change
rapidly, also eroding the significance of the phylogenetic relatedness of species (Barclay & Harder,
2003). For these reasons, and for the fact that sequence data were available for only a minority of
bats, the phylogenetic comparative method was not employed in this study.
3.4 Body mass
Of the 182 species included in this study, 162 had data for body mass. Body mass of megabats has a
large range; from 14.4g to 1090g (see figure 4). The median is towards the lower end of this scale at
134g, whilst the mean is considerably greater at 219g, having been forced up by a few heavyweights.
Forty-two species (26%) have a body mass of 50g or less, whilst 17 species (10%) have a body mass
of over 500g, three of these (<2%) over 1000g.
There is clearly a very strong phylogenetic component to body mass (see figure 5) with only a few
genera contributing to the total number of large bodied bats. Of the 43 genera, only eight hold
species with a body mass above that of the megabat mean of 219g; Aceredon, Aproteles, Dobsonia,
Eidolon, Hypsignathus, Mirimiri, Pteralopex, and Pteropus. Most genera have a narrow range of body
masses, reflecting the limited number of species per genus. There are some clear exceptions, most
notably Pteropus.
Figure 4. Distribution of body mass (g) at 50g intervals for all megabat species with count, and an outliers box displaying
mean and median.
13
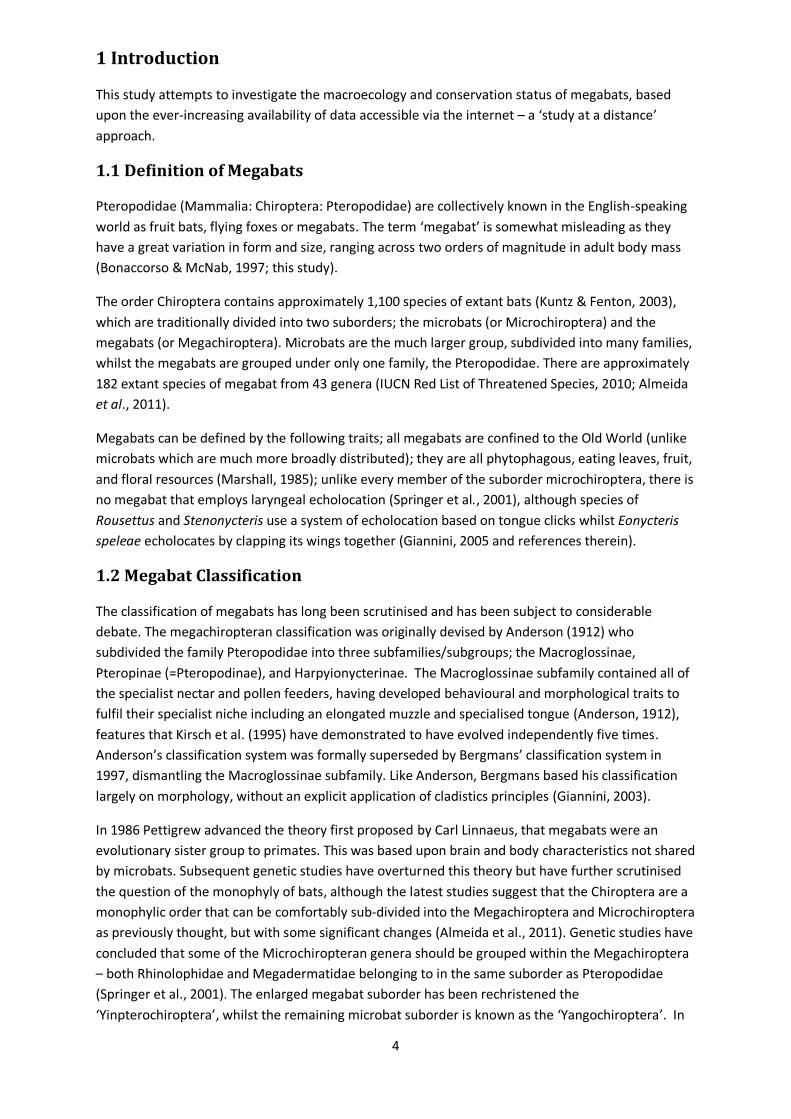
Figure 5. The distribution of body mass (g) within each genus including mean and standard deviation. The horizontal line
displays the mean mass of megabats (219g).
3.5 Nectarivory specialisation
The thirteen species of nectarivorous megabats considered for this study were from seven genera;
Eonycteris, Macroglossus, Megaloglossus, Meloncycteris, Notopterus, Pteropus, and Syconycteris.
Nectar specialists are found throughout the global range of megabats, from West Africa
(Megaloglossus woermanni) to the Fijian archipelago (Notopteris macdonaldi). Whilst some studies
have not considered Pteropus scapulatus as a true nectar specialist, with its specialised dentition
(Freeman, 1995) and specialised tongue (Birt et al., 1997), it is classified as a nectar specialist in this
study. Excluding Pteropus scapulatus (and two other species with no mass data), nectar specialists
range in mass from 16.3g (Megaloglossus woermanni) to 78.4g (Eonycteris robusta), with a mean of
41.2g and a median of 38.0g (n=13).
A Student’s T-test of log body mass by nectarivory specialisation indicates a significant difference in
variances (n=162, DF=15.6, p=0.0002). With the exception of Pteropus scapulatus the body masses
are quite tightly grouped and lie towards the lower end of the megabat body mass distribution
(n=13, range=16.1 - 378, mean=67.1, median=39.3). At 378g, Pteropus scapulatus, which is found in
Australia (and infrequently in Papua New Guinea), is nearly a 10 times the median mass, and nearly
five times the mass of the next largest nectar specialist.
Nectarivorous bats are typically catholic in their selection of flowering plant species visiting many
different species of flower (e.g. Syconycteris australis feeds on the flowers of at least six genera in
New South Wales alone (Richards, 1983; Law, 1992). Nectar specialists are highly mobile and active,
needing to visit hundreds of flowers in a night to meet their energy demands. This, in addition to the
spatial distribution and level of clutter through which bats need to navigate, may have a strong
bearing on body mass, preventing them from becoming larger. Nectarivory is thought to have
evolved after frugivory (Marshall, 1985) and has either been independently developed or lost several
times (Giannini, 2003; Kirsch et al., 1995). This diminishes the potential level of phylogenetic
influence on body mass. The phylogenetic tree produced in this study demonstrates the broad
distribution of nectarivorous bats throughout the megabat suborder (see figure 2).
There are a number of possible explanations for the large size of Pteropus scapulatus. Richards
(1995, in Swartz et al., 2003) found that in the Australian megabat fauna there were both large
(>300g) and small (<60g) nectar and fruit specialists, although only large generalists. This may
indicate a unique characteristic of the Australian eucalyptus forests and associated species

14
interactions. High species richness may promote niche specialisation, whilst abundant floral
resources and a favourable effort to reward ratio may allow for a large body mass. There may also
be differences between the degree and nature of competition from other nectar-drinkers in
Australian forests, in comparison to other forests that support nectarivorous bats.
Interestingly, there is no significant relationship between isolation and nectarivory (n=182, d.f. = 1,
Pearson’s chi-square=0.012, p=0.91. Note; due to the low counts in some groups, isolation was
grouped into high/low; high being isolation ratings 4 and 5, low being 1, 2 and 3). There is also no
significant relationship between nectarivory and mid-range latitude (logistic whole model test,
n=181, d.f.=1, chisquare=1.44, p=0.23), or to put it another way, nectarivorous megabats do not
appear to be clustered towards the equator.
3.6 Geographic distribution of species
181 species of bat had a range map available (IUCN Red List of Threatened Species, 2010), from
which a global map of megabat species richness was created (see figure 6). The area of
measurement is a hexagon of 0.5 decimal degrees in diameter. This clearly indicates a hotspot of
megabat species richness centred on Sulawesi, Indonesia. Other areas of high species richness
include the uplands of Sumatra, the Malay Peninsula, Northern Borneo, the Southern islands of the
Philippines, Papua New Guinea, and the Solomon Islands. In Africa, relatively high megabat species
richness is found in Southern and Eastern regions of the Democratic Republic of Congo, and in an arc
around the Gulf of Guinea, from Liberia to Congo. The species richness distribution map graphically
illustrates the strength of the theory that megabats originated in SE Asia-Melanesia (e.g. Kirsch et al.
1995, N. Giannini, 2003 and references therein).
Figure 6. Map displaying global megabat species richness at a scale of 0.5 decimal degrees plot diameter.
3.7 The Latitudinal Diversity Gradient (LDG)
The species richness map (figure 6) and histogram (figure 7) indicate a general trend of an increase
in species richness towards the equator, in line with the expected LDG. The reasons for this are
unclear and there are many theories that attempt to explain this pattern (e.g. Arita, 2005; Colwell et
al., 2004; Zapata et al., 2005), the relative merits of which are an issue of hot debate and beyond the
scope of this paper.

15
Figure 7. Species counts (determined by mid-point of latitudinal range) per 5 degree band of latitude.
3.8 Isolation, ‘The Island Rule’, and an ‘ideal’ body size.
3.8.1 Geographical distribution of body masses
Figures 8a through 8f map the geographic distribution of megabat species (divided into the quantiles
0-10%, 10-25%, 25-50%, 50-75%, 75-90%, 90-100%). The largest bats (in the upper 10% quantile,
>532.9g) are absent from mainland Africa, although are broadly distributed elsewhere. The smallest
bats (in the lower 10% quantile, <21.75g) are absent from remote islands.
3.8.2 Isolation, ‘the island theory’, and ‘ideal’ body mass
Table 1 details the distribution of body mass for each isolation rating group. The coefficient of
variance of body mass declines as isolation rating increases, and the mean and median body mass
Figure 8a. Body mass 90-100% quantile (>532.9g, n=16) Figure 8b. Body mass.75-90% quantile (321-532.9g, n=24)
Figure 8c. Body mass 50-75% quantile (134-320.75g, n=39) Figure 8d. Body mass 25-50% quantile (48.2-134.0g, n=43)
Figure 8e: Body mass 10-25% quantile (21.75-48.2g, n=24) Figure 8f. Body mass 0-10% quantile (0-21.75g, n=16)

16
for the two most isolated groups (categories 4 and 5) are quite similar, having a combined mean and
median of 273g and 255g respectively (n=21, standard deviation=170g). Figure 9d clearly shows a
concentration of body masses of isolated species centred around 250g. These results suggest that
megabats inhabiting remote oceanic islands converge towards a general purpose phenotype, i.e. a
medium-sized bat of around 250g whose body type is best suited for harvesting the most resources
– the ‘ideal’ body size which underpins ‘the island theory’. Remote islands typically have limited and
fluctuating resources, favouring generalist feeders of relatively large body size to maximise energy
efficiency and exploit more resources.
Another reason for this island phenotype might be the strong immigration filters influencing a
species’ ability to reach a remote island in the first place. The large open-water distances between
remote oceanic islands would favour species of a particular phenotype – probably large enough to
have sufficient energy resources to survive the trip, and a feeding behaviour that is general enough
to deal with whatever food resources are available upon arrival. Indeed, the 11 species in isolation
category 5 (those over 400km to the nearest landmass ranked 4 or below) hail from just two genera;
ten species of the genus Pteropus and Notopteris neocaledonia. So, instead of there being an ‘ideal’
body size, there may instead be an ‘ideal remote island immigrant’ body size and a larger body size
did not evolve after colonisation but already existed. Over the course of evolutionary time speciation
may occur, with new species adapting to fill poorly explored niches which, due to lack of resource
competition, may be quite open to exploitation. Thus, remote oceanic islands could, over the course
of evolutionary time, host large or small species. The largest bat living on a remote island is Pteropus
livingstonii of the Comores islands, weighing in at 731g. This species shares its island habitat with
two other species – Pteropus seychellensis at 488g, and Rousettus obliviousus, at 44.9g. The broad
range of body masses here indicates a broad spacing of ecological niches being exploited. Clearly
the small Rousettus obliviousus and the large Pteropus livingstonii fall out of the ‘ideal remote island
immigrant’ body size, but their ancestors may not have. (It would be interesting to know what the
ancestral states of these species were in relation to their arrival time on the Comores islands). Many
extant Pteropus species fall within this ‘ideal remote island immigrant’ body size, whilst one extant
Rousettus species has a body mass as high as 123g, and so could conceivably have been even
greater. Another possible explanation of how a remote island species can lie outside of the ‘island
remote island immigrant’ body mass range can be illustrated by the example of Myonycteris
brachycephala. At 36.1g this African species is one of the smaller megabats, and is found on the
oceanic island of São Tomé, off the coast of Gabon. Its mainland relatives of the genus Myonycteris
are also small bodied, and it is therefore reasonable to assume that phylogeny has a strong part to
play in this species’ body mass, and that it may have been small upon immigration. However, at a
present day distance of around 240km from mainland Africa, São Tomé cannot be considered
remote in the same sense that an island in the Western Pacific of equivalent distance from another
island is remote. If your nearest neighbour is a continent and not another island, the rate of
immigration events is likely to be much higher, and therefore so too are the chances of the
successful colonisation of a species, despite it not necessarily being well adapted to long-distance
immigration. So, distance is just one function of isolation, and to get a true measure of the effects of
isolation, many more factors, including the size and age of the nearest neighbour, must be
considered.
3.8.3 Species-rich communities
In species-rich communities we might expect the reverse of the island effect to be true, whereby
strong interspecific competition and predation would segregate out body size widely, resulting in a
broad spectrum of body masses from the very small to the very large, and a strengthening of the

17
forces that drive body mass away from the ‘ideal’ found on remote islands. Indeed, the extremes of
body mass are not found on remote islands, but on large landmasses. The seven largest fruit bats
(Pteropus livingstonii is the eighth) are those found on large landmasses: Acerodon jubatus, found in
the Philliphines; Pteropus vampyrus, found across large swathes of SE Asia; P. neohibernicus of
Australia, Indonesia and Papua New Guinea; P. melanopogon of Indonesia; P. giganteus, found
across southern Asia; and P. conspicillatus of Australia, Indonesia and Papua New Guinea. Of the 79
species with a body mass of 100g or less, all but four of them occur on landmasses of isolation rating
1 or 2. Figure 9c shows the range of body masses of the megabat diversity hotspot of the large island
of Sulawesi (174,600 km2) and it illustrates what one might expect from an area of high interspecific
competition – a broad spread of body masses, from the very small, through the medium ‘ideal’ of
body mass, and a few large bats. However, this is just one of the patterns of body mass distribution
in the region. It seems that bats within the 50-75% quantile of body mass (134g – 320.75g) have a
limited range and are entirely absent from New Guinea Island and the entire Sundaic Region,
excluding small offshore islands. With the exception of Dobsonia peronei, present West of the
Wallace line only on the island of Bali, bats within the 50-90% quantile, i.e. 134 to 533g, are absent
from the large islands of the Sundaic region, an area greater than 1.4million km2 (see figure 9a). The
island of New Guinea (786,000 km2) of continental origin, hosts a distribution of megabat body
masses similar to that of the Sundaic region (see figure 9b). There are undoubtedly a number of
factors at play influencing megabat body mass within these regions. The strongest influence is
probably that of resource competition between megabats and their vertebrate competitors, which
in turn is related to land area, geological history, and biogeography. The absence of such a broad
range of body masses from the very large Sundaic region and New Guinea Island suggests that
megabats are being outcompeted and cannot exist as phenotypic generalists, unlike their remote
oceanic island counterparts, and are instead forced into more specialist niches with body sizes either
side of the energetic ideal for body mass.
Table 1. Body mass range, mean, median, mean log, standard deviation (SD) and coefficient of variance (CV)
for each isolation rating group.
Isolation
rating
Body mass
range (g)
Body mass
mean (g)
Body mass
median (g)
Mean log
body mass
SD of log
body mass
CV of log
body mass
n
1 1026 202 85 1.997 0.531 26.61 92
2 707 155 82 1.987 0.437 21.97 28
3 846 340 304 2.447 0.328 13.38 21
4 695 255 230 2.272 0.394 17.32 12
5 435 297 289 2.427 0.215 8.86 9

18
3.9 Geographical range of megabats
181 species had range data from the range shape-files provided by the IUCN red-list data. The range
was broad, from near zero, e.g. Pteropus howensis, (3.9km2) restricted to the Ontong Java Atoll,
Solomon Islands (Helgen, & Allison, 2008), to >10million km2, e.g. Eidolon helvum, a broadly
distributed and partially migratory African species (Mickleburgh et al., 2008). However, more than
half of all megabat species have a range of less than 100,000km2 (n=97), the median range value is
70,200km2, the mean 74,000km2.
3.9.1 Body mass and range
An analysis of variance (linear fit) between body mass (log) and range (log) indicates a significant
relationship between these factors (n=161, d.f. =1, F ratio=21.53, p>F=<0.0001), with a trend for
megabats of lower body mass to have larger ranges. The relationship between range size (log) and
body size (log), does not display the typical triangular pattern (Brown, 1995; Willig et al., 2003)
whereby large-sized species typically have large ranges and small-sized species have a broad
spectrum of range values from small to large. When considering the 26 mainland African species in
isolation there is also no such pattern. The geography of the Austral-Asian and Pacific region in
which megabats occur may confound any patterns between range and body mass as there are a
great number of islands separated by water that would limit a bats’ range.
3.9.2 Bergmann’s rule
A linear fit of body mass (log) with mid-range latitude (adjusted so that negative values are positive)
produces a weak correlation but a highly significant relationship between the values
(RSquare=0.046, n=162, p=0.0063, see figure 10a). Therefore megabats do appear to adhere to
Bergmann’s rule of increasing body mass with increasing latitude. The poor correlation may be the
Figure 9c. Body mass range of bats on the Island of
Sulawesi, excluding smaller offshore islands. N=18.
Figure 9d. Body mass range of megabats within the isolation categories 4 and 5 (i.e. >100km from lower ranked landmass). N=26.
Figure 9b. Body mass range of megabats on the Island of New Guinea, excluding offshore islands. N=19.
Figure 9a. Body mass range of megabats within the Sundaic region, including the main islands of Sumatra, Java, Borneo, and the Malay Peninsula, whilst excluding offshore islands. N=24.
19
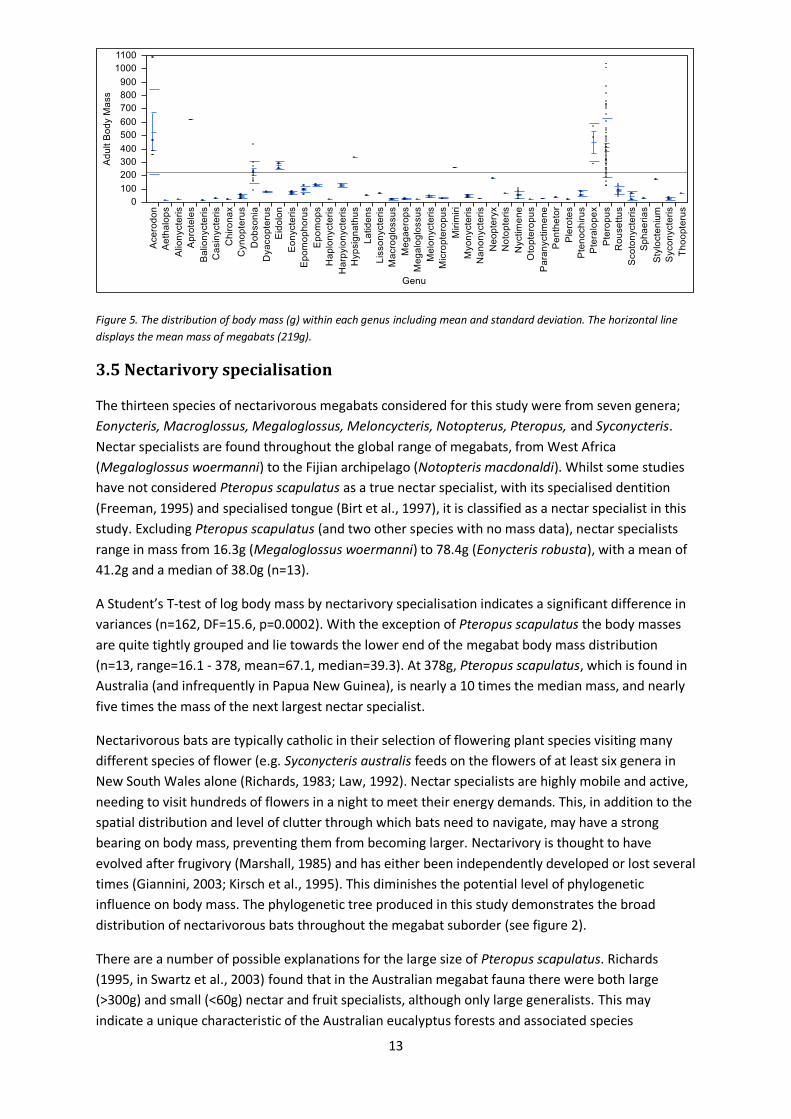
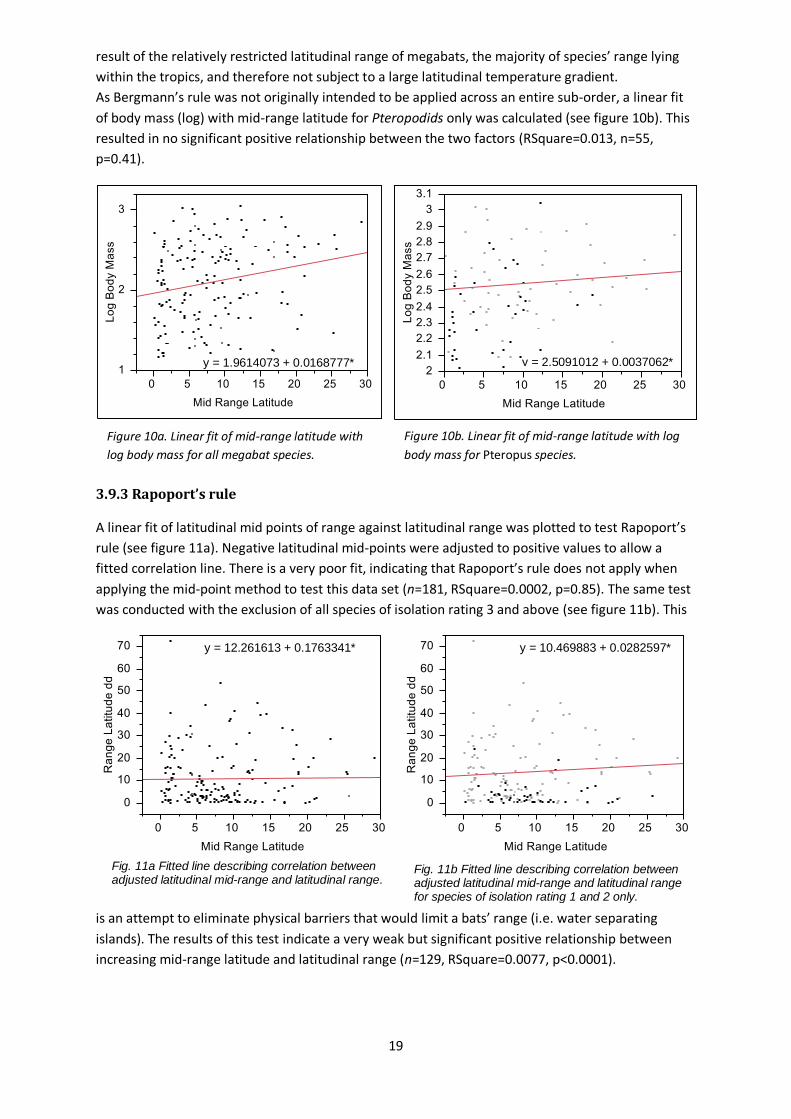
result of the relatively restricted latitudinal range of megabats, the majority of species’ range lying
within the tropics, and therefore not subject to a large latitudinal temperature gradient.
As Bergmann’s rule was not originally intended to be applied across an entire sub-order, a linear fit
of body mass (log) with mid-range latitude for Pteropodids only was calculated (see figure 10b). This
resulted in no significant positive relationship between the two factors (RSquare=0.013, n=55,
p=0.41).
3.9.3 Rapoport’s rule
A linear fit of latitudinal mid points of range against latitudinal range was plotted to test Rapoport’s
rule (see figure 11a). Negative latitudinal mid-points were adjusted to positive values to allow a
fitted correlation line. There is a very poor fit, indicating that Rapoport’s rule does not apply when
applying the mid-point method to test this data set (n=181, RSquare=0.0002, p=0.85). The same test
was conducted with the exclusion of all species of isolation rating 3 and above (see figure 11b). This
is an attempt to eliminate physical barriers that would limit a bats’ range (i.e. water separating
islands). The results of this test indicate a very weak but significant positive relationship between
increasing mid-range latitude and latitudinal range (n=129, RSquare=0.0077, p<0.0001).
Fig. 11a Fitted line describing correlation between adjusted latitudinal mid-range and latitudinal range.
y = 12.261613 + 0.1763341*
Fig. 11b Fitted line describing correlation between adjusted latitudinal mid-range and latitudinal range for species of isolation rating 1 and 2 only.
y = 10.469883 + 0.0282597*
y = 1.9614073 + 0.0168777*
y = 2.5091012 + 0.0037062*
Figure 10a. Linear fit of mid-range latitude with
log body mass for all megabat species.
Figure 10b. Linear fit of mid-range latitude with log
body mass for Pteropus species.

20
3.10 IUCN Red List Status
3.10.1 Distribution by genus
Of the 182 bat species considered, 20 had insufficient data to be classified by conservation status in
the IUCN red list (these are categorised as ‘DD’ – data deficient, or ‘not yet evaluated’(IUCN Red List
of Threatened Species, 2010)). The remaining 162 bat species were classified as follows; ‘least
concern’, 82 species (45%); ‘near threatened’, 17 species (9%); ‘vulnerable’, 36 species (20%);
‘endangered’, 17 species (9%); ‘critically endangered’, 10 species (5%).
Fig. 12. A histogram of megabat species grouped by genus. The colours represent the number of species within
each IUCN red-list category of extinction risk.
3.10.2 Geographical distribution
In figure 13 the three categories indicating species at the greatest risk of extinction have been
grouped together, i.e. vulnerable (VU), Endangered (EN), and critically endangered (CR). These have
been overlaid and counted per grid area (a hexagon of 1 decimal degree diameter). The cumulative
totals are indicated by colour range (see legend), from 1 to 5 species per unit area. Eastern
Melanesia hosts a proportionally high number of high extinction risk species; for example, New
Caledonia hosts four megabat species - Notopteris neocaledonica, Pteropus ornatus, P. vetulus, and
P. tonganus, the first three of which are endemic and classified as vulnerable (VU), whilst P.
tonganus is widespread and listed as least concern (LC). The Solomon Island group, including
Bougainville (Papua New Guinea) and the Santa Cruz Islands, hosts 17 megabat species, 11 of which
are classified as vulnerable, endangered, or critically endangered. A further three are listed as data
deficient.
0
10
20
30
40
50
60
Ace
rod
on
Aet
hal
op
s
Alio
nyc
teri
s
Ap
rote
les
Bal
ion
ycte
ris
Cas
inyc
teri
s
Ch
iro
nax
Cyn
op
teru
s
Do
bso
nia
Dya
cop
teru
s
Eid
olo
n
Eon
ycte
ris
Epo
mo
ph
oru
s
Epo
mo
ps
Hap
lon
ycte
ris
Har
pyi
on
ycte
ris
Hyp
sign
ath
us
Lati
de
ns
Liss
on
ycte
ris
Mac
rogl
oss
us
Meg
aero
ps
Meg
alo
glo
ssu
s
Mel
on
ycte
ris
Mic
rop
tero
pu
s
Myo
nyc
teri
s
Nan
on
ycte
ris
Neo
pte
ryx
No
top
teri
s
Nyc
tim
en
e
Oto
pte
rop
us
Par
anyc
tim
ene
Pe
nth
eto
r
Ple
rote
s
Pte
no
chir
us
Pte
ralo
pex
Pte
rop
us
Ro
use
ttu
s
Sco
ton
ycte
ris
Sph
aeri
as
Styl
oct
eniu
m
Syco
nyc
teri
s
Tho
op
teru
s
CR
EN
VU
NT
LC
DD

21
Figure 13. Cumulative total of megabats within the IUCN red list categories VU, EN, and CR, per unit area of 1
decimal degree diameter.
Figure 14 shows the number of species in each country, as defined by their political boundaries. The
country with the highest species richness is Indonesia with 76 species, followed by Papua New
Guinea at 37, and the Philippines and the Solomon Islands at 24. The number of species listed as
vulnerable, endangered or critically endangered is also indicated and the aforementioned countries
have 21, 5, 5, and 11 species within these categories respectively. This map indicates that the
Solomon Islands have a high species richness, but also that a large proportion of those species are at
a high risk of extinction.
Figure 14. Map of megabat species richness based on political boundaries. The legend below the map describes the colour
key to species richness. The numbers on the map indicate the total number of species within the IUCN red-list categories of
VU, EN and CR within each country.
3.10.3 Conservation status in relation to body mass, isolation, and range
There is a significant relationship between IUCN red list status (numeric) and body mass (log)
(logistic fit whole model test, n=148, 1 d.f., Chi-square=24.13, p<0.0001, see figure 15). There is a
clear trend of higher body mass bats being categorised as being at greater risk of extinction.

22
There is also a significant correlation between isolation and conservation status (contingency
analysis, n=162, Pearson’s chi-square=67.21, 16 d.f., p<0.0001. Note: As some categories have a low
count, this result is suspect. By grouping the categories VU, EN, and CR together as high extinction
risk, and LC and NT as low, a similar result is obtained; n=162, Pearson’s chi-square=48.07, 4 d.f.,
p<0.0001). The mosaic plot (see figure 16) clearly indicates a trend towards an increase in extinction
risk with an increase in isolation. Another significant correlate of conservation status is that of range
(logistic fit, n=162, 1 d.f., Chi-square=32.42, p<0.0001). There is a clear trend that those species that
are at greater risk of extinction have lower ranges. This relationship is unsurprising, not least
because the extinction risk categorisation is in part determined by range – a restricted range
elevates the extinction risk.
These results indicate that large, isolated species of restricted range are at the greatest risk of
extinction.
3.10.4 The outlook for megabat diversity
The future prospects of some of the most threatened species of megabat are less than hopeful.
Isolated island megabat populations can be devastated within a few years or decades as they are
unable to escape or adapt to the pressures of hunting, habitat loss, and introduced exotic species.
Recent examples of this include the steady decline in numbers to near zero of the Mariana Fruit Bat
(Pteropus mariannus), and the extinction of the Guam flying fox (Pteropus tokudae), both on the
island of Guam (Anne Brooke, pers. comm.). Not all species are facing the same pressures, and bat
populations are thriving on other isolated islands, such as American Samoa. Factors including
culture, economy, and topography have all worked to the benefit of the two native species on this
small island nation, Pteropus tonganus and Pteropus samoensis (pers. obs.).
Climate change will add yet more pressure on megabat populations. These pressures may include;
increased severe weather events, increased temperatures, increased invasive species success,
increasing pressure on food production, and increasing disease or reduced resistance to disease
(National Climate Change Adaptation Research Facility, 2011). Some of these factors have been
Figure 15. JMP graphical output of logistic fit of log body
mass against IUCN red list status (numeric ordinal)
Figure 16. JMP graphical output of a contingency analysis
of IUCN red list status (numeric, ordinal) by isolation
rating (numeric, ordinal).
23
documented to have had an impact on megabat populations. Welbergen et al. (2008) reported high
mortality of Pteropus alecto and P. poliocephalus, both large bats, during high temperature events in
Australia. Another smaller species, Pteropus scapulatus, was unaffected by these temperature
extremes as it encounters temperatures above the critical point of 42 degrees in other parts of its
range.
Also in Australia, climate change has had an impact on megabat range. Pteropus alecto has increased
its southward range by 750km over the last 75 years (Ratcliffe, 1932; Nelson, 1965; Eby & Palmer,
1991), whilst the range of Pteropus poliocephalus has contracted southward by 250km in the same
period (Eby, 200). It has been suggested the reduction in the number of nights of frost may be
responsible for the southern expansion of P. alecto (Tidemann, 1999).
4 Conclusions
The results of this study indicate a significant positive relationship between extinction risk and three
factors; high isolation, high body mass and low range. This means that large isolated species are at a
high risk of extinction, whilst small mainland species are at low risk, although each species must of
course be evaluated individually. This study also highlights regions with a high concentration of
megabats of high extinction risk and, in keeping with the results above, some island groups host a
disproportionate number of megabat species of high extinction risk. The Solomon Islands are an
area of particular concern with 11 of the 24 species categorised as endangered or critically
endangered. If the current trends of biodiversity loss continue, and given that the collective efforts
of conservation biologist to halt this trend have been largely unsuccessful (source: 25th Anniversary
Convention of Conservation Biology, 2011), further megabat extinctions in this region and others
appear likely.
Some macroecological trends do seem to be applicable to the megabat sub-order. Most clearly is the
adherence to the very broadly observed latitudinal diversity gradient (LDG). There is also a weak but
significant adherence to Bergmann’s rule and to Rapoport’s rule, although the relationship between
body mass and range does not fit into expected parameters. The results do suggest that there is an
‘island effect’ at work on body mass (based upon island isolation), although it does not promote
gigantism (the largest bats are not found on isolated landmasses), nor dwarfism (75 of the 79 species
of less than 100g are not found on isolated landmasses). Instead, isolation promotes a medium-sized
bat of around 250g, somewhat larger than the median body mass of 134g, but far from the upper
extreme of body mass of 1090g. With so many of the most isolated species being of the genus
Pteropus, there is beyond doubt a phylogenetic aspect to the distribution of island species, but the
fact that the range of body masses of Pteropus is so broad and that large changes in phenotype can
occur quickly in evolutionary terms (Barclay & Harder, 2003), the interrelatedness of isolated island
species does not invalidate the theory of an ‘ideal’ isolated island body mass. There may be a trait
other than body mass of the genus Pteropus that predisposes them to become successful long-
distance immigrants, possibly physiological or behavioural, or some subtle aspect of phenology.
The uneven distribution of body masses throughout the geographic range of megabats suggests that
inter-specific competition has a very strong influence on their phenology, and that the level of
competition varies greatly from one geographic region or island, to the next. An extreme example of
this is found on the larger islands of the Sundaic region where, with the exception of Dobsonia
peronei (present only on Bali west of the Wallace line), megabats within the 50-90% quantile, i.e.
134 to 533g are absent. This suggests that megabats are being outcompeted in these regions of high

24
biodiversity and are being squeezed into specialist niches either side of the ‘ideal’ found on isolated
island. This is of course conjecture, but would make a fascinating area of further study.
The influence of the ‘island effect’ in conjunction with the biogeographically complex area of study
may impede the generation of further biogeographic patterns often observed in other groups and in
other regions. These patterns are the result of the complex interplay of evolutionary pressures (such
as competition, evolutionary history, predation, isolation, climate, etc.) and are what the ‘rules’ of
biogeography describe. As such, they can only ever be over-simplifications and therefore caution
must be taken not to over ascribe the significance of such patterns. The use of the term ‘rule’ is
misleading and can be easily misunderstood.
The complex interplay of evolutionary forces that shape the life history of an individual species, are
matched by the complexities of factors influencing the success or otherwise of any conservation
efforts and, as many examples exist of species bucking macroecological trends, so too are there
many examples of species bucking conservation trends.

25
5 Appendix
5.1 Appendix A
The R output of the various evolutionary models used to analyse the megabat phylogenies. The
lower the AIC value, the better the model fits the data.
5.2 Appendix B
Descriptions of the biogeographic areas used in figure x (from Almeida, 2011).
Code Description
A
B
C
D
E
F
G
H
I
J
K
African continent
Madagascar and surrounding Islands of the Indic Ocean
West and South Asia, from the Arabic Peninsula to India and Sri Lanka
Himalayan and Indochinese regions according to Corbet and Hill (1992)
Sundaic Region (Corbet and Hill, 1992)
Philippines, except Palawan
Wallacea, including Lesser Sunda Islands, Moluccas and Sulawesi
New Guinea and Melanesia Islands
Australia
Micronesia
Polynesia

26
5.3 Appendix C
Table of data used in this study. The latitudinal and longitudinal data were calculated from the IUCN
range data shapefiles.
Genus
Species
Nectar
specialist
(Yes/No)
Adult Body
Mass (g) Range (km
2)
Oceanic
Island
species
(Yes/No)
Isolation
rating
(5=isolated)
IUCN Red
List Status
Acerodon celebensis N 382 177574 N 1 LC
Acerodon humilis N 352 929 N 3 EN
Acerodon jubatus N 1090 155342 N 1 EN
Acerodon leucotis N 349 12751 N 3 VU
Acerodon mackloti N 464 74623 N 1 VU
Aethalops aequalis N 34852 N 2 LC
Aethalops alecto N 15 682352 N 1 LC
Alionycteris paucidentata N 16.2 6418 N 1 LC
Aproteles bulmerae N 619 60 N 1 CR
Balionycteris maculata N 14.4 570366 N 1 LC
Casinycteris argynnis N 28.2 1707516 N 1 LC
Chironax melanocephalus N 17.7 177749 N 1 LC
Cynopterus brachyotis N 33.5 2699375 N 1 LC
Cynopterus horsfieldi N 55.9 1485601 N 1 LC
Cynopterus luzoniensis N 455805 N 2 LC
Cynopterus minutus N 26.45 1461294 N 2 LC
Cynopterus nusatenggara N 85669 N 2 LC
Cynopterus sphinx N 44.3 6455957 N 1 LC
Cynopterus titthaecheilus N 60.4 598087 N 1 LC
Dobsonia anderseni N 233.99 46527 Y 3 LC
Dobsonia beauforti N 164 10000 N 1 LC
Dobsonia chapmani N 270 29 Y 2 CR
Dobsonia crenulata N 218.21 209292 N 1 LC
Dobsonia emersa N 199 2533 N 1 VU
Dobsonia exoleta N 299 179911 N 1 LC
Dobsonia inermis N 151 34750 Y 3 LC
Dobsonia minor N 85.8 614805 N 1 LC
Dobsonia moluccensis N 431 885280 N 1 LC
Dobsonia pannietensis N 238 5415 Y 2 NT
Dobsonia peronii N 226 87784 N 1 LC
Dobsonia praedatrix N 179 44746 Y 3 LC
Dobsonia viridis N 231 27753 Y 2 LC
Dyacopterus brooksi N 74.7 429470 N 2 VU
Dyacopterus spadiceus N 81.1 445040 N 1 NT
Eidolon dupreanum N 295 459921 N 1 VU
Eidolon helvum N 252 11802622 N 1 NT
Eonycteris major Y 74.1 732628 N 1 DD
Eonycteris robusta Y 78.36 114506 Y 2 NT
Eonycteris spelaea Y 58.7 3525509 N 1 LC
Epomophorus angolensis N 89 383548 N 1 NT
Epomophorus anselli N 3402 N 1 DD
Epomophorus crypturus N 95.04 2084464 N 1 LC

27
Epomophorus gambianus N 128 3790881 N 1 LC
Epomophorus grandis N 508 N 1 DD
Epomophorus labiatus N 63.9 2158825 N 1 LC
Epomophorus minimus N 264478 N 1 LC
Epomophorus wahlbergi N 92.8 5001006 N 1 LC
Epomops buettikoferi N 134 1079072 N 1 LC
Epomops dobsoni N 121 1366868 N 1 LC
Epomops franqueti N 119 4538760 N 1 LC
Haplonycteris fischeri N 18.2 264779 Y 2 LC
Harpyionycteris celebensis N 116 169411 Y 2 VU
Harpyionycteris whiteheadi N 134 171865 Y 2 LC
Hypsignathus monstrosus N 335 2860316 N 1 LC
Latidens salimalii N 50 15078 N 1 EN
Lissonycteris angolensis N 68.31 9082578 N 1 LC
Macroglossus minimus Y 16.3 3590169 N 1 LC
Macroglossus sobrinus Y 21.8 2435587 N 1 LC
Megaerops ecaudatus N 26.3 1274129 N 1 LC
Megaerops kusnotoi N 20 14104 N 2 VU
Megaerops niphanae N 32.6 1321397 N 1 LC
Megaerops wetmorei N 18.7 165912 N 1 VU
Megaloglossus woermanni Y 16.1 3430047 N 1 LC
Melonycteris fardoulisi Y 16830 Y 3 LC
Melonycteris melanops Y 47.6 45240 Y 2 LC
Melonycteris woodfordi Y 36.7 16783 Y 2 LC
Micropteropus intermedius N 33 203388 N 1 DD
Micropteropus pusillus N 25.3 5380417 N 1 LC
Mirimiri acrodonta N 255 440 Y 4 CR
Myonycteris brachycephala N 36.1 691 Y 4 EN
Myonycteris relicta N 52.9 141883 N 1 VU
Myonycteris torquata N 44.5 4522691 N 1 LC
Nanonycteris veldkampi N 21.7 1711287 N 1 LC
Neopteryx frosti N 177 6744 Y 2 EN
Notopteris macdonaldi Y 67.9 19271 Y 4 VU
Notopteris neocaledonica Y 10801 N 5 VU
Nyctimene aello N 84.5 621338 N 2 LC
Nyctimene albiventer N 29.8 748030 N 1 LC
Nyctimene cephalotes N 44.5 239455 N 1 LC
Nyctimene certans N 42.9 212404 N 1 LC
Nyctimene cyclotis N 48.4 4143 N 1 DD
Nyctimene draconilla N 29.9 17376 N 1 DD
Nyctimene keasti N 47546 Y 2 VU
Nyctimene major N 106 70315 N 1 LC
Nyctimene malaitensis N 77.7 7178 Y 2 DD
Nyctimene masalai N 52.7 7020 Y 2 DD
Nyctimene minutus N 21.4 25955 Y 3 VU
Nyctimene rabori N 68.2 19216 Y 2 EN
Nyctimene robinsoni N 48.4 351651 N 1 LC
Nyctimene vizcaccia N 41.6 70177 Y 2 LC
Otopteropus cartilagonodus N 16.9 105071 Y 2 LC
Paranyctimene raptor N 24.7 781866 N 1 LC

28
Paranyctimene tenax N 781866 N 2 LC
Penthetor lucasi N 35.3 1288201 N 1 LC
Plerotes anchietae N 20.4 N 1 DD
Ptenochirus jagori N 78.8 271017 Y 2 LC
Ptenochirus minor N 47 118794 Y 2 LC
Pteralopex anceps N 570 8737 Y 3 EN
Pteralopex atrata N 487 5154 Y 3 EN
Pteralopex flanneryi N 14052 Y 3 CR
Pteralopex pulchra N 289 629 Y 3 CR
Pteralopex taki N 3318 Y 3 EN
Pteropus admiralitatum N 304 75835 Y 3 LC
Pteropus aldabrensis N 308 158 Y 4 VU
Pteropus alecto N 607 1353681 N 1 LC
Pteropus anetianus N 394 11334 Y 3 VU
Pteropus argentatus N 324 945 N 3 DD
Pteropus aruensis N 7030 Y 4 CR
Pteropus caniceps N 521 24269 Y 2 NT
Pteropus capistratus N 44171 Y 3 NT
Pteropus chrysoproctus N 724 29769 Y 2 NT
Pteropus cognatus N 235.79 3107 Y 3 EN
Pteropus conspicillatus N 757 219521 N 1 LC
Pteropus dasymallus N 492 38775 N 1 NT
Pteropus faunulus N 214 577 N 4 VU
Pteropus fundatus N 209 324 Y 4 EN
Pteropus giganteus N 818 4002209 N 1 LC
Pteropus gilliardorum N 406.94 3298 Y 3 DD
Pteropus griseus N 270 222133 Y 2 DD
Pteropus howensis N 233 4 Y 4 DD
Pteropus hypomelanus N 433 524208 N 1 LC
Pteropus insularis N 152 80 Y 5 CR
Pteropus intermedius N 735.45 50532 N 1 DD
Pteropus keyensis N 1071 Y 3 DD
Pteropus leucopterus N 343 48554 Y 2 LC
Pteropus livingstonii N 731 636 Y 4 EN
Pteropus lombocensis N 255 65889 N 1 DD
Pteropus loochoensis N 1205 N 4 DD
Pteropus lylei N 320 106823 N 1 VU
Pteropus macrotis N 366 619528 N 1 LC
Pteropus mahaganus N 295 12630 Y 3 VU
Pteropus mariannus N 458 1026 Y 4 EN
Pteropus melanopogon N 867 55404 Y 3 EN
Pteropus melanotus N 414 7219 N 3 VU
Pteropus molossinus N 122 346 Y 5 VU
Pteropus neohibernicus N 1010 672547 N 1 LC
Pteropus niger N 470 4414 Y 5 EN
Pteropus nitendiensis N 273 512 Y 4 EN
Pteropus ocularis N 227 26749 Y 3 VU
Pteropus ornatus N 333 18361 N 1 VU
Pteropus pelewensis N 193.81 456 Y 5 NT
Pteropus personatus N 130 25277 N 1 LC

29
Pteropus pohlei N 350 2598 N 1 EN
Pteropus poliocephalus N 702 249369 N 1 VU
Pteropus pselaphon N 323 72 Y 5 CR
Pteropus pumilus N 184 57994 N 1 NT
Pteropus rayneri N 661 29500 Y 3 NT
Pteropus rennelli N 544 Y 4 VU
Pteropus rodricensis N 256 111 Y 5 CR
Pteropus rufus N 366 185399 N 1 VU
Pteropus samoensis N 310 20148 Y 5 NT
Pteropus scapulatus Y 378 3037832 N 1 LC
Pteropus seychellensis N 488 2731 N 1 LC
Pteropus speciosus N 243 3657 N 2 DD
Pteropus temminckii N 250 26749 Y 3 VU
Pteropus tonganus N 557 57841 Y 5 LC
Pteropus tuberculatus N 227 181 Y 4 CR
Pteropus ualanus N 103 Y 5 VU
Pteropus vampyrus N 1040 1940598 N 1 NT
Pteropus vetulus N 150 16533 N 1 VU
Pteropus voeltzkowi N 538 909 N 1 VU
Pteropus woodfordi N 122 13703 Y 3 VU
Pteropus yapensis N 289.58 98 Y 5 VU
Rousettus aegyptiacus N 134 3891147 N 1 LC
Rousettus amplexicaudatus N 74 4281494 N 1 LC
Rousettus bidens N 123.22 154150 Y 2 VU
Rousettus celebensis N 62.5 181193 N 1 LC
Rousettus lanosus N 104 209033 N 1 LC
Rousettus leschenaulti N 84.4 6764169 N 1 LC
Rousettus linduensis N 40 Y 2 DD
Rousettus madagascariensis N 65.6 292755 N 1 NT
Rousettus obliviosus N 44.9 1667 Y 4 VU
Rousettus spinalatus N 91.5 71651 N 1 VU
Scotonycteris ophiodon N 68.8 387474 N 1 NT
Scotonycteris zenkeri N 21.3 2023486 N 1 LC
Sphaerias blanfordi N 28.8 471485 N 1 LC
Styloctenium mindorensis N 11 Y 2 DD
Styloctenium wallacei N 172 170647 Y 2 NT
Syconycteris australis Y 17.6 1053909 N 1 LC
Syconycteris carolinae Y 39.3 19997 N 1 VU
Syconycteris hobbit Y 19.9 4176 N 1 VU
Thoopterus nigrescens N 65.5 182867 N 1 LC

30
6 Bibliography
Adams, D. C. (2008). Phylogenetic meta-analysis. Evolution, 62(3), 567-72.
Almeida, F. C., Giannini, N. P., DeSalle, R., & Simmons, N. B. (2009). The phylogenetic
relationships of cynopterine fruit bats (Chiroptera: Pteropodidae: Cynopterinae). Molecular
Phylogenetics and Evolution, 53(3), 772-83.
Almeida, F. C., Giannini, N. P., Desalle, R., & Simmons, N. B. (2011). Evolutionary Relationships of the
Old World Fruit Bats (Chiroptera, Pteropodidae): Another Star Phylogeny? BMC evolutionary
biology, 11(1), 281.
Anderson, K. (1912). Catalogue of the Chiroptera in the collections of the British Museum. British
Museum of Natural History, London.
Arita, H. T. (2005). Range size in mid-domain models of species diversity. Journal of Theoretical
Biology, 232(1), 119-26.
Bergmans W (1989) Taxonomy and biogeography of African fruit bats (Mammalia, Megachiroptera).
Beaufortia 39: 89–153.
Bernard, E. (2001). Vertical stratification of bat communities in primary forests of Central Amazon,
Brazil. Journal of Tropical Ecology, 17(1), 115-126.
Bird, M.I., Taylor, D., Hunt, C. (2005). Palaeoenvironments of insular Southeast Asia during the Last
Glacial Period: a savanna corridor in Sundaland? Quaternary Science Reviews 24, 2228–2242.
Birt, P., Hall, L. S., & Smith, G. C. (1997). Ecomorphology of the tongues of Australian Megachiroptera
(Chiroptera: Pteropodidae). Australian Journal of Zoology, 45(4), 369-384.
Bogdanowicz, W., Juste, J., Owen, R. D., & Sztencel, A. (2005). Geometric morphometrics and
cladistics: testing evolutionary relationships in mega- and microbats. Acta Chiropterologica,
7(1), 39-49.
Bonaccorso, F. J., & McNab, B. K. (1997). Plasticity of energetics in blossom bats (Pteropodidae):
impact on distribution. Journal of Mammalogy, 78(4), 1073-1088.
Brown, J. H., & Maurer, B. A. (1989). Macroecology: the division of food and space among species on continents. Science 243, 1145–50.
Colwell, R. K., Rahbek, C., & Gotelli, N. (2004). The mid-domain effect and species richness patterns:
what have we learned so far? American Naturalist, 163(3), 1-23.
Courts, S. E. (1998). Dietary strategies of Old World Fruit Bats (Megachiroptera, Pteropodidae): how
do they obtain sufficient protein? Mammal Rev., 28(4), 185-194.
Craig, P., Morrell, T., & So’oto, K. (1994). Subsistence harvest of birds, fruit bats, and other game in
American Samoa. 1990-1991. Pacific Science, 48(4), 344-352.
31
Cryer, N. (2012). Regression on phylogenetically dependent numerical variables with phylogenetic
inference from molecular sequence data and implementations in python and R. BSc Honours
Thesis, Aarhus Univeristy.
Daft Logic (2010). Google maps distance calculator (version 5.3) [Software]. Available from
http://www.daftlogic.com/projects-google-maps-distance-calculator.htm
Dahl, A. (2006). Islands. United Nations Environment Programme 1998-2006. Retrieved from
http://islands.unep.ch/isldir.htm
Ehrlich, P. R., & Pringle, R. M. (2008). Colloquium paper: Where does biodiversity go from here ? A
grim business-as-usual forecast and a hopeful portfolio of partial solutions. Proceedings of the
National Academy of Science of the United States of America (105;1), 11579-11586.
Eick, G. N., Jacobs, D. S., & Matthee, C. A. (2005). A nuclear DNA phylogenetic perspective on the evolution of echolocation and historical biogeography of extant bats (Chiroptera). Molecular Biology and Evolution, 22 (9), 1869-1886.
Esselstyn, J. A., Amar, A., & Janeke, D. (2006). impact of post typhoon hunting on Mariana fruit bats
(Pteropus mariannus). Pacific Science, 60(4), 531-539.
Falsenstein, J. (1985). Confidence limit on phylogenies; an approach using bootstrap. Evolution 39: 783-791.
Gaston, K. J. (2008). Biodiversity and extinction: the dynamics of geographic range size. Progress in
Physical Geography, 32(6), 678-683.
Giannini, N. (2003). A phylogeny of megachiropteran bats (Mammalia: Chiroptera: Pteropodidae)
based on direct optimization analysis of one nuclear and four mitochondrial genes. Cladistics,
19(6), 496-511.
Giannini, N. P., & Simmons, N. B. (2005). Cladistics Conflict and congruence in a combined DNA –
morphology analysis of megachiropteran bat relationships. Cladistics, 21, 411-437.
Gunnell, G. F., & Simmons, N. B. (2005). Fossil evidence and the origin of bats. Journal of Mammalian
Evolution, 12(1-2), 209-246.
Heideman, P. D., & Utzurrum, R. C. B. (2003). Seasonality and synchrony of reproduction in three
species of nectarivorous Philippines bats. BMC Ecology, 3:11.
Helgen, K., & Allison, A. (2008). Pteropus howensis. In: IUCN 2012. IUCN Red List of Threatened
Species. Version 2012.1. <www.iucnredlist.org>. Downloaded on 14 October 2012.
Helgen, K. M., Helgen, L. E., & Wilson, D. E. (2009). Pacific Flying Foxes (Mammalia: Chiroptera): Two
new species of Pteropus from Samoa, probably extinct. American Museum Novitates, 3646,
37pp.
Herczeg, G., Gonda, A., & Merilä, J. (2009). Evolution of gigantism in nine-spined sticklebacks.
Evolution, 63(12):3, 3190-3200.
32
Hillebrand, H. (2004). On the generality of the latitudinal diversity gradient. The American Naturalist,
163, 192-211.
Hisheh, S., Kitchener, D. J., & Schmitt, L. H. (2003). Relationships between morphology , genetics and
geography in the cave fruit bat Eonycteris spelaea ( Dobson , 1871 ) from Indonesia. Biological
Journal of the Linnean Society, 79, 511-522.
Hollar, L. J., & Springer, M. S. (1997). Old World fruitbat phylogeny: evidence for convergent
evolution and an endemic African clade. Proceedings of the National Academy of Sciences of
the United States of America, 94(11), 5716-21.
Hutcheon, J. M., & Garland Jr., T. (2004). Are megabats big? Journal of Mammalian Evolution,
11(3/4), 257-277.
IUCN Red List of Threatened Species (2010). IUCN, (Version 2010.4). Available from
http://www.iucnredlist.org
IUCN Standards and Petitions Subcommittee (2010). Guidelines for using the IUCN Red List
categories and criteria. IUCN (Version 8.1). Available from
http://intranet.iucn.org/webfiles/doc/SSC/RedList/RedListGuidelines.pdf
Jenness, J. (2012). Repeating shapes for ArcGIS (version 1.5.131) [software]. Jenness Enterprises.
Available at: http://www.jennessent.com/arcgis/repeat_shapes.htm.
JMP, Version 7 [software]. SAS Institute Inc., Cary, NC, 1989-2007.
Jones, K. E., Bielby, J., Cardillo, M., Fritz, S. A., O’Dell, J., Safi, K., Orme, C. D. L., Safi, K., Sechrest, W.,
Boakes, E. H., Carbone, C., Connolly, C., Cutts, M. J., Foster, J. K., Grenyer, R., Habib, M.,
Plaster, C. A., Price, S. A., Rigby, E. A., Rist, J., Teacher, A., Bininda-Emonds, O. R. P., Gittleman,
J. L., Mace, G. M., & Purvis, A. (2009). PanTHERIA: a species-level database of life history,
ecology, and geography of extant and recently extinct mammals. Ecology 90:2648.
Juste, B.J., Alvarez, Y., Tabares, E., Garrido-Pertierra, A., Ibáñez, C., & Bautista, J.M. (1999). Phylogeography of African fruitbats (Megachiroptera). Mol. Phylogenet. Evol., 13 (3), 596–604.
Kalko, E. K. V., Herre, E. A., & Handley, C. O. (1996). Relation of fig fruit characteristics to fruit-eating
bats in the New and Old World tropics. Journal of Biogeography, 23(4), 565-576.
Kelm, D. H., Schaer, J., Ortmann, S., Wibbelt, G., Speakman, J. R., & Voigt, C. C. (2008). Efficiency of
facultative frugivory in the nectar-feeding bat Glossophaga commissarisi: the quality of fruits as
an alternative food source. Journal of Comparative Physiology and Biochemistry, 178(8), 985-
96.
Kirsch, J., Flannery, T., Springer, M., & Lapointe, F. (1995). Phylogeny of the Pteropodidae
(Mammalia, Chiroptera) based on DNA hybridization, with evidence for bat monophyly.
Australian Journal of Zoology, 43(4), 395-428.
Kunz, T. H., & Fenton, M. B. (2003). Bat ecology. Chicago, Ill: University of Chicago Press.

33
Law, B. (1993). Sugar preferences of the Queensland blossom bat, Syconycteris australis: a pilot
study. Australian Mammalogy, 16(1), 17-21.
Marshall, A. G. (1983). Bats, flowers and fruit : evolutionary relationships in the Old World. Biological
Journal of the Linnean Society, 20, 115-135.
Marshall, A. G. (1985). Old World phytophagous bats (Megachiroptera) and their food plants: a
survey. Biological Journal of the Linnean Society, 174, 351-369.
Mcdonald-Madden, E., Schreiber, E. S. G., Forsyth, D. M., Choquenot, D., & Clancy, T. F. (2005).
Factors affecting grey-headed flying-fox (Pteropus poliocephalus: Pteropodidae) foraging in the
Melbourne metropolitan area, Australia. Austral Ecology, 30(5), 600-608.
Mickleburgh, S., Hutson, A.M., Bergmans, W., Fahr, J. & Racey, P.A. (2008). Eidolon helvum. In: IUCN
Red List of Threatened Species (Version 2012.1.). Available from
http://www.iucnredlist.org/details/7084/0. Downloaded on 14 October 2012.
Morrell, T. E., & Craig, P. (1995). Temporal variation in fruit bats observed during daytime surveys in
American Samoa. Wildlife Society Bulletin, 23(1), 36-40.
Nelson, S. L., Masters, D. V., Humphrey, S. R., & Kunz, T. H. (2005). Fruit choice and calcium block use
by Tongan fruit bats in American Samoa. Journal of Mammalogy, 86(6), 1205-1209.
Nogueira, M. R., & Peracchi, A. L. (2003). Fig-seed predation by 2 species of Chiroderma: discovery of
a new feeding strategy in bats. Journal of Mammalogy, 84(1), 225-233.
Norberg, U. M. & Rayner, J. M. V. (1987). Ecological morphology and flight in bats (Mammalia;
Chiroptera): Wing adaptations, flight performance, foraging strategy and echolocation. Phil.
Trans. R. Soc. B., 316(1179), 335-427.
Nowak, R. M. (1994). Walker’s bats of the world. John Hopkins University Press, London.
Orme, C. D. L., Davies, R. G., Olson, V. a, Thomas, G. H., Ding, T.-S., Rasmussen, P. C., Ridgely, R. S.,
Statersfield, A. J., Bennett, P. M., Owens, I. P. F., Blackburn, T. M., & Gaston, K. J. (2006). Global
patterns of geographic range size in birds. PLoS Biology, 4(7), e208.
O’Brien, J., Mariani, C., Olson, L., Russell, A. L., Say, L., Yoder, A. D., & Hayden, T. J. (2009). Multiple
colonisations of the western Indian Ocean by Pteropus fruit bats (Megachiroptera:
Pteropodidae): the furthest islands were colonised first. Molecular Phylogenetics and Evolution,
51(2), 294-303.
Pettersson, S., Ervik, F., & Knudsen, J. T. (2004). Floral scent of bat-pollinated species: West Africa vs.
the New World. Biological Journal of the Linnean Society, 82(2), 161-168.
Pettigrew, J. D. (1986). Flying primates? Megabats have the advanced pathway from eye to
midbrain. Science, 231(4743): 1304–1346.

34
Javier, J. B., Ibáñez, C., & Machordom, A. (1997). Evolutionary relationships among the African fruit
bats : Rousettus egyptiacus, R. angolensis, and Myonycteris. American Society of Mammology,
78(3), 766-774.
Roberts, T. E. (2006). Multiple levels of allopatric divergence in the endemic Philippine fruit bat
Haplonycteris fischeri (Pteropodidae). Biological Journal of the Linnean Society, 88(3), 329-349.
Rohlf, F. J. (2006). A comment on phylogenetic correction. Evolution, 60(7), 1509–1515.
Romagnoli, M. L., & Springer, M. S. (2000). Evolutionary relationships among old world fruitbats
(Megachiroptera: Pteropodidae) based on 12S rRNA , tRNA valine , and 16S rRNA gene
sequences. Journal of Mammalian Evolution, 7(4), 259-284.
Simmons, N. (2005). Order Chiroptera, in Wilson D. E. & Reeder D. M., eds., Mammal species of the
World: A taxonomic and geographic reference, Johns Hopkins University Press, 3rd edition,
312-529.
Simmons, N. B. (2011). An Eocene big bang for bats. Advancement of Science, 307(5709), 527-528.
Singaravelan, N., & Marimuthu, G. (2004). Nectar feeding and pollen carrying from Ceiba pentandra
by Pteropodid bats. Journal of Mammalogy, 85(1), 1-7.
Smith, F. A., Lyons, S. K., Morgan Ernest, S. K., & Brown, J. H. (2008). Macroecology: more than the
division of food and space among species on continents. Progress in Physical Geography, 32(2),
115-138.
Speakman, J. R. (2001). The evolution of flight and echolocation in bats: another leap in the dark.
Mammal Review, 31(2), 111-130.
Speakman, J. R., & Thomas, D. W. (2003). Physiological ecology and energetics of bats, in Kunz, T. H.,
& Fenton, M. B., eds., Bat Ecology, University of Chicago press, 430-492.
Springer, M. S., Teeling, E. C., Madsen, O., Stanhope, M. J., & de Jong, W. W. (2001). Integrated fossil
and molecular data reconstruct bat echolocation. Proceedings of the National Academy of
Sciences of the United States of America, 98(11), 6241-6.
Stevens, G. C. (1989). The latitudinal gradients in geographical range: how so many species co-exist
in the tropics. American Naturalist, 133, 240-256.
Stier, S. C., & Mildenstein, T. L. (2005). Dietary habits of the world’s largest bats: the Philippine flying
foxes, Acerodon jubatus and Pteropus vampyrus lanensis. Journal of Mammalogy, 86(4), 719-
728.
Swartz, S. M., Freeman, P. W., & Stockwell, E. F., (2003). Ecomorphology of bats: comparative and
experimental approaches relating structural design to ecology, in Kunz, T. H., & Fenton, M. B.,
eds., Bat Ecology, University of Chicago press, 257-300.
Teeling, E.C., Springer, M.S., Madsen, O., Bates, P., O’Brien, S. J., & Murphy, W. J. (2005). A molecular
phylogeny for bats illuminates biogeography and the fossil record. Science, 28(5709), 580-584.

35
Thomson, S. C., Brooke, A. P., & Speakman, J. R. (2006). Soaring behaviour in the Samoan flying fox
(Pteropus samoensis). Journal of Zoology, 256(1), 55-62.
Vardon, M. J., Brocklehurst, P. S., Woinarski, J. C. Z., Cunningham, R. B., Donnelly, C. F., & Tidemann,
C. R. (2001). Seasonal habitat use by flying-foxes Pteropus alecto and P. scapulatus
(Megachiroptera) in monsoonal Australia. J. Zool. Lond. 253, 523-535.
Walter, H. S. (2004). The mismeasure of islands: implications for biogeographical theory and the
conservation of nature. Journal of Biogeography 31, 177-197.
Welbergen, J. A, Klose, S. M., Markus, N., & Eby, P. (2008). Climate change and the effects of
temperature extremes on Australian flying-foxes. Proc. R. Soc. B, 275(1633), 419-25.
Westoby, M., Leishman, M.R., & Lord, J.M. (1995). On misinterpreting the phylogenetic correction.
Journal of Ecology, 83(3), 531–534.
Willig, M. R., Lyons, S. K., & Stevens, R. D. (2009). Spatial methods for the macroecological study of bats. Pp. 216-245 In: Ecological and Behavioural Methods for the Study of Bats, Kunz T. & Parsons, S., eds., Johns Hopkins University Press. Baltimore, MD. 901 pp.
Willig, M.R., Kaufman, D.M., & Stevens, R.D., (2003). Latitudinal gradients of biodiversity: Pattern,
process, scale, and synthesis. Annual Review of Ecology Evolution and Systematics, 34, 273-309.
Zapata, F. A., Gaston, K. J. & Chown, S. L. (2005). The mid-domain effect revisited. American
Naturalist 166:E144-E148.

Part 2.
‘Home Range and Core Area of the Flying Foxes Pteropus
samoensis and P. tonganus on Tutuila, American Samoa’.

1
Home range and core foraging area
of Pteropus samoensis and
P. tonganus on Tutuila,
American Samoa.
Stephen D. Turnbull
Co-researchers: Ruth C. B. Utzurrum, Joshua O. Seamon, Saifoi Fa’auma, Ailao
Tualaulelei, Visa Vaivai, Dorte F. Nyhagen, Chey Auelua, Vitale So’oto
Department of Marine and Wildlife Resources, P.O. Box 3730, Pago Pago,
American Samoa 96799, U.S.A.

2
Table of Contents 1 Abstract ................................................................................................................................... 3
2 Introduction ............................................................................................................................. 3
2.1 Study site........................................................................................................................... 3
2.2 Pteropus tonganus ............................................................................................................. 4
2.3 Pteropus samoensis ........................................................................................................... 4
3 Methods................................................................................................................................... 5
3.1 Bat capture and tracking .................................................................................................... 5
3.2 Error testing ...................................................................................................................... 6
4 Results ..................................................................................................................................... 6
4.1 Pteropus tonganus ............................................................................................................. 7
4.2 Pteropus samoensis ........................................................................................................... 8
4.4 Error testing ...................................................................................................................... 9
5 Discussion ................................................................................................................................ 9
5.1 Error testing ...................................................................................................................... 9
5.2 Pteropus tonganus ............................................................................................................. 9
5.3 Pteropus samoensis ......................................................................................................... 10
6 Acknowledgements ................................................................................................................ 11
7 Bibliography ........................................................................................................................... 12
8 Appendix ................................................................................................................................ 15

3
1 Abstract
We captured and radio-tagged two flying fox species at three sites on American Samoa over
a sixteen month period. Data were collected from five specimens of Pteropus samoensis and
sixteen of P. tonganus. The bats were tracked for a mean period of 19 weeks over continuous
eight to sixteen hour periods throughout the day. The bats’ locations were triangulated using
Yagi antennas and the ‘strongest signal’ method. Positions were calculated using ‘Locate’ and
plotted onto a geo-referenced map of Tutuila using ArcView. The home ranges of the bats
were calculated using the ArcView extension ‘Animal Movement’ and ‘Spatial Analysis’. All
five specimens of P. samoensis were loyal to the valley in which they were captured, as were
seven specimens of P. tonganus. Another six engaged in infrequent flights beyond the
boundaries of the valleys in which they were typically found. The remaining three specimens
divided their home ranges between two or more valleys, with a corresponding increase in
home range. A single bat divided its core area between two valleys.
Key words: American Samoa; core area; home range; Pteropus samoensis; Pteropus
tonganus
2 Introduction
Flying foxes of the genus Pteropus (Pteropodidae: Chiroptera) play an important ecological
role as pollinators and seed dispersers throughout their range, although this is particularly
significant on small oceanic islands (Cox et al. 1991, 1992, Elmquist et al. 1992, Rainey et al.
1995, Nyhagen et al 2004). Pteropids are capable of flying long distances from roost to
foraging site in a single night (Banack 1996, Nelson 2003, Nyhagen et al 2004), and are
known to feed on a wide variety of plant species throughout their range. Wiles (1992)
describes the list of known bat food species (not exclusively Pteropodidae) throughout the
Pacific to be 84 species from 41 families. Banack (1998) found Pteropus tonganus and P.
samoensis to feed on over 78 plant species from 39 families throughout their range and over
69 species in Samoa alone.
The objectives of this study were to investigate the home range and core area of P. tonganus
and P. samoensis. Home range is defined as “that area traversed by the individual in its
normal activities of food gathering, mating, and caring for young.” (Burt 1943). By capturing
and tagging as many bats as possible and triangulating their positions throughout the day for
the life of their transmitters, our aim was to gather a complete and accurate picture of their
movements.
2.1 Study site
This sixteen-month study was conducted from July 2002 to October 2003 on the island of
Tutuila (14OS, 170OW), the largest island of the American Samoan archipelago in the South

4
Pacific. Tutuila has an area of 142 km2 and is volcanic in origin, with steep mountains rising
from the coast in most parts (maximum elevation 653 m) except at the Tafuna plain, a low-
lying area on the south-western side of the island. Most flat or gently sloping land has been
developed or cultivated, whilst the mountainous interior and most of the north side of the
island remain covered with native forest, although only the most isolated areas retain any
intact primary forest (Morrell et al. 1995). The natural vegetation of Tutuila is defined as
tropical rain forest consisting of tall, broadleaf evergreen trees, woody vines and ubiquitous
epiphytes (Amerson et al. 1982).
Two species of flying fox are found on the island of Tutuila, Pteropus tonganus and P.
samoensis. The only other large vertebrate pollinator or seed disperser on the island is the
Pacific pigeon (Ducula pacifica). Both bat species are of similar size and appearance but differ
significantly on a number of points:
2.2 Pteropus tonganus
The Tongan flying fox, P. tonganus, has a broad distribution and is found exclusively on
islands from the Schouten Islands of Papua New Guinea in the west through the Cook Islands
in the east (Mickleburgh et al. 1992, Rainey and Pierson 1992, Miller and Wilson 1997).
Pteropus tonganus is a highly sociable animal, roosting in colonies of several hundred
individuals or more (Pernetta and Watling 1978, Cox 1983). It is a generalist feeder, foraging
in native, mixed and agricultural habitats on Tutuila (Pierson et al. 1992, Wilson and Engbring
1992, Banack 1996, Brook 1998, Nelson 2003).
The population of P. tonganus in Tutuila has risen following a recent population low of
around 2000 in 1992 as a result of two hurricanes in Feb 1990 and Dec 1991 and subsequent
hunting (Marine & Wildlife Resources unpublished data). This was estimated to be a
population reduction of 80-90% from pre-hurricane levels (Daschbach 1990, Craig et al. 1994,
Grant et al. 1997).
2.3 Pteropus samoensis
The Samoan flying fox, P. samoensis, is endemic to the Samoan and Fijian archipelagos
(Pierson et al. 1992). It is a solitary species that usually roosts individually or in pairs
(Pernetta and Watling 1978, Cox 1983, Brooke 2000) although at least 11 individuals have
been seen roosting close together in a single tree. It is unusual amongst Pteropids in that it is
active both nocturnally and diurnally, with the greatest activity late in the afternoon and
evening (Brooke 2001). Pteropus samoensis, like P. tonganus, is a generalist feeder, foraging
in both primary

5
Figure 1. The island of Tutuila including the capital, Pago Pago, and the netting sites. Contours
(grey) are at 200ft intervals. Black lines indicate major water-sheds
forest and agroforest although it forages in agroforest to a lesser extent than P. tonganus
(Banack 1998).
The first population surveys of P. samoensis made in 1986-1990 estimated there to be 6.5-
9.5 bats/km2 (Craig et al. 1994). Following the two severe hurricanes in 1991 and 1992 the
population fell to 2-4 bats/km2 (Craig et al. 1994) but has since risen to 6.13 bats/km2 in 1996
(Brooke 2001). Wilson et al. (1992) noted no instances of any interaction between the two
species, nor was any observed during the duration of this study.
There is some scant information on the home range of P. samoensis, (Brooke (2001)
successfully tracked two immature male bats for 74 days) and none on P. tonganus although
the distances travelled by P. tonganus on Tutuila have been investigated in the past.
3 Methods
3.1 Bat capture and tracking
This study spanned a period of sixteen months from July 1st 2002 to October 9th 2003. Netting
was carried out at three sites: Amalau, Masausi and Leone (see figure 1). Bats were captured
in mist nets raised between suitable trees or between poles at up to approximately 10
meters from the ground. The physiology of captured animals was recorded where applicable,
including weight, fore-arm length, sex, reproductive status, approximate age and species.
Bats over 180 g were considered to be suitable candidates for radio-tagging.
Transmitters (Holohil 150–151 MHz, 1 year max. duration) were attached to the bats around
the neck using a length of kite string (nylon) threaded through a flexible plastic tube, the
transmitter, and then tied. Care was taken not to over-tighten the loop around the bats neck.
Each tag weighed approximately 7.8 g, 3.9% of the body weight of the lightest specimen and
well below the 5% threshold that can influence flight performance (Aldridge and Brigham
1988). Each transmitter was equipped with a mortality sensor which doubles the
Figure 1. Map of the island of Tutuila showing the capital, Pago Pago, and the netting sites. The grey lines
denote 200ft contours, whilst the black lines denote major water-sheds

6
transmission pulse rate when the tag has been still for 12 hours. The pulse rate returns to
normal (about 1 pulse per second) once the transmitter is moved. Tagged bats were released
at the site of capture. Telemetry was carried out at least once a week (with few exceptions)
for 8 or 16 hour periods, beginning at various times of the day or night. One or more cycles
through every frequency of transmitter were made, followed by a search for any missing
transmitters.
Tracking of the bats was carried out using three or four observers making simultaneous
readings from strategic positions within the valleys in which the animals were located. The
positions of the observers were determined using a hand-held Trimble GPS unit. The
strongest signal method was employed to take bearings on each animal’s location using Yagi
antennas and Telonics (TR2 and TR4) or Communications Specialists (R1000) receivers. Great
emphasis was placed on trying to find any missing bats. Searches were made by car using a
roof-mounted whip antenna. Due to interference from the car’s engine, frequent stops were
made at key vantage points to listen more thoroughly for the missing signals. If a missing
animal was found, the same procedure of simultaneous readings would be followed to
triangulate the animal’s position.
The map coordinates of each animal’s location were triangulated using ‘Locate’, (an MS DOS
program) and mapped using ArcView GIS (version 3.2). The extensions ‘Spatial Analysis’ and
‘Animal Movement’ were used to calculate the home ranges of the bats using an adaptive
kernel estimate (Worton 1987).
3.2 Error testing
To test the accuracy of the telemetry results obtained during this study, twenty radio-
transmitters (the same as those attached to the bats) were divided between two people and
positioned throughout Amalau valley, approximating the typical locations of our study bats.
The frequency, GPS location, and situation (i.e. height above ground, proximity to trees etc.)
of each transmitter were recorded. The locations of the transmitters were known only to
those that had placed them. The same procedures for telemetry, as described above, were
then followed (except that as the transmitters were stationary there was no need to
synchronize readings). The distances between the triangulated locations of the transmitters
and their actual locations were then calculated.
4 Results
A total of 28 bats were successfully tagged, although only 21 of these returned any useful
data (the remainder had their mortality sensor activated or could not be detected at all
shortly after their release). Of the 21 bats considered in this study, 16 were Pteropus
tonganus and 5 were P. samoensis (Table 1). The duration of the transmitters was between
six weeks and nine months and three weeks, with a mean duration of around 21 weeks
(appendix 1). The mortality sensors of 13 transmitters were activated, 10 transmitters

7
disappeared and could not be located again whilst five transmitters were still transmitting at
the end of this study.
4.1 Pteropus tonganus
Of the 16 bats successfully tracked, eight were male and eight female (appendix 1). All were
adults, except one sub-adult and one young adult. At least three bats were actively followed
throughout the duration of the study.The bats’ home range varied enormously, from 7.9 ha
to 1,848.2 ha (95% adaptive kernel model). However, most bats had a home range to the
lower end of this range (median = 144.5 ha, mean = 282.4 ha (SD = 449.2 ha)). The bats’ core
area varied from 4.2 ha to 838.6 ha (50% adaptive kernel model). However, most bats had a
core range at the lower end of this range (median = 49.7 ha, mean = 108.5ha (SD = 204.2
ha)). The form of the home ranges of the bats can be generalised into three categories with
corresponding differences in their areas. Firstly, there were those that remained entirely
within the confines of a single valley (N = 7), although their roosting and foraging sites might
be divided within the valley (see figure 2. The roosting site is to the north). These had the
smallest home ranges with a mean of 48.9 ha (SD = 41.8 ha). Secondly, there were those that
remained within the confines of a single valley for the most part, except for an occasional
foray further afield (N = 6). Such forays were infrequent, irregular, and of relatively short
distances. The maximum foraging distance for this group was 4 km from the centre of the
core area (see figure 3). This group had a larger home range with a mean of 216.4 ha (SD =
89.9 ha). The third group (N = 3) consistently ranged between two or more valleys. The most
extreme example of this behaviour was observed in an adult female that regularly crossed
Pago Pago bay to travel between its two core areas (see figure 4). This individual had a home
range of 1848.8 ha, whilst the remaining two had home ranges of 583.4 ha and 446.0 ha
(mean = 959.2 ha, SD = 773.0 ha).
Figure 3. Pteropus tonganus PT-132, an adult female. Figure 2. Pteropus tonganus PT-164, an adult male.
NOTE: For figures 2-5.each dot corresponds to a triangulated position of a bat. The continuous
outer black lines represent the home range whilst an inner circular line represents the core area.
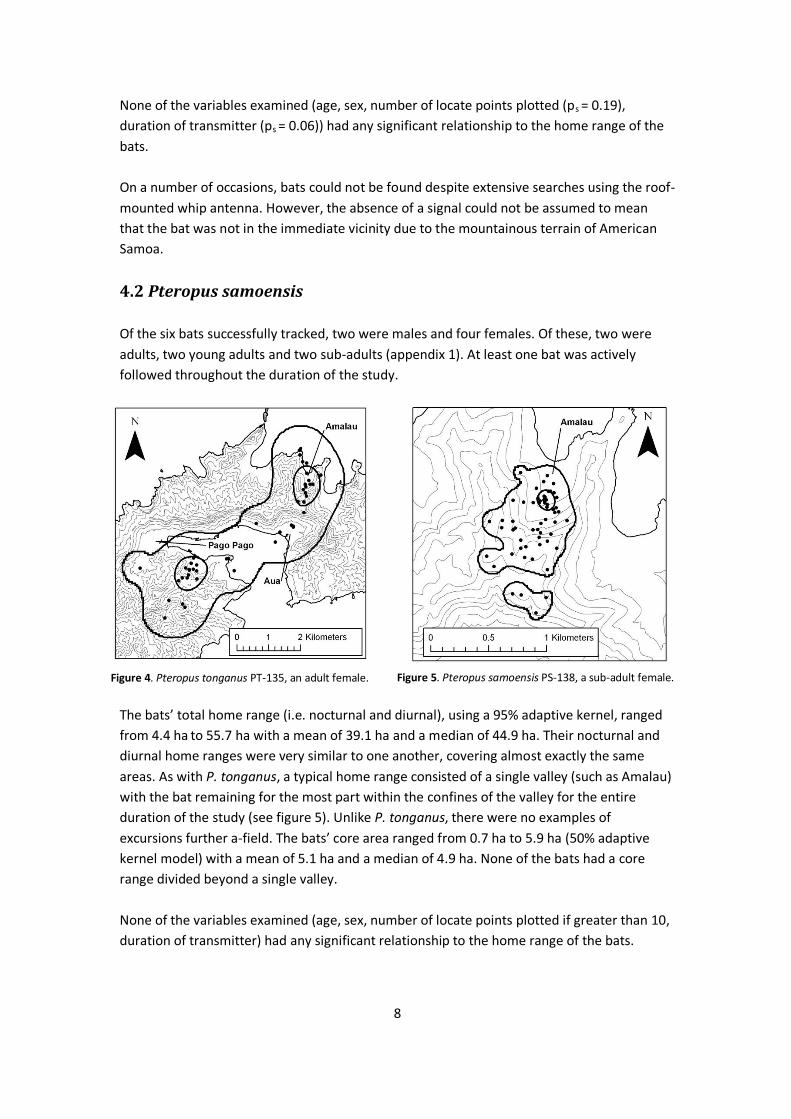
8
None of the variables examined (age, sex, number of locate points plotted (ps = 0.19),
duration of transmitter (ps = 0.06)) had any significant relationship to the home range of the
bats.
On a number of occasions, bats could not be found despite extensive searches using the roof-
mounted whip antenna. However, the absence of a signal could not be assumed to mean
that the bat was not in the immediate vicinity due to the mountainous terrain of American
Samoa.
4.2 Pteropus samoensis
Of the six bats successfully tracked, two were males and four females. Of these, two were
adults, two young adults and two sub-adults (appendix 1). At least one bat was actively
followed throughout the duration of the study.
The bats’ total home range (i.e. nocturnal and diurnal), using a 95% adaptive kernel, ranged
from 4.4 ha to 55.7 ha with a mean of 39.1 ha and a median of 44.9 ha. Their nocturnal and
diurnal home ranges were very similar to one another, covering almost exactly the same
areas. As with P. tonganus, a typical home range consisted of a single valley (such as Amalau)
with the bat remaining for the most part within the confines of the valley for the entire
duration of the study (see figure 5). Unlike P. tonganus, there were no examples of
excursions further a-field. The bats’ core area ranged from 0.7 ha to 5.9 ha (50% adaptive
kernel model) with a mean of 5.1 ha and a median of 4.9 ha. None of the bats had a core
range divided beyond a single valley.
None of the variables examined (age, sex, number of locate points plotted if greater than 10,
duration of transmitter) had any significant relationship to the home range of the bats.
Figure 4. Pteropus tonganus PT-135, an adult female. Figure 5. Pteropus samoensis PS-138, a sub-adult female.
9
On a number of occasions the bat captured at Leone could not be found despite extensive
searches by car using the roof-mounted whip antennae, and on foot up the head of the
valley. As with P. tonganus, the absence of a signal could not be assumed to mean that the
bat was not in the immediate vicinity.
4.4 Error testing
For three intersecting bearings the mean deviation of the triangulated transmitter location
from the actual location at Amalau valley was 132 m.
5 Discussion
5.1 Error testing
Radio-tracking a highly mobile animal with a large range is inherently fraught with errors in
accuracy. This is particularly true on Tutuila where the topography and vegetation cause
scattering and reflection of radio signals and also limit access to favourable telemetry sites.
The error testing experiment illustrated the high degree of error involved in telemetry of this
nature. In many cases bearings were well astray of the true bearing to the transmitter, even
if the transmitter was elevated and the observer had a relatively clear line-of-sight to the
transmitter. Unfavourable topography and vegetation were partially to blame, although
observer error must come into play on occasion.
Radio telemetry of the nature used in this study was unable to track small movements, such
as those within or between neighbouring trees. However, for observations on a larger scale
radio telemetry was well suited to the task and could continue to be a useful study aid into
animal movement and behaviour.
5.2 Pteropus tonganus
Banack (2002) found P. tonganus would travel considerable distances in a single night.
Juvenile males would make exploratory flights of up to 46.7 km, with a mean of 4.8 km on
the east side of the island. Nelson (2003) found quite a different story with bats travelling
less than 2 km from roost to foraging location. The maximum distance travelled in a single
night was 16 km.
The results of this study are more in keeping with those of Nelson (2003), i.e. P. tonganus
travelled very short distances and the maximum distance travelled in one night was 8.7 km
with a mean of 2.1 km. The maximum breadth of the home range of any bat was 6.2 km, but
the average was only 2.6 km. Of course, the breadth of home range gave no indication of the
total distance travelled by a bat in a single night, but it underlined the small area needed to
successfully forage for food throughout the duration of this study. It was interesting to note
10
that whilst a nursing female was the bat with the greatest home range (1848 ha) and
travelled the greatest distance in a single night (8.7 km), another nursing female caught in
the same valley (Amalau) displayed a much more typical home range of 277 ha. The two
other bats that had unusually large home ranges were a sub-adult male (560 ha) and a
pregnant female (446 ha).
The differences between the distances flown by bats in Banack (2002)’s study and those
indicated in this in Nelson (2003)’s study were most likely due to the time at which the
studies were undertaken in relation to hurricanes. Banack’s study was undertaken shortly
after two highly destructive hurricanes passed over American Samoa, stripping the trees of
fruit and foliage, whereas this study and Nelson (2003)’s were undertaken during periods of
relatively high abundance of fruit (Craig 1994, Nelson 2003, DMWR unpublished data). These
and other bat species have demonstrated flexibility in their behaviour when faced with food
scarcity, including increasing foraging distances (Spencer and Fleming 1989, Grant et al.
1997, Palmer and Woinarski 1999).
Another factor influencing the distances travelled by each bat was the site at which it was
captured. Banack (2002) found the only significant factor influencing the distances travelled
by bats was the area in which they were captured (the east or west side of Tutuila). At the
time of both this and Banack’s study there was great variation in the roost size and situation
across Tutuila. Bats from large coastal roosts immediately surrounded by villages or
unproductive forest would have to travel further in order to disperse to suitable foraging
sites. Bats from smaller inland roost sites, immediately surrounded by dense mature forest,
such as were found at Amalau, would not have to disperse as far to reach suitable foraging
sites.
The home ranges and core areas of P. tonganus overlapped with one another, and there no
effort was spent to defend these areas (pers. obs.). However, the bats would aggressively
defend feeding sites, forcing intruders from the immediate vicinity. Such behaviour is not
unusual amongst flying foxes (Nelson 1965, Richards 1990, 1995; Wiles et al., 1991, Brooke
2001).
5.3 Pteropus samoensis
The home ranges of P. samoensis were similar to one another, being compact and confined
to a single valley. Their ranges were considerably smaller than those of P. tonganus. Brooke
(2001) tracked two bats, both captured in Amalau, and found some differences. Whilst one
bat displayed very similar behaviour to those in this study, the other ranged from Amalau to
beyond Vatia (I think you should mark all mentioned locations on your map). This would
suggest that P. samoensis did not restrict itself entirely to a single valley, and did indeed
make exploratory flights elsewhere, and might extend its home range to between two or
more valleys over the course of time. One bat (PS-198), captured at Leone, frequently went
missing and could not be detected within the boundaries of Leone valley or anywhere on the
island of Tutuila that could be accessed. The reasons for this could simply be a faulty
11
transmitter, or steep enclosed terrain blocking the transmitter signal. It is also possible that
the bat travelled to a neighbouring valley, possibly on the uninhabited northern side of the
island.
The home ranges and core areas of P. samoensis, like those of P. tonganus, overlapped with
one another. There was no effort to defend these areas (pers. obs.). There was also overlap
of both home ranges and core areas between P. samoensis and P. tonganus. Like P. tonganus
the bats would aggressively defend feeding sites, forcing intruders from the immediate
vicinity. It is likely that to defend an area larger than this would require more energy than
would be saved due to the heterogeneous distribution of trees and small quantities of fruit
and flower produced at any one location at a particular time (Whistler 1980, Craig 1994,
Brooke 2001).
The small sizes of the home ranges of the bats indicate how productive the forests were at
the time of study. It would indicate that both P. samoensis and P. tonganus were capable of
surviving throughout the year within a single forested valley without the need to venture
further a field to forage for food. However, previous studies have shown that the bats will
alter their foraging patterns in times of food stress to cover much larger areas. This flexibility
has aided the survival of the bats in the aftermath of the frequent tropical cycles that have
hit American Samoa at intervals of 1-13 years over the last 25 years (Craig 2005).
6 Acknowledgements
Our thanks go Ufagafa Ray Tulafono, the Director of the DMWR, and Alofa Tuaumu, the
Deputy Director, who made this study, and many others like it, possible. We are also
extremely grateful for the hard work, dedication, friendship, and expertise that were gladly
offered by the rest of the wonderful staff at the DWMR, American Samoa.

12
7 Bibliography
Aldridge, H.D.J.N. & Brigham, R.M., 1988. ‘Load carrying and maneuverability in an
insectivorous bat: A Test of the 5% "Rule" of radio-telemetry.’ Journal of Mammalogy 69:
379-382.
Amerson, A.B., Whistler, W.A. & Schwaner, T.D., 1982. ‘Wildlife and wildlife habitat of
American Samoa II. Accounts of fauna and flora.’ United States Department of the Interior,
Fish and Wildlife Service, Washington, D.C.
Banack, S.A., 1996. Diet selection and resource use by flying foxes, genus Pteropus, in the
Samoan Islands: interactions with forest communities. PhD thesis, University of California,
Berkeley.
Banack, S.A., 1998. ‘Diet selection and resource use by flying foxes.’ Ecology 76: 1949-1967.
Banack, S.A., 2002. ‘Spatial and temporal movement patterns of the flying fox, Pteropus
tonganus, in American Samoa.’ Journal of Wildlife Management 66: 1154-1163.
Brooke, A.P., Solek, C. & Tualaulelei, A., 2000 ‘Roosting behavior of colonial and solitary flying
foxes in American Samoa (Chiroptera: Pteropodidae).’ Biotropica 32: 338-350.
Brooke, A.P., 2001. ‘Population status and behaviors of the Samoan flying fox (Pteropus
samoensis) on Tutuila Island, American Samoa.’ Journal of Zoology 254: 309-319.
Burt, W.H., 1943. ‘Territoriality and home range concepts as applied to mammals.’ Journal of
Mammalogy 24: 346-352.
Cox, P.A., 1983. ‘Observations on the natural history of Samoan bats.’ Mammalia 47: 519-
523.
Cox, P.A., 1992. ‘Flying foxes as pollinators and seed dispersers in Pacific island ecosystems.’
In D.E. Wilson and G.L. Graham, eds., Pacific island flying foxes: proceedings of an
international conservation conference, USFWS Biological Report 90: 18-26.
Cox, P.A., Elmqvist, T., Pierson, E.D. & Rainey, W.E., 1991. “Flying foxes as strong Interactors
in South Pacific island ecosystems: A conservation hypothesis”. Conservation Biology 5: 448-
454.
Craig, P., Trail, P.W. & Morrel, T.E., 1994. ‘The decline of fruit bats in American Samoa due to
hurricanes and over- hunting.’ Biological Conservation 69: 261-266.
Craig, P., Ed., 2005. ‘Natural History Guide to American Samoa’. Report by the Pacific Islands
CESU and six government organizations.

13
Daschbach, N. 1990. ‘After the hurricane.’ Bats 8: 14-15.
Elmquist, A.C. et al. 1992. ‘Restricted pollination on oceanic islands: pollination of Ceiba
pentandra by flying foxes in Samoa.’ Biotropica 24: 15-23.
Grant, G.S., Craig, P. & Trail, P., 1997. ‘Cyclone-Induced Shift in Foraging Behavior in Flying
Foxes in American Samoa.’ Biotropica 29: 224-228.
Hooge, P.N. & B. Eichenlaub, B., 2000. ‘Animal movement extension to Arcview. ver. 2.0.’
Alaska Science Center - Biological Science Office, U.S. Geological Survey, Anchorage, AK, USA.
Mickleburgh, S.P., Hutson, A. M. & Racey, P. A., 1992. ‘Old World Fruit Bats, An Action Plan
for their Conservation.’ Oxford Information Press Oxford.
Miller, C.A. & Wilson, D.E., 1997. ‘Pteropus tonganus.’ Mammalian Species 552: 1-6.
Morrell, T.E.C., 1995. ‘Temporal variation in fruit bats observed during daytime surveys in
American Samoa.’ Wildlife Society Bulletin 23: 36-40.
Nelson, S.L., 2003. ‘Nutritional ecology of Old-World fruit bats’. PhD Dissertation, Wildlife
Ecology and Conservation, Gainesville, University of Florida.
Nyhagen, D.F., Turnbull, S.D., Olesen, J.M. & Jones, C.G., 2005. ‘Seed dispersal and flower
visitation by the Mauritian flying fox, Pteropus niger.‘ Biological Conservation 122: 491-497.
Palmer, C. & Woinarski, J., 1999. ‘Seasonal roosts and foraging movements of the black flying
fox (Pteropus alecto) in the Northern Territory: resource tracking in a landscape mosiac.’
Wildlife Research 26: 823-838.
Pernetta, J.C., & Watling, D., 1978. ‘The introduced and native terrestrial vertebrates of Fiji.’
Pacific Science: 32: 223-244.
Pierson, E.D. & Rainey W.E., 1992. ‘The biology of flying foxes of the genus Pteropus: a
review.’ In D.E. Wilson & G.L. Graham, eds., Pacific island flying foxes: proceedings of an
international conservation conference, USFWS Biological Report 90: 1-17.
Rainey, W.E., Pierson, E.D., Elmqvist, T. & Cox, P.A., 1995, ’The role of flying foxes
(Pteropodidae) in oceanic island ecosystems of the Pacific’. In P.A. Racey & S.M. Swift, eds.,
Ecology, evolution and behaviour of bats, pp. 47-62. Oxford Science Publications, London.
Richards, G.C., 1990. The spectacled flying fox, Pteropus conspicillatus (Chiroptera:
Pteropodidae), in north Queensland. 2. Diet, seed dispersal and feeding ecology. Australian
Mam-malogy 13: 25-31.

14
Richards, G.C., 1995. ‘A review of ecological interactions of fruit bats in Australian
ecosystems.’ Symposia of the Zoological Society of London 67: 79-96.
Spencer, H.J. & Fleming, T.H., 1989. ‘Roosting and foraging behaviour of the Queensland
tube-nosed bat, Nyctimene robinsoni Pteropodidae): Preliminary radio-tracking
observations.’ Australian Wildlife Research 16: 413-420.
Whistler, W.A., 1980. ‘The vegetation of eastern Samoa.’ Allertonia 2: 46-190.
Wiles, G. & Fujita, M., 1992 ‘Food plants and economic importance of flying foxes on Pacific
Islands.’ In D.E. Wilson & G.L. Graham, eds., Pacific island flying foxes: proceedings of an
international conservation conference, USFWS Biological Report 90: 24-35.
Wilson, D.E., & Engbring, J., 1992.’ The flying fox Pteropus samoensis and Pteropus tonganus:
status in Fiji and Samoa.’ In D.E. Wilson & G.L. Graham, eds., Pacific island flying foxes:
proceedings of an international conservation conference, USFWS Biological Report 90: 74-
101.
Worton, B.J. 1987. ‘A Review of models of home range for animal movement.’ Ecological
Modelling 38: 277-298.
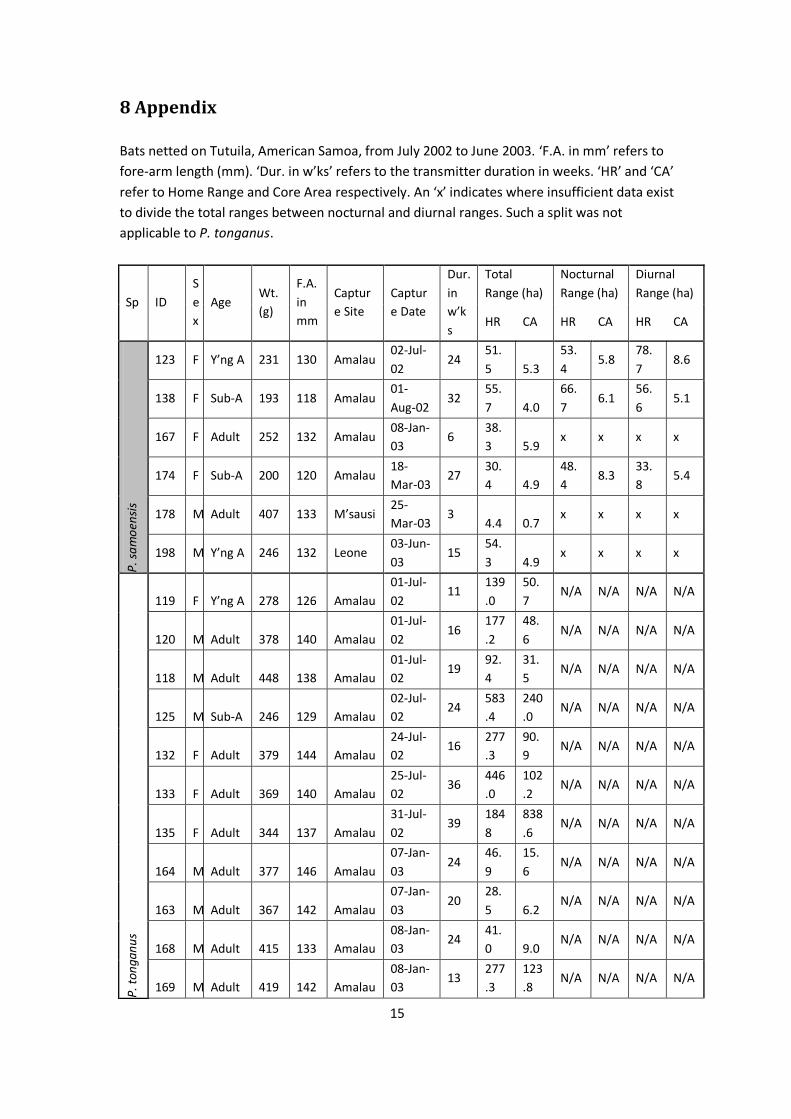
15
8 Appendix
Bats netted on Tutuila, American Samoa, from July 2002 to June 2003. ‘F.A. in mm’ refers to
fore-arm length (mm). ‘Dur. in w’ks’ refers to the transmitter duration in weeks. ‘HR’ and ‘CA’
refer to Home Range and Core Area respectively. An ‘x’ indicates where insufficient data exist
to divide the total ranges between nocturnal and diurnal ranges. Such a split was not
applicable to P. tonganus.
Sp ID
S
e
x
Age Wt.
(g)
F.A.
in
mm
Captur
e Site
Captur
e Date
Dur.
in
w’k
s
Total
Range (ha)
Nocturnal
Range (ha)
Diurnal
Range (ha)
HR CA HR CA HR CA
P. s
am
oen
sis
123 F Y’ng A 231 130 Amalau 02-Jul-
02 24
51.
5 5.3
53.
4 5.8
78.
7 8.6
138 F Sub-A 193 118 Amalau 01-
Aug-02 32
55.
7 4.0
66.
7 6.1
56.
6 5.1
167 F Adult 252 132 Amalau 08-Jan-
03 6
38.
3 5.9 x x x x
174 F Sub-A 200 120 Amalau 18-
Mar-03 27
30.
4 4.9
48.
4 8.3
33.
8 5.4
178 M Adult 407 133 M’sausi 25-
Mar-03 3
4.4 0.7 x x x x
198 M Y’ng A 246 132 Leone 03-Jun-
03 15
54.
3 4.9 x x x x
P. t
onga
nu
s
119 F Y’ng A 278 126 Amalau
01-Jul-
02 11
139
.0
50.
7 N/A N/A N/A N/A
120 M Adult 378 140 Amalau
01-Jul-
02 16
177
.2
48.
6 N/A N/A N/A N/A
118 M Adult 448 138 Amalau
01-Jul-
02 19
92.
4
31.
5 N/A N/A N/A N/A
125 M Sub-A 246 129 Amalau
02-Jul-
02 24
583
.4
240
.0 N/A N/A N/A N/A
132 F Adult 379 144 Amalau
24-Jul-
02 16
277
.3
90.
9 N/A N/A N/A N/A
133 F Adult 369 140 Amalau
25-Jul-
02 36
446
.0
102
.2 N/A N/A N/A N/A
135 F Adult 344 137 Amalau
31-Jul-
02 39
184
8
838
.6 N/A N/A N/A N/A
164 M Adult 377 146 Amalau
07-Jan-
03 24
46.
9
15.
6 N/A N/A N/A N/A
163 M Adult 367 142 Amalau
07-Jan-
03 20
28.
5 6.2 N/A N/A N/A N/A
168 M Adult 415 133 Amalau
08-Jan-
03 24
41.
0 9.0 N/A N/A N/A N/A
169 M Adult 419 142 Amalau
08-Jan-
03 13
277
.3
123
.8 N/A N/A N/A N/A

16
175 F Adult 323 134 Amalau
19-
Mar-03 27
35.
6 9.2 N/A N/A N/A N/A
177 F Adult 313 135 Amalau
20-
Mar-03 26
43.
1
13.
0
N/
A
N/
A
N/A
N/
A
181 M Adult 343 138 M’sausi
25-
Mar-03 2
37.
4
14.
7
N/
A
N/
A
N/
A
N/
A
183 M Adult 484 139 M’sausi
25-
Mar-03 15
7.9 4.2
N/
A
N/
A
N/
A
N/
A
189 F Adult 391 143 M’sausi
27-
Mar-03 6
324
.3
96.
5
N/
A
N/
A
N/
A
N/
A
194 F Adult 310 143 Amalau
30-
May-03 20
150
.0
56.
2
N/
A N/A
N/
A N/A

Part 3.
‘An investigation into the role of the Mauritian flying fox,
Pteropus niger, in forest regeneration’.

An investigation into the role of the Mauritian flying fox,Pteropus niger, in forest regeneration
Dorte Friis Nyhagen *, Stephen David Turnbull, Jens Mogens Olesen, Carl G. Jones 1
Department of Ecology and Genetics, Aarhus University, Ny Munkegade Block 540, DK-8000 Aarhus C, Denmark
Received 29 May 2004; received in revised form 21 July 2004; accepted 5 August 2004
Abstract
This study was conducted over a 7-month period in the south-west of Mauritius and investigates the diet of the endemic flying fox
Pteropus niger and its potential role as pollinator and seed disperser. The identification of food plants and seed dispersal events were
made by direct observations of bats or indirectly by the analysis of ejecta found on the ground. P. niger was observed to visit 22
plant species for food of which 20 were visited for fruit, two for floral resources, and one for foliage (one species was visited for
both fruit and floral resources). Two thousand thirty-two P. niger fruit ejecta from 16 species were collected containing 2460 seeds.
Ejecta from eight of these species (including five endemic to Mauritius) contained seeds, all of which were mature and intact (with
one possible exception) and some were germinating. Forty-seven observations were made of the dispersal of seeds in fruit, ejecta and
faeces, including seeds from three endemic and one native plant species. All seeds in dispersed ejecta were found to be mature and
undamaged by bats. Pollen smears from the lips of six dead and 12 captured bats showed that these animals carried a minimum of 18
pollen species. Each smear had an average of 2.2 pollen species and a pollen load of 17.7 grains. Our results suggest that P. niger
plays an important role in maintaining plant diversity in the heavily fragmented landscape of Mauritius.
� 2004 Elsevier Ltd. All rights reserved.
Keywords: Ejecta; Fruit bats; Mauritius; Pollination; Seed dispersal
1. Introduction
Three species of Pteropus flying foxes (Pteropodidae)once inhabited the island of Mauritius (Pteropus niger,
P. subniger and apparently P. rodricensis) (Cheke and
Dahl, 1981). Today P. niger Kerr is the only extant spe-
cies (Cheke and Dahl, 1981). Whilst P. niger is not under
immediate threat, very little is known about how it sur-
vives on an island greatly changed since the arrival of
humans. In a 1974 census, populations were considered
to be declining as a result of hunting for sport and foodand the severe impact of several cyclones (Cheke and
Dahl, 1981). The IUCN status of this species is Vulner-
able, based on its limited distribution (Mickleburgh
et al., 1992), and its status has not been revised since.Although P. niger has been protected since 1993
(Y. Mungroo, pers. commn.), the bats are still being
hunted and their habitat is strongly influenced by defor-
estation and invasive species. Less than 1.9% of the area
of Mauritius supports native vegetation (Page and
D�Argent, 1997) and the reproduction of native plant
species is poor (Lorence and Sussman, 1986), e.g. some
of the most rare dioecious Diospyros species survivewithout reproduction in unisexual stands (unpublished).
Throughout their geographical range, Pteropus species
are regarded as important pollinators and seed disper-
sers (Crome and Irvine, 1986; Gould, 1978; Izhaki
et al., 1995; Kress, 1985; Shilton et al., 1999; Utzurrum
and Heideman, 1991; Wolton et al., 1982) and on some
0006-3207/$ - see front matter � 2004 Elsevier Ltd. All rights reserved.
doi:10.1016/j.biocon.2004.08.012
* Corresponding author. Tel.: +45 27147500.
E-mail address: [email protected] (D.F. Nyhagen).1 Present address: Forestry Quarters, The Mauritian Wildlife
Foundation, Black River, Mauritius.
www.elsevier.com/locate/biocon
Biological Conservation 122 (2005) 491–497
BIOLOGICAL
CONSERVATION

Old World oceanic islands flying foxes may be particu-
larly important (Cox et al., 1991). However, little is
known of the mutualistic role of many flying foxes and
no previous studies have been made on the role of P. ni-
ger as a pollinator and seed disperser. This study aims to
investigate this role and expand on the list of its foodplant species.
2. Methods
2.1. Study species
Within its genus, P. niger is a medium-sized species(Koopman, 1994). Adult forearm-length averages 152
mm (range = 143–165 mm, n = 14), with no significant
difference between males and females. Non-reproductive
adult females weigh an average of 473 g (range = 380–
540 g, n = 5); at present no data on weight of adult males
are available (Cheke and Dahl, 1981; Nyhagen, 2001).
P. niger is mainly nocturnal/crepuscular, but occasion-
ally individuals were seen foraging during the day.Many bats were actively foraging at 1700 h, and most
had left their roost by sunset. Flight speed of P. niger
whilst leaving or returning to roosts averaged 18.5 km
h�1 (range = 11.5–24.0 km h�1, SD = 3.5 km h�1,
n = 14). Roosts of P. niger were found near ridge tops
with slopes of 30–45� in primary forest or in areas con-
taining a mixture of native and introduced trees (Nyha-
gen, 2001).
2.2. Study site
Mauritius is situated at 20�20 0S 57�30 0E, and covers
1865 km2. Its climate is subtropical–tropical with a
warm, wet season from December to April and a dry,
cooler period from June to October (Strahm, 1996).
The Black River Gorges National Park in the southand south-west of Mauritius covers 65.7 km2. The park
includes two important lower montane forest areas,
Combo and Lower Bel Ombre (150–704 m a.s.l.) (Fig.
1) (Safford, 1997) with several roosts of P. niger.
This study was conducted from October 1999 to
April 2000, mainly in the lower Bel Ombre forest (here
referred to as Bel Ombre), but includes observations
from Combo forest and Black River Village, situatedon the south-western coastline. At the time of study,
two large roost areas existed in Bel Ombre, each com-
prising at least 400 individuals; both roosts varied sea-
sonally in size. One of the roosts extended over several
thousand square meter and consisted of three sub-
roosts, between which the bats flew regularly. One roost
was located in Combo forest, whereas no roosts were
found in the village although bats came here to forageon crop plants (Nyhagen, 2001).
2.3. Ejecta seed loads
Food plants were identified through direct observa-
tions of bats feeding on fruits and floral resources usingbinoculars (10 · 30), and indirectly through ejecta,
which were searched out and collected during regular
walks throughout the study sites. Ejecta are pellets of
fruit pulp squeezed dry of juice between the bat�s tongueand palate and are easily identifiable since no other
Mauritian animal processes fruit in this manner. Ejecta
from different plant species were distinguished from
each other on the basis of pulp colour and texture andseed morphology.
All ejecta found were collected and analysed for their
seed content. Seeds were counted, identified, and catego-
rised as either mature with testa undamaged by bats,
mature with broken testa (�damaged�), or immature.
Seed maturity was evaluated on the basis of testa colour
and hardness and by comparison with seeds that had
just sprouted. Seeds were also categorised as either small(<5 mm), medium (5–25 mm), or large (>25 mm) (length
of longest side). The categorisation was based on the
fact that large Australian pteropodids have an oesopha-
geal lumen distendable to 4–5 mm, through which pas-
sage of smaller seeds is possible (Richards, 1995).
Preliminary surveys suggested that seeds longer than
25 mm were too large to be included in ejecta.
2.4. Seed dispersal
Direct observations of bats carrying fruit and drop-
ping ejecta or fruit in flight were recorded before dark
using binoculars (10 · 30). Indirect observations of
Fig. 1. Map of south-west Mauritius, showing areas of native
vegetation and boundaries of forest sections, including study sites
(modified from Safford (1997)).
492 D.F. Nyhagen et al. / Biological Conservation 122 (2005) 491–497

dispersal were made by collecting ejecta and bat faeces
from the forest floor followed by a search for the nearest
possible source tree. Such observations were made only
of ejecta and feaces that were found beyond the canopy
of the source tree. When the actual dispersal distance
could not be determined, the minimum possible disper-sal distance was recorded for both direct and indirect
observations. All observations were made in areas fre-
quently visited by bats close to roost sites.
2.5. Fur pollen loads
Indirect evidence of bats visiting flowers was obtained
by analysing pollen loads of six dead and 12 capturedbats. The dead bats were found on overhanging electric
wires; all but one had died shortly before the samples
were taken. The live bats were caught in Bel Ombre in
mist-nets (�Ecotone� denier: 110/2 N, mesh: 30 mm, 4
shelves, 3.2 · 12 m in size). Suitable sites for mist-netting
were found to be areas close to trees in which bats were
feeding, and where trees made up a background behind
the net disguising its outline. Nets were set up at duskbetween two trees at a height of approximately 8 m
and were constantly watched when open. One scanning
electron microscopy (SEM) stub with double-sided
sticky tape was applied to the lip region of each dead
and captured bat. Pollen from flowering plants in the
area was also applied to SEM stubs for future reference.
Stubs were kept in airtight plastic containers and later
coated with gold in an Edwards Sputter coater 5150B
and analysed for pollen.
3. Results
3.1. Diet of P. niger
Floral resources were observed to be consumed
from two species (but see Section 3.4), leaves from
one species, and fruit from 20 species (one species
was visited for both fruit and flowers) (Table 1). In to-
tal, 22 food plant species belonging to 19 genera and
13 families were recorded. Thirty-two per cent of thesespecies are endemic to Mauritius, 18% are native and
50% are introduced. Of the native and endemic plant
species, 36% are either vulnerable or rare (Walter
and Gillett, 1998).
From November to February immature fruits of five
species were consumed by P. niger (Diospyros tessellaria,
Grangeria borbonica, Labourdonnaisia glauca, Sideroxy-
lon cinereum and Terminalia catappa). Furthermore,ejecta from G. borbonica and S. cinereum contained a
larger proportion of immature than mature seeds
(59%, n = 39; 94%, n = 64, respectively).
The total number of direct observations of bats feed-
ing on fruits and floral resources was 132 and 55, respec-
tively. Fifty-four of the latter observations were of
young bats feeding in a single tree of the introduced
Table 1
Food plants species of Pteropus niger
Family Species Status Food type
Anarcardiaceae Mangifera indica Introduced Fruit
Arecaceae Dypsis lutescens Introduced Fruit
Burseraceae Protium obtusifolium Endemic Fruit
Celastraceae Cassine orientalisa Native Fruit
Chrysobalanaceae Grangeria borbonica Native Fruit
Combretaceae Terminalia catappa Introduced Fruit
Ebenaceae Diospyros tessellaria Endemic (V) Flower and fruit
Flacourtiaceae Aphloia theiformisa Native Fruit
Melastomataceae Warneckia trinervis Endemic Fruit
Moraceae Artocarpus heterophyllus Introduced Fruit
Moraceae Ficus reflexa Native Fruit
Myrtaceae Callistemon citrinus Introduced Flower
Myrtaceae Psidium cattleianuma Introduced Fruit
Myrtaceae Psidium guajavaa Introduced Fruit
Myrtaceae Syzygium jambos Introduced Fruit
Pandanaceae Pandanus eydouxia Endemic (R) Fruit
Pandanaceae Pandanus utilisa Introduced Fruit
Sapotaceae Labourdonnaisia glauca Endemic (V) Fruit
Sapotaceae Madhuca latifolia Introduced Foliage
Sapotaceae Mimusops coriaceaa Introduced Fruit
Sapotaceae Mimusops petiolaris Endemic (V) Fruit
Sapotaceae Sideroxylon cinereuma Endemic Fruit
Information about distribution, conservation status and nomenclature of plant species is from Flore des Mascareignes (Berg and Van Heusden, 1985;
Friedmann, 1981, 1997a,b; Marais, 1997; Moore and Gueho, 1984; Richardson, 1981; Scott, 1990; Sleumer and Bosser, 1980; Wickens, 1990a,b) and
Walter and Gillett (1998), respectively. V, vulnerable, R, rare.a Only indirect observations (ejecta) recorded. The status of the Mauritian flora is currently in the process of being revised by the Mauritian
Wildlife Foundation and the National Parks Office, Mauritius (Dulloo, E. Dulloo, pers. commun.).
D.F. Nyhagen et al. / Biological Conservation 122 (2005) 491–497 493

Callistemon citrinus. No bats were observed to eat whole
C. citrinus flowers, and no ejecta of flower material were
found beneath the tree. The duration of feeding at each
C. citrinus inflorescence was 15 s (n = 24, SD = 12 s). In
addition, one observation was made of an adult bat
ingesting whole flowers of D. tessellaria and two ejecta,both containing parts from several flowers, were dis-
carded after feeding.
3.2. Ejecta seed loads
A total of 2032 ejecta, containing 2460 seeds and fruit
remains from 16 species, was analysed (the ejecta of
Psidium cattleianum and P. guava were not distin-guished) (Table 2). Seeds and pulp from different species
were never found within the same ejectum. The largest
seeds found in ejecta were those of L. glauca and no
seeds longer than 22 mm and wider than 13 mm were
found. Average number of seeds per ejectum decreased
significantly with increasing seed size (Table 2; Spear-
man correlation analysis: n = 18, r = �0.66, p = 0.01).
One seed of D. tessellaria and 15 of L. glauca were foundgerminating in the ejecta.
The pulp of L. glauca fruits had a high concentration
of latex. Compared to fresh latex in fruit, latex in ejecta
was firmer and stickier (quite like chewing gum), causing
the seed and pulp to stick together. Feeding observa-
tions of bats in the wild showed that the duration of
processing one fruit into ejecta was 222 s for L. glauca
(n = 17, SD = 119 s) compared with 106 s for D. tessel-
laria (n = 7, SD = 46 s), which has fruits of similar size
to L. glauca. The difference was highly significant
(Mann–Whitney U test: U = 20.0, p = 0.001).
3.3. Seed dispersal
A total of 47 direct and indirect observations of the
dispersal of fruit, ejecta or faeces containing seeds were
recorded. Dispersal distances ranged 2–250 m beyond
the canopy of the parent tree.
Dispersal range of fruit was 2–200 m (n = 33) and in-
cluded four, possibly more, species; two endemic (D. tes-
sellaria, n = 21 and L. glauca, n = 5), two introduced(Mangifera indica, n = 1 and Syzygium jambos, n = 1)
and five unidentified fruit.
Dispersal range of ejecta containing seeds was 2–40 m
(n = 9) and included three species; two endemic (L. gla-
uca, n = 6 and Protium obtusifolium, n = 1) and one na-
tive (Ficus reflexa, n = 2). Seeds within dispersed ejecta
were mature and undamaged by bats.
Five faeces, each containing 5–20 Ficus seeds werefound at a distance of 250 m from the nearest fig tree
(F. reflexa).
3.4. Fur pollen load
Eighteen pollen samples taken from the fur of the lip
region of individual bats carried a minimum of 18 pollen
Table 2
Variation between species in average number of seeds per ejecta, proportion of ejecta containing >1 seed and proportion of ejecta with >1
undamaged seed (mature with intact testa)
Species Seed size Number of ejecta Average number of
seeds per ejectum
Proportion of ejecta
with seeds (%)
Proportion of ejecta with
undamaged seeds (%)
Mangifera indica L 117 – – –
Dypsis lutescens M 16 – – –
Protium obtusifolium M 92 1.0 100 100
Grangeria borbonica
Immature seeds M 23 2.0 100 ?
Mature seeds M 16 1.9 100 100
Terminalia catappa L 159 – – –
Diospyros tessellaria M 97 0.1 9.3 4.1
Aphloia theiformis M 73 – – –
Warneckia trinervis M 56 3.9 100 91.1
Artocarpus heterophyllus M 85 – – –
Ficus reflexaa S 3 428.0 100 100
Psidium spp. S 20 6.1 90.0 90.0
Syzygium jambos M 29 – – –
Labourdonnaisia glauca M 956 0.4 43.7 42.3
Mimusops coriacea M 8 – – –
Mimusops petiolaris L 218 – – –
Sideroxylon cinereum
Immature seeds M 60 3.8 100 ?
Mature seeds M 4 3.0 100 100
Total number of ejecta 2032
Seed sizes: Large, L: >25 mm; medium, M: 5–25 mm and small, S: <5 mm.a Seeds found in faeces. Presence of fig wasp holes was not noted.
494 D.F. Nyhagen et al. / Biological Conservation 122 (2005) 491–497

species; a total of 319 pollen grains were found, only
some of which could be identified to genus or species.
Each sample had an average of 17.7 pollen grains
(SD = 28.9, range = 1–110 grains, n = 18) belonging to
2.2 pollen species (SD = 1.5, range = 1–5, n = 18). Eight
samples only had one pollen species, but one sample car-ried five species of pollen, viz. one Sideroxylon species,
two other Sapotaceae species, Diospyros cf. tessellaria
and one Pandanus species. Pollen of Myrtaceae was
most common, being present on half of the samples. Pol-
len of an unknown species was found on 39% of the
samples, and 22% carried pollen of T. catappa.
4. Discussion
4.1. Diet of P. niger
Our list of food plants is not exhaustive because data
were obtained only during the 7-month study period and
observations covered a small part of the range of P. ni-
ger. The methods employed were designed to identifyfood plants of P. niger but cannot quantify the extent
to which their diet is composed of those species.
In this study, the diet of P. niger was composed
mainly of fruit. Whether floral resources or leaves are
important dietary components in areas and/or seasons
not studied here remains to be seen.
This study documented 22 species of food plants of P.
niger, however, 36% of the native or endemic foodplants are vulnerable or rare and their availability to
the bats may decrease even further in the future. The
fact that half of the food plant species were introduced
suggests that P. niger is an opportunistic feeder, strongly
influenced by habitat alteration resulting from human
activity.
Visitation by bats to the small flowers of D. tessellaria
is detrimental to the reproductive potential of the tree.Bats may forage on these flowers for the same reason
that they consume leaves containing important nutri-
ents, e.g. to obtain protein, which is in low quantity in
fruit (Entwistle and Corp, 1997; Funakoshi et al.,
1993; Kunz and Diaz, 1995; Tan et al., 1998), or they
visit flowers in periods of fruit shortage. C. citrinus is
introduced from Australia where flying foxes are also
found, but there are no records of Australian bats visit-ing these flowers.
From November to February immature fruits of
five species were consumed by P. niger and ejecta
from two species contained a larger proportion of
immature than mature seeds. These results suggest a
scarcity of ripe fruit and that during such periods bats
may have a detrimental effect on the reproduction of
their food plants. Banack (1998) and Marshall(1985) emphasise that pteropodids prefer ripe over un-
ripe fruit and Funakoshi et al. (1993) state that fruit
bats only consume immature fruit when ripe fruit
resource levels are low. The nutritional composition
of unripe fruit consumed by Samoan pteropodids fol-
lowing severe hurricanes showed no difference from
ripe fruit in mean levels of organic and mineral com-
ponents (Nelson et al., 2000). However, bats may pre-fer ripe to immature fruit as it is more palatable, i.e. it
has softer pulp and pericarp, and lower levels of sec-
ondary plant compounds.
4.2. Pteropus niger as seed disperser
Bats may provide several advantages to the plants on
which they feed. Separation of pulp from seeds by frugi-vores may increase survival by reducing seed predation
and microbial attack (Willson and Traveset, 2000). In-
sects and fungi attacked 6% and 31% of the fallen, ma-
ture fruits sampled beneath D. tessellaria and L. glauca
trees, respectively, damaging approximately 85% of the
seeds (Nyhagen, 2001).
Potentially, fruit of any plant species eaten by P. ni-
ger may have its seeds dispersed by bats in flight – eventhose with the size of a mango (M. Burgess, pers. com-
mun.). Dispersal by ejecta is limited to species with
medium-sized or small seeds, and dispersal by faeces is
limited to very small seeds such as those of Ficus and
perhaps of Psidium.
This study demonstrated that P. niger disperses in-
tact seeds in ejecta and therefore, the size of the ejecta
seed loads is important in terms of seed dispersal.Some species have fruits smaller than ejecta, and sev-
eral seeds of single-seeded species such as G. borbo-
nica, Warneckia trinervis and S. cinereum were
observed to be dispersed in a single ejecta, although
this may not be an advantage. Such seeds will be
dropped in clumps and perhaps suffer from increased
competition. However, multi-seeded dispersal may be
advantageous in dioecious species (e.g. S. cinereum),as female plants are dependent on male individuals
in their vicinity for pollination.
Labourdonnaisia glauca and D. tessellaria were fre-
quently visited food species of P. niger in the study
area. The duration of processing fruit into ejecta was
significantly longer for L. glauca than e.g. D. tessel-
laria, and bats appeared to have difficulties in discard-
ing the seeds of L. glauca. The average number of seedsin whole fruits of D. tessellaria and L. glauca was five
and one, respectively; however, four times as many L.
glauca ejecta contained seeds than those of D. tessel-
laria. Almost half of all L. glauca ejecta contained a
seed and most of these were classified as undamaged
and mature. The high content of latex in L. glauca
fruits may prolong the feeding duration and length of
time which seeds are attached to the pulp, explainingthe high seed load of ejecta which may enhance the dis-
persal of L. glauca seeds.
D.F. Nyhagen et al. / Biological Conservation 122 (2005) 491–497 495

4.3. Pteropus niger as pollinator
The pollen analysis revealed that at least 18 flower
species are visited by P. niger, although P. niger was ob-
served to visit flowers of only two species. Pollen of
Myrtaceae was most abundant, both in number of batscarrying this pollen type, and in the total amount of pol-
len found on bats. This is most likely explained by the
fact that several bats were captured flying from a flower-
ing C. citrinus tree. As pollen grains within this plant
family are very similar in appearance, the sampled pol-
len could not be determined to species or genus. How-
ever, the Myrtaceae is well represented in the Bel
Ombre forest, e.g. by S. jambos, which was floweringduring the study and may be visited by bats.
Individuals of both T. catappa and L. glauca were
flowering and fruiting simultaneously (pers. obs.), thus,
fruit-harvesting bats might also pollinate.
Pollen samples were limited to only on one SEM stub
per animal and yet pollen from at least 18 species was
found. These bats may carry pollen on chest, shoulder
and facial fur (unpublished for P. subniger), and there-fore the pollen load size and composition found in this
study is likely to be an underestimate of the actual load
of pollen carried by the bats.
The impact of P. niger as pollinator cannot be quan-
tified without further investigation. However, its influ-
ence on seed fitness may be large, because it flies long
distances in a short time, mediating out-crossing among
small, scattered populations in a heavily fragmentedlandscape.
Acknowledgements
We are grateful to I. Lenoir and volunteers from
MWF who helped and assisted on this project. D. Flo-
rens, J. C. Sevathian, M. Virahsawny and G. D�Argentof the Sugar Research Institute of Mauritius helped with
the identification of plant species. Sincere thanks to D.
Hansen, J. Tayleur, D. Hall, P. Garcia, C. Kragelund,
L.I. Eskildsen, J. Seamon and R.B. Utzurrum for useful
discussions and critical comments, and to the reviewers
of this manuscript for their input. This project was sup-
ported by Aarhus University, Bat Conservation Interna-
tional, The Percy Sladen Memorial Fund, TheMidtbank Fund, The Kjebi Fund, and the Danish Sci-
ence Research Council.
References
Banack, S.A., 1998. Diet selection and resource use by flying foxes.
Ecology 79, 1949–1967.
Berg, C.C., Van Heusden, E.C.H., 1985. Moracees. In: Bosser, J.,
Cadet, T., Gueho, J., Marais, W. (Eds.), Flore des Mascareignes,
164. The Sugar Industry Research Institute, Reduit, pp. 1–21.
Cheke, A.S., Dahl, J.F., 1981. The status of bats in theWestern Oceanic
Islands with special reference to Pteropus. Mammalia 45, 205–238.
Cox, P.A., Elmqvist, T., Pierson, E.D., Rainey, W.E., 1991. Flying
foxes as strong interactors in South Pacific Island ecosystems: a
conservation hypothesis. Conservation Biology 5, 448–454.
Crome, F.H.J., Irvine, A.K., 1986. Two Bob Each Way: The
pollination and breeding system of the Australian rain forest tree
Syzygium cormiflorum (Myrtaceae). Biotropica 18, 115–125.
Entwistle, A.C., Corp, N., 1997. The diet of Pteropus voeltzkowi, an
endangered fruit bat endemic to Pemba island Tanzania. African
Journal of Ecology 35, 351–360.
Friedmann, F., 1981. Sapotacees. In: Bosser, J., Cadet, T., Gueho, J.,
Marais, W. (Eds.), Flore des Mascareignes, 116. The Sugar
Industry Research Institute, Reduit, pp. 1–27.
Friedmann, F., 1997a. Anacardiaceae. In: Bosser, J., Cadet, T.,
Gueho, J., Marais, W. (Eds.), Flore des Mascareignes, 77. The
Sugar Industry Research Institute, Reduit, pp. 1–11.
Friedmann, F., 1997b. Chrysobalanacees. In: Bosser, J., Cadet, T.,
Gueho, J., Marais, W. (Eds.), Flore des Mascareignes, 82. The
Sugar Industry Research Institute, Reduit, pp. 1–4.
Funakoshi, K., Watanabe, H., Kunisaki, T., 1993. Feeding ecology of
the northern Ryukyu fruit bat, Pteropus dasymallus dasymallus, in a
warm temperate region. Journal of Zoology London 230, 221–230.
Gould, E., 1978. Foraging behaviour of Malaysian nectar-feeding bats.
Biotropica 10, 184–193.
Izhaki, I., Korine, C., Arad, Z., 1995. The effect of bat (Rousettus
aegypticus) dispersal on seed germination in eastern Mediterranean
habitats. Oecologia 101, 335–342.
Koopman, K.F., 1994. Chiroptera: Systematics. Walter de Gruyter,
Berlin.
Kress, J.W., 1985. Bat pollination of an Old World Heliconia.
Biotropica 17, 302–308.
Kunz, T.H., Diaz, C.A., 1995. Folivory in fruit-eating bats, with new
evidence from Artibeus jamaicensis (Chiroptera: Phyllostomidae).
Biotropica 27, 106–120.
Lorence, D.H., Sussman, R.W., 1986. Exotic species invasion into
Mauritius wet forest remnants. Journal of Tropical Ecology 2, 147–
162.
Marais, W., 1997. Celastracees. In: Bosser, J., Cadet, T., Gueho, J.,
Marais, W. (Eds.), Flore des Mascareignes, 72. The Sugar Industry
Research Institute, Reduit, pp. 1–11.
Marshall, A.G., 1985. Old World phytophagous bats (Megachirop-
tera) and their food plants: a survey. Zoological Journal of the
Linnean Society 83, 351–369.
Mickleburgh, S.P., Hutson, A.M., Racey, P.A., 1992. Old World Fruit
bats: An Action Plan for their Conservation. IUCN Gland,
Switzerland.
Moore, H.E., Gueho, L.J., 1984. Palmiers. In: Bosser, J., Cadet, T.,
Gueho, J., Marais, W. (Eds.), Flore des Mascareignes, 189. The
Sugar Industry Research Institute, Reduit, pp. 1–34.
Nelson, S.L., Miller, M.A., Heske, E.J., Fahey, G.C., 2000. Nutri-
tional quality of leaves and unripe fruit consumed as famine foods
by the flying foxes of Samoa. Pacific Science 54, 301–311.
Nyhagen, D.F., 2001. Foraging ecology of the Mauritian flying fox
Pteropus niger (Megachiroptera). M.Sc. Thesis, Aarhus University,
Aarhus.
Page, W., D�Argent, G., 1997. A vegetation survey of Mauritius to
identify priority rain forest areas for conservation management.
Mauritian Wildlife Foundation, Port Louis.
Richards, G.C., 1995. A review of ecological interactions of fruit bats
in Australian ecosystems. Symposium of the Zoological Society of
London 67, 79–96.
Richardson, I.B.K., 1981. Ebenacees. In: Bosser, J., Cadet, T., Gueho,
J., Marais, W. (Eds.), Flore des Mascareignes, 117. The Sugar
Industry Research Institute, Reduit, pp. 1–19.
Safford, R.J., 1997. A survey of the occurrence of native vegetation
remnantsonMauritius in1993.BiologicalConservation80,181–188.
496 D.F. Nyhagen et al. / Biological Conservation 122 (2005) 491–497

Scott, A.J., 1990. Myrtacees. In: Bosser, J., Cadet, T., Gueho, J.,
Marais, W. (Eds.), Flore des Mascareignes, 92. The Sugar Industry
Research Institute, Reduit, pp. 1–70.
Shilton, L.A., Altringham, J.H., Compton, S.G., Whittaker, R.J.,
1999. Old World fruit bats can be long-distance seed dispersers
through extended retention of viable seeds in the gut.
Proceedings of the Royal Society of London Series B 266,
219–223.
Sleumer, H., Bosser, J., 1980. Flacourtiacees. In: Bosser, J., Cadet, T.,
Julien, H.R., Marais, W. (Eds.), Flore des Mascareignes, 42. The
Sugar Industry Research Institute, Reduit, pp. 1–26.
Strahm, W., 1996. Mascarene Islands – an introduction. Curtis�sBotanical Magazine 13, 182–185.
Tan, K.H., Zubaid, A., Kunz, T.H., 1998. Food habits of Cynopterus
brachyotis (Muller) (Chiroptera: Pteropodidae) in Peninsular
Malaysia. Journal of Tropical Ecology 14, 299–307.
Utzurrum, R.B., Heideman, P.D., 1991. Differential Ingestion of viable
vs nonviable Ficus seeds by fruit bats. Biotropica 23, 311–312.
Walter, K.S., Gillett, H.J. (Eds.), 1998. 1997 red list of threatened
plants. Compiled by the World Conservation Monitoring Centre,
IUCN – The World Conservation Union, Gland, Switzerland and
Cambridge, UK.
Wickens, G.E., 1990a. Combretacees. In: Bosser, J., Cadet, T., Gueho,
J., Marais, W. (Eds.), Flore des Mascareignes, 91. The Sugar
Industry Research Institute, Reduit, pp. 1–13.
Wickens, G.E., 1990b. Melastomatacees. In: Bosser, J., Cadet, T.,
Gueho, J., Marais, W. (Eds.), Flore des Mascareignes, 94. The
Sugar Industry Research Institute, Reduit, pp. 1–20.
Willson, M.F., Traveset, A., 2000. The ecology of seed dispersal. In:
Fenner, M. (Ed.), Seeds: The Ecology of Regeneration in Plant
Communities, 2nd ed. CABI Publishing, Wallingford, Oxon, pp.
85–110.
Wolton, R.J., Arak, P.A., Godfray, H.C.J., Wilson, R.P., 1982.
Ecological and behavioral studies of the Megachiroptera at Mount
Nimba, Liberia, with notes on Microchiroptera. Mammalia 46,
418–448.
D.F. Nyhagen et al. / Biological Conservation 122 (2005) 491–497 497