final thesis m kd
DESCRIPTION
ECGHHHTRANSCRIPT

A Long Term Wearable Electrocardiogram (ECG)
Measurement System
by
Margaret (Maggie) K. Delano
S.B., E.E., M.I.T. (2010)
Submitted to the Department of Electrical Engineering and ComputerScience
in partial fulfillment of the requirements for the degree of
Masters of Engineering in Electrical Engineering and ComputerScience
at the
MASSACHUSETTS INSTITUTE OF TECHNOLOGY
June 2012
© Margaret (Maggie) K. Delano, MMXII. All rights reserved.
The author hereby grants to MIT permission to reproduce anddistribute publicly paper and electronic copies of this thesis document
in whole or in part in any medium now known or hereafter created.
Author . . . . . . . . . . . . . . . . . . . . . . . . . . . . . . . . . . . . . . . . . . . . . . . . . . . . . . . . . . . . . .Department of Electrical Engineering and Computer Science
May 21, 2012
Certified by. . . . . . . . . . . . . . . . . . . . . . . . . . . . . . . . . . . . . . . . . . . . . . . . . . . . . . . . . .Dr. Charles G. Sodini
Clarence J. LeBel ProfessorThesis Supervisor
Accepted by . . . . . . . . . . . . . . . . . . . . . . . . . . . . . . . . . . . . . . . . . . . . . . . . . . . . . . . . .Prof. Dennis M. Freeman
Chairman, Masters of Engineering Thesis Committee

2

A Long Term Wearable Electrocardiogram (ECG)
Measurement System
by
Margaret (Maggie) K. Delano
Submitted to the Department of Electrical Engineering and Computer Scienceon May 21, 2012, in partial fulfillment of the
requirements for the degree ofMasters of Engineering in Electrical Engineering and Computer Science
Abstract
In this thesis, a low-power, wearable monitoring system was developed from discreteelectronic components and custom PCBs. The device was designed to maximizecomfort and minimize the footprint on the user. A single lead, clinical grade elec-trocardiogram (ECG), along with 3 axes of acceleration are recorded while a userwearing the device carries out his/her daily activities. The monitor itself consists ofa central PCB that contains an electrode and the majority of the electronics, alongwith either one or two additional electrodes that are connected to smaller electrodePCBs. The monitor can be configured such that any given electrode can act as aninput or an output. The system can record ECG and acceleration for over 1 weekand consumes 7.3 mW.
To confirm the quality of the ECG recorded by the device, a clinical test wasperformed. Individuals wore both the device discussed in this thesis and a clinicalECG recorder while engaging in physical activities such as sitting, standing, andrunning. Four participants have been tested at this time. QRS sensitivity and QRSpositive predictability were determined for each ECG trace. The cardiac monitoroutperformed the clinical recorder in all interventions. It should be a viable alternativeto conventional monitors. Additional participants will be tested as part of futurework.
Thesis Supervisor: Dr. Charles G. SodiniTitle: Clarence J. LeBel Professor
3

4

Acknowledgments
I would first like to thank Professor Charlie Sodini, my thesis supervisor, for his
support, mentorship and guidance throughout the MEng thesis. I look forward to
working with him over the next few years as I pursue further graduate studies. I
would also like to thank Eric Winokur, who was my UROP supervisor when I first
started working on this project. Eric helped me get up to speed on the project and
learn how to be an effective graduate student. It was his mentorship that helped
me make an effective transition to graduate life and decide to pursue the research
further. Collin Stultz and Thomas Heldt both provided a valuable perspective on
the underlying physiology as it interacts with my work. They both helped me make
sure I had the facts straight. David He, Sabino Pietrangelo, and Bruno Do Valle
helped me when I had questions about anything from system level design to which
microcontroller to use. I would also like to thank all the other members of our office
space, who provided a great environment to work in. Bryan Haslam, Cathy Ricciardi,
and Ankit Gordhandas were vital contributors to the clinical testing at MIT. It could
not have happened without them. I would also like to thank Texas Instruments and
Analog Devices, Inc. for the parts samples I used for the monitor. I would like to
thank all my friends and family for their support and encouragement over the past
school year. Last but certainly not least, I would like to thank my parents, Mark and
Maureen Delano. Although I don’t get to see them or call them as much as I should,
I know that they will support me in whatever I do.
5

6

Contents
1 Introduction 15
1.1 Motivation . . . . . . . . . . . . . . . . . . . . . . . . . . . . . . . . . 15
1.2 Objectives . . . . . . . . . . . . . . . . . . . . . . . . . . . . . . . . . 16
1.3 The Electrocardiogram . . . . . . . . . . . . . . . . . . . . . . . . . . 17
1.4 Using the Electrocardiogram . . . . . . . . . . . . . . . . . . . . . . . 22
1.5 Previous Work . . . . . . . . . . . . . . . . . . . . . . . . . . . . . . 24
2 Design 29
2.1 Electrical Specifications and Challenges . . . . . . . . . . . . . . . . . 29
2.1.1 ECG Signal Requirements . . . . . . . . . . . . . . . . . . . . 29
2.1.2 Accelerometer Signal Considerations . . . . . . . . . . . . . . 36
2.1.3 System Level Requirements . . . . . . . . . . . . . . . . . . . 36
2.2 Software Specifications and Challenges . . . . . . . . . . . . . . . . . 37
2.3 Mechanical Specifications and Challenges . . . . . . . . . . . . . . . . 38
3 Implementation 41
3.1 Final System Overview . . . . . . . . . . . . . . . . . . . . . . . . . . 41
3.1.1 Central Board . . . . . . . . . . . . . . . . . . . . . . . . . . . 42
3.1.2 Electrode boards . . . . . . . . . . . . . . . . . . . . . . . . . 43
3.1.3 Cardiac Monitor Placement . . . . . . . . . . . . . . . . . . . 43
3.2 Hardware . . . . . . . . . . . . . . . . . . . . . . . . . . . . . . . . . 45
3.2.1 Analog Front End . . . . . . . . . . . . . . . . . . . . . . . . . 47
3.2.2 Digital Back End . . . . . . . . . . . . . . . . . . . . . . . . . 49
7

3.2.3 Power Management Circuitry . . . . . . . . . . . . . . . . . . 51
3.3 Software . . . . . . . . . . . . . . . . . . . . . . . . . . . . . . . . . . 53
3.3.1 Final Algorithm . . . . . . . . . . . . . . . . . . . . . . . . . . 53
3.3.2 Allocate space and structures . . . . . . . . . . . . . . . . . . 53
3.3.3 Initializing the System . . . . . . . . . . . . . . . . . . . . . . 56
3.3.4 Checking the micro SD card . . . . . . . . . . . . . . . . . . . 58
3.3.5 Selecting the available flash memory . . . . . . . . . . . . . . 58
3.3.6 Sampling Timer Interrupt . . . . . . . . . . . . . . . . . . . . 59
3.3.7 Saving Data to Serial Flash . . . . . . . . . . . . . . . . . . . 60
3.3.8 Saving Data to micro SD . . . . . . . . . . . . . . . . . . . . . 61
3.3.9 Importing the data . . . . . . . . . . . . . . . . . . . . . . . . 61
3.4 Cardiac Monitor Specifications . . . . . . . . . . . . . . . . . . . . . . 62
3.4.1 ECG Specifications . . . . . . . . . . . . . . . . . . . . . . . . 62
3.4.2 Accelerometer Specifications . . . . . . . . . . . . . . . . . . . 63
3.4.3 System Specifications . . . . . . . . . . . . . . . . . . . . . . . 64
4 Clinical Test 67
4.1 Motivation . . . . . . . . . . . . . . . . . . . . . . . . . . . . . . . . . 67
4.1.1 ECG Signal Quality . . . . . . . . . . . . . . . . . . . . . . . 68
4.1.2 Comfort Level . . . . . . . . . . . . . . . . . . . . . . . . . . . 68
4.1.3 Activity Level . . . . . . . . . . . . . . . . . . . . . . . . . . . 68
4.1.4 Creating a Suite of Physiological Signals . . . . . . . . . . . . 68
4.2 Protocol . . . . . . . . . . . . . . . . . . . . . . . . . . . . . . . . . . 68
4.3 Analysis . . . . . . . . . . . . . . . . . . . . . . . . . . . . . . . . . . 71
4.3.1 Cardiac Monitor Signal Quality . . . . . . . . . . . . . . . . . 71
4.3.2 Cardiac Monitor Comfort Level . . . . . . . . . . . . . . . . . 73
4.4 Results . . . . . . . . . . . . . . . . . . . . . . . . . . . . . . . . . . . 73
4.4.1 Cardiac Monitor Signal Quality . . . . . . . . . . . . . . . . . 73
4.4.2 Cardiac Monitor Comfort Level . . . . . . . . . . . . . . . . . 74
4.4.3 Summary . . . . . . . . . . . . . . . . . . . . . . . . . . . . . 75
8

5 Conclusions 77
5.1 Discussion . . . . . . . . . . . . . . . . . . . . . . . . . . . . . . . . . 77
5.2 Future Work . . . . . . . . . . . . . . . . . . . . . . . . . . . . . . . . 79
5.3 Summary . . . . . . . . . . . . . . . . . . . . . . . . . . . . . . . . . 80
A Micro SD Code 81
A.1 Micro SD Card Header File . . . . . . . . . . . . . . . . . . . . . . . 81
A.2 Micro SD .C File . . . . . . . . . . . . . . . . . . . . . . . . . . . . . 84
9

10

List of Figures
1-1 The ECG waveform . . . . . . . . . . . . . . . . . . . . . . . . . . . . 18
1-2 12 Lead ECG . . . . . . . . . . . . . . . . . . . . . . . . . . . . . . . 19
1-3 Einthoven’s Triangle . . . . . . . . . . . . . . . . . . . . . . . . . . . 20
1-4 The Frontal Axis . . . . . . . . . . . . . . . . . . . . . . . . . . . . . 21
1-5 Precordial Electrode Placement . . . . . . . . . . . . . . . . . . . . . 21
1-6 Dynamic Time Warping . . . . . . . . . . . . . . . . . . . . . . . . . 23
1-7 A Holter Monitor . . . . . . . . . . . . . . . . . . . . . . . . . . . . . 23
1-8 The Netguard Device . . . . . . . . . . . . . . . . . . . . . . . . . . . 24
1-9 The V Patch . . . . . . . . . . . . . . . . . . . . . . . . . . . . . . . . 25
1-10 The IMEC Patch . . . . . . . . . . . . . . . . . . . . . . . . . . . . . 26
1-11 Wearable ECG Patch dimensions . . . . . . . . . . . . . . . . . . . . 27
2-1 Three Electrode Placement . . . . . . . . . . . . . . . . . . . . . . . . 31
2-2 Two Electrode Placement . . . . . . . . . . . . . . . . . . . . . . . . 32
2-3 The Instrumentation Amplifier . . . . . . . . . . . . . . . . . . . . . . 34
2-4 Displacement Currents . . . . . . . . . . . . . . . . . . . . . . . . . . 34
2-5 A Right Leg Drive Circuit . . . . . . . . . . . . . . . . . . . . . . . . 35
2-6 Wearable ECG Patch on subject . . . . . . . . . . . . . . . . . . . . . 39
3-1 Three Electrode Wearable, Long Term Cardiac Monitor . . . . . . . . 42
3-2 The Central Board . . . . . . . . . . . . . . . . . . . . . . . . . . . . 43
3-3 The Electrode Board . . . . . . . . . . . . . . . . . . . . . . . . . . . 44
3-4 Electrode Board as Input . . . . . . . . . . . . . . . . . . . . . . . . . 44
3-5 Electrode Board as Output . . . . . . . . . . . . . . . . . . . . . . . . 44
11

3-6 Three Electrode Cardiac Monitor Worn . . . . . . . . . . . . . . . . . 45
3-7 Two Electrode Cardiac Monitor Worn . . . . . . . . . . . . . . . . . 46
3-8 Monitor Worn Under Shirt . . . . . . . . . . . . . . . . . . . . . . . . 46
3-9 Block Diagram of Overall System . . . . . . . . . . . . . . . . . . . . 47
3-10 Analog Front End . . . . . . . . . . . . . . . . . . . . . . . . . . . . . 48
3-11 Three Electrode Board With Battery . . . . . . . . . . . . . . . . . . 52
3-12 Final Algorithm Flowchart . . . . . . . . . . . . . . . . . . . . . . . . 54
3-13 An Example Flash Block . . . . . . . . . . . . . . . . . . . . . . . . . 60
3-14 Saving to Flash . . . . . . . . . . . . . . . . . . . . . . . . . . . . . . 61
4-1 Participant Ready for Testing . . . . . . . . . . . . . . . . . . . . . . 69
4-2 Sequence of Interventions . . . . . . . . . . . . . . . . . . . . . . . . . 70
4-3 Recording Times . . . . . . . . . . . . . . . . . . . . . . . . . . . . . 70
4-4 Participant on treadmill . . . . . . . . . . . . . . . . . . . . . . . . . 71
4-5 ECG While Running . . . . . . . . . . . . . . . . . . . . . . . . . . . 75
4-6 ECG While Standing . . . . . . . . . . . . . . . . . . . . . . . . . . . 76
4-7 ECG While Supine . . . . . . . . . . . . . . . . . . . . . . . . . . . . 76
5-1 First Revision of Electrode Board . . . . . . . . . . . . . . . . . . . . 78
12

List of Tables
1.1 Existing device specifications . . . . . . . . . . . . . . . . . . . . . . . 26
2.1 ECG Signal Quality Requirements . . . . . . . . . . . . . . . . . . . . 30
2.2 Accelerometer Signal Quality Requirements . . . . . . . . . . . . . . 36
2.3 Overall system specifications . . . . . . . . . . . . . . . . . . . . . . . 37
3.1 GPIO configuration . . . . . . . . . . . . . . . . . . . . . . . . . . . . 56
3.2 GPIO descriptions . . . . . . . . . . . . . . . . . . . . . . . . . . . . 57
3.3 ECG Signal Quality Requirements and Measurements . . . . . . . . . 62
3.4 ECG Signal Quality Specifications by Design . . . . . . . . . . . . . . 62
3.5 Accelerometer Signal Quality Requirements . . . . . . . . . . . . . . 63
3.6 Overall system specifications . . . . . . . . . . . . . . . . . . . . . . . 64
3.7 Current Dissipation . . . . . . . . . . . . . . . . . . . . . . . . . . . . 64
3.8 Write/ Read Times . . . . . . . . . . . . . . . . . . . . . . . . . . . . 65
4.1 QRS Sensitivity and Positive Predictivity . . . . . . . . . . . . . . . . 74
13

14

Chapter 1
Introduction
A wearable, long term cardiac monitor has been developed. In this chapter, the
motivation behind wearable monitors will be presented. Specific objectives of this
thesis will be described, along with previous work in the field.
1.1 Motivation
Cardiovascular disease is the leading cause of death in the United States, accounting
for 32.8% of total deaths in the United States in 2008 [1]. The United States spent al-
most $300 billion on the direct and indirect costs of cardiovascular disease and stroke.
Although the rate of death attributable to cardiovascular disease has declined 30.6%
since 1999, the prevalence of traditional risk factors such as hypertension, obesity and
smoking remains an issue. As the United States population ages, enormous pressure
is being placed on the health care delivery system to maintain quality of care while
reducing overall costs. The current quality of care can only be maintained if the
health care delivery system becomes significantly more efficient.
One way to reduce costs associated with health services while maintaining quality
of care is to provide systems that monitor an individual as they go about their daily
activities, reducing the number of doctor’s visits required. Physicians can use these
systems to monitor individuals recovering from an existing cardiac condition, those
at risk, and those experiencing cardiac discomfort. Monitoring an individual at home
15

and over longer periods of time can help a physician track disease progression. Earlier
detection of a disease state can then lead to earlier intervention and treatment. In
addition to monitoring disease progression, physiological monitoring on a day-to-day
basis can help establish normal physiology for an individual and can provide feedback
for more targeted treatments.
Recent studies suggest that risk of death in patients who have suffered heart
attacks can be predicted using the electrocardiogram (ECG) [2] [3]. These studies
analyzed up to 24 hours of continuous ECG data from patients in their hospital beds.
They developed computational methods that analyze the similarity of neighboring
heart beats and used these methods to predict whether a patient would live or die.
These studies are currently limited to data taken from individuals who have already
had a cardiac event and whose ECG is recorded shortly thereafter the event while
they are recovering. Collecting long term ECG data from both patients with existing
cardiovascular conditions and those at risk individuals may help further development
of these risk stratification methods. Additionally, collecting long term ECG data
along with an estimate of activity level (such as from an accelerometer) while an
individual carries out his or her daily activities may give a physician a better estimate
of that individual’s cardiac health than ECG alone.
1.2 Objectives
The goal of this thesis is to develop and validate a wearable, long term cardiac moni-
tor. The system should be able to record ECG and acceleration data continuously for
at least one week. It must be able to withstand every day physical activity and be as
comfortable and unobtrusive as possible. The device must perform on par or better
than the devices that exist today. It could then be used as an alternative to clinically
available monitors, but would have a much smaller form factor and fewer wires. The
monitor can be used to collect data from patients who have suffered a cardiac event
and those at risk as they go about their daily activities. This will allow physicians
to track disease progression and allow researchers to develop methods to predict and
16

prevent serious cardiac events.
The cardiac monitor will be validated in a clinical test conducted at the Clinical
Research Center (CRC) at MIT. Healthy individuals will perform a series of different
interventions while wearing both the monitor developed in this thesis and a commer-
cially available monitor. Interventions will include activities ranging from lying down
to running in order to simulate what wearing the monitor throughout the day would
be like. The cardiac monitor will be validated if it performs as well (if not better)
than the commercially available monitor and is able to withstand every day activity
while being both reasonably comfortable and unobtrusive.
1.3 The Electrocardiogram
Before discussing previous work in wearable heart monitor technology, it is important
to understand the basics of the electrocardiogram (ECG) itself. The ECG has become
a routine part of any complete medical evaluation and has been used as a diagnostic
test since its discovery over 70 years ago [4]. Because electricity is conducted through
the heart muscle (known as the myocardium), many (but not all) types of damage
to the heart tissue can be detected with an ECG. The ECG waveform allows one to
infer information about electrical activity associated with different aspects of a heart
beat and is therefore of particular value for assessing an individual’s cardiac rhythm
and heart health.
A normal cardiac rhythm is referred to as a “sinus” rhythm because of its orig-
ination in the sinoatrial node (S-A node). Disruptions of this normal sinus rhythm
are known as arrhythmias. Each heart beat is triggered by “pacemaker” cells in the
S-A node. These cells generate action potentials at 60 – 100 beats per minute (while
at rest). Action potentials depolarize the tissue as they propagate throughout the
myocardium in a predefined way, causing muscle tissue to contract. After the action
potentials leave the S-A node, they depolarize the two upper chambers of the heart
known as the atria, and then move to the atrioventricular node (A-V node). This
node sits between the atria and the lower two chambers of the heart known as the
17

ventricles. It acts as a backup pacemaker at a lower rate of 40 – 60 beats per minute.
The A-V node also delays the electrical impulses, slowing them down by about 120
ms to give the atria enough time to eject their blood into the ventricles before the
ventricles contract. After the action potentials leave the A-V node, they move to an
area known as the “His” bundle and down the left and right bundle branches. Con-
ductive fibers known as Purkinje fibers depolarize the ventricles, starting from the
left ventricle and swinging to the right. After the ventricles have been depolarized
and contract, the cycle starts over with another impulse from the S-A node.
Figure 1-1: An ECG waveform is composed of action potentials originating in differentareas of the heart. The ECG waveform recorded at the skin is the superposition ofthese different action potentials. Source: [5]
The ECG represents the electrical activity of an ensemble of cells in the my-
ocardium. It is a differential measurement across the surface of the body and can be
thought of as a vector measurement of electrical potential. A typical ECG waveform
(as shown on the right side of Figure 1-1) consists of three primary features: the P
wave, the QRS complex, and the T wave. Each wave corresponds to the electrical
18

activity in specific parts of the heart. The P wave comes first and represents the
depolarization of the atria. The delay between the P wave and the QRS complex is
known as the PR interval. This interval signifies the delay that occurs in the A-V
node that gives the atria time to contract before depolarizing the ventricles. The
QRS complex represents depolarization of the ventricles, and is usually the strongest
wave in an ECG. The last wave is the T wave and it represents the repolarization of
the ventricles. The repolarization of the atria is usually hidden in the QRS complex.
Taking a differential measurement of the electrical potential on the body surface at
different locations generates different ECG vectors. A standard clinical ECG consists
of 12 different vectors known as “leads.” Six of these leads are in the plane parallel to
the body and are known as “frontal” ECG leads. The other six ECG leads are views
of the heart in the plane perpendicular to the body and are known as “pre-cordial”
leads. A view of all 12 ECG leads can be seen in Figure 1-2.
Figure 1-2: A vector view of the standard 12 Lead ECG. The frontal leads are lightblue and the pre-cordial leads are dark blue. Source: [6]
The frontal ECG leads are formed from three different electrodes placed on the
body, with an optional fourth electrode used as a reference. These electrodes are
usually placed on the right arm (RA), left arm (LA), and left leg (LL). The optional
reference electrode is usually placed on the right leg (RL). The three sensing electrodes
(RA, LA, and LL) form what is known as Einthoven’s triangle (see Figure 1-3). The
19

six frontal leads are derived from this triangle. Leads I, II and III are formed directly
from the triangle itself. An additional three leads, known as the augmented limb
leads (augmented foot, augmented right, augmented left) are formed by subtracting
the average of two electrode potentials from the value of the third. These leads are
known as augmented leads because their amplitude is 1.5 times the amplitude of the
frontal leads. Each lead is derived from one of the three sensing electrodes using the
equations provided in Equation Array 1.1. The vector representation of each frontal
lead is shown in Figure 1-4.
Figure 1-3: Einthoven’s triangle, formed by the right arm, left arm and left legelectrodes. These three electrodes form the basis for the frontal axis. Source: [7]
I = LA−RA (1.1)
II = LL−RA (1.2)
III = LL− LA (1.3)
aV F = LL− 1
2(LA+RA) (1.4)
aV R = RA− 1
2(LA+ LL) (1.5)
aV L = LA− 1
2(RA+ LL) (1.6)
The remaining six leads of the 12 lead system are the pre-cordial leads. The
electrodes V1–V6 are placed on the chest as demonstrated by Figure 1-5. The lead is
20

Figure 1-4: The frontal axis of the ECG consists of six vectors derived from threeelectrodes: left arm (L), right arm (R), and left leg (F). Source: [7]
the difference between the potential at the electrode site and the average potential of
RA, LA and LL. This can be thought of as the difference between the center of the
body and the pre-cordial electrode, which creates a vector perpendicular to the body.
Figure 1-5: The electrodes V1–V6 are placed on the chest roughly in a line. Source:[7]
21

1.4 Using the Electrocardiogram
When using the ECG to assess heart health, the 12 lead ECG is the clinical standard.
The combination of 12 different leads gives the physician a view of the heart’s electrical
activity from a variety of different views. Although 12 lead ECG is standard, it is not
always required. Detecting an arrhythmia, for example, only requires one ECG lead,
so long as that lead has a good view of the different ECG waves. When analyzing
an ECG lead for arrhythmias, there are three important steps [4]. The first step is
to find the QRS complexes and examine their rate, regularity and shape. The next
step is to find the P waves, check if each P wave corresponds to a QRS complex,
examine their shape and check for anything else irregular about their pattern. Most
arrhythmias can be identified using this information.
The risk stratification method known as Morphology Variability can also be per-
formed using a single ECG lead [2] [3]. This method uses the ECG and compares
adjacent beats. It is interested in small differences between the two beats that are
often undetectable by the naked eye. These small differences can change over time.
Because two neighboring beats are not identical, dynamic time warping is used to
compare the correct parts of each beat (see Figure 1-6). Morphology Variability was
shown to be higher in those who died after cardiac events than in those who did not
[2]. Additionally, it provides information about the patient that is uncorrelated with
other risk stratification methods [3].
It is useful to be able to record an ECG while an individual is carrying out his/her
daily activities. To record ECG in this ambulatory setting, wearable cardiac monitors
are used. When an individual is having heart problems or discomfort (especially if the
origin of which cannot be determined from a routine checkup), a physician often has
the individual wear a device known as a Holter monitor for 24 – 48 hours [8] (see Figure
1-7). A typical Holter monitor measures one or more ECG leads using electrodes
placed on the chest. The electrodes are connected to wires that are connected to a
central processing unit, usually worn on a belt or in a pocket. Although in wide use
today, there are a number of shortcomings with a standard Holter monitor. First, the
22

Figure 1-6: Dynamic Time Warping as applied in [2] [3]. Vertical lines connectcorresponding samples between the two beats. If samples taken at equally spacedintervals from the beginning, different parts of the beats could be compared. Dynamictime warping forces similar parts of the two waveforms to be compared. Source: [2]
wires that attach to the electrodes can be a significant noise source, especially during
higher levels of physical activity such as walking or running. They are cumbersome
to wear and can be inadvertently detached if pulled. With many Holter monitor
implementations, even if the device is worn continuously, only small subsets of the
data is clean enough for use [3]. Additionally, although some newer Holter monitors
can record data for up to 1 week [9], patients can have arrhythmias that occur once
every ten days to one month that are not recorded by the Holter monitor.
Figure 1-7: A patient wearing a Holter Monitor. Source: [10]
To capture events that occur less frequently, patients can be fitted with devices
known as event monitors, which can be worn for a month or longer [11]. However,
event monitors typically only save ECG data around the irregular cardiac episode,
23

which minimizes the amount of analysis that can be performed. Continuous long-term
data allows the clinician to detect overall heart health trends and possibly see initial
markers before the cardiac irregularity occurs [12]. Longer term ECG recordings can
be used both to develop new risk biomarkers and stratify risk of individual patients
[2] [3].
1.5 Previous Work
Several groups have worked on wearable monitors to improve the form factor of wear-
able monitors and increase patient compliance [13] [14]. In this section, a few note-
worthy examples will be discussed. The first such device is the Netguard, developed
by Mindray (see Figure 1-8). The Netguard is a small device that takes a single ECG
lead using two custom electrodes worn at the chest as demonstrated in Figure 1-8. It
is designed for in hospital use and has a wireless ECG monitor that weighs less than
an ounce and communicates with a standard PC at a nurse’s station. The device
can detect asystole (when the heart stops beating) and ventricular fibrillation (when
the ventricles contract in a rapid and uncontrollable way). When a dangerous car-
diac rhythm is detected, an alert is sounded and an ECG display with the dangerous
rhythm is displayed. The nurse can confirm the alert and call an emergency as per
hospital protocol.
Figure 1-8: The Netguard device developed by mindray. Source: [15]
One of the benefits of the Netguard is that it costs a fraction of that of conventional
monitors. Having such a device on all patients in a ward can help reduce a hospital’s
24

potential exposure to liability from incidents that occur to unmonitored patients that
could otherwise have been prevented. However, a limitation of the work is that
the Netguard only works so long as the individual is in range of its base station.
Additionally, once a patient has been admitted to the hospital, it is likely that a full
12 lead ECG would be taken, thus making the Netguard device redundant.
The V patch from Intelesens is similar to the Netguard, but can be used in an
ambulatory setting. The patient wears a device (shown in Figure 1-9) that connects to
electrodes worn at the chest. ECG is monitored continuously and events detected by
the system are transmitted to a base station. From the base station, data is uploaded
to a web-based interface that can be accessed by the physician. The V patch can
automatically detect a number of the most commonly occurring arrhythmias, but
will also respond to a patient alarm button.
Figure 1-9: The V patch device developed by Intelesens. Source [16]
A major benefit of the V patch device is that it can be worn for a week before
recharging. Additionally, the patient wearing the device can go about their daily life
while wearing the device. The patch is designed to minimize the use of wires and
dramatically reduces the effects of motion artifacts. A downside of this device is that
it requires a somewhat bulky base station worn in the patient’s pocket to connect to
the internet.
IMEC (Belgium) has announced the release of a promising ECG device. This
patch will be worn at the chest and can measure three ECG leads (see Figure 1-10).
25

The patch measures heart rate on board and also has a 3 axis accelerometer. The
system on a chip design and Bluetooth low energy radio enables the device to last up
to one month with a 200 mAH battery.
Figure 1-10: The wireless ECG patch developed by IMEC. Source: [17]
One of the advantages of the IMEC patch is that it uses Bluetooth low energy to
transmit its data. While requiring a base station is not ideal, it’s more likely that
a user would already have an existing Bluetooth enabled device and would not have
to carry an additional one with them. However, the IMEC device is limited in that
it does not transmit raw ECG data. It extracts relevant information from the ECG
waveform (heart rate, along with onset, peak and offset of the P, QRS, and T waves).
While this would allow adequate reconstruction of the basic features of the ECG wave
form, this alone would not allow a physician to view the morphology of the waveform.
Specification Netguard V patch IMEC patchBattery Life ? 7 days 1 month
Leads 1 3 3Data Transmitted Events Events Events, Heart Rate, Features
Detectable Arrhythmias 2 types 10 types ?
Table 1.1: Comparison of specifications of existing devices.
The monitors described above are all limited in similar ways. While they improve
on the Holter monitor form factor by reducing the number of wires, they only transmit
26

information about specific cardiac events, or limited information such as heart rate.
Additionally, they all rely on transmitting data to a base station, which limits their
effectiveness when a cell phone or computer is not nearby, and requires the user to
have an additional device with them at all times. This thesis aims to develop a
device that can save high quality ECG data continuously for up to one week, without
requiring the use of a base station.
A first generation of the cardiac monitor was developed prior to the start of the
device presented in this thesis. The first generation device, known as “the patch,”
was fabricated on a flexible PCB and was designed to be completely free of wires (see
Figure 1-11). Different ECG leads (I, II, III or aVF) can be used by selecting three of
the appropriate electrodes as a +/- input or a ground drive. The patch was validated
in a clinical study at the Clinical Research Center (CRC) at MIT. The performance of
the patch was compared with that of a Criticare 504-US ECG recorder with electrodes
placed adjacent to the active patch electrodes.
Figure 1-11: Board dimensions on the wearable ECG patch developed by EricWinokur of the Sodini Group. Photo credit: David He
Overall, the patch performed as well (if not better) than the Criticare monitor.
However, there were a few areas in which the patch could be improved. Specifically,
27

improvements in mechanical reliability and memory capacity can be made. Because
the patch was designed on a single flexible PCB, the board was constrained to move
as one piece, often resulting in broken solder connections that caused the board to
malfunction. Because of limited memory capacity on the patch (128 Mb), the total
possible test duration was less than one day.
In the next several chapters, implementation of a new wearable, long term cardiac
monitor will be presented. In Chapter 2, design requirements and considerations for
developing such a device will be discussed. Implementation of the final prototype
device is described in Chapter 3. Chapter 4 will describe a clinical test that was
conducted to validate the wearable cardiac monitor, along with some preliminary
results. Finally, Chapter 5 will discuss what has been learned from this thesis, along
with future work that will be carried out after this thesis has been submitted.
28

Chapter 2
Design
In the previous chapter, motivation for a wearable, long term cardiac monitor was
presented. This chapter will discuss the design considerations for implementing such a
system. It will outline considerations in three different categories: electrical, software,
and mechanical. Relevant design decisions and background will be discussed.
2.1 Electrical Specifications and Challenges
Electrical considerations for the cardiac monitor are driven by its use model. It must
perform at least as well as commercially available devices, with a small and comfort-
able form factor. It must be able to record ECG and acceleration data continuously
for at least one week.
2.1.1 ECG Signal Requirements
A summary of the electrical specifications relating to ECG signal quality are presented
in Table 2.1. The minimum requirements for the system, along with the desired target
specifications are listed. In the paragraphs below, each specification will be discussed
in detail.
29

Specification Minimum TargetLeads 1 1
Electrodes 2–3 2–3Bandwidth 0.5 – 40+ Hz 0.5 – 100 Hz
Input Referred Noise < 30 µV < 20 µVGain 100–1000+ 100–1700+
ADC Resolution 8+ bits 12 bitsCMRR (@ 60 Hz) 40+ dB 90+ dB
Table 2.1: ECG Signal Quality Requirements
Leads
The cardiac monitor needs to be as unobtrusive as possible. It should have a small
form factor with as few electrodes as possible while maintaining signal integrity. The
device will be used for general monitoring and basic arrhythmia analysis. Individuals
with existing heart conditions can wear the device to give their physician a better
idea of their baseline physiology. Those suspected of having an arrhythmia or other
problem can wear the monitor for longer periods of time (eg. 1 day to 1 week) to help
their physician diagnose a condition that occurs infrequently. For this use model, a
single lead with a good view of the cardiac axis will suffice. Leads I and II both satisfy
this requirement and were selected as the two desired leads for the cardiac monitor.
Electrode Number and Placement
Although only 2 electrodes are required to take a single ECG lead, a third reference
electrode is often used to set the body to a common potential. A 2 electrode imple-
mentation has the advantage that it minimizes the footprint on the user. However,
a 3 electrode implementation has the advantage that it is more robust to noise and
has more options for lead selection. Both possibilities are explored in this thesis.
To obtain a Lead I or Lead II, there are a few different options for electrode place-
ment. In the three electrode configuration, any two electrodes can form a vector with
the third electrode as the reference, so up to three unique vectors can be selected
from the three electrodes. The three electrode monitor, if worn in the configuration
shown in 2-1a, for example, would allow a Lead I, Lead II or Lead III to be selected.
30
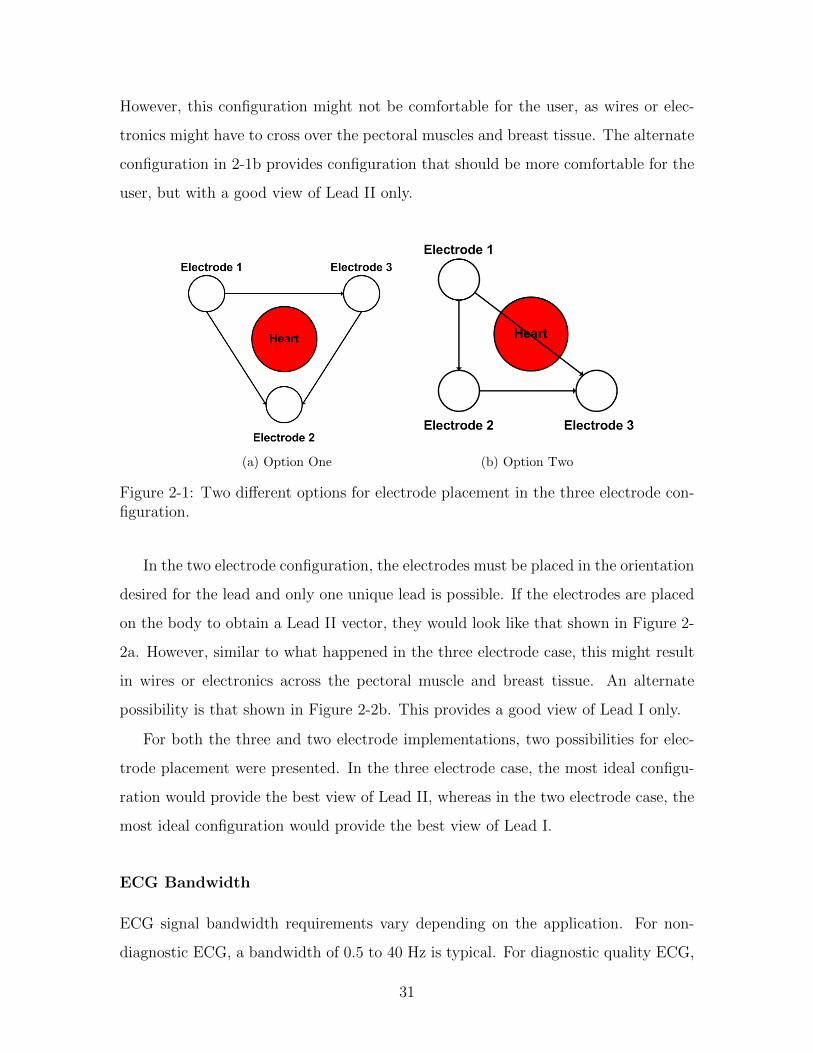
However, this configuration might not be comfortable for the user, as wires or elec-
tronics might have to cross over the pectoral muscles and breast tissue. The alternate
configuration in 2-1b provides configuration that should be more comfortable for the
user, but with a good view of Lead II only.
(a) Option One (b) Option Two
Figure 2-1: Two different options for electrode placement in the three electrode con-figuration.
In the two electrode configuration, the electrodes must be placed in the orientation
desired for the lead and only one unique lead is possible. If the electrodes are placed
on the body to obtain a Lead II vector, they would look like that shown in Figure 2-
2a. However, similar to what happened in the three electrode case, this might result
in wires or electronics across the pectoral muscle and breast tissue. An alternate
possibility is that shown in Figure 2-2b. This provides a good view of Lead I only.
For both the three and two electrode implementations, two possibilities for elec-
trode placement were presented. In the three electrode case, the most ideal configu-
ration would provide the best view of Lead II, whereas in the two electrode case, the
most ideal configuration would provide the best view of Lead I.
ECG Bandwidth
ECG signal bandwidth requirements vary depending on the application. For non-
diagnostic ECG, a bandwidth of 0.5 to 40 Hz is typical. For diagnostic quality ECG,
31

(a) Option One (b) Option Two
Figure 2-2: Two different options for electrode placement in the two electrode con-figuration.
the bandwidth must be at least 0.05 to 150 Hz. A lower high-pass frequency is
required in diagnostic quality ECG to allow accurate ST segments to be recorded.
The ST segment is not as relevant for arrhythmia analysis, so a non-diagnostic ECG
bandwidth can be used. The higher high-pass frequency in non-diagnostic ECG helps
reduce baseline drift and is preferred for use with monitoring devices. The high-pass
frequency of the monitor will be set to 0.5 Hz, and the low-pass frequency will be set
to 125 Hz.
Noise and Gain
In a typical ECG, the P wave is the smallest feature of interest. A typical P wave
has an amplitude of 200 – 300 µV. The input referred noise should be much lower
than 200 µVrms for detection of the P wave. It is typically specified to be less than
30 µVrms. A typical QRS complex is the largest feature of interest and can have
an amplitude of 2 mV or greater. This value sets the upper bound on the overall
system gain. The amplitudes of these waves varies person to person. A system with
variable gain is needed to account for potential differences between the amplitude of
different individuals’ biosignals. Gains ranging from 100 to 1000 will provide adequate
amplification for signals as large as tens of millivolts and as small as hundreds of
microvolts.
32

ADC Resolution
The bandwidth, noise and gain specifications have now been set. The next consid-
eration is the ADC resolution. As an example, consider a single supply system at
2.5 V with an 8 bit ADC. An ECG with a QRS complex of 2 mV, and a P-wave of
200 µV is the input to the system. A gain of 400 would result in a QRS complex of
800 mV and a P-wave of 80 mV. This results in about 3 bits of resolution for the
P-wave. However, from experience with a previous iteration of the cardiac monitor,
an ADC resolution of 8 bits resulted in a small but noticeable amount of quantization
error. Greater than 8 bits of resolution (with sufficient gain) will meet the signal
requirements. The target ADC resolution is set to 12 bits.
CMRR
The ECG is a differential measurement between two electrodes. Because the signal
amplitude is on the order of millivolts or less, an amplifier with high differential gain
is required. The most common topology used for ECG and other biopotentials is the
Instrumentation Amplifier (IA). The IA is a differential operational amplifier with
input buffers connected in a resistor totem pole (see Figure 2-3). The differential
gain of the circuit is avd = 1 +(
2R1
Rgain
)R3
R2. Connecting Rgain in the method shown
increases the differential gain of the first stage of the circuit while maintaining a
common mode gain close to one. This gives the circuit a high CMRR. CMRRs of
greater than 90 dB are common in IC implementations of the IA.
Reducing Interference in ECG
Although an IA has a high CMRR, large potential differences between the body
and the system common can result in common mode voltages outside the IA’s input
range. Additionally, 60 Hz interference from electronic devices can be converted into
a differential signal that cannot be eliminated even with an infinitely high CMRR.
60 Hz interference is most often caused by an impedance mismatch between the two
sensing electrodes [19]. If powerline interference capacitively couples onto electrode
33

Figure 2-3: A block diagram view of an instrumentation amplifier. Source: [18]
Figure 2-4: Displacement currents when measuring ECG can cause a differentialvoltage difference at the IA if Z1I1 6= Z2I2. Either an impedance mismatch or adisplacement current mismatch can cause this differential voltage.
leads, displacement currents are induced. A mismatch in electrode impedance can
result in differential voltages at the amplifier inputs (see Figure 2-4). Common mode
voltages can also be converted to differential voltages by the “potential divider effect”
[20].
There are three common ways to reduce the effect of large common mode voltages
and 60 Hz interference. The first method uses a third electrode, while the second
method uses capacitive coupling and filtering. The third method can be used in
conjunction with either the first or the second method and involves actively buffering
the biosignal at the electrode site.
The first method to reduce common mode voltages and 60 Hz interference involves
a circuit known as a driven right leg (DRL) circuit [21]. This circuit takes a standard
34
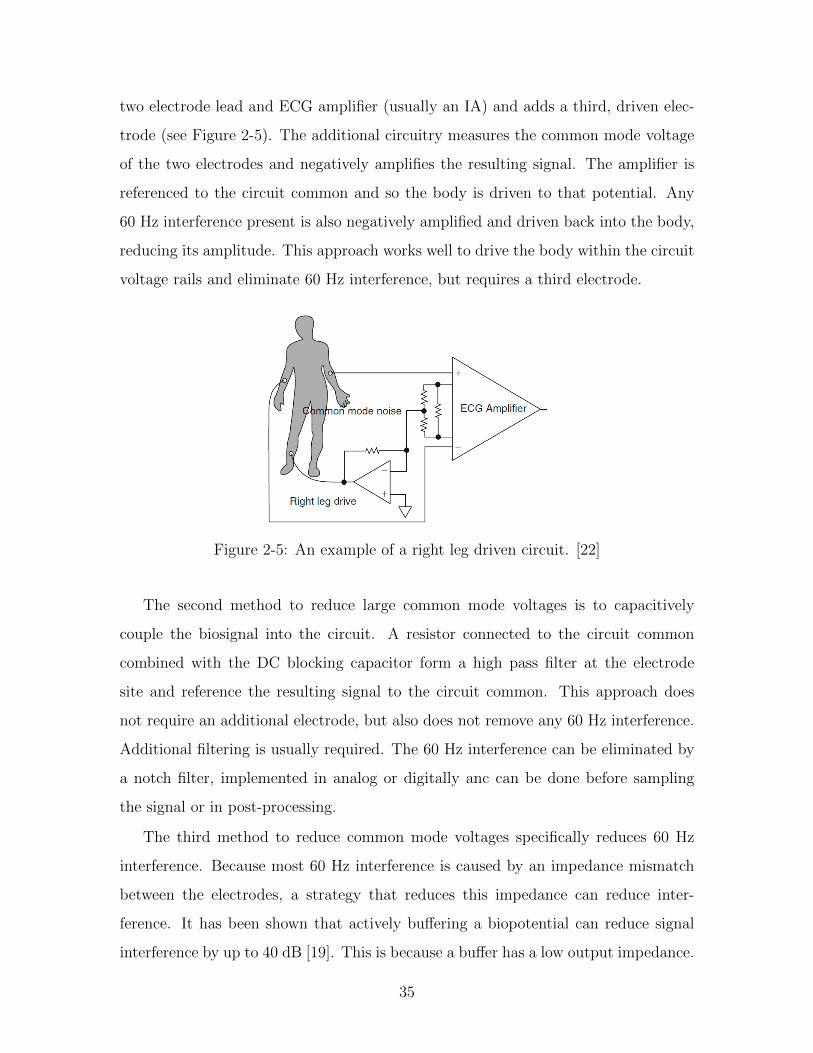
two electrode lead and ECG amplifier (usually an IA) and adds a third, driven elec-
trode (see Figure 2-5). The additional circuitry measures the common mode voltage
of the two electrodes and negatively amplifies the resulting signal. The amplifier is
referenced to the circuit common and so the body is driven to that potential. Any
60 Hz interference present is also negatively amplified and driven back into the body,
reducing its amplitude. This approach works well to drive the body within the circuit
voltage rails and eliminate 60 Hz interference, but requires a third electrode.
Figure 2-5: An example of a right leg driven circuit. [22]
The second method to reduce large common mode voltages is to capacitively
couple the biosignal into the circuit. A resistor connected to the circuit common
combined with the DC blocking capacitor form a high pass filter at the electrode
site and reference the resulting signal to the circuit common. This approach does
not require an additional electrode, but also does not remove any 60 Hz interference.
Additional filtering is usually required. The 60 Hz interference can be eliminated by
a notch filter, implemented in analog or digitally anc can be done before sampling
the signal or in post-processing.
The third method to reduce common mode voltages specifically reduces 60 Hz
interference. Because most 60 Hz interference is caused by an impedance mismatch
between the electrodes, a strategy that reduces this impedance can reduce inter-
ference. It has been shown that actively buffering a biopotential can reduce signal
interference by up to 40 dB [19]. This is because a buffer has a low output impedance.
35

When placed right at the electrode site, the biopotential becomes a low impedance
signal. With a lower impedance for each electrode, the difference between the two
electrode impedances is also reduced. Actively buffering the electrode site can be
used in combination with both the first and second methods described above.
2.1.2 Accelerometer Signal Considerations
Signal requirements for the accelerometer are not as constrained as that of the ECG.
The most important considerations are the acceleration range, resolution, and sample
rate. To determine a reasonable acceleration range, a prototype board with an ac-
celerometer was worn while an individual tried to generate large accelerations (such
as by jumping up and down and running). Acceleration values were usually within
± 4g, so that should be sufficient for obtaining the full range of accelerations. How-
ever, in practice, the accelerometer on the cardiac monitor (ADXL346) has a range
vs resolution scheme such that a ± 8g range can be obtained with the same LSB
value as with ± 4g range. At ± 8g, the ADXL346 has a full resolution of 12 bits. In
a previous iteration of the cardiac monitor, acceleration was recorded at both 2 Hz
and 250 Hz. While 250 Hz was clearly oversampled, 2 Hz may have been too low. As
a compromise, a sample rate of 12.5 Hz was selected.
Specification Minimum TargetRange ± 4g ± 8g
Resolution 8 bits 12 bitsSample rate 2 Hz 12.5 Hz
Table 2.2: Accelerometer Signal Quality Requirements
2.1.3 System Level Requirements
A summary of the desired system specifications are listed in Table 2.3. Both minimum
and desired specifications are listed. Further details of each specification are provided
below.
The signal requirements and use model for the cardiac monitor provide system
36

Specification Minimum TargetTest duration 24 hours 1+ weeks
Memory 128 MB 1+ GBPower dissipation < 9.7 mW < 9.7 mW
Table 2.3: Overall system specifications
level electrical requirements. To meet the bandwidth requirement, the ECG is sam-
pled at 250 Hz. The accelerometer is sampled at 12.5 Hz. Allocating 2 bytes per
sample, (250 + 3 ∗ 12.5) ∗ 2 = 575 bytes of data are generated each second, and about
2 MB in an hour. To record for a full week, over 300 MB of space is required (not
including overhead). The data can either be saved on board or transmitted to a base
station and/or cell phone. Because the device needs to be able to sample continu-
ously and last at least one week, while maintaining a small footprint on the user, data
was saved on board. Transmitting the data to a base station / cell phone is power
intensive to do continuously and also requires the user to wear an additional device
or be located near a base station at all times.
Because all data will be stored on board, high density memory must be used. A
micro SD card, commonly used in devices such as cameras, is well suited to this task.
However, writing to a micro SD card requires high write currents and takes on the
order of several hundred milliseconds. Most low power microcontrollers have low on
board memory, so the system must have adequate space on the microcontroller or use
an additional memory source for buffering the data. For a test duration of at least
one week, a battery with several hundred milliamp hours is required. A 600 mAH
battery, for example, could support an average current of 9.7 mW for up to one week
at a supply voltage of 2.7 V.
2.2 Software Specifications and Challenges
The software requirements for the cardiac monitor are straightforward. The software
must be able to sample the ECG and accelerometer waveforms continuously at 250 Hz
and 12.5 Hz, respectively. Data must be sampled and saved continuously. Addition-
37

ally, the software should be able to control the system to keep the power consumption
as low as possible. A low power microcontroller is best suited to this task. The mi-
crocontroller must have enough communication ports for all the peripheral devices
(the accelerometer and memory) and enough I/O ports for electrode configurability,
gain configurability, chip selects, low power operation and debugging.
2.3 Mechanical Specifications and Challenges
The mechanical requirements for the cardiac monitor are not easily quantifiable. The
most important mechanical requirement is that the device be robust, yet comfortable.
The board needs to last a week under ambulatory conditions, and be as unobtrusive
as possible. The mechanical requirements for the device must be achieved while
maintaining the signal quality requirements discussed in Section 2.1.1.
Work on the first generation device first mentioned in Section 1.5 helped provide
feedback on a form factor that might achieve these goals. The first generation device
was fabricated on a flexible “L” shaped PCB and was designed to be completely free of
wires. The components of the board were distributed on the top surface of the PCB.
Although the device performed properly electrically, it was not as robust as the use
model requires. Because the patch was all on a single flexible PCB, it was constrained
to move as one piece. When worn, the device would bend and solder connections
would break. If the board had already been coated in Paralene-C for water and
sweat proofing, this rendered the affected board useless. Additionally, because the
board was wide around the electrode sites, it did not always remain flush against
the electrodes when worn (see Figure 2-6). This caused loose electrode connections,
especially during heavy activity such as walking briskly or running. Finally, the board
was not flexible or comfortable enough for use with women. The board is worn on
the sternum and is too wide and not flexible enough with breast tissue present.
These issues suggest that a single flexible PCB with circuit components distributed
on the surface is not an ideal form factor. A PCB that is more rigid with circuitry
concentrated in a smaller area might achieve better results. If this is done, connections
38

Figure 2-6: A view of the top of the ECG patch while worn.
from this central board to the electrodes must be made, either with flexible PCB,
wires, or another interconnect. Additionally, because the biopotential will be buffered
at the electrode site, circuitry is needed close to the electrode. One solution is to create
an additional PCB that interfaces with only the electrodes at the electrode site. The
PCB would be very small and sit on top of the electrode itself. These small PCBs
would connect to the larger, more central PCB with an interconnect.
39

40

Chapter 3
Implementation
This chapter will describe the final implementation of the cardiac monitor. First, an
overview of the cardiac monitor’s form factor and how it is worn on the body will
be described. Next, diagrams and explanations of each aspect of the system will be
provided. Finally, measurements of the performance of the system versus the desired
specifications discussed in Chapter 2 will be presented. Validation of the cardiac
monitor in a clinical setting can be found in Chapter 4.
3.1 Final System Overview
The final implementation of the cardiac monitor consists of a central board, along with
either one or two electrode attachments (see Figure 3-1). The additional electrodes
attach to the central board via wires and solder pads on each board. Each electrode
connects to a conventional 3M2560 red dot wet electrode. In the three electrode
implementation, the system is designed such that any electrode can act as an input
or output. Details about electrode configuration and setup are provided in section
3.2.2. In the two electrode implementation, the electrode configuration circuitry is
eliminated to reduce the footprint on the user. Without a third electrode, the two
electrode implementation requires capacitive coupling at the electrode inputs. The
input circuitry for both implementations is discussed in Section 3.1.2.
41

Figure 3-1: The wearable, long term cardiac monitor (three electrode implementa-tion).
3.1.1 Central Board
Solder joints on a previous, more distributed implementation of the cardiac monitor
occasionally broke when the PCB was flexed. Therefore, for this iteration of the
cardiac monitor, the majority of circuitry is concentrated on the central board. It
is 5.5cm wide by 4.2cm tall in the three electrode configuration and 5cm wide by
3.6cm tall in the two electrode configuration, only slightly larger than the 3M2560
electrodes (4.1cm by 3.5cm). The boards are 4 layers and 0.066cm thick. They has
been fabricated with Dupont FR material to allow them to bend slightly when worn.
All circuitry (other than that which must be at the additional electrode sites) is
located on these boards. A close up view of the three electrode central board can be
seen in Figure 3-2.
42

(a) Top (b) Bottom
Figure 3-2: The Central Board
3.1.2 Electrode boards
In most ECG monitors, only an electrode exists at the electrode site. This electrode is
then connected to the main system with long wires. However, in this cardiac monitor,
the biopotential at the electrode site is actively buffered. As discussed in section 2.1.1,
it has been shown that actively buffering the electrode signal can reduce power line
interference by up to 40 dB [19]. This requires an op-amp as close to the electrode
site as possible. Additionally, to accommodate both the two and three electrode
implementations, either capacitive or resistive coupling of the ECG input can be
used. Recall that the two electrode implementation requires capacitive coupling as
it does not have a third electrode. Additionally, each electrode can act as an output
(i.e. driven electrode) if used in the three electrode implementation. This electrode
would then act as the driven right leg electrode in the circuit discussed in section
2.1.1. The electrode board is 2cm wide and 2.4cm tall. A close up of the electrode
board itself can be seen in Figure 3-3. The electrode board is configured as an input
in Figure 3-4 and as an output in Figure 3-5.
3.1.3 Cardiac Monitor Placement
The cardiac monitor is worn in one of two configurations, depending on the number
of electrodes in use. In the three electrode case, the central board is placed just
below the sternum. The first electrode board is placed above the central board on
43

Figure 3-3: The Electrode Board
Figure 3-4: The electrode board is configured as an input. The signal from theelectrode is buffered by an op amp that is connected to the IA.
Figure 3-5: The electrode board is configured as an output. The signal from thedriven right leg circuit is connected to the electrode. This electrode then drives thebody.
44

the sternum, and the third electrode is placed just under the left pectoral near where
a V6 electrode would be placed (see Figure 3-6). As discussed in section 2.1.1, one of
three different ECG leads can be selected without moving the electrodes. In the two
electrode configuration, only one lead can be used at a time. Although the device
can be placed anywhere on the chest to obtain an ECG lead, it is placed in a lead
I configuration (see Figure 3-7) with one electrode on the upper sternum and the
other at least 10 cm away parallel to the first electrode. It was shown in [23] that the
maximum ECG signal amplitude was obtained at an interelectrode distance of 10 cm.
The cardiac monitor does not protrude significantly from the chest. As demonstrated
in Figure 3-8, it is very discrete when worn.
Figure 3-6: The three electrode implementation of the cardiac monitor worn at thechest.
3.2 Hardware
The final system implementation consists of three main subsystems: the analog front
end, digital back end, and power management circuitry. A block diagram of the final
45

Figure 3-7: The two electrode implementation of the cardiac monitor worn at thechest.
(a) Cardiac monitor with shirt (Front) (b) Cardiac monitor with shirt (Side)
Figure 3-8: A user wearing the three electrode implementation of the cardiac monitor.The monitor is very discrete and does not protrude significantly from the chest.
46

system can be found in Figure 3-9.
Figure 3-9: A block diagram of the overall system. A simplified version of the AnalogFront End is shown in orange. The Digital Back End consists of the red tinted blocks,and the inputs are shown as red (+), green (-), and black (gnd). Power Managementand the battery are shown in blue.
3.2.1 Analog Front End
The analog front end (AFE) is responsible for acquiring the ECG signal from the
electrodes and amplifying the signal. It also filters the signal before it is sampled
by the ADC. The AFE consists of the electrodes themselves along with any analog
circuitry used in the signal chain before the ADC. A circuit diagram of the analog
front end can be found in Figure 3-10. While the electrode configurability circuitry
influences the analog front end, it is included as part of the digital back end and is
presented in section 3.2.2. The output from each of the sensing electrode goes through
two different paths. The first path is used to amplify the ECG signal and filter it
before it is sampled by the ADC (i.e. ECG signal conditioning). The second path
will be used to generate the common mode feedback signal used to drive the body to
a fixed potential.
47

Figure 3-10: The Analog Front End, beginning with the Instrumentation Amplifier.The signal then goes through a gain selection stage and filter before being sampledby the MSP430.
ECG Signal Conditioning
The AFE’s forward path consists of an instrumentation amplifier and a variable gain
stage with anti-aliasing and smoothing filters (see Figure 3-10). The signal from the
two sensing electrodes provides the input to the instrumentation amplifier, which is
an INA333 configured with a gain of about 20. The output of the INA333 is used as
an input to an OPA333 with input resistance of 300kΩ and a feedback capacitance of
1µF. The output of this amplifier goes to the reference pin of the INA333, effectively
acting as a high pass filter with a cutoff frequency of 0.5 Hz. This high pass filter AC
couples the signal without placing large capacitors in the signal path.
The output of the IA is passed through a SN74CBTLV3125 quadruple FET bus
switch that is connected to four binary weighted resistors. The four resistors act
as the input resistor of an inverting amplifier that follows the IA. With a constant
feedback resistance and 4 bits of selectable input resistance, gains ranging from about
120 to about 1800 can be achieved with a resolution of 120. Gain can be adjusted
using the MSP430 to maximize dynamic range and account for variation in biosignal
amplitude from user to user. The inverting amplifier also acts as a low pass filter.
48

It has a feedback resistance of 1MΩ and a feedback capacitance of 1.2 nF, which
corresponds to a low pass cutoff frequency of approximately 125 Hz. Along with
noise bandwidth reduction, this amplifier serves as an antialiasing filter for the system,
which is sampled at 250 Hz. The output of this amplifier then goes through a single-
pole low pass filter with a cutoff of 285 Hz and then is sampled by the ADC. This
low-pass filter is used to reduce high frequency ADC sample clock feed-through.
Driven Right Leg Circuit
The AFE’s feedback path is the driven right leg circuit. This circuit takes the signal
from the two sensing electrodes and sums them. The sum is then buffered by an
OPA333. The buffered output is then negatively amplified by another OPA333 by
a factor of 39.5 with respect to the circuit midrail. A 120 pF capacitor is included
on the second OPA333. This capacitor in combination with the feedback resistance
creates a low pass frequency of the driven right leg circuit of 3.4 kHz. This ensures
loop stability of the entire front end. Circuit stability in the driven right leg circuit is
discussed in depth in [21]. The driven right leg circuitry is included in the schematic
in Figure 3-10.
3.2.2 Digital Back End
The digital back end is controlled by an MSP430F247 microcontroller. This MSP430
was selected for its low active and standby power, and because it had enough se-
rial peripheral interface (SPI) and I/O ports required for the system. The MSP430
interfaces with all peripheral chips. This includes all the electrode configuration cir-
cuitry), memory, accelerometer, and 3 LEDs for debugging. The MSP430’s internal
12 bit ADC is also used. In this section, the interface between the MSP430 and all
peripheral devices will be described. Software implemented on the MSP430 to con-
trol each peripheral and implement the final algorithm for the cardiac monitor will
be presented in section 3.3.
49

Accelerometer
The accelerometer (ADXL346), like the memory, communicates with the MSP430
via the SPI protocol. It has its own dedicated SPI port. The ADXL346 has multiple
resolution modes that maintain 4 mg resolution. Based on the requirements outlined
in section 2.1.2, the range of the accelerometer was set to ± 8g with full resolution
(12 bits). It samples at 400 samples / second in a “first in first out” (FIFO) stream
mode. The accelerometer has FIFO buffers for each axis that store samples. The
FIFO stream mode samples continuously and overwrites the FIFO buffers with the
most recent samples. Each FIFO buffer can store up to 32 samples. Sampling at
400 samples / sec and saving up to 32 samples corresponds to the first sample in the
buffer being refreshed 400 / 32 = 12.5 times per second, which is the desired sampling
frequency.
Electrode Configurability
In the three electrode implementation, each electrode can be configured as either
a positive input, negative input or output/driven electrode. When an electrode is
configured as an input to the system, the signal at the electrode site is immediately
buffered by an OPA333 low-offset op-amp. The output of each buffer is connected to
two TS5A3359 SP3T switches. The two control lines on each switch are controlled by
the MSP430 and are used to connect one of the three electrodes to either the positive
or negative terminal of the INA333 instrumentation amplifier. Each electrode is also
connected to a third TS5A3359 switch, also controlled by the MSP430. This switch
is connected before the signal is buffered and is used to connect an electrode to the
output of the drive right leg circuit. When an electrode is configured as an output,
the MSP430 uses a TS5A3160 switch to turn off the OPA333 to save power.
Memory
The cardiac monitor has two different types of memory: serial flash memory (2
S25FL128P) and a micro SD card. Because a micro SD card is power intensive
50

and takes hundreds of milliseconds to write to, the serial flash memory is used as a
buffer for the ECG and acceleration data as it is sampled. Once enough data has been
saved to the serial flash memory, the data is written to the micro SD card and can
be accessed by a computer. Two serial flash memories are used for usability reasons.
Bits in the serial flash cannot be changed from 0 to 1 without an erase operation,
which requires that a page be erased before it can be written to again. A bulk erase
of the serial flash memory takes on the order of 120 seconds, which is an inconvenient
duration for the user to have to wait to use the device. By having two serial flash
memories, one device can be used at a time so the user does not have to wait for the
serial flash to erase.
Both the serial flash chips and micro SD card interface with the MSP430 using
SPI. The serial flash chips share an SPI port. Only one chip can be accessed at a time
using the appropriate chip select. The micro SD card has its own dedicated SPI port.
Each serial flash chip has 128 Mbits of memory for a total capacity of 256 Mbits. The
serial flash chips are organized in 256 byte pages that are accessed using three page
address bytes. The lowest page address byte (page address 0) refers to a byte within
the page, and page address 1 and page address 2 act as a 16 bit number used to select
the appropriate page. A micro SD card has a capacity anywhere from 1 MB to 32
GB. In this thesis, testing was done primarily using a Kingston 4 GB micro SDHC
card and a SanDisk 2 GB micro SD card. The micro SD card is broken down into
blocks of 512 bytes. One block of micro SD can hold two pages of flash memory.
3.2.3 Power Management Circuitry
A Cameron Sino CS-EC003SL lithium ion battery is used to power the system. It has
a capacity of 600 mAH at 3.7 V and is 4cm by 3.2cm. The battery is placed on top
of the central board and can be secured with medical tape during testing (see Figure
3-11). Charging for the battery is provided on an external board using an ADP2291.
There are two voltage regulators on the central board. A TPS78227 2.7 V linear
regulator is used to provide power for all analog circuitry. This includes all chips used
in the analog front end, along with the AVCC of the MSP430. A TPS62200 switching
51

Figure 3-11: The three electrode board with battery on top.
regular is used as the digital voltage supply. A switching regulator was used to boost
efficiency during high loads, such as writing to memory.
An undervoltage circuit is used to prevent the battery from discharging below
about 3.1 V. A comparator (TLV3401) connected as a high side voltage sense circuit is
used to provide this undervoltage protection. The negative terminal of the comparator
is connected to a REF3312 1.25 V reference. The battery voltage goes through a
voltage divider and the result is compared to the 1.25 V reference. The output of the
comparator controls a TS5A3166 SPST switch. If the output of the comparator is
high, the battery voltage is high enough and the SPST switch connects the battery
voltage to the voltage regulators. If the output of the comparator is low, the switch
52

is off and the system receives no power.
3.3 Software
The software for the system is implemented on the MSP430 in C. It initializes the
system, samples the ECG and accelerometer, and saves the data to memory. In this
section, the final algorithm will be presented. Details about each particular aspect
of the software will be described, with small code snippets if relevant. Much of the
software implementation was straightforward. However, the micro SD code was the
most difficult to write, despite the open source code available. Code used to initialize
and write to the micro SD card is included in Appendix A.
3.3.1 Final Algorithm
The final algorithm is presented in flowchart form in Figure 3-12. The system first
starts up and confirms that a micro SD card is present before proceeding. It selects
a flash memory and then activates a timer interrupt that overflows once every 4 ms.
When the interrupt is active, the ECG is sampled, and the Accel is sampled every
20 interrupts. After each interrupt, the system checks to see if it should write data
to the serial flash or micro SD card. If needed, writes to these different systems are
executed. Note that the system continues to sample the ECG and the Accelerometer
even while writing to memory. Samples taken during this period are stored in a
separate buffer that is transferred back to the signal buffer at the end of each write.
The different blocks will now be described in more detail.
3.3.2 Allocate space and structures
The first thing the MSP430 does is allocate space for all the buffers used for sampling
and storage. All space is pre-allocated at start up. Each data sample is 12 bytes,
but is treated as a 16 bit (2 byte) sample with the upper nibble of the high byte zero
padded. Each sample is saved as a SAMPLE structure (see Listing 3.1). While not as
53

Figure 3-12: The Final Algorithm run on the cardiac monitor presented in flow chartform. ACount is a counter that increases each time an ECG sample is taken and thenis reset after an accelerometer sample is taken. PCount is a counter that increaseseach time a page is written to flash and then is reset after a micro SD block is written.
54

Listing 3.1: The SAMPLE structure
typedef struct
char BYTE0; // Low by t echar BYTE1; // High by t e
SAMPLE;
Listing 3.2: The STORE structure
typedef struct STORE
char index ; // DATA bu f f e r indexchar tempIndex ; // TEMP bu f f e r indexchar DATA[ 2 5 0 ] ; // DATA bu f f e rchar TEMP[ 2 0 0 ] ; // Temporary ove r f l ow b u f f e r
STORE;
space efficient as possible, it is more simple when analyzing the data. Additionally,
the upper nibble can be used in the future to encode additional information (see
Chapter 5). All samples are saved in STORE structures (see Listing 3.2). These
structures have two buffers with indices. The DATA buffer is the primary data buffer
that is used until it is full and is 250 bytes. The TEMP buffer is 200 bytes. This size
was selected based on write times to memory and should be large enough to prevent
data loss. A large buffer called SPACE is pre-allocated for use as a buffer for the
micro SD transfer.
A structure to keep track of access to the flash memory is also used. Because the
flash memory will be accessed in two different ways, two structures are initiated. The
flash will be written to when a signal buffer is full, and it will be read from when
preparing to write to the micro SD. The FLASH structure keeps track of the flash in
use and the current page address. It also knows how many flash devices are available
in case it reaches the end of a flash device. The FLASH structure is shown in Listing
3.3.
55

Listing 3.3: The FLASH structure
typedef struct
char DeviceNum ; // Current dev i c e numberchar DeviceStart ; // F i r s t d ev i c e numberchar DeviceEnd ; // Last dev i c e numberchar PA2; // Page Address 2char PA1; // Page Address 1
FLASH;
3.3.3 Initializing the System
The first thing the MSP430 does after power-on is initialize the clock setup. The
master clock (MCLK) is generated from an internal oscillator and set to 1 MHz. The
sub-main clock (SMCLK) is used as the clock for the memory and accelerometer and
is also set to 1 MHz. After the clocks have been set up, the I/O pins are configured. A
full listing of the pins used on each port is provided in table 3.1. Detailed descriptions
of each pin used are summarized in table 3.2. The pins corresponding to the three
SPI ports in use are configured, along with all logic circuitry and chip selects. Chip
selects for all peripherals start out high. By default, the system is set for a gain of
about 250. In the three electrode implementation the electrodes are configured to
give a Lead II projection. The I/O mapping in the two electrode configuration is
similar to that of the three electrode, but is not shown for simplicity. A few I/Os
changed position to optimize layout.
Port BIT7 BIT6 BIT5 BIT4 BIT3 BIT2 BIT1 BIT0P1 INS11 INS22 INS21 BUF3 GREEN YELLOW RED NCP2 NC SEL4 SEL3 SEL2 SEL1 BUF2 NC INS12P3 SO2 SI2 CS1 BUF1 SCLK1 SO1 SI1 CS6P4 CS5 GS1 GS2 NC NC NC NC CS2P5 NC NC NC NC SCLK3 SO3 SI3 SCLK2P6 ADC0 NC NC NC NC NC NC NC
Table 3.1: The GPIO configuration of the cardiac monitor.
After the I/Os are configured, the SPI ports for all the peripheral devices are set
up (configuring the I/Os only puts the pins in SPI mode). The timer and ADC are
56

I/O Name BIT DescriptionADC0 P6.7 Output of the AFE / Input to the internal ADCBUF1 P3.4 Set electrode 1 VDD of buffer highBUF2 P2.2 Set electrode 2 VDD of buffer highBUF3 P1.4 Set electrode 3 VDD of buffer highCS1 P3.5 Serial Flash 1 chip selectCS2 P4.0 Serial Flash 2 chip selectCS5 P4.7 Micro SD chip selectCS6 P3.0 Accelerometer chip select
INS11 P1.7 Control logic to select electrode input to IA+ (1)INS12 P2.0 Control logic to select electrode input to IA+ (2)INS21 P1.5 Control logic to select electrode input to IA- (1)INS22 P1.6 Control logic to select electrode input to IA- (2)GS1 P4.6 Control logic to select electrode output to DRL (1)GS2 P4.5 Control logic to select electrode output to DRL (2)
GREEN P1.3 Green LEDYELLOW P1.2 Yellow LED
RED P1.1 Red LEDSEL1 P2.3 Switch connected to 1x resistor in AFESEL2 P2.4 Switch connected to 2x resistor in AFESEL3 P2.5 Switch connected to 4x resistor in AFESEL4 P2.6 Switch connected to 8x resistor in AFE
SI1 P3.1 Slave data in for accelerometerSCLK1 P3.3 Slave clock for accelerometer
SO1 P3.2 Slave data out for accelerometerSI2 P3.6 Slave data in for serial flash
SCLK2 P5.0 Slave clock for serial flashSO2 P3.7 Slave data out for serial flashSI3 P5.1 Slave data in for micro SD
SCLK3 P5.3 Slave clock for micro SDSO3 P5.2 Slave data out for micro SD
Table 3.2: GPIO descriptions
57

also configured. The timer is set to use the SMCLK, divide by 8, and then count up
to 500 (1 MHz / 8 = 125 kHz, 125 kHz / 500 = 250 Hz). The ADC is configured to
sample on each timer interrupt.
3.3.4 Checking the micro SD card
A standard micro SD card is used to transfer data from the serial flash memory to a
form readable by the user. When the system starts, the MSP430 tries to initialize the
micro SD card. If no micro SD card is present, the main loop exits and a red LED
indicates no card is present and that the test has failed. Micro SD card initialization
is described extensively elsewhere [24]. However, open source code available was not
as robust as was needed for this application, and did not always have proper error
checking. The code used for this system is included in Appendix A. Briefly, the
initialization process first powers on the device and waits a few milliseconds before
sending 100 clock pulses with the card deselected (CS high). Next, a reset command
is sent to the card. If this operation succeeds, another command to identify the type
of card is sent. Some micro SD cards use block addressing, and this setting needs to
be appropriately determined to properly address the card. The initialization process
is relatively straightforward, but care must be taken to ensure each operation has
time to complete before starting the next one.
3.3.5 Selecting the available flash memory
Once the system has verified that a micro SD card is present, it checks to see which
(if any) of the two flash memories have been written to previously. This is important
because bits in the serial flash memory can only be changed from 1 to 0. Changing
a bit from 0 to 1 requires an erase operation. Unfortunately, erasing the serial flash
memory can take up to 128 seconds, which is a long delay for the user two wait
before use. To avoid this long wait, the system checks to see if the first flash has been
written to by checking if any of the bits on the first 8 pages are 0. If the flash has
been written to, the MSP430 sends the bulk erase command to the device and tries
58

the second device. If this device is also in use, it sends the bulk erase command again
and waits for the first device to finish. If the second device is not in use, it is used in
place of the first device. Even if the first device is not in use, the system still checks
the second device and issues the bulk erase command for future use.
3.3.6 Sampling Timer Interrupt
Timer A on the MSP430 is used to trigger an interrupt 250 times per second. The
ADC is sampled during each interrupt to provide the 250 Hz sampling rate required
for the ECG. Each sample is appended to a buffer dedicated to ECG data only.
Because the accelerometer only needs to be sampled at 12.5 Hz, a counter within the
interrupt ensures that the accelerometer is sampled only once every 20 interrupts,
which results in an effective sample rate of 12.5 Hz. Each time the accelerometer is
sampled, values from each axis are saved to their respective data buffers.
Because the cardiac monitor must be able to sample continuously and without
interruption, the timer interrupt must continue to operate even when data is being
written to memory. When possible, sampled data is saved directly to a primary data
buffer. When the primary data buffer is full, any additional samples are saved to the
TEMP buffer and then are returned to the DATA buffer after it has been written to
memory.
After a timer interrupt has been completed, the MSP430 enters low power mode
1, which disables the CPU and MCLK. SCLK, which is used for timer A and the
other peripheral devices, remains active. When timer A overflows, it exists low power
mode 1 and carries out the timer interrupt. Normally after such an interrupt the
MSP would return to low power mode 1. However, at this time the device is put into
active mode. In active mode, the system has a while loop that checks if data should
be written to the serial flash and/or micro SD. After data is written (if necessary),
the system re-enters low power mode 1 until the next timer interrupt.
59

3.3.7 Saving Data to Serial Flash
When a STORE buffer is full, the MSP430 writes a page of data to the serial flash.
Each 256 byte flash page is broken down into a 3 byte header, 250 byte data block,
and 3 byte footer (see Figure 3-13). The header contains the 3 page address bytes
and the footer identifies the type of data block written, along with which of the two
flashes it was written to. To write a flash page, the MSP430 first checks the status
register of the flash to see if it is busy. Next, the write enable latch is set high and
the chip select is set low. The write command is passed to the serial flash along with
the 3 page address bytes (page address 0 is always 0). After the page address bytes
are sent, the header, 250 data bytes, and footer are transmitted. The MSP430 checks
the status register again until the write has completed, and then increments the page
address pointer to the next page. If the page address pointer is at the end of the
flash device, it moves to the first page of the next flash. Any data samples that were
obtained while writing to the serial flash are restored to their proper buffers. Each
type of data is written to its own page. With ECG samples of 2 bytes taken at 250
Hz, a page of ECG data will be written about twice per second. With Accel samples
of 2 bytes each taken at 12.5 Hz, three pages of Accel data (X,Y,Z) will be written
about once every 10 seconds (see Figure 3-14).
Figure 3-13: An Example Flash Block
60

Figure 3-14: Data saved on flash memory.
3.3.8 Saving Data to micro SD
Once enough data has been buffered by the serial flash memory, it is written to the
micro SD card. Each write to the micro SD card requires significantly more power
than the serial flash memory, but improves with number of blocks written. The micro
SD card is written to when at least 8 pages of flash memory have saved but are not
present on the micro SD. This occurs about once every 4 seconds and corresponds
to a multi block write of at least 4 micro SD memory blocks. When the micro SD
is ready to be written to, up to 8 pages of data are read from the serial flash and
saved in the SPACE buffer. Once the SPACE buffer is full, this data is written to the
micro SD in a single write. Next, any additional data is read from the serial flash,
saved in the SPACE buffer, and written to the micro SD. If an odd number of serial
flash pages need to be written to the micro SD, the second half of the last micro SD
block is filled with a constant value that can be removed in post processing. After
the micro SD write has completed, an end of file (EOF) marker is written. When the
next write is initiated, the EOF marker is overwritten and a new one is appended to
the card.
3.3.9 Importing the data
Once the data has been saved to the micro SD card and testing is complete, it can be
read directly by a computer. The hex editor Hex Workshop [25] is used to search for
the EOF marker on the micro SD card and then all the data is saved as a binary file.
This binary file is read by a matlab script that generates data vectors corresponding
61

to each signal. The matlab script iterates through the binary file 256 bytes at a time
(i.e. one page of flash memory at a time). First, the script determines if the page of
interest is a valid page of data. If not, it either skips to the next page or terminates
depending on the contents of the header and footer. If the page is a valid data page,
the script converts the 250 data bytes into their corresponding 125 data samples. In
the case of the ECG, this involves converting the high byte and low byte into a 16 bit
number and changing from ADC code to volts. In the case of the accelerometer, the
high byte and low byte are combined, and the resulting number is converted from a
two’s complement number to a signed integer. This signed integer is then converted
into gs. When the script is finished, MATLAB automatically plots the ECG data in
one window and the 3-axis acceleration data in another.
3.4 Cardiac Monitor Specifications
This section will discuss how the cardiac monitor meets the specifications outlined in
Chapter 2. The ECG specifications will be presented first, followed by the accelerom-
eter specifications and finishing up with the system specifications.
3.4.1 ECG Specifications
Specification Target Calculated MeasuredBandwidth 0.5 – 125 Hz 0.5 – 133 Hz 0.5 – 112 Hz
Input Referred Noise < 20µVrms 3.3 µVrms 3.6 µVrms
Gain 100–1000+ 118–1770 130–1500CMRR (@ 60 Hz) 90+ dB 100 dB 99 dB
Table 3.3: ECG Signal Quality Requirements and Measurements
Specification ValueLeads 1
Electrodes 2–3ADC resolution 12 bits
Table 3.4: ECG Signal Quality Specifications by Design
62

The cardiac monitor was designed to take a single ECG lead with 2 or 3 electrodes
and is sampled at 12 bits. The high pass frequency of the cardiac monitor is set by an
op amp fed into the reference pin of the instrumentation amplifier. The time constant
set by the input resistor and feedback capacitance results in a high pass corner of 0.5
Hz. The low pass corner frequency of the system is set by the inverting amplifier in
the analog front end. The actual low pass corner frequency is 112 Hz.
The input referred noise of the analog front end is calculated by considering the
following noise sources: two OPA333 input buffers, one INA333, another OPA333
acting as an inverting amplifier, and resistors connected to this inverting amplifier.
The noise from the OPA333 and associated resistors is divided by the first stage gain.
The noise of the OPA333 is 53 nV√Hz
and the noise of the INA333 is 50 nV√Hz
. The total
noise integrated over the bandwidth of 0.5 to 125 Hz (assuming a single pole roll off)
is 3.3 µVrms. The power spectral density of the output referred noise was determined
using the psd function in Matlab. Noise power was divided by the square of the
amplifier transfer function and integrated over the range of 0 Hz to 112 Hz * π/2 (to
account for single pole roll off) to determine the total RMS input referred noise of
3.6µVrms.
The gain of the system is set by 4 binary weighted resistors and, from calculations,
should range between 118 and 1770. In practice, the gain appears to be slightly less
than the calculated values. The CMRR is 99 dB, which is around what was specified
by the Instrumentation Amplifier data sheet.
3.4.2 Accelerometer Specifications
Specification ValueRange ± 8g
Resolution 12 bitsSample rate 12.5 Hz
Table 3.5: Accelerometer Signal Quality Requirements
The accelerometer specifications are easily configured using the ADXL346. It was
configured to have a range of ± 8g, with a resolution of 12 bits and a sample rate of
63

12.5 Hz.
3.4.3 System Specifications
Specification Minimum Target ActualTest duration 24 hours 1+ weeks 9 – 10 days
Memory 128 MB 1+ GB 1+ GBPower dissipation < 9.7 mW < 9.7 mW < 6.6 – 7.3 mW
Table 3.6: Overall system specifications
The test duration specification is set by the minimum of the memory and the
power dissipation. It will either be memory limited or power dissipation limited. 20
ECG pages and 3 accelerometer pages are written every 10 seconds. This corresponds
to 23pages10sec∗ 256 bytes
page= 5888 bytes
10sec. For a test duration of one week, 0.33 GB of memory
is required. A micro SD card can have higher capacity than this, so the device will
be limited by its power dissipation.
To determine power dissipation, the relative contributions of the different parts of
the final algorithm need to be considered. First, the standby current of the system
was measured to be about 0.6 mA. Next, the average current was measured with the
timer interrupt enabled. This current was about 0.8 mA. The average current drawn
when only writing to the serial flash was between 1.5 mA and 3 mA. Finally, the
average current drawn when writing to the micro SD (and getting the corresponding
data from the serial flash) was between 9 mA and 10 mA.
Operation CurrentStandby 0.6 mA
Timer Interrupt 0.8 mASerial Flash Write 1.5 mA – 3 mAMicro SD Write 9 mA – 10 mA
Table 3.7: Currents drawn for different operations of the cardiac monitor.
The current drawn with the timer interrupt enabled is considered an “always
on” contribution to the overall power dissipation. To determine the contribution of
writing to the flash and writing to the micro SD, the duty cycle of such contributions
64

must be determined. Writing a single page of serial flash data (with all overhead)
takes 32 ms. Each write to the micro SD card (4+ blocks, including getting data
from the micro SD and writing the EOF marker) takes 680 ms total (see Table 3.8
for the breakdown).
Operation Duration (ms)Serial Flash write 32 ms
Serial Flash read (8 pages) 408 msMicro SD write (4 blocks) 208 msMicro SD write (1 block) 64 ms
Table 3.8: Write / Read times for different operations of the cardiac monitor.
The micro SD card is written to approximately once every 4 seconds. The worst
case contribution of the flash is then:
3mA ∗ 23pages
10sec∗ 32ms
page= 3mA ∗ 73.6ms
sec= 0.22mA (3.1)
And the worst case contribution of the micro SD card is 10mA ∗ 680ms4sec
= 1.7mA.
The total average current drawn is then in the worst case 2.72 mA or 7.3 mW.
Repeating the same analysis with a current of 1.5 mA for the serial flash and 9 mA
for the micro SD results in a power dissipation of 6.6 mW. The system should be able
to run for 9 – 10 days before recharging.
65

66
Chapter 4
Clinical Test
After testing basic device functionality, the next step in validating the wearable car-
diac monitor is with a clinical test. In this chapter, a clinical test conducted at the
Clinical Research Center (CRC)1 at MIT will be presented. Motivation for the study,
the study protocol, analysis and preliminary results will be discussed.
4.1 Motivation
The motivation for the study can be broken down into four distinct goals, summarized
below.
To evaluate ECG signal quality of the cardiac monitor
To determine the comfort level of the cardiac monitor
To examine the relationship between activity levels and heart rate
To obtain a comprehensive suite of physiological signals in one data set for
future algorithm development
1This work was conducted with support from Harvard Catalyst — The Harvard Clinical andTranslational Science Center (National Center for Research Resources and the National Centerfor Advancing Translational Sciences, National Institutes of Health Award #UL1 RR 025758 andfinancial contributions from Harvard University and its affiliated academic health care centers). Thecontent is solely the responsibility of the authors and does not necessarily represent the officialviews of Harvard Catalyst, Harvard University and its affiliated academic health care centers, or theNational Institutes of Health.
67

4.1.1 ECG Signal Quality
The first goal is to evaluate the signal quality of the ECG on the cardiac monitor. The
ECG should have a clear view of the P wave, QRS complex and T wave. Modulation
of the QRS amplitude associated with respiration should be readily visible. The ECG
should be clean even during activities of high movement such as running, and should
be of at least as high quality as a currently available ECG monitor.
4.1.2 Comfort Level
The second goal of the clinical test is to evaluate the comfort level of the device. The
participants will be wearing the device while they carry out different activities. The
board should be as minimally obtrusive to the performance of the tasks. Ideally, the
participants would not even notice that they are wearing a device.
4.1.3 Activity Level
The third goal of the clinical test is to examine the relationship between activity level
(as measured by the 3-axis accelerometer) and heart rate.
4.1.4 Creating a Suite of Physiological Signals
The fourth goal of the clinical test is to obtain a comprehensive suite of physiological
signals. This suite can be used to better understand the cardiovascular system as
important signals will all be in the same, concurrent data record. Future algorithm
development could benefit from such a comprehensive suite.
4.2 Protocol
Four healthy participants ages 22 to 40 with an average age of 28.5 years were tested.
Data from all four were deemed acceptable for analysis. All subjects wore the three
electrode model in a lead II configuration (the two electrode model will be tested in
future work). A Criticare 504-US ECG recorder [26], with electrodes placed adjacent
68

to those on the cardiac monitor, was used as a comparison. Participants also wore
two respiration bands (Inductotrace [27]), a pulse oximeter (Criticare 504-US), and a
continuous blood pressure monitor (Portapres [28]) to acquire additional physiological
signals during the test. After all the devices are positioned on the participant, the
participant’s left hand is placed in a sling. This sling keeps the Portapres at the
level of the heart and helps keep some of the wires out of the way throughout the
interventions.
Figure 4-1: Participant with all the devices attached and ready to begin the clinicaltest.
The test was broken down into three different activity levels: rest, moderate, and
heavy. When possible, the participant was given a minute of stationary rest between
interventions to allow the body to return to a baseline state and re-calibrate the blood
pressure monitor. A button was pressed at the beginning and end of each intervention
(once to signal a start, twice to signal and end). Times of the corresponding button
presses were recorded on a spreadsheet by a researcher (see Figure 4-3). An overview
of the clinical test sequence and interventions can be found in Figure 4-2. The protocol
described above is conducted twice in a row (time permitting) for each participant.
Two researchers on the IRB and a nurse were required to be present for the duration
of the test. Before the test, vital statistics such as age, height, weight and blood
pressure were recorded. After the test, participants rated the comfort of the device.
Oversight for research participants was provided by Catherine Ricciardi RN, BSN
and Ravi Thadhani MD, PhD.
69

Figure 4-2: Sequence of interventions in the clinical test (run twice per partcipant).
Figure 4-3: Researcher recording the times associated with each interval.
The participant begins the test in the supine position by lying down on a hospital
bed for 5 minutes. After time has elapsed, the participant sits up quickly, rests for 1
minute, and then performs the action of sitting for 5 minutes. Finally, the participant
stands up, rests for 1 minute, and then performs the action of standing for 5 minutes.
After the participant has stood for the appropriate duration, the moderate activity
tests begin. The moderate movement phase begins with light hopping, followed by
left arm movement, and finishes with a valsalva maneuver. A valsalva maneuver is
performed by attempting to exhale against a closed airway and is used to evaluate the
autonomic nervous control of the heart. The light hopping and left arm movement
are each 1 minute in duration, with 1 minute between interventions for calibration.
The valsalva maneuever takes a total duration of 10 seconds.
The heavy activity portion of the clinical test begins with 5 minutes of walking
70

on a treadmill, at a pace of no more than 4 mph. Without stopping, the speed of the
treadmill is then increased to a light jog / run at a pace of no more than 7 mph. The
participant is given 2 minutes to rest after stepping down from the treadmill. At this
point in time the participant is also offered water and given any additional time if
necessary. The last intervention is stair stepping. The participant steps up and down
off the back of the treadmill for 1 minute. After the stair stepping is complete, final
calibration of the blood pressure monitor and the protocol is complete.
Figure 4-4: Participant walking on the treadmill while the data is being monitoredon the PC.
4.3 Analysis
4.3.1 Cardiac Monitor Signal Quality
The first objective of the clinical test was to evaluate the performance of the cardiac
monitor described above. This was achieved by simultaneously recording an ECG
trace from the cardiac monitor and a device already accepted in the literature (i.e.
the Criticare recorder). We chose to compare the two ECG traces based on how each
trace performed when analyzed with a QRS detection algorithm (in this case, the
71
wqrs algorithm [29]).
The first step to compare the two ECG traces is to align the two signals in time.
The start and stop times of both traces were recorded. First, the clinical recorder data
was imported into the WaveForm Database (WFDB) format for use in Physionet’s
WAVE viewer [30]. The clinical recorder samples at 12 kHz, so the data was down-
sampled to 250 Hz. The cardiac monitor data was imported into a separate WFDB
file. While this trace is ideally sampled at the same frequency as the downsampled
clinical recorder trace, the effective sampling frequency of the cardiac monitor can
vary by about ± 1 Hz. To determine the effective sampling rate, each ECG trace’s R
waves were annotated. An R-R interval series was extracted for each trace. The two
series were plotted in matlab and aligned in time. Once the series were aligned in
time, the relative sampling rate between the two traces can be measured. For exam-
ple, if for the same beat, one trace records an R-R interval of 126 samples whereas the
other records an R-R interval of 125 samples, the effective sampling frequency can be
determined by considering that: 126x
= 125250
or x = 126125
250. With the effective sampling
frequency and relative timings between the two traces in hand, the two traces can
be aligned. In practice, dropped data from the clinical recorder prevented perfect
realignment of the two traces for the entire duration of the clinical test.
Now that the traces are time aligned, a “gold standard” set of annotations is
needed. These annotations should be the best possible representation of when a
heart beat occurred during the clinical test. The “gold standard” annotations were
created by first running the wqrs algorithm (a widely available QRS detection algo-
rithm), then manually reviewing the annotations and making corrections as needed.
The “gold standard” set of annotations were then compared with the annotations
generated by the wqrs algorithm (without any human intervention) for each trace. If
a given ECG trace is of sufficient signal quality, the QRS detection algorithm should
produce annotations in close proximity to the “gold standard” annotations. However,
if sections of the given ECG trace have inadequate signal quality, additional annota-
tions may be added, or skipped completely. An annotation from the test ECG trace
and a “gold standard” annotation are considered a match if they are found within
72

150 ms of each other.
Comparisons were made using the bxb algorithm (a beat by beat comparison al-
gorithm), which is readily available in the PhysioNet Toolkit. The bxb algorithm
takes two different sets of annotations as inputs and returns two outputs: QRS sen-
sitivity and QRS positive predictivity. QRS sensitivity is defined as the percentage
of QRS matches the wqrs algorithm found of the total number of “gold standard”
annotated beats. This is a representation of how capable the given ECG trace was of
identifying a real beat (as indicated by the “gold standard” annotation). Missing a
beat lowers this percentage. QRS positive predictivity is defined as the percentage of
correct QRS detections compared with the total number of QRS detections. This is
a representation of how reliable the given ECG trace was at identifying a real beat.
False positives lower this percentage.
4.3.2 Cardiac Monitor Comfort Level
The second objective of the clinical test was to determine how comfortable the cardiac
monitor was to wear. Each participant was asked to complete an exit survey after
testing. The survey asked how comfortable the cardiac monitor was, and asked for
written feedback about any improvements that could be made to the device.
4.4 Results
4.4.1 Cardiac Monitor Signal Quality
The QRS sensitivity and positive predictivity of the two ECG traces are summarized
in Table 4.1. Both devices performed well in almost all the interventions. The biggest
differences between the two occurred during interventions with heavier movement,
particularly running. When there was a lot of movement, the clinical recorder ECG
trace had a lot of baseline drift and a lot of noise (possibly due to motion artifacts
or the electrodes coming loose). Care was taken to ensure that the wires were as
secure as possible, but the clinical recorder appeared to be generally less reliable than
73

the cardiac monitor. In two of the four subjects, the running section on the clinical
recorder could not be properly annotated because there was so much noise. In the two
subjects where running could be annotated, the QRS sensitivity was high (95.3%).
However, the predictivity was low (24.6%)
In the first two subjects, the analog front end appears to have saturated. While
the ADC is not completely railed, a comparison of the relative amplitudes of the
P and T waves versus the QRS complex and a lack of respiration in much of the
recording suggests that the amplifier is saturated. Data comparing the two ECG
traces during running and standing can be seen in Figure 4-5 and 4-6. A trace from
the third subject that demonstrates a more appropriate scaling between the QRS
complex and the P and T waves is presented in Figure 4-7.
InterventionsQRS Sens. (mean,std) QRS Pos. Predict. (mean,std)Cardiac Clinical Cardiac Clinical
Supine 100 (0) 99.89 (0.25) 100 (0) 100 (0)Sit 99.94 (0.13) 100 (0) 100 (0) 100 (0)Stand 100 (0) 99.87 (0.30) 100 (0) 100 (0)Hop 100 (0) 95.57 (4.65) 100 (0) 69.71 (41.82)Move 99.28 (1.61) 97.26 (5.48) 99.05 (2.13) 85.41 (31.97)Valsalva 100 (0) 100 (0) 100 (0) 100 (0)Walk 100 (0) 96.31 (4.59) 100 (0) 50.19 (45.04)Run 99.18 (1.06) 54.73 (50.3) 98.93 (1.26) 26.98 (35.18)Step 100 (0) 97.18 (1.55) 100 (0) 100 (0)
Table 4.1: QRS Sensitivity and Positive Predictivity for both the Cardiac Monitorand the Clinical Recorder. All values reported are in percentages (n = 4).
4.4.2 Cardiac Monitor Comfort Level
Participants rated the cardiac monitor comfort level on a 5 point scale ranging from
very uncomfortable to very comfortable. All participants rated the cardiac monitor
either somewhat comfortable or very comfortable. In the comments, the most com-
mon complaint was about the portapres, which can be very constricting when worn
for the duration of the clinical test.
74

4.4.3 Summary
Overall, both the cardiac monitor developed in this thesis and the clinical recorder
performed well in low to moderate activity levels. However, the cardiac monitor sub-
stantially outperformed the clinical recorder under heavy activity levels, particularly
running. The clinical recorder could not reliably acquire a clean ECG while a partic-
ipant was running. When the clinical recorder was able to record a reasonably clean
ECG, the QRS sensitivity was high but the QRS positive predictivity was very low,
suggesting that there is still a lot of noise in the signal that caused false positives to
occur. This difference in reliability may have to do with the shorter wires used with
the cardiac monitor, and/or the active buffering of the electrode sites on the cardiac
monitor. Participants all rated the cardiac monitor comfort level as either somewhat
comfortable or very comfortable (4 or 5 on a scale of 5, 5 being very comfortable).
Figure 4-5: ECG of a participant while running. The output is likely saturatedbecause the P and T waves should not be that large compared to the QRS complex.
75

Figure 4-6: ECG of a participant while standing. The output is likely saturatedbecause the P and T waves should not be that large compared to the QRS complex.
Figure 4-7: ECG of a participant while supine. The QRS complex is larger relativeto the P and T waves than in previous images, suggesting that this participant hada smaller amplitude ECG.
76

Chapter 5
Conclusions
A wearable cardiac monitor has been motivated, designed and implemented. Clinical
testing on the device is underway. In this last Chapter, a discussion of the cardiac
monitor’s performance, along with ideas for future work will be presented. The thesis
will be summarized after the future work.
5.1 Discussion
While preliminary results suggest that the cardiac monitor will be a viable alternative
to existing clinical options, there are a number of things that the author has learned
during the design process to improve future revisions of the board. First, it has been
noted that one of the most sensitive parts of the system is the electrode connections.
In the first revision of the electrode board, the ring to which the electrode button was
soldered is too thin in its outer diameter and was only a single layer of PCB. The
ring pops off the PCB very easily (see Figure 5-1). This issue was resolved in the
second revision of the electrode board. While the electrode ring no longer pops off
the PCB, it has been noted that the electrode connection is very sensitive on both the
electrode and central boards. Care must be taken to ensure that the buttons are firmly
secured to the PCBs. The electrode used as a driven electrode appears to be most
sensitive. This electrode is responsible for maintaining the common mode voltage of
the system and rejecting 60 Hz interference. Without a good electrode connection,
77

motion artifacts and 60 Hz noise cannot be properly reduced by the analog front end.
Figure 5-1: A picture of the first revision of the electrode board. Note how the metalring has detached from the PCB.
Because the electrode boards were small compared with the size of the electrodes,
they were not fabricated on flexible PCBs. This proved to be a reasonable design
decision. The central boards, on the other hand, were fabricated on flexible PCBs
such that the boards could bend as the individual moved. However, after the PCBs
were populated with all the required circuit components, the boards were not capable
of bending much. It may be possible to implement future revisions of the board on
thin, but rigid PCBs to save on cost.
The memory on the cardiac monitor takes up a considerable amount of space on
the central board. While both serial flash and a micro SD card were used for buffering
and redundancy, it may be possible to eliminate the serial flash devices. The MSP430
used in the cardiac monitor does not have enough RAM to guarantee that all data
will be saved before a write, but an MSP430 with more RAM could allow the serial
flash to be eliminated. This new device would need to have at least 6 KB of RAM
available.
There were two primary usability issues with the device. The first issue is that
because the device does not transmit to a base station, there is no live feedback about
the ECG or accelerometer signal quality. The board has to be placed on the body,
run for a few seconds and stopped. Then the micro SD from the board is removed
and the data can be analyzed on the computer. A live feature with radio transmission
meant for debugging could help confirm that good signal quality will be achieved for
78

the test.
Another usability issue with the device is that a hex editor must be used to save
the data from the micro SD card. This requires additional proprietary software, and
is an extra step before the data can be imported via Matlab. The biggest advantage
of the micro SD card is that it can be read directly by a computer. Either software
should be developed to eliminate the hex editor as the middle man, or the data should
be written to the micro SD card in a computer friendly file format, such as FAT32.
Implementing FAT32, however, would require additional power, as additional micro
SD reads and writes would need to be made each time data was written to a file.
Implementing software to import the data directly into Matlab would be the lowest
power solution, with minimal overhead.
5.2 Future Work
While basic proof of concept functionality with the cardiac monitor has been shown,
further clinical testing is necessary to properly validate the device. Additional sub-
jects will be recruited for the clinical test protocol described in Chapter 4. The clinical
test will be run with at least one more participant wearing the three electrode device,
and at least 5 wearing the two electrode board. Current analysis of the two ECG
traces from the clinical test only assesses the detection of the QRS complex. Further
analysis using these traces should also analyze information from the P and T waves.
Additionally, acceleration data should be considered to relate activity level to heart
rate.
The analog front end was saturated in some of the participants of the clinical test.
The cardiac monitor was developed to have 4 bits of variable gain. In the future, an
autocalibration routine will be implemented to use this functionality to set the gain
for an individual. This autocalibration routine will be run when the device starts. It
will check to see if the signal is above a defined threshold, and if necessary, decrease
the gain. The routine should be optimized to always fill the ADC as much as possible
while preventing saturation of the amplifier.
79
The form factor of the cardiac monitor has proven to be comfortable to wear,
primarily limited by the use of the wet electrodes. Future work should investigate
the use of more comfortable electrodes, such as dry electrodes. Future work should
also evaluate the possibility of implementing a flexible PCB connector between the
central and electrode boards. Additionally, a molded cover for the PCBs could help
increase patient acceptance.
5.3 Summary
Cardiovascular disease is the leading cause of death in the United States and will
become even more of an issue as the population of the United States ages. Wearable
cardiac monitors can inform physicians about heart health trends. They provide the
physician with additional information over a standard clinical examination. In this
thesis, a wearable long term electrocardiogram (ECG) monitor was developed. This
monitor can be worn by patients recovering from cardiac events to give a physician
a better understanding of their baseline physiology, and by those at risk for cardio-
vascular disease. It can also be worn by those suspected of having an arrhythmia,
particularly one that occurs infrequently. Previous work in wearable long term mon-
itoring relied on use of a base station to transmit data (either continuous ECG or
processed data). The implementation of the cardiac monitor in this thesis is able
to record data for over one week without use of a base station. Preliminary clini-
cal results from this device suggest that it is a viable alternative to existing clinical
options.
80

Appendix A
Micro SD Code
In this Chapter, code for interfacing with the micro SD card is provided. For other
code, contact maggied at mit.edu.
A.1 Micro SD Card Header File
/*−−−−−−−−−−−−−−−−−−−−−−−−−−−−−−−−−−−−−−−−−−−−−−−−−−−−−−−−
/ Low l e v e l d i s k i n t e r f a c e modlue inc l ude f i l e
/−−−−−−−−−−−−−−−−−−−−−−−−−−−−−−−−−−−−−−−−−−−−−−−−−−−−−−−−−*/
#ifndef DISKIO
#define READONLY 0 /* 1 : Remove wr i t e f unc t i on s */
#define USE IOCTL 1 /* 1 : Use d i s k i o c t l f u cn t i on */
#include ” i n t e g e r . h”
/* Sta tus o f Disk Functions */
typedef BYTE DSTATUS;
/* Resu l t s o f Disk Functions */
typedef enum
RES OK = 0 , /* 0 : Suc c e s s f u l */
81

RES ERROR, /* 1 : R/W Error */
RES WRPRT, /* 2 : Write Protec ted */
RES NOTRDY, /* 3 : Not Ready */
RES PARERR /* 4 : I n v a l i d Parameter */
DRESULT;
/*−−−−−−−−−−−−−−−−−−−−−−−−−−−−−−−−−−−−−−−*/
/* Proto types f o r d i s k c on t r o l f unc t i on s */
int a s s i g n d r i v e s ( int , int ) ;
DSTATUS d i s k i n i t i a l i z e (BYTE) ;
DSTATUS d i s k s t a t u s (BYTE) ;
DRESULT d i s k r e a d (BYTE, BYTE* , DWORD, BYTE) ;
#i f READONLY == 0
DRESULT d i s k w r i t e (BYTE, char* , DWORD, BYTE) ;
#endif
DRESULT d i s k i o c t l (BYTE, BYTE, void *) ;
// p r i v a t e f unc t i on s
void microSDspi In i t (void ) ;
void microSDTx (char outgoing ) ;
char microSDRx (void ) ;
char microSDTxRx (char outgoing ) ;
void microSDCSLow(void ) ;
void microSDCSHigh (void ) ;
char microSDSndCmd(unsigned char cmd , unsigned long arg ) ;
/* Disk S ta tus Bi t s (DSTATUS) */
#define STA NOINIT 0x01 /* Drive not i n i t i a l i z e d */
#define STA NODISK 0x02 /* No medium in the d r i v e */
#define STA PROTECT 0x04 /* Write p ro t e c t ed */
82

/* Command code f o r d i s k i o c t r l f u cn t i on */
/* Generic command ( de f ined f o r FatFs ) */
#define CTRL SYNC 0 /* Flush d i s k cache ( f o r wr i t e f unc t i on s ) */
#define GET SECTOR COUNT 1 /* Get media s i z e ( f o r on ly f mk f s ( ) ) */
#define GET SECTOR SIZE 2 /* Get s e c t o r s i z e ( f o r mu l t i p l e s e c t o r s i z e
( MAX SS >= 1024) ) */
#define GET BLOCK SIZE 3 /* Get erase b l o c k s i z e ( f o r on ly f mk f s ( ) )
*/
#define CTRL ERASE SECTOR 4 /* Force erased a b l o c k o f s e c t o r s ( f o r on ly
USE ERASE) */
/* Generic command */
#define CTRL POWER 5 /* Get/Set power s t a t u s */
#define CTRL LOCK 6 /* Lock/Unlock media removal */
#define CTRL EJECT 7 /* Ejec t media */
/* MMC/SDC s p e c i f i c i o c t l command */
#define MMC GET TYPE 10 /* Get card type */
#define MMC GET CSD 11 /* Get CSD */
#define MMC GET CID 12 /* Get CID */
#define MMC GET OCR 13 /* Get OCR */
#define MMC GET SDSTAT 14 /* Get SD s t a t u s */
/* ATA/CF s p e c i f i c i o c t l command */
#define ATA GET REV 20 /* Get F/W re v i s i o n */
#define ATA GET MODEL 21 /* Get model name */
#define ATA GET SN 22 /* Get s e r i a l number */
/* NAND s p e c i f i c i o c t l command */
#define NANDFORMAT 30 /* Create p h y s i c a l format */
#define DISKIO
83

#endif
A.2 Micro SD .C File
#include ”msp430f247 . h” // IMPORT YOUR OWN DEVICE SPECIFIC HEADER FILE
HERE
#include ” d i s k i o . h”
#include ” f l a s h . h”
#include ” l ed . h”
/* MMC/SD command (SPI mode) */
#define CMD0 (0) /* GO IDLE STATE */
#define CMD1 (1) /* SEND OP COND */
#define CMD8 (8) /* SEND IF COND */
#define CMD9 (9) /* SEND CSD */
#define CMD10 (10) /* SEND CID */
#define CMD12 (12) /* STOP TRANSMISSION */
#define CMD13 (13) /* SD STATUS (SDC) */
#define CMD16 (16) /* SET BLOCKLEN */
#define CMD17 (17) /* READ SINGLE BLOCK */
#define CMD18 (18) /* READ MULTIPLE BLOCK */
#define CMD23 (23) /* SET BLOCK COUNT */
#define CMD24 (24) /* WRITE BLOCK */
#define CMD25 (25) /* WRITE MULTIPLE BLOCK */
#define CMD41 (41) /* SEND OP COND (ACMD) */
#define CMD55 (55) /* APPCMD */
#define CMD58 (58) /* READOCR */
#define ACMD41 (0 x80 + 41)
#define ACMD23 (0 x80+23)
/* Card type f l a g s (CardType ) */
#define CT MMC 0x01 /* MMC ver 3 */
#define CT SD1 0x02 /* SD ver 1 */
#define CT SD2 0x04 /* SD ver 2 */
#define CT SDC (CT SD1 |CT SD2) /* SD */
84

#define CT BLOCK 0x08 /* Block addres s ing */
stat ic
DSTATUS Stat = STA NOINIT ; /* Disk s t a t u s */
stat ic
BYTE CardType ; /* b0 :MMC, b1 : SDv1 , b2 : SDv2 , b3 : Block addre s s ing */
unsigned int i =0; // used during f o r loops , e t c .
unsigned char re sponse =0; // SPI response p l a c e ho l d e r
/*−−−−−−−−−−−−−−−−−−−−−−−−−−−−−−−−−−−−−−−−−−−−−−−−−−−−−−−−
Module Pr i va te Functions − DEVICE DEPENDENT! ! !
−−−−−−−−−−−−−−−−−−−−−−−−−−−−−−−−−−−−−−−−−−−−−−−−−−−−−−−−−−*/
// CS i s P4 .7
// s e t ch ip s e l e c t low
// (Be sure to con f i gu r e GPIO e l sewhere ; I i n i t i a l i z e a l l CS f o r system
in
// main)
void microSDCSLow(void )
P4OUT &= ˜BIT7 ;
// s e t ch ip s e l e c t h igh
void microSDCSHigh (void )
P4OUT |= BIT7 ;
85

// i n i t i a l i z e SPI communication wi th the micro SD
void microSDspi In i t (void )
// Begin i n i t i a l i z a t i o n process by s e t t i n g UCSWRST
UCB1CTL1 = UCSWRST;
// I n i t i a l i z e a l l r e g i s t e r s wh i l e UCSWRST = 1
// Send data on r i s i n g edge , Clock i n a c t i v e high ,
// 8 Bit data , master mode , synchronous
UCB1CTL0 = UCCKPL | UCMSB | UCMST | UCSYNC;
UCB1CTL1 |= UCSSEL1 ; // SMCLK i s source
UCB1BR0 = 3 ; // SMCLK/3 i s the c l o c k ra t e (333 kHz )
UCB1BR1 = 0 ;
// Af ter r e g i s t e r s are se t , con f i gu r e the por t s
P5DIR |= BIT3 + BIT2 ;
P5SEL |= BIT3 + BIT2 + BIT1 ; // Enable P5 .3 as c lock , P5 .2 as MI, P5 .1
as MO
// Clear UCSWRST
UCB1CTL1 &= ˜UCSWRST;
// SPI transmi t ONLY
void microSDTx (char outgoing )
// Wait f o r the TX bu f f e r to c l e a r
while ( (UC1IFG & UCB1TXIFG) == 0) ;
// Transmit data over USCI B1
UCB1TXBUF = outgoing ;
// SPI r e c e i v e ONLY
char microSDRx (void )
86

char data = 0 ;
// Receive data over USCI B1
while ( ! ( UC1IFG & UCB1RXIFG) ) ;
data = UCB1RXBUF;
return data ;
// BOTH SPI transmi t and r e c e i v e
char microSDTxRx (char outgoing )
char data = 0 ;
// Wait f o r the TX bu f f e r to c l e a r
while ( (UC1IFG & UCB1TXIFG) == 0) ;
// Transmit data over USCI B1
UCB1TXBUF = outgoing ;
// Receive data over USCI B1
while ( ! ( UC1IFG & UCB1RXIFG) ) ;
data = UCB1RXBUF;
return data ;
int waitReady (void )
int r e t r y = 0xFFFF;
BYTE response ;
r e sponse = microSDTxRx(0xFF) ;
while ( re sponse != 0xFF)
re sponse = microSDTxRx(0xFF) ;
re t ry −−;
i f ( r e t r y == 0)
87

s e t A l l ( ) ;
return 0 ;
return 1 ;
int microSDRxData (BYTE *buf f , UINT btr )
BYTE token ;
do
token = microSDTxRx(0xFF) ;
while ( token != 0xFE) ;
do
* bu f f++ = microSDTxRx(0xFF) ;
* bu f f++ = microSDTxRx(0xFF) ;
* bu f f++ = microSDTxRx(0xFF) ;
* bu f f++ = microSDTxRx(0xFF) ;
while ( btr −= 4) ;
// dummy crc
re sponse = microSDTxRx(0xFF) ;
re sponse = microSDTxRx(0xFF) ;
return 1 ;
int microSDTxData (char *buf f , BYTE token )
int wc ;
88

// se tYe l l ow () ;
i f ( ! waitReady ( ) ) return 0 ;
microSDTx ( token ) ;
i f ( token != 0xFD)
for (wc = 0 ; wc < 512 ; wc++)
microSDTx (* bu f f++) ;
// dummy crc
re sponse = microSDTxRx(0xFF) ;
re sponse = microSDTxRx(0xFF) ;
re sponse = microSDTxRx(0xFF) ;
re sponse = microSDTxRx(0xFF) ;
i f ( ( re sponse & 0x1F) != 0x05 )
setRed ( ) ;
return 1 ;
i f ( ! waitReady ( ) ) return 0 ;
// c l rYe l l ow () ;
return 1 ;
89

// Send an SD command to the dev i c e
// SHOULD BE PLATFORM INDEPENDENT
char microSDSndCmd(unsigned char cmd , unsigned long arg )
unsigned char r e t r y = 0 ;
i f ( ! waitReady ( ) ) return RES ERROR;
microSDTx (0xFF) ; // ensure i d l e f o r at l e a s t 8 c l o c k c y c l e s
// 6 by t e command
microSDTx (cmd | 0x40 ) ; // send command , f i r s t two by t e s a lways 01
microSDTx ( arg >> 24) ; // four by t e long argument
microSDTx ( arg >> 16) ;
microSDTx ( arg >> 8) ;
microSDTx ( arg ) ;
// send CRC
// CRC only needs to be co r r e c t f o r CMD8 and CMD0
i f (cmd == CMD8)
microSDTx (0 x87 ) ;
else
microSDTx (0 x95 ) ; // CMD0 CRC
microSDTx (0xFF) ; // ensure i d l e f o r at l e a s t 8 c l o c k c y c l e s
while ( ( re sponse = microSDTxRx(0xFF) ) == 0xFF) // wai t response
i f ( r e t r y++ > 0 x f e ) break ; // time out error
90

return re sponse ;
/*−−−−−−−−−−−−−−−−−−−−−−−−−−−−−−−−−−−−−−−−−−−−−−−−−−−−−−−−
Pub l i c Functions
−−−−−−−−−−−−−−−−−−−−−−−−−−−−−−−−−−−−−−−−−−−−−−−−−−−−−−−−−−*/
/*−−−−−−−−−−−−−−−−−−−−−−−−−−−−−−−−−−−−−−−−−−−−−−−−−−−−−−−−*/
/* Get Disk S ta tus */
/*−−−−−−−−−−−−−−−−−−−−−−−−−−−−−−−−−−−−−−−−−−−−−−−−−−−−−−−−*/
DSTATUS d i s k s t a t u s (
BYTE drv /* Drive number (0) */
)
Stat &= ˜STA PROTECT;
return Stat ;
/*−−−−−−−−−−−−−−−−−−−−−−−−−−−−−−−−−−−−−−−−−−−−−−−−−−−−−−−−*/
/* I n i t i a l i z e Disk Drive */
/*−−−−−−−−−−−−−−−−−−−−−−−−−−−−−−−−−−−−−−−−−−−−−−−−−−−−−−−−*/
// NOTE: de lay c y c l e s command shou ld work f o r most MSP430
// Can comment out i f t h e r e i s a t l e a s t 1 ms a f t e r s t a r t up b e f o r e
// d i s k i n i t i a l i z a t i o n
// This f unc t i on a l s o i n i t i a l i z e s SPI
DSTATUS d i s k i n i t i a l i z e (
BYTE drv /* Phys i ca l d r i v e number (0) */
)
BYTE cmd , respx [ 4 ] ;
91

microSDspi In i t ( ) ; // i n i t i a l i z e SPI
i f ( drv ) return STA NOINIT ; /* Supports on ly s i n g l e d r i v e */
d e l a y c y c l e s (1000) ; // wai t 1 ms ( assumes 1 MHz c l o c k )
/* Send 10 sp i commands wi th card not s e l e c t e d */
for ( i =0; i <10; i++)
microSDTx (0xFF) ;
CardType = 0 ;
microSDCSLow ( ) ;
i = 100 ;
do
// send r e s e t and go i d l e command
re sponse = microSDSndCmd(CMD0, 0 ) ;
while ( re sponse !=1 && i−−) ;
i f ( re sponse != 1)
microSDCSHigh ( ) ;
return re sponse ; // CMD0 f a i l s ; re turn response and check error code
microSDCSHigh ( ) ;
// Try CMD8 to determine type o f card
microSDCSLow ( ) ;
r e sponse = microSDSndCmd(CMD8, 0x1AA) ;
92

i f ( re sponse ==1)
// SD ver s i on 2
// Get re turn va l u e s o f response R7
respx [ 0 ] = microSDTxRx(0xFF) ;
respx [ 1 ] = microSDTxRx(0xFF) ;
respx [ 2 ] = microSDTxRx(0xFF) ;
respx [ 3 ] = microSDTxRx(0xFF) ;
microSDCSHigh ( ) ;
i f ( respx [ 2 ] == 1 && respx [ 3 ] ==0xAA) // card works f o r 2.7−3.6V
// Send ACMD41 with HCS b i t
// f i r s t send CMD55 then ACMD41
for ( i = 0 ; i < 1000 ; ++i )
microSDCSLow ( ) ;
r e sponse = microSDSndCmd(CMD55, 0 ) ;
microSDCSHigh ( ) ;
i f ( re sponse <= 1)
microSDCSLow ( ) ;
r e sponse = microSDSndCmd(CMD41, 1UL << 30) ;
microSDCSHigh ( ) ;
i f ( re sponse == 0)
break ;
d e l a y c y c l e s (1000) ;
93

i f ( i < 1000)
microSDCSLow ( ) ;
r e sponse = microSDSndCmd(CMD58, 0 ) ;
respx [ 0 ] = microSDTxRx(0xFF) ;
respx [ 1 ] = microSDTxRx(0xFF) ;
respx [ 2 ] = microSDTxRx(0xFF) ;
respx [ 3 ] = microSDTxRx(0xFF) ;
microSDCSHigh ( ) ;
CardType = ( respx [ 0 ] & 0x40 ) ? CT SD2 | CT BLOCK : CT SD2 ; //
SDv2
else // SDv1 or MMCv3
i = 1000 ;
microSDCSLow ( ) ;
i f (microSDSndCmd(ACMD41, 0 ) <= 1)
CardType = CT SD1 ; cmd = ACMD41; // SDv1
else
CardType = CT MMC; cmd = CMD1; // MMCv3
microSDCSHigh ( ) ;
// wai t f o r card to l e a v e i d l e s t a t e
do
94

microSDCSLow ( ) ;
r e sponse = microSDSndCmd(cmd , 0 ) ;
microSDCSHigh ( ) ;
while ( re sponse ==1 && i−−) ;
i f ( CardType )
// INSERT CHANGE TO FAST MODE HERE
UCB1CTL1 |= UCSWRST;
UCB1BR0 = 1 ; // SMCLK i s the c l o c k ra t e (1 MHz)
// Clear UCSWRST
UCB1CTL1 &= ˜UCSWRST;
Stat &= ˜STA NOINIT ;
else
Stat |= STA NOINIT ;
return Stat ;
/*−−−−−−−−−−−−−−−−−−−−−−−−−−−−−−−−−−−−−−−−−−−−−−−−−−−−−−−−*/
/* Read Sector ( s ) */
/*−−−−−−−−−−−−−−−−−−−−−−−−−−−−−−−−−−−−−−−−−−−−−−−−−−−−−−−−*/
DRESULT d i s k r e a d (
BYTE drv , /* Phys i ca l d r i v e nmuber (0) */
BYTE *buf f , /* Pointer to the data b u f f e r to s t o r e read data */
95

DWORD secto r , /* S ta r t s e c t o r number (LBA) */
BYTE count /* Sector count ( 1 . . 1 28 ) */
)
DSTATUS s ;
s = d i s k s t a t u s ( drv ) ;
i f ( s & STA NOINIT) return RES NOTRDY;
i f ( ! count ) return RES PARERR;
i f ( ! ( CardType & CT BLOCK) ) s e c t o r *= 512 ; // conver t to by t e
addres se s
microSDCSLow ( ) ;
i f ( count == 1)
i f ( ( microSDSndCmd(CMD17, s e c t o r ) == 0) && microSDRxData ( buf f , 5 1 2 ) )
count = 0 ;
else
i f (microSDSndCmd(CMD18, s e c t o r ) == 0)
do
i f ( ! microSDRxData ( buf f , 512) ) break ;
bu f f += 512 ;
while (−−count ) ;
microSDSndCmd(CMD12, 0) ;
microSDTx (0xFF) ; // ex t ra c l o c k c y c l e
microSDCSHigh ( ) ;
96

return RES OK;
/*−−−−−−−−−−−−−−−−−−−−−−−−−−−−−−−−−−−−−−−−−−−−−−−−−−−−−−−−*/
/* Write Sec tor ( s ) */
/*−−−−−−−−−−−−−−−−−−−−−−−−−−−−−−−−−−−−−−−−−−−−−−−−−−−−−−−−*/
DRESULT d i s k w r i t e (
BYTE drv , /* Phys i ca l d r i v e number (0) */
char *buf f , /* Pointer to the data to be wr i t t en */
DWORD secto r , /* S ta r t s e c t o r number (LBA) */
BYTE count /* Sector count ( 1 . . 1 28 ) */
)
DSTATUS s ;
s = d i s k s t a t u s ( drv ) ;
i f ( s & STA NOINIT) return RES NOTRDY;
i f ( s & STA PROTECT) return RES WRPRT;
i f ( ! count ) return RES PARERR;
i f ( ! ( CardType & CT BLOCK) ) s e c t o r *= 512 ; // conver t to by t e
addre s s ing
microSDCSLow ( ) ;
microSDTx (0xFF) ;
i f ( ! waitReady ( ) ) return RES ERROR;
i f ( count == 1)
i f ( ( microSDSndCmd(CMD24, s e c t o r ) == 0) && microSDTxData ( buf f , 0xFE)
)
count = 0 ;
else
setRed ( ) ;
97

else
i f ( CardType & CT SDC) microSDSndCmd(ACMD23, count ) ;
i f (microSDSndCmd(CMD25, s e c t o r ) == 0)
do
i f ( ! microSDTxData ( buf f , 0xFC) )
setRed ( ) ;
break ;
bu f f += 512 ;
while (−−count ) ;
i f ( ! microSDTxData (0 , 0xFD) )
count = 1 ;
i f ( ! waitReady ( ) ) return RES ERROR;
microSDCSHigh ( ) ;
microSDTx (0xFF) ;
return count ? RES ERROR : RES OK;
/*−−−−−−−−−−−−−−−−−−−−−−−−−−−−−−−−−−−−−−−−−−−−−−−−−−−−−−−−*/
/* Misce l l aneous Functions */
/*−−−−−−−−−−−−−−−−−−−−−−−−−−−−−−−−−−−−−−−−−−−−−−−−−−−−−−−−*/
DRESULT d i s k i o c t l (
BYTE drv , /* Phys i ca l d r i v e nmuber (0) */
BYTE c t r l , /* Contro l code */
98

void * bu f f /* Buf fer to send/ r e c e i v e con t r o l data */
)
DRESULT r e s ;
switch ( c t r l )
case CTRL SYNC : /* Make sure t ha t no pending wr i t e proces s */
r e s = RES OK;
break ;
default :
r e s = RES PARERR;
r e s = RES OK;
return r e s ;
99

100

Bibliography
[1] V. L. Roger et al. Heart Disease and Stroke Statistics – 2012 Update. A Reportfrom the American Heart Association. Circulation, 125:E2–E220, 2012.
[2] Z Syed, et al. Relation of Death Within 90 Days of Non-ST-Elevation AcuteCoronary Syndromes to Variability in Electrocardiographic Morphology. Am JCardiol, 103:307–311, 2009.
[3] Z Syed, et al. Computationally Generated Cardiac Biomarkers for Risk Strat-ification After Acute Coronary Syndrome. Science Translational Medicine, 3,2011.
[4] Roger G. Mark. Clinical Electrocardiography and Arrhythmias. 2004.
[5] MIT Course 6.522 Lecture Notes.
[6] P. G. Morton. Critical Care Nursing: A Holistic Approach, chapter 17. Lippin-cott Williams & Wilkins, 2005.
[7] P.W. Macfarlane. Comprehensive Electrocardiology, chapter 11. Springer, 2010.
[8] H. Sugano et al. Continuous ECG Data Gathering by a Wireless Vital Sensor –Evaluation of its Sensing and Transmission Capabilities. In IEEE ISSSTA, pages98–102, Taichung, Taiwan, 2010.
[9] R. Goya-Esteban et al. Heart Rate Variability on 7-Day Holter MonitoringUsing a Bootstrap Rhythmometric Procedure. IEEE Transactions on BiomedicalEngineering, 57:1366–1376, 2010.
[10] http://en.wikipedia.org/wiki/File:Holter_monitor.JPG.
[11] G. Hindricks et al. Atrial Fibrillation Detection by a Subcutaneous MonitoringDevice. In IEEE Computers in Cardiology Conference, pages 413–416, Bologna,Italy, 2008.
[12] A. Singh, J. Lui, and J. V. Guttag. Discretization of Continuous ECG BasedRisk Metrics Using Asymmetric and Warped Entropy Measures. Computers inCardiology, 37:473–476, 2010.
101
[13] J. Yoo et al. An Attachable ECG Sensor Bandage with Planar-FashionableCircuit Board. In IEEE Symposium on Wearable Computers, pages 145–146,2009.
[14] R. Harper et al. Evaluation of a CE Approved Ambulatory Patient MonitoringDevice in a General Medical Ward. In IEEE EMBC, pages 94–97, Buenos Aires,Argentina, 2010.
[15] http://www.mindray.com/na/products/netguard.html?backUrl=pro_
line1_pre.html.
[16] http://www.vpatchmedical.com/pages/vpms-components.php.
[17] http://www.eebeat.com/?p=4204.
[18] http://en.wikipedia.org/wiki/File:Op-Amp_Instrumentation_
Amplifier.svg.
[19] A. Searle and L. Kirkup. A Direct Comparison of Wet, Dry and InsulatingBioelectric Recording Electrodes. Physiological Measurements, 21:271–283, 2000.
[20] James C. Huhta and John G. Webster. 60-hz interference in electrocardiogra-phy. Biomedical Engineering, IEEE Transactions on, BME-20(2):91 –101, March1973.
[21] Bruce B. Winter and John G. Webster. Driven-right-leg circuit design. Biomed-ical Engineering, IEEE Transactions on, BME-30(1):62 –66, Jan. 1983.
[22] P.W. Macfarlane. Comprehensive Electrocardiology, chapter 12. Springer, 2010.
[23] http://www.springerimages.com/Images/Engineering/1-10.1007_
978-1-4419-6597-4_10-19.
[24] https://www.sdcard.org/downloads/pls/.
[25] http://www.hexworkshop.com/.
[26] CSI Criticare 504-US product pages. http://www.dhbiomedical.com/product%20pages/CSI-504.pdf.
[27] http://www.ambulatory-monitoring.com/inductotrace.html.
[28] http://www.finapres.com/site/page/2/9/Portapres/.
[29] http://www.physionet.org/physiotools/wag/wqrs-1.htm.
[30] G. Moody. Wave User’s Guide. http://www.physionet.org/physiotools/
wug/wug.pdf, 2011.
102